Article

Did ERA5 Improve Temperature and Precipitation Reanalysis over East Africa?

by
Stephanie Gleixner
1,*,
Teferi Demissie
2,3 and
Gulilat Tefera Diro
4
1
Potsdam Institute for Climate Impact Research (PIK), 14473 Potsdam, Germany
2
CGIAR Research Program on Climate Change, Agriculture and Food Security (CCAFS), East Africa, P.O. Box 5689, Addis Ababa 1000, Ethiopia
3
NORCE Norwegian Research Centre, Bjerknes Centre for Climate Research, P.O. Box 22, 5838 Bergen, Norway
4
Canadian Network for Regional Climate and Weather Processes, ESCER Center, University of Quebec at Montreal, 201 President-Kennedy Avenue, Montreal, QC H2X 3Y7, Canada
*
Author to whom correspondence should be addressed.
Atmosphere 2020, 11(9), 996; https://doi.org/10.3390/atmos11090996
Submission received: 5 August 2020 / Revised: 5 September 2020 / Accepted: 14 September 2020 / Published: 17 September 2020
(This article belongs to the Section Meteorology)

Abstract

:
Reanalysis products are often taken as an alternative solution to observational weather and climate data due to availability and accessibility problems, particularly in data-sparse regions such as Africa. Proper evaluation of their strengths and weaknesses, however, should not be overlooked. The aim of this study was to evaluate the performance of ERA5 reanalysis and to document the progress made compared to ERA-interim for the fields of near-surface temperature and precipitation over Africa. Results show that in ERA5 the climatological biases in temperature and precipitation are clearly reduced and the representation of inter-annual variability is improved over most of Africa. However, both reanalysis products performed less well in terms of capturing the observed long-term trends, despite a slightly better performance of ERA5 over ERA-interim. Further regional analysis over East Africa shows that the representation of the annual cycle of precipitation is substantially improved in ERA5 by reducing the wet bias during the rainy season. The spatial distribution of precipitation during extreme years is also better represented in ERA5. While ERA5 has improved much in comparison to its predecessor, there is still demand for improved products with even higher resolution and accuracy to satisfy impact-based studies, such as in agriculture and water resources.

1. Introduction

According to the fifth Intergovernmental Panel on Climate Change (IPCC) report, Africa is one of the most vulnerable continents due to its high exposure to climate risks as well at its low adaptive capacity [1]. In particular East Africa, where the majority of the countries are highly dependent on rain-fed agriculture and have a high level of poverty and a low level of education, is vulnerable to climate change and climate extremes [2,3,4]. The region is already experiencing droughts and floods that have substantial socio-economic impacts [5] leading to serious food insecurity and resource-based conflicts. The IPCC’s fifth report indicated that future climate change will lead to an increase in climate variability and in the frequency and intensity of extreme events in the region [1]⁠. Decisions about climate and climate change are complex, costly, and have long-term implications, and it is essential that such decisions are based on the best available evidence [5]⁠. In this regard, reliable climate information is the basis for developing a climate-resilient system and intervention mechanisms to minimize the vulnerability of the region to various climatic risks.
Reliable and decision-relevant climate data at a national and local level are needed on all weather and climate time scales. For instance, the assessment of climate-related baseline risks, early warning systems, and science-informed adaptation and mitigation planning to climate change in Africa all depend on available data [6]⁠. Such climate data have to fulfill various requirements. Statistical forecast models and early warning systems need near-real time data as model input. For assessing long-term climatic changes and trends, identifying the seasonality of climate or crop cycles, assessing historical impacts, and providing a reference against which to compare current and anticipated climate conditions, data with a long record are necessary. In order to use climate models for future projections, the model simulations of the historical climate have to be assessed and validated against reliable observational data with a good spatial coverage to understand the skill and uncertainty of the models. For any investigation of extreme events, climate data with a high temporal resolution are needed. The overall demand for any application of climate data is that the data have high-spatial resolution and accuracy. In summary, there is a demand for very accurate climate data with high spatial and temporal resolution published in near-real time and covering several decades. These requirements are particularly difficult to meet in a region like the African continent, where the network of meteorological stations is sparse due to the number of weather stations as well as the uneven distribution of weather stations (not many stations in rural areas), which leads to serious gaps in observations [1,7].
In the last decade a variety of high-resolution precipitation products, which combine satellite data and in situ measurements, has become available. Data products like the Tropical Applications of Meteorology using SATellite and ground-based observations (TAMSAT) rainfall estimate [8]⁠ and the African Rainfall Climatology version 2 (ARC2) [9]⁠ have been developed specially for the African continent. However, a recent study by Dinku et al. [10]⁠ has shown that the semi-global Climate Hazards Group (CHG) InfraRed Precipitation with Stations data (CHIRPS) [11] captured the East African precipitation better.
By contrast, temperature datasets have been less in the spotlight, despite the fact that temperature plays a key role in modulating surface hydrology and the severity of droughts (see, e.g., SPEI—the Standardized Precipitation-Evapotranspiration Index). Furthermore, even recent temperature products like the Climatic Research Unit (CRU) Time-Series (TS) Version 4 (CRU TS4.02)) [12]⁠, Climatic Research Unit TEMperature, version 4 (CRUTEM4) [13], the NASA GISS Surface Temperature Analysis (GISTEMP) [14]⁠⁠, NOAA MLOST [15]⁠ or UDEL [16]⁠ are spatially and temporally coarser than the precipitation counter parts.
A convenient solution for these limitations is reanalysis data. Reanalysis products provide comprehensive and coherent climate datasets to overcome these data limitations. Reanalysis data is produced by combining forecast model estimates with observations via data assimilation, therefore providing optimized global estimates of climate data without spatial or temporal gaps. However, the accuracy of reanalysis data varies strongly between regions and variables [17,18]⁠. In regions with few observations or complex terrain, reanalysis products may suffer from large biasses [19,20,21,22] and some variables like precipitation are purely forecasted with no observational input [23,24]⁠⁠. Therefore, temperature data are generally more reliable than precipitation data [17,19]. While precipitation is the most important climate variable to directly affect humans according to the WMO [25], the sub-grid processes determining precipitation have to be parametrized and make it a difficult variable to model [26,27]⁠.
Several studies have been conducted to assess the performance of reanalysis datasets over Africa, in particular for precipitation. Generally it was found that the seasonality of precipitation is captured well in the reanalysis products [28,29,30], but temporal and spatial correlation with observations is low in many regions of East Africa [28,29,31,32]. Additionally, local biasses are present in all reanalysis datasets. For instance, NCEP/NCAR, ERA-40 and ERA-interim reanalyses all tend to overestimate precipitation in the Ethiopian highlands [21,28,29,30]⁠.
These studies evaluated the previous generation of reanalyses and payed less attention to the temperature reanalysis product. In 2019, ECMWF published the first completed version ERA5 [33]⁠, the successor of ERA-interim. It provides hourly data with a 0.25 ° spatial resolution from 1979 to near-real time and is easy to access via Copernicus’ Climate Data Store. Therefore it offers the opportunity for a wide range of applications, not only for research but also for operational use. In particular in lesser developed countries, the ease of access plays an important role when choosing suitable climate data. ERA5 underwent some substantial changes in the assimilation system in terms of the model as well as the included observation data from its predecessor ERA-interim, and first evaluation studies have shown its improvements in terms of surface energy fluxes [34], surface irradiance [35], and surface climate in North America [36,37]⁠. These results are encouraging, suggesting that also the African climate representation may have improved in ERA5 reanalysis. A comprehensive evaluation of temperature and precipitation, which are the most widely used climate variables, in terms of reproducing the temporal and spatial variability as well as the observed long-term trend is necessary to judge the reliability of the data for African climate research and operational use.
The goals of this study were to assess the climatology, the long-term trend, and the inter-annual variability across the different generations of ECMWF reanalysis datasets over Africa. Further investigation on the performance of the reanalysis during extreme wet and dry years will also be carried out on a regional scale.
The rest of the paper is arranged as follows: Section 2 describes the datasets and methods used in this study. The performance of reanalysis at the continental, regional, and country scales is discussed in Section 3. Finally, the summary and conclusions are provided in Section 4.

2. Data and Study Approach
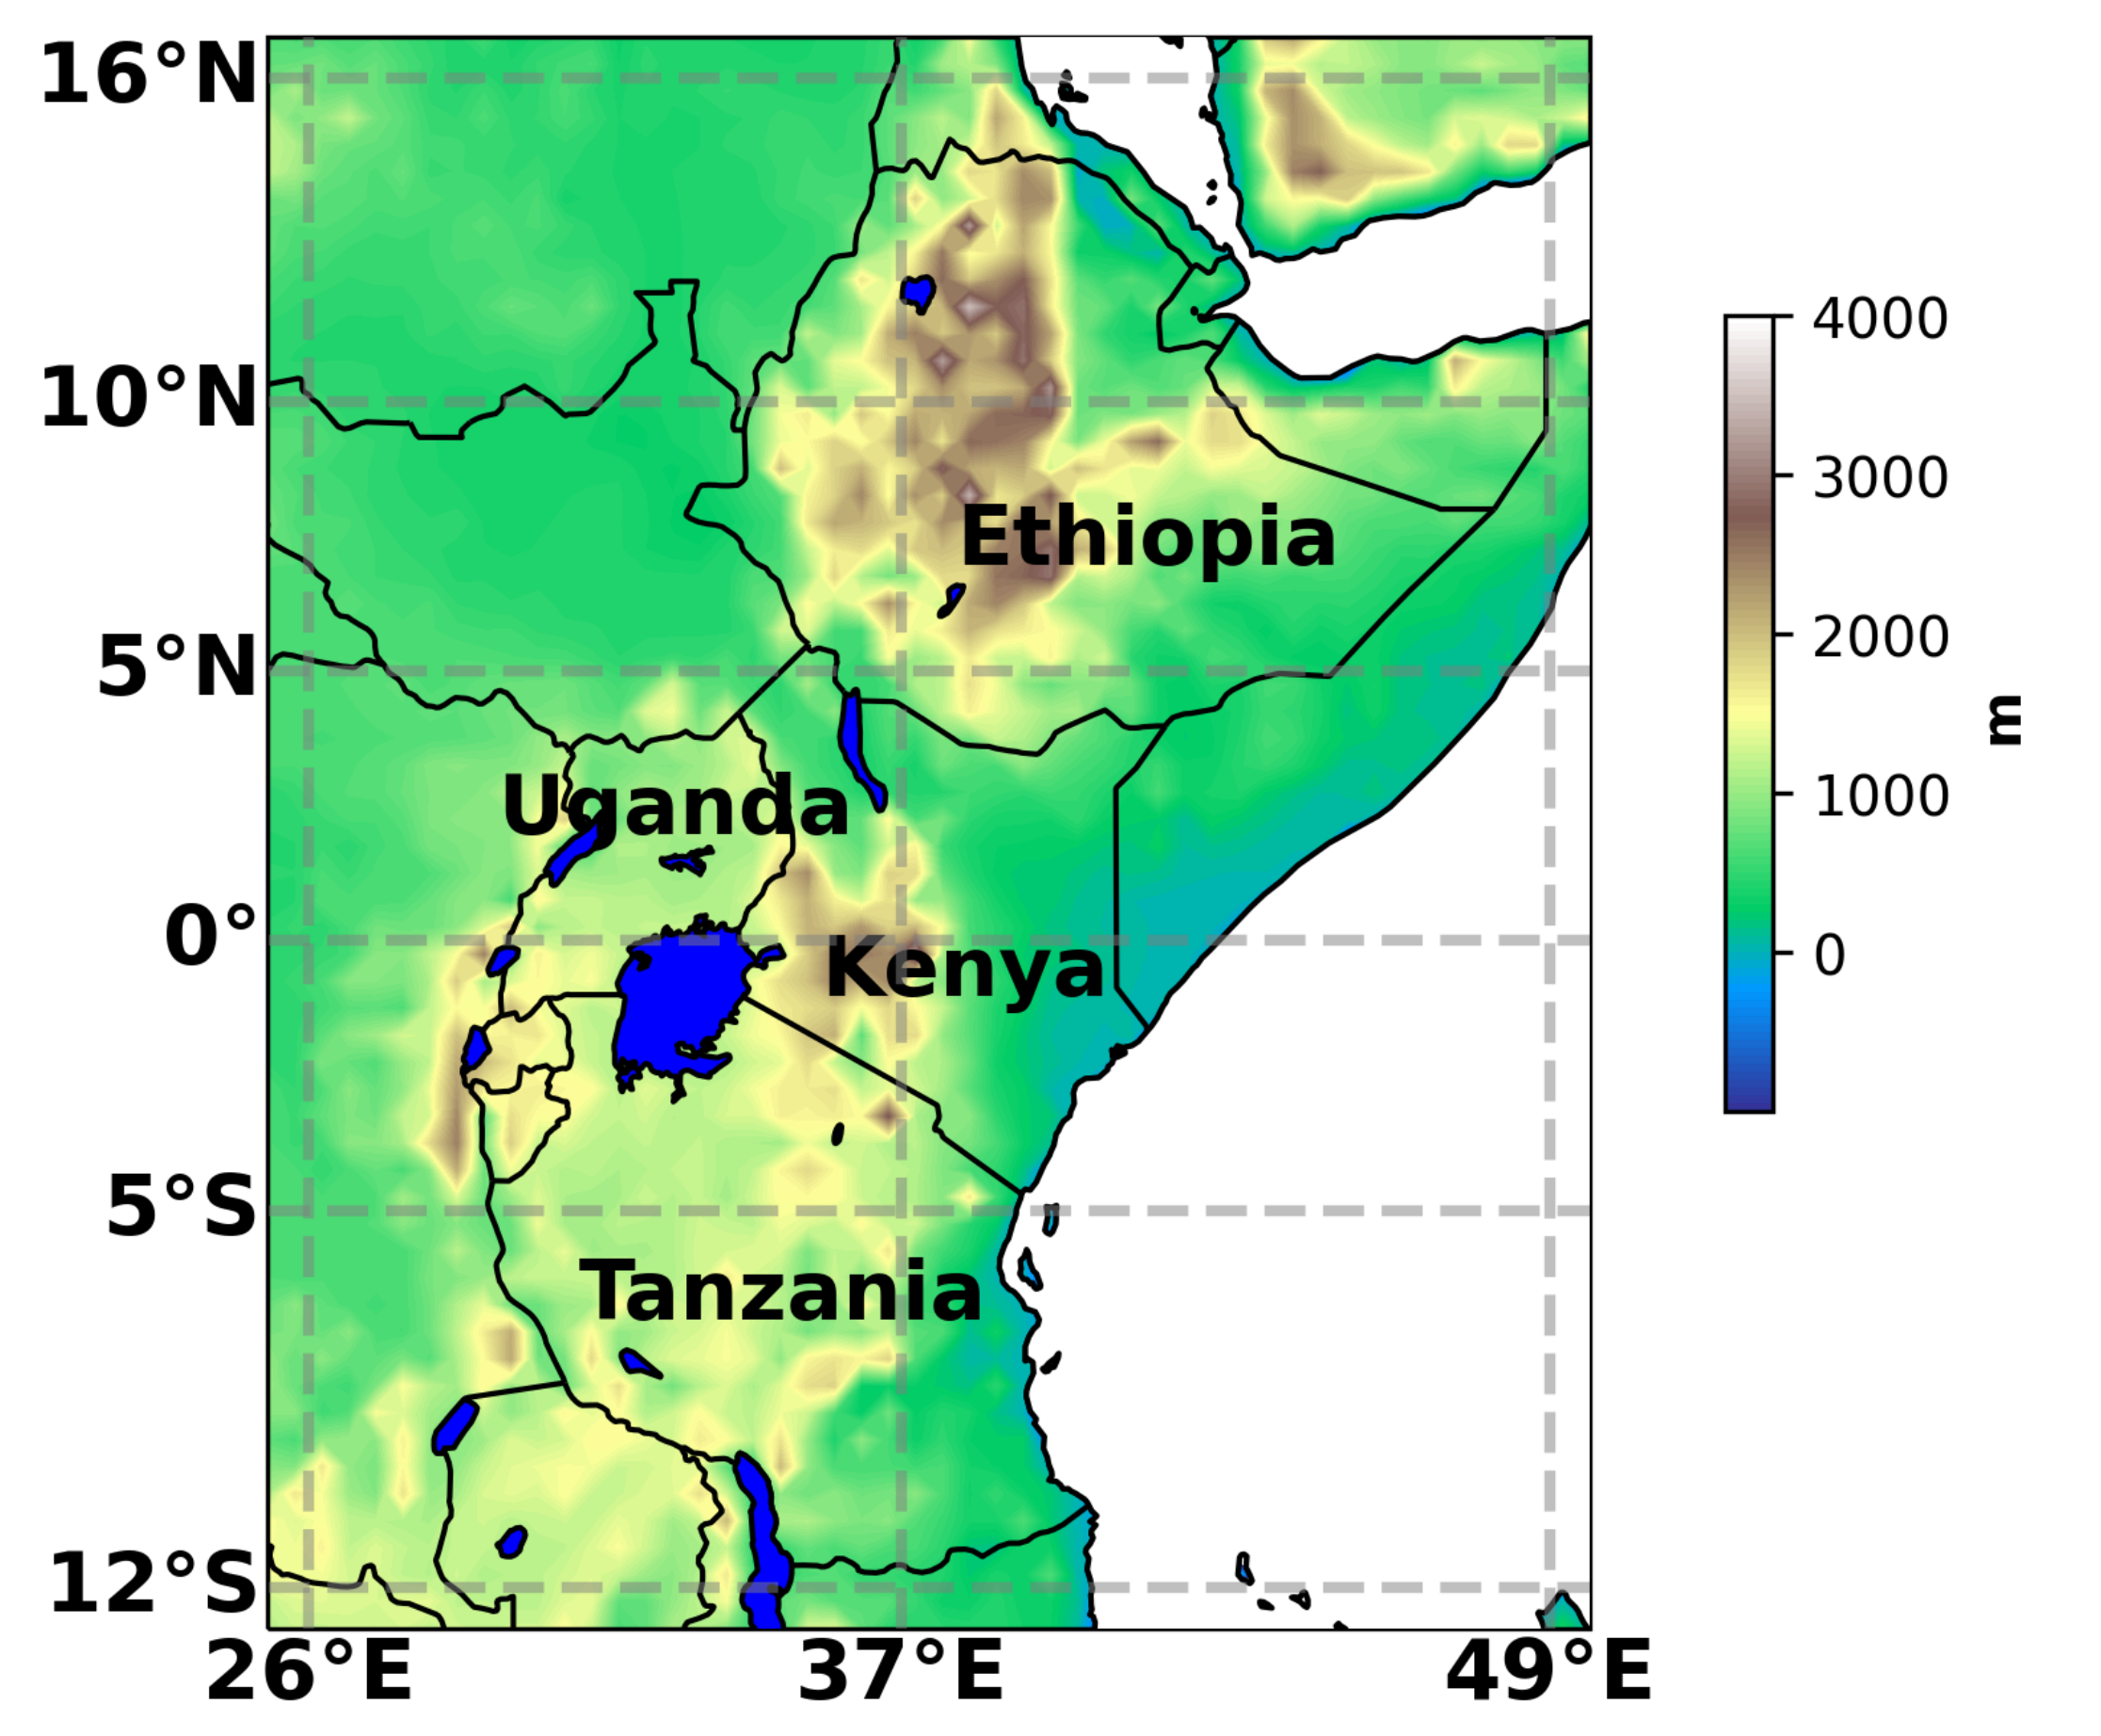
2.1. Study Region

Although the focus of our study is on East Africa, validation of the reanalysis datasets in representing the climatology, the long term trend, and their inter-annual variability was carried out for the entire African continent. This allowed us to assess the performance of the reanalysis products over East Africa in comparison to the rest of the continent. The detailed regional and local analysis was limited to the East Africa region from 25 ° E to 50 ° E and 13 ° S to 17 ° N (Figure 1).
East Africa has a complex topography from low coastal areas up to peaks of 4500 m above sea level (Figure 1). It includes a multitude of climatic regions of tropical, arid, and moderate characters, with very different temperature and precipitation conditions [38]. The northern parts of east Africa experience the “long rains” during the northern hemisphere summer season (June to September) and the “short rains” during spring (February–May). In most of Equatorial East Africa, the prevailing two rainy seasons are the “long rains” in March–May and the “short rains” in October to December. While this bimodal precipitation pattern was classically explained by the north–south migration of the Inter Tropical Convergence Zone (ITCZ), more recent studies attributed it to a complex interaction of sea surface temperature pattern and low-level winds [39,40].
The complexity of the terrain, the frequent presence of heavy cloud cover, which complicates satellite measurements of surface conditions [41], and the sparsity of in situ observations make East Africa a particularly challenging region for climate data. Observational precipitation datasets show large discrepancies [8,42,43,44]⁠ and previous reanalysis products have been found to perform poorly in East Africa with regard to rainfall [21]⁠. As the climate of East Africa is particularly challenging to capture with reanalysis data, the region provides a great opportunity to evaluate the quality improvements from ERA-interim to ERA5.
Our particular focus in this paper is the evaluation of ERA5 in the four focus countries of the CGIAR (Consultative Group on International Agricultural Research) research program CCAFS (Climate Change, Agriculture and Food Security), namely Ethiopia, Tanzania, Uganda, and Kenya. These countries are also included in the East African study region.

2.2. ERA5 and ERA-interim Reanalysis Data

The two reanalysis datasets we compare in this paper, ERA-interim and ERA5, are the two most recent reanalysis products of the European Center for Medium-Range Weather Forecasts (ECMWF), which are produced by combining a numerical weather prediction model with observational data from satellites and ground observations. ERA-interim was introduced in 2007 [45,46] and provided daily climate information until August 2019. Since 2019 it was replaced by ERA5 [33]⁠⁠, which provides hourly meteorological conditions back to 1979 and is expected to be extended back to 1950. Both versions of the ECMWF reanalysis are based on the Integrated Forecasting System (IFS) and include a four-dimensional variational analysis (4D-Var). There are several substantial differences between the two datasets, concerning the forecast model, the observational input, and the estimation of uncertainty. ERA5 is run with the version Cy41r2 of IFS, in comparison to the Cy31r2 version of ERA-interim. Therefore ERA5 data is available in higher spatial as well as temporal resolution. ERA5 data is available on a 0.25 ° grid with hourly intervals, while ERA-interim data is available on a 0.75 ° grid with 6 h intervals. Additionally, the vertical resolution increased from 60 levels in ERA-interim to 137 levels in ERA5 [33,47]⁠. The number of observational datasets that serve as input for the assimilation system was increased and a major difference is the consideration of satellite estimates of precipitation in ERA5⁠. ERA-interim did not include an estimation of the uncertainty of the data, while ERA5 includes such an estimate based on a 10-member ensemble run with 63 km resolution. While the ERA-interim product started in 1979, ERA5 is planned to cover 1950 to near-real time.

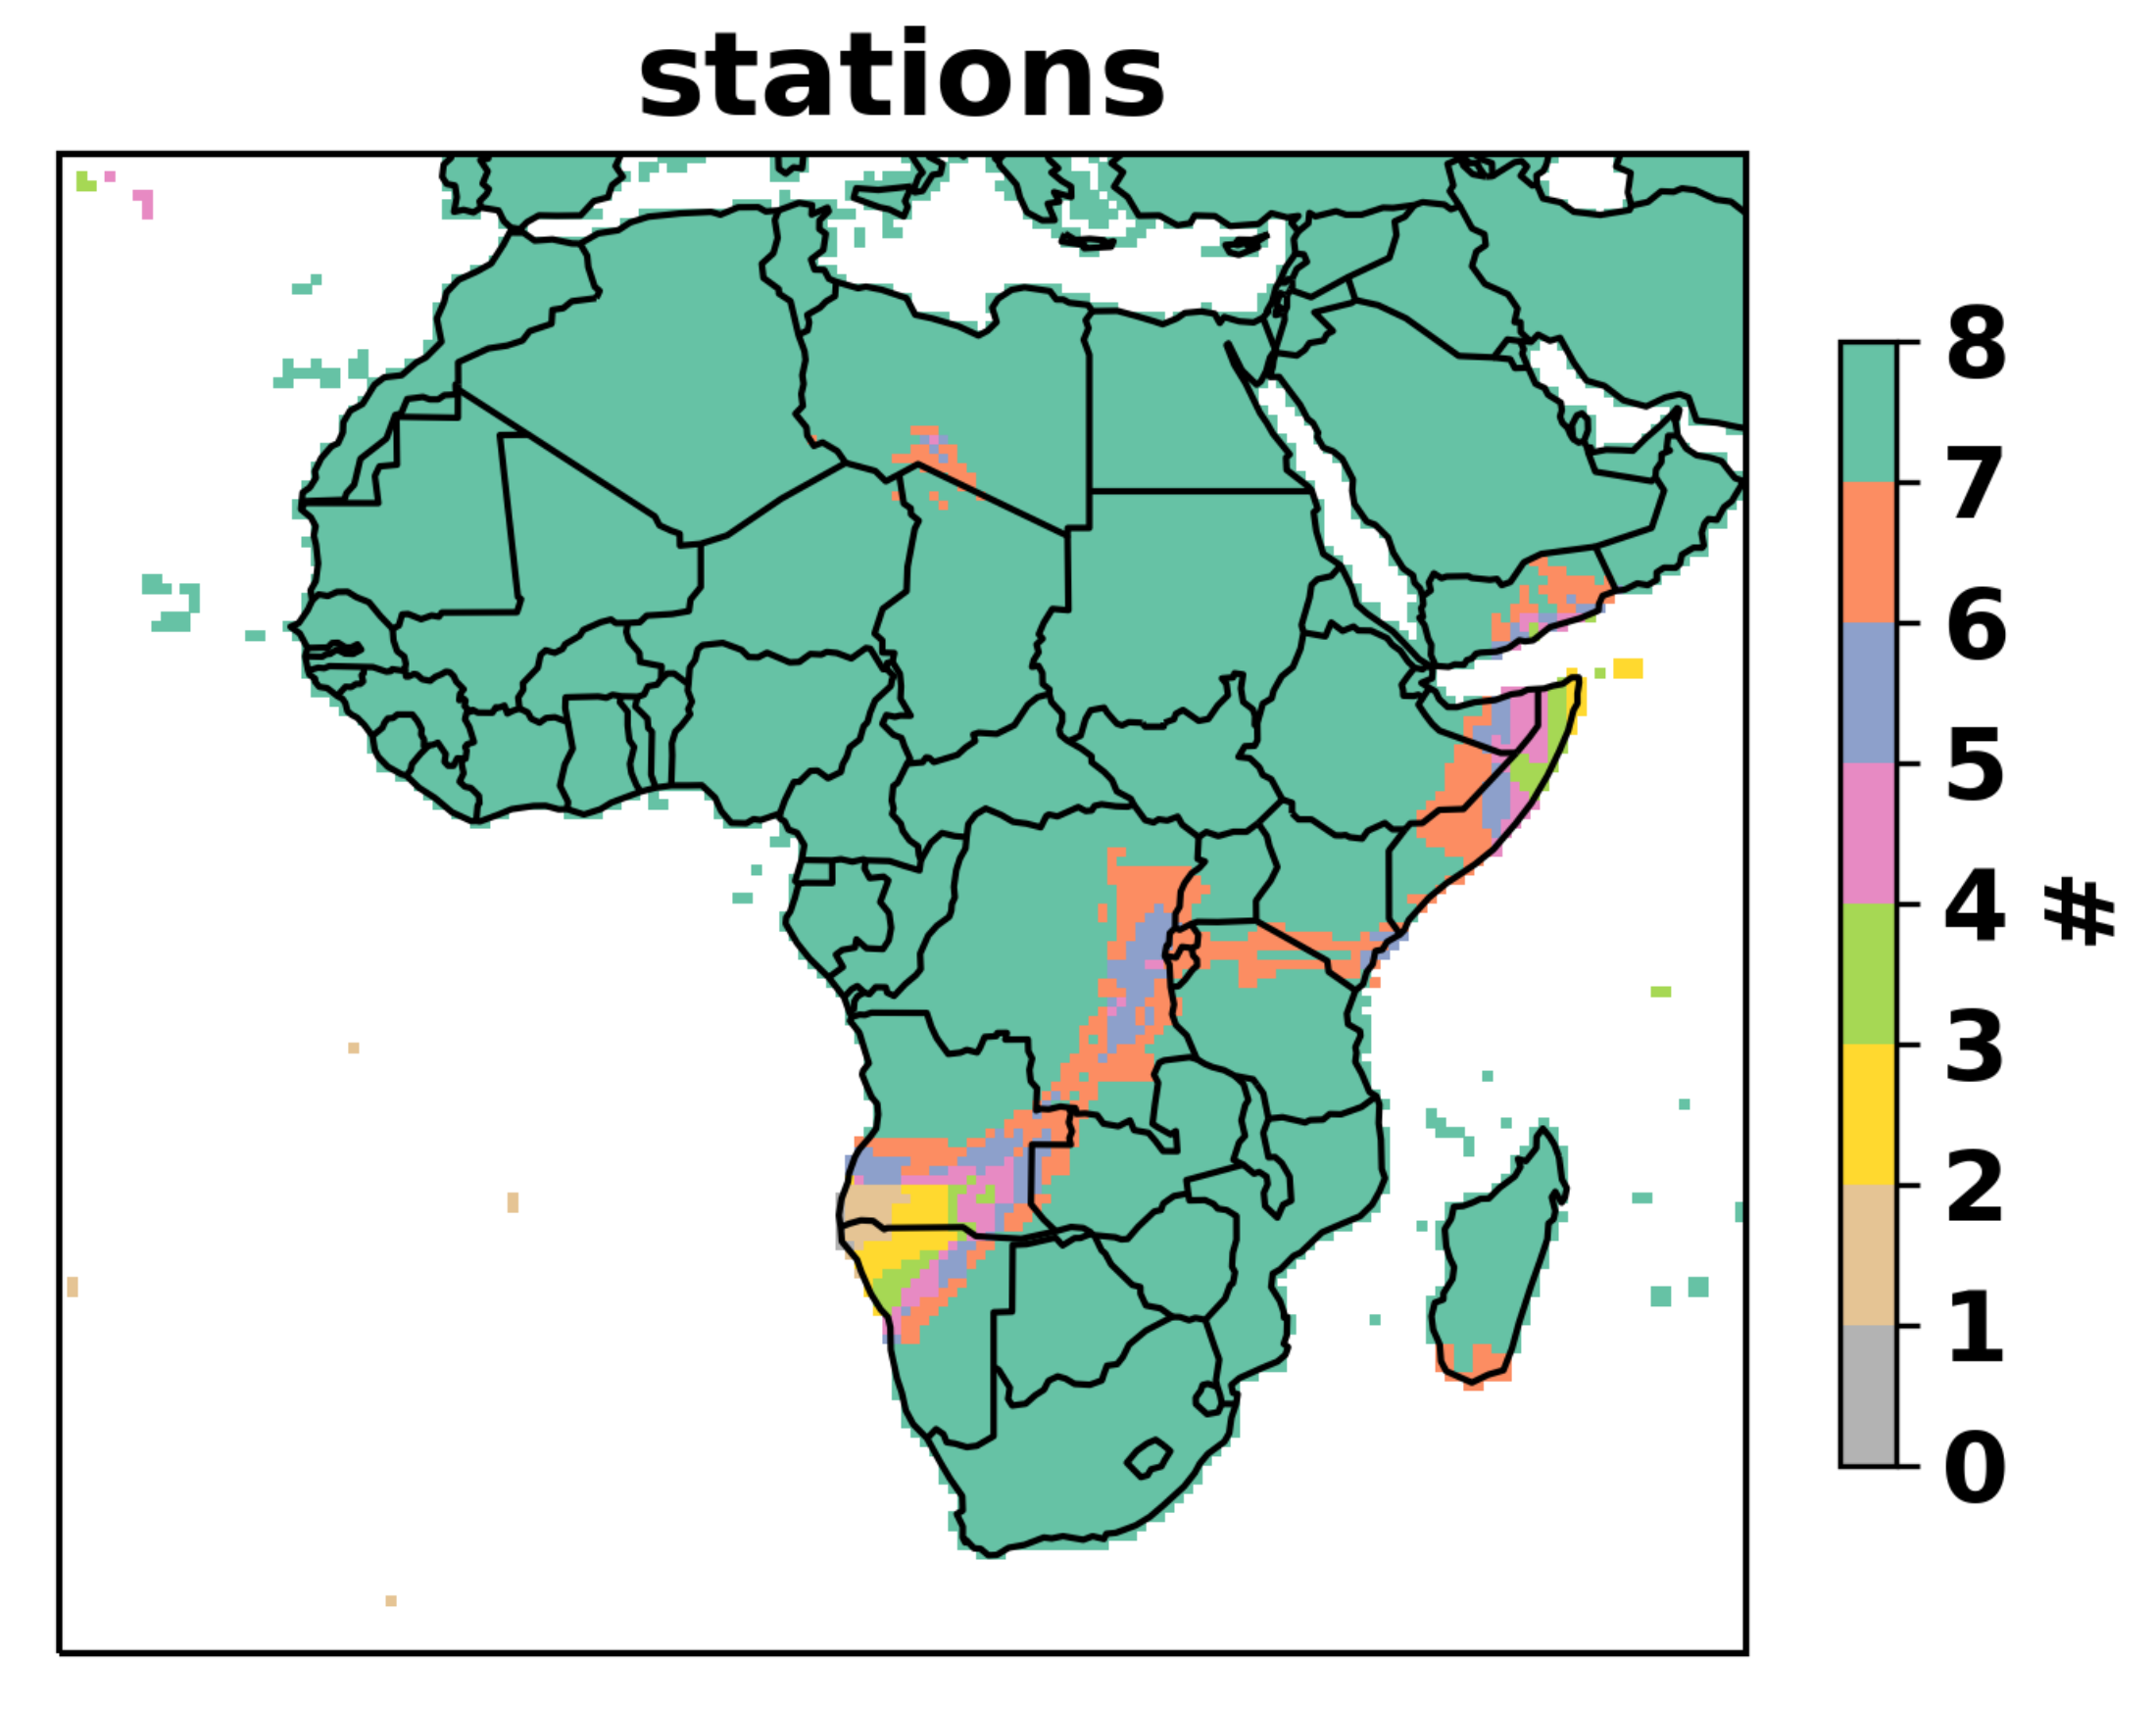
2.3. Observational Data for Evaluation

Ideally, an evaluation of a reanalysis product would be based on a comparison to in situ observations. As station data are scarce and often unevenly distributed in Africa, we relyed on gridded observational datasets as a best estimate of the truth.
For near-surface temperature observations we used the high-resolution data Climatic Research Unit (CRU) Time-Series (TS) version 4.02 (CRU TS4.02) [12]. This station-based gridded dataset is produced by angular-distance weighting interpolation of station observations onto a 0.5 ° grid [7]⁠. The dataset is available from 1901 to 2017 on a monthly time scale. CRU temperature is widely used and have also been applied for correcting reanalysis data in order to apply them to impact modeling [48]. We regridded the data onto the 0.75 ° ERA-interim grid. As CRU is a purely station-based dataset, the reliability of CRU temperature varies spatially, due to station sparsity. In Africa, the station coverage is lowest in the region of Northern Namibia/Southern Angola, but also in East Africa some regions have low station density (Figure 2).
For precipitation observations we used the Climate Hazards Group InfraRed Precipitation with Stations version 2 (CHIRPS V2.0) [11]⁠. CHIRPS combines a variety of satellite products and in situ observations. The dataset is available in a 0.05 ° and a 0.25 ° spatial and a daily temporal resolution from 1981 until today. CHIRPS has been shown to perform well over Eastern Africa [10,31,49].

2.4. Methodology

For this study, we used average near-surface (2 meter) temperature data and total precipitation from 1981 to 2017. In order to compare the datasets of different spatial resolutions, we conducted this study on the coarsest spatial resolution, which is ERA-interim with 0.75 ° , by regridding all data onto the ERA-interim grid using first-order conservative remapping.
Similarly, for comparison purposes, both reanalysis products and validation datasets were aggregated to the monthly time scale, as CRU temperature is only available as monthly means. Correlations were calculated based on monthly means for both temperature and precipitation. The trends were calculated based on annual mean (temperature) and annual sums (precipitation) and the East African precipitation cycle was also based on monthly means. The country level analysis was also based on the absolute monthly means, not removing any variability modes such as trends or the annual cycle, as we are interested in the performance of the data including all variability. This option was chosen with regard to the application of reanalysis data for impact studies, where absolute values are needed.
Significance was tested using the scipy python suite. In particular, we applied a t-test for the means of two independent samples to the annual means/sums to test the significance of the bias, while the significance of the correlations as well as the trends was based on a Wald test with t-distribution.

3. Results and Discussion

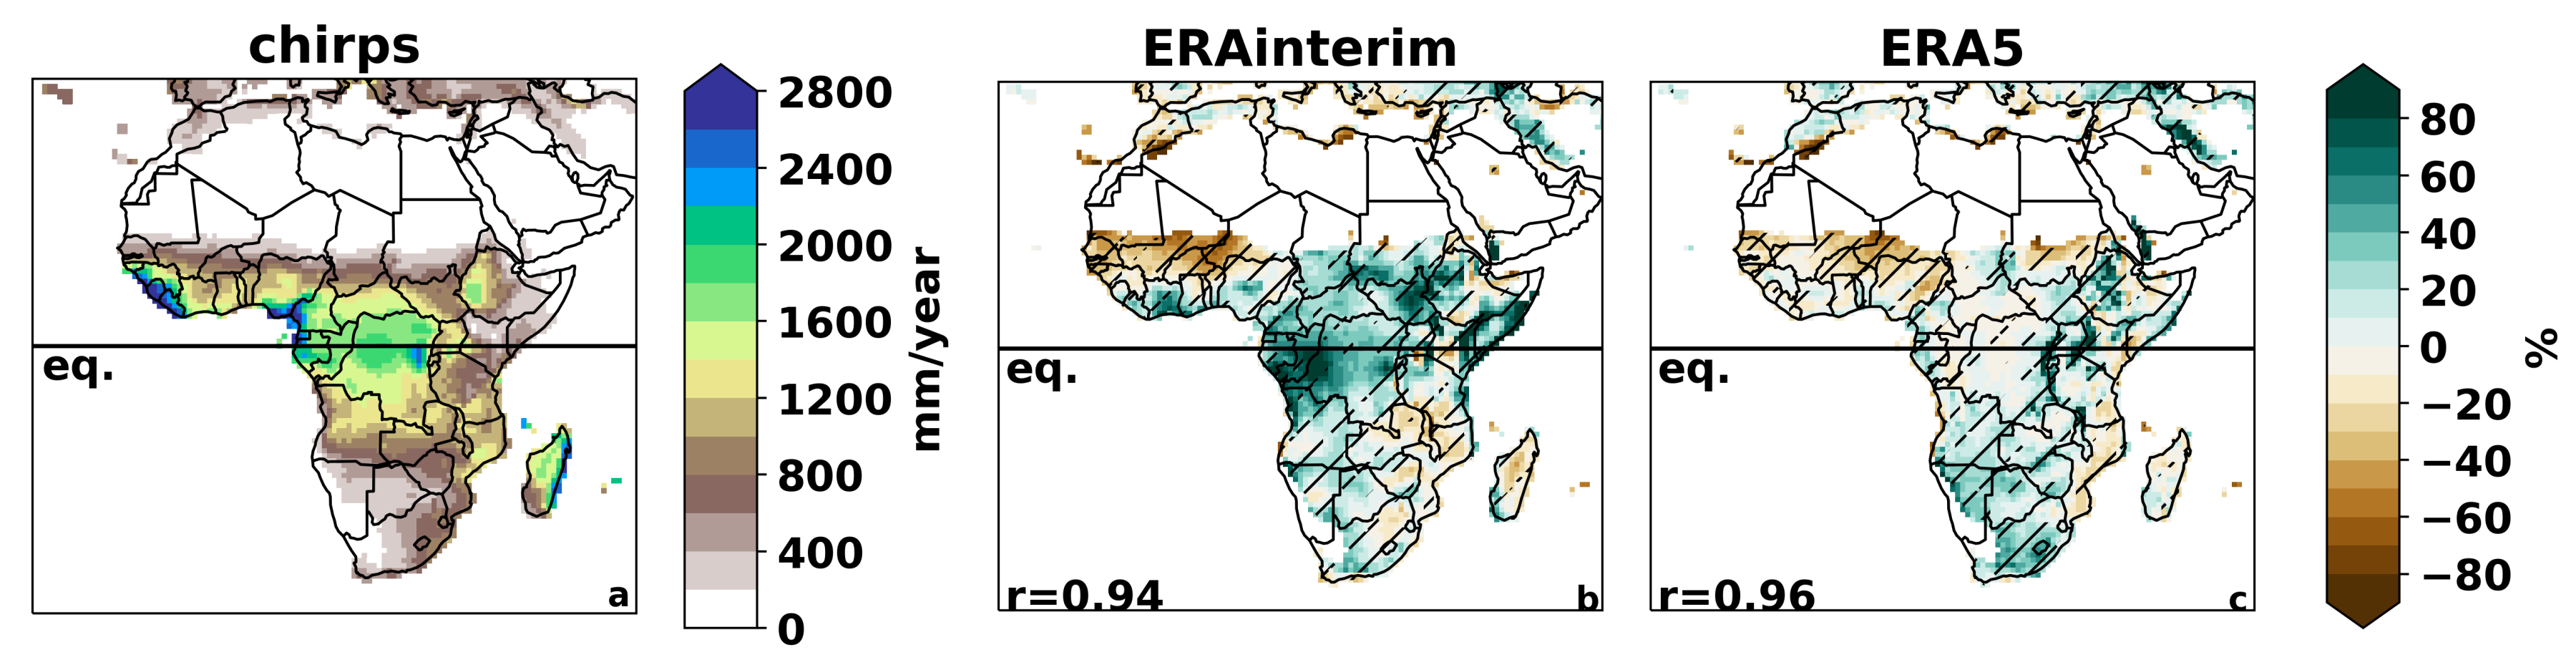
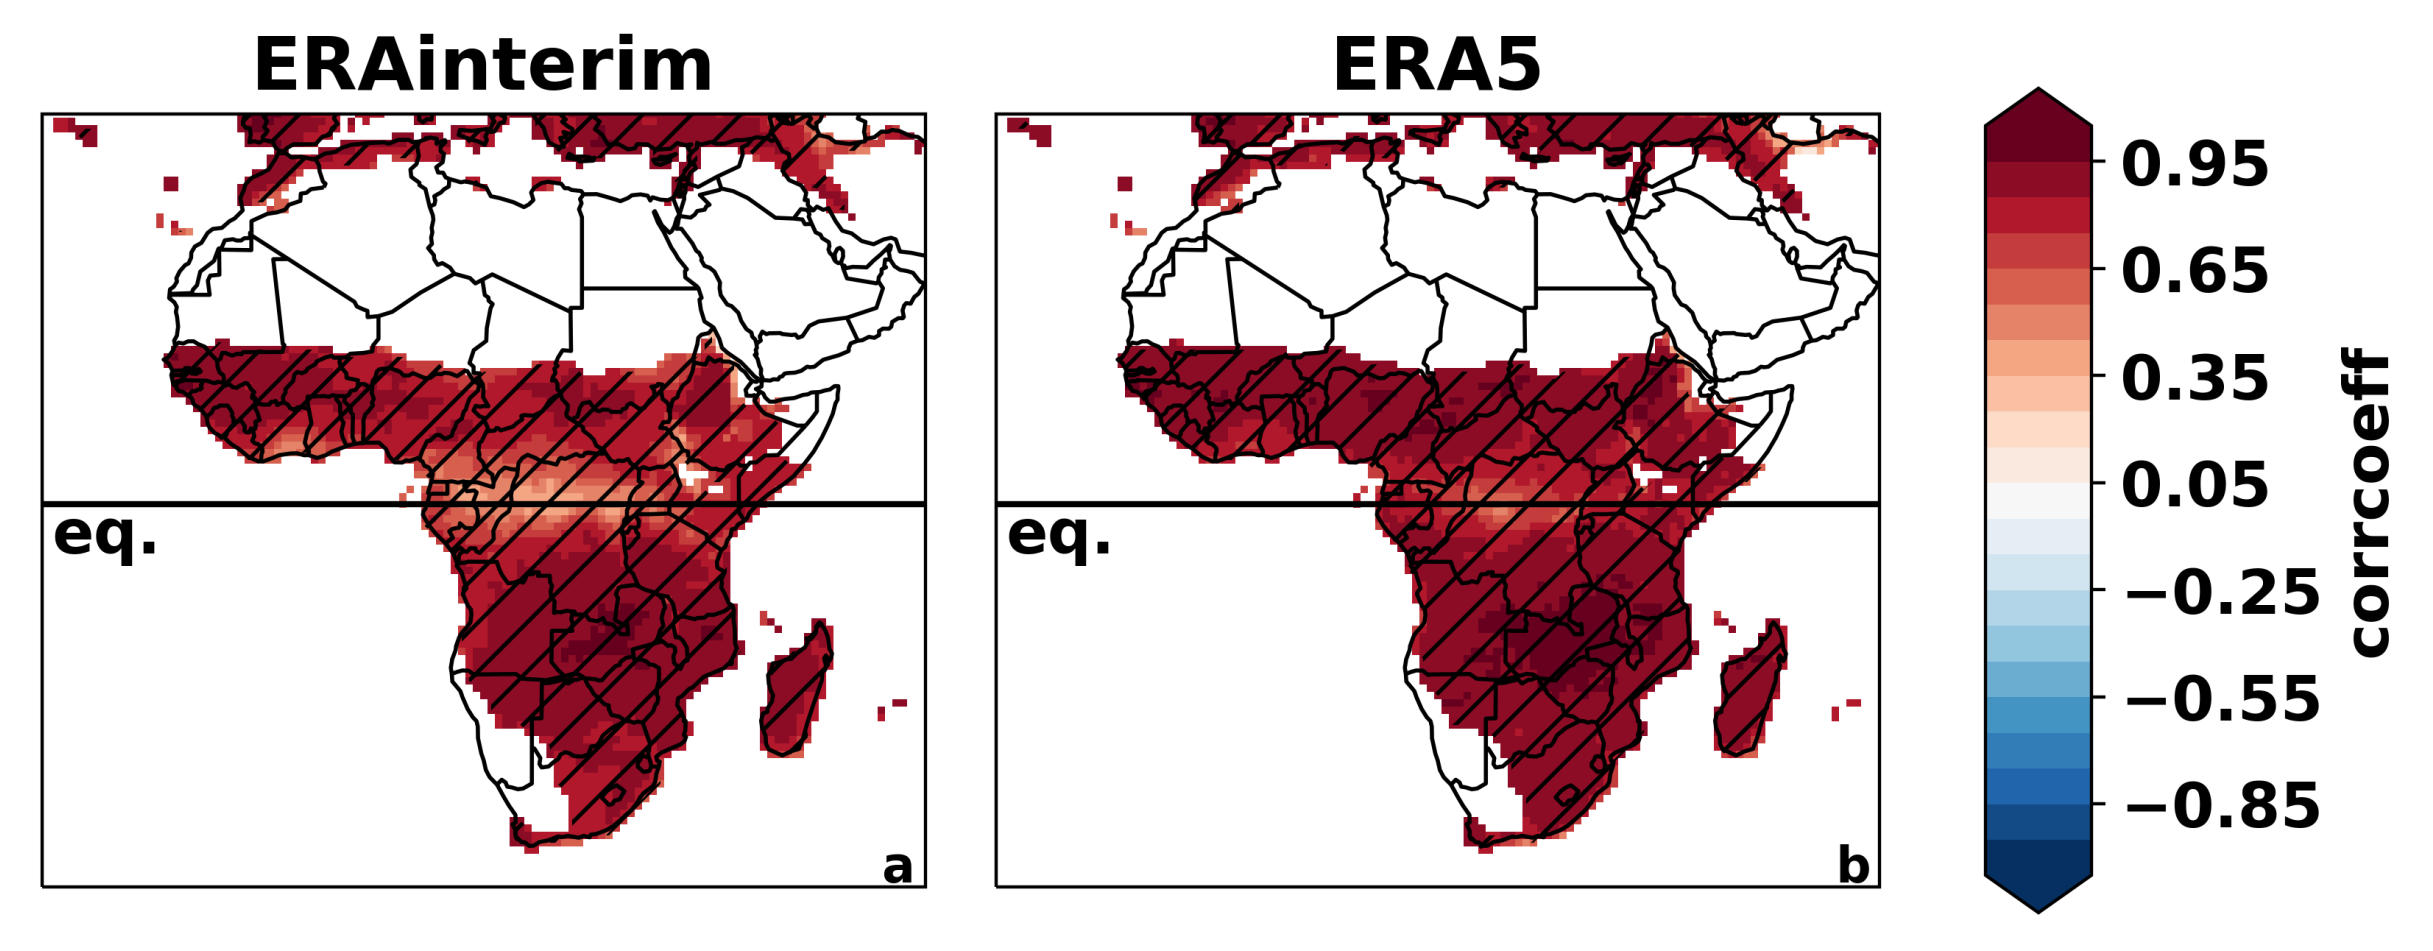
3.1. All-Africa Evaluation

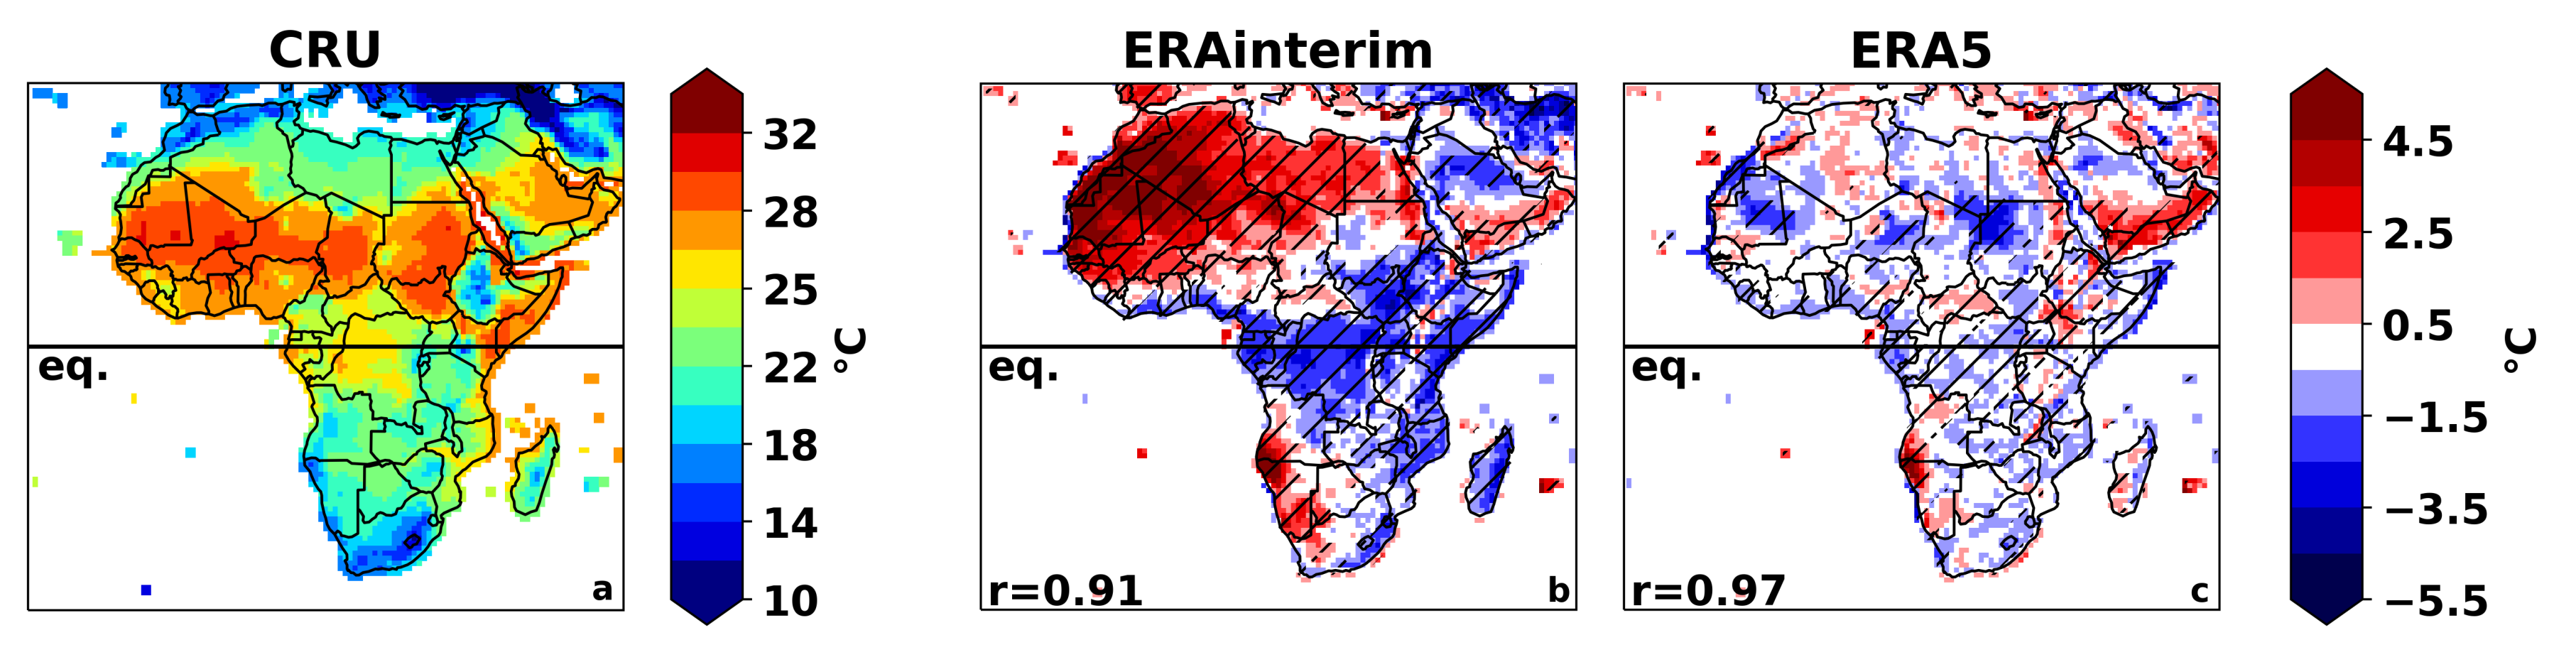
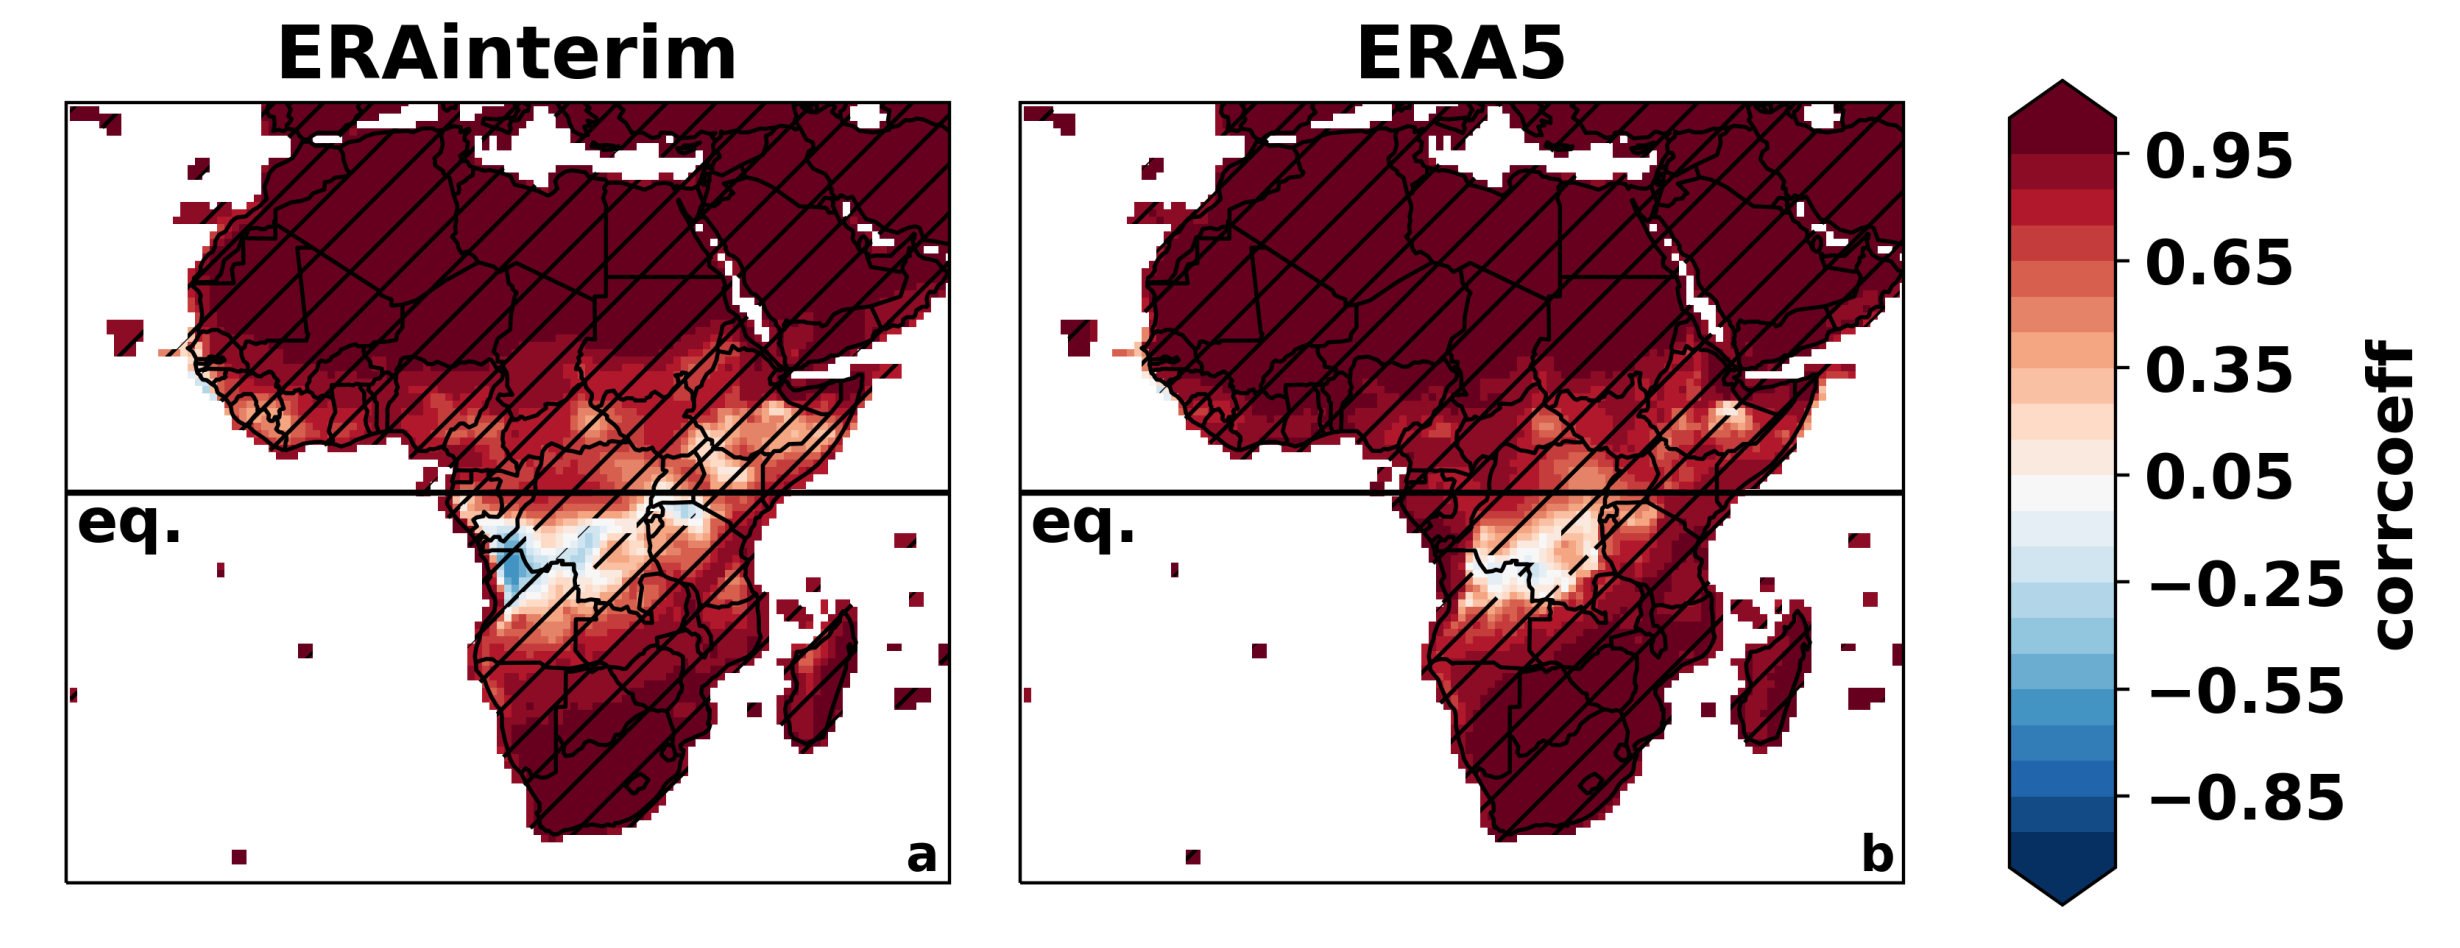
3.1.1. Spatial and Temporal Variability of Temperature and Precipitation

While the focus of our study is on East Africa, we assessed the spatial and temporal variability of temperature and precipitation in the two reanalysis datasets as well as the trends over all of Africa to allow for comparison with the rest of the continent. Figure 3 shows the spatial distribution of the near-surface temperature of CRU and the difference between the reanalyses (Era-interim and ERA5) and observations (CRU). Observations show the highest mean temperatures over the Sahara reaching up to 32 ° C. The lowest mean temperatures occur over Southern Africa and over the Ethiopian highlands. Both reanalysis datasets capture the overall temperature distribution well (not shown), which is reflected in the strong pattern correlation between the reanalysis and CRU. The pattern correlation improved from 0.91 for ERA-interim to 0.97 for ERA5 (significant at the 99% level). ERA-interim exhibits a substantial bias in near-surface temperature over large parts of the continent. The strongest bias is the distinct warm bias in Northwest Africa and the Sahara of up to 5 ° C. In addition, around the western border of Namibia and Angola there is a strong warm bias, but as this region has the minimum of CRU stations, there is some uncertainty in the observations. By contrast, there is a pronounced cold bias of up to 2 ° C in Western Equatorial Africa and along most of the East African coast. The reduction of the bias from ERA-interim to ERA5 is striking, as in most of the continent the near-surface temperature bias is less than 1.5 ° C. In particular, the strong warm bias in the Northwest is reduced to less than 1 ° C in most of the region. The cold bias in Western Equatorial Africa is even reduced to less than half a degree. Our focus region of East Africa show only weak and patchy differences between ERA5 and observations. However, some small regions still display biases of more than 1.5 ° C, such as the cold bias in the borderlands of Egypt, Sudan, Libya, and Chad and the warm bias at the coastal borderlands of Namibia and Angola.
Temporal correlation between monthly mean temperature of reanalysis with observation show a latitudinal dependence (Figure 4). While the correlation over Northern and Southern Africa is higher than 0.95 for both reanalyses, it is lower towards central Africa from both hemispheres. In the region of northwest Angola and the west of the Democratic Republic of Congo the correlation is even negative. It must be noted that this region also overlaps with the most data-sparse region over Africa [50], in which there exists a large uncertainty among observational datasets [51]. With the exception of a small region in Ethiopia, the correlation of ERA5 with observations increased from ERA-interim. In particular at the northern coast of Angola the correlation improved from negative to more than 0.8.
The mean rainfall distribution on the African continent show a very dry Sahara and Northern Africa and maximum rainfall rates around Equatorial Central Africa and over the regions of the West African monsoon (Figure 5a). We masked deserts (<250 mm of annual rainfall) in these figures, as the relative bias in these regions is disproportionally large. Both reanalysis datasets reproduce the spatial distribution of observed rainfall well (not shown) and the pattern correlation improved from 0.94 for ERA-interim to 0.96 for ERA5 (significant at the 99% level). In ERA-interim, there is a strong wet bias over central Africa and the coastal areas of East Africa of up to 60–80% (Figure 5b). This wet bias over Africa in ERA-interim was also noted in the study by Dee et al. [45], though they stated that the bias was already better than in ERA-40 due to an improved moist boundary layer scheme and better assimilation of humidity. There is a clear reduction of the wet bias in ERA5 over much of Africa (Figure 5c). For instance, the bias over central Western Africa is reduced from up to 80% in ERA-interim to less than 20% in ERA5. Similarly, the wet bias over the Somali coast is substantially reduced. These changes of biases over Africa across the three generations of ECMWF reanalyses suggest that improvements in model physics and the data assimilation procedure keep reducing the precipitation bias. Despite these reductions in the precipitation bias, ERA5 still shows substantial disagreements with observations in complex terrain, such as the Ethiopian highlands or above Lake Victoria. However, it should be noted that there is general disagreement between observational datasets in East Africa [21,52]⁠.
The temporal correlation between monthly precipitation in reanalysis and observations is generally considerably lower than that of temperature (Figure 6). However, in East Africa precipitation show higher values than temperature. ERA-interim shows the highest correlation in the southern hemisphere with values beyond 0.95. Also in sub-Saharan Africa, correlation reaches values beyond 0.85. A local minimum of correlation is found directly at the equator. In most regions of Africa correlation did increase from ERA-interim to ERA5.

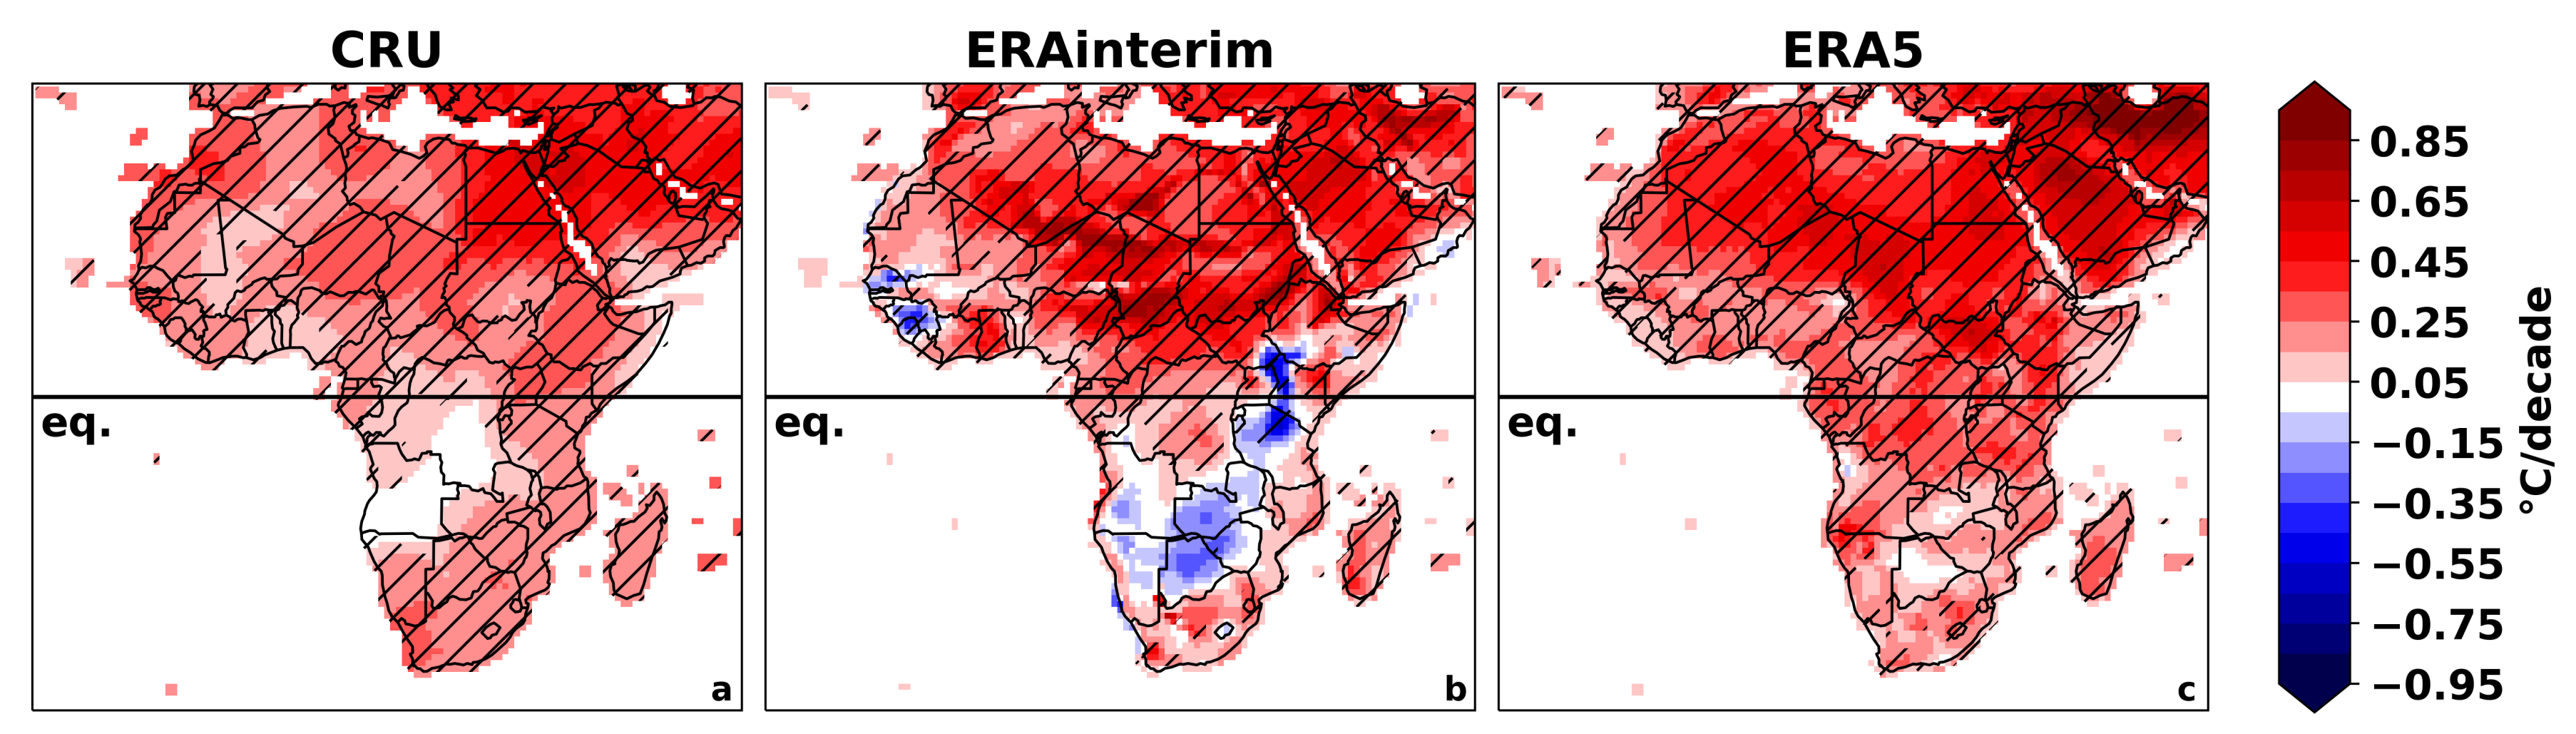
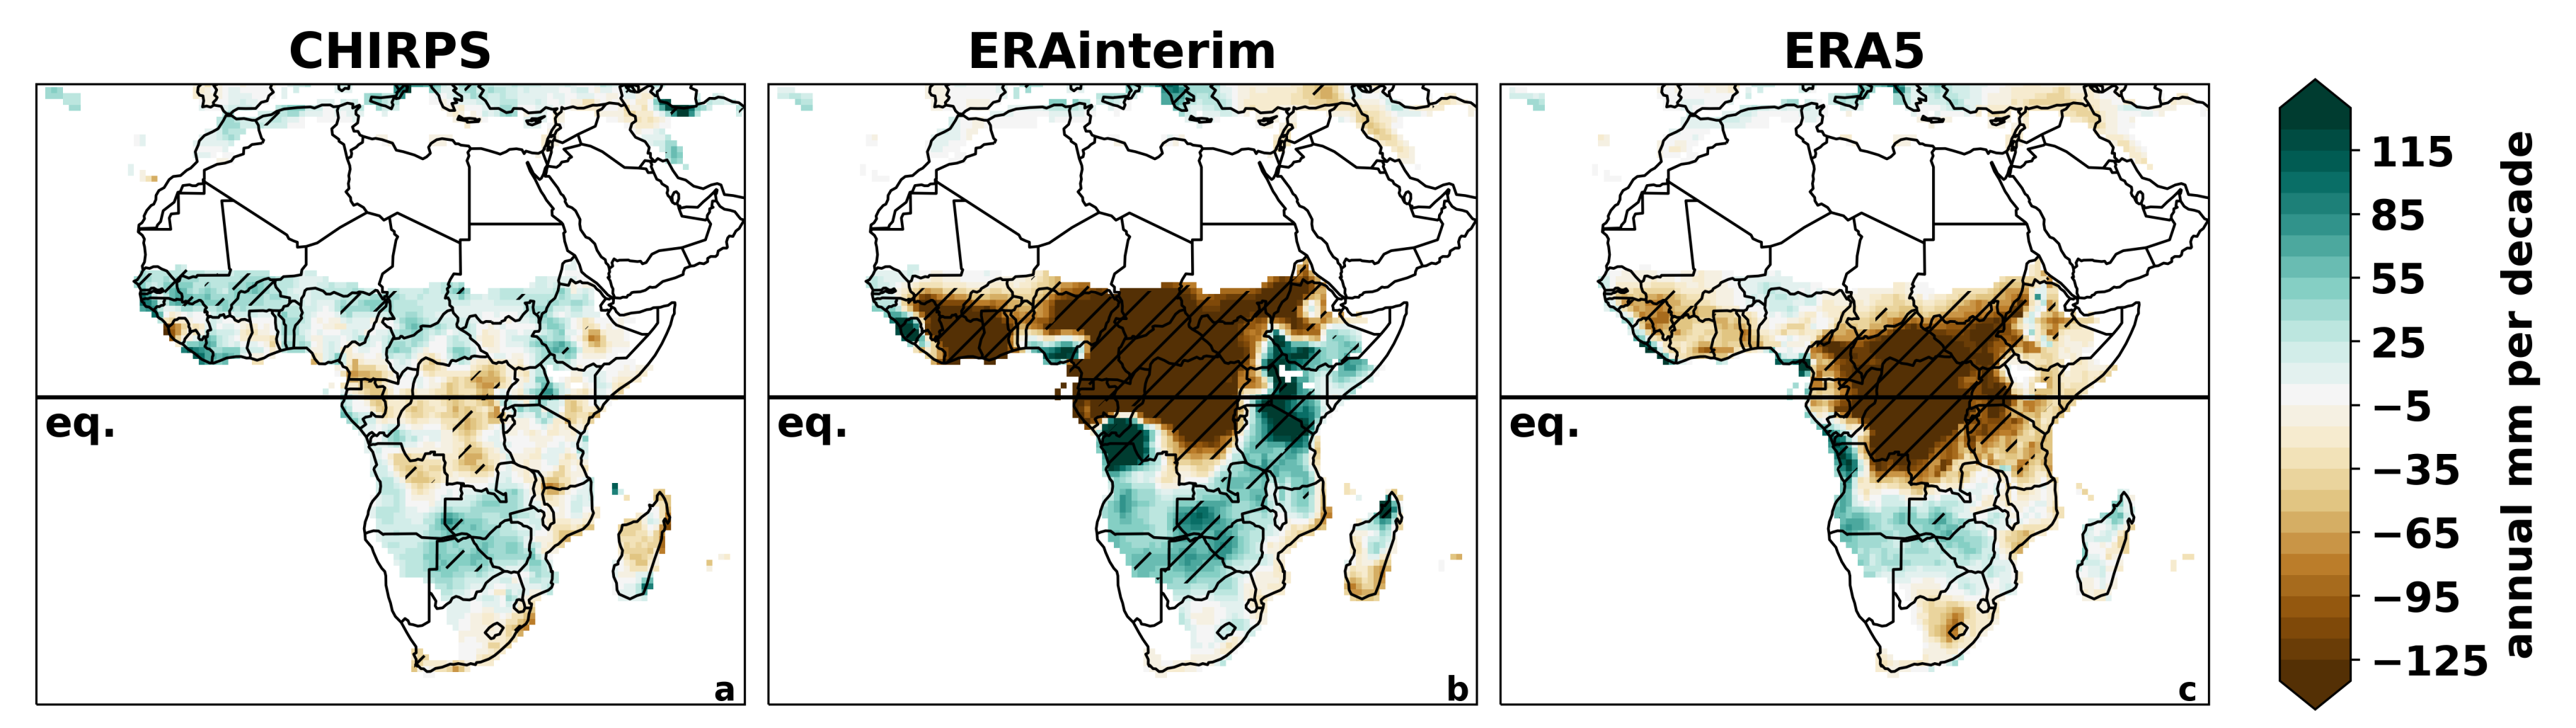
3.1.2. Linear Trends

Figure 7 shows the spatial pattern of the annual mean near surface temperature trend according to the CRU, ERA-interim, and ERA-5 reanalyses datasets. While all three datasets agree on the positive temperature trend over Northern Africa, ERA-interim displays a negative trend over Equatorial East Africa, along the coast from Sierra Leone to Senegal and in much of Botswana, Zambia, and Zimbabwe. This negative trend of ERA-interim is consistent with the result of Simmons et al. [53]⁠, who found a decrease in temperature when comparing the 1998–2008 period to the 1989–1998 period in ERA-interim. As will be seen later in this section, these regions of negative temperature trends are closely linked to positive precipitation trends, suggesting that an increase in cloud cover in ERA-interim results in the cooling of the surface. Figure 7 also indicates that in most of Northern Africa the positive temperature trend of ERA-interim is stronger than in CRU, whereas the temperature trend of ERA5 is much closer to CRU. In ERA5, the positive temperature trend in Northern Africa is reduced from ERA-interim, and there are no regions with a negative temperature trend. In particular, over East Africa, the slope of the trend is much closer to observations in ERA5 compared to ERA-interim. Nevertheless, overall the warming trend is stronger in ERA5 than in CRU.
The trends of annual precipitation show even larger differences (Figure 8). While CHIRPS shows an increase in rainfall in much of sub-Saharan Africa, while both reanalysis products display a very strong drying trend in that region. This negative precipitation trend in reanalysis datasets is consistent with the study of Lin et al. [54]⁠, who highlighted that the negative trend is a common feature in other reanalysis datasets as well. In Equatorial Africa, observations tend to a drying trend, which is captured but strongly overestimated by both reanalysis products, though less so in ERA5. The observed trend pattern of the southern hemisphere precipitation is captured quite well in reanalysis. In East Africa, particularly over Southastern Ethiopia, Somalia, Kenya, and Tanzania, CHIRPS shows a weak and mostly drying trend in annual sum precipitation. By contrast, ERA-interim show a strong wetting trend in this region. ERA5 captures the negative sign of the trend, even though it overestimates the magnitude of the drying trend in the region. Overall, the reduction of the differences to observations from ERA-interim to ERA5 is striking, even though the differences between CHIRPS and ERA5 are still substantial.
These results show that using reanalysis data for trend analysis is problematic, in particular for ERA-interim. While this is frequently done in research [55,56], reanalysis is generally considered unsuitable for identifying long-term trends [57,58,59]. This is because observational datasets are included in the assimilation system at various points in time [28,33,45]⁠. This can lead to jumps in the data and explain the differences between observations and reanalysis with regards to long-term trends [57].

3.2. Regional Analysis

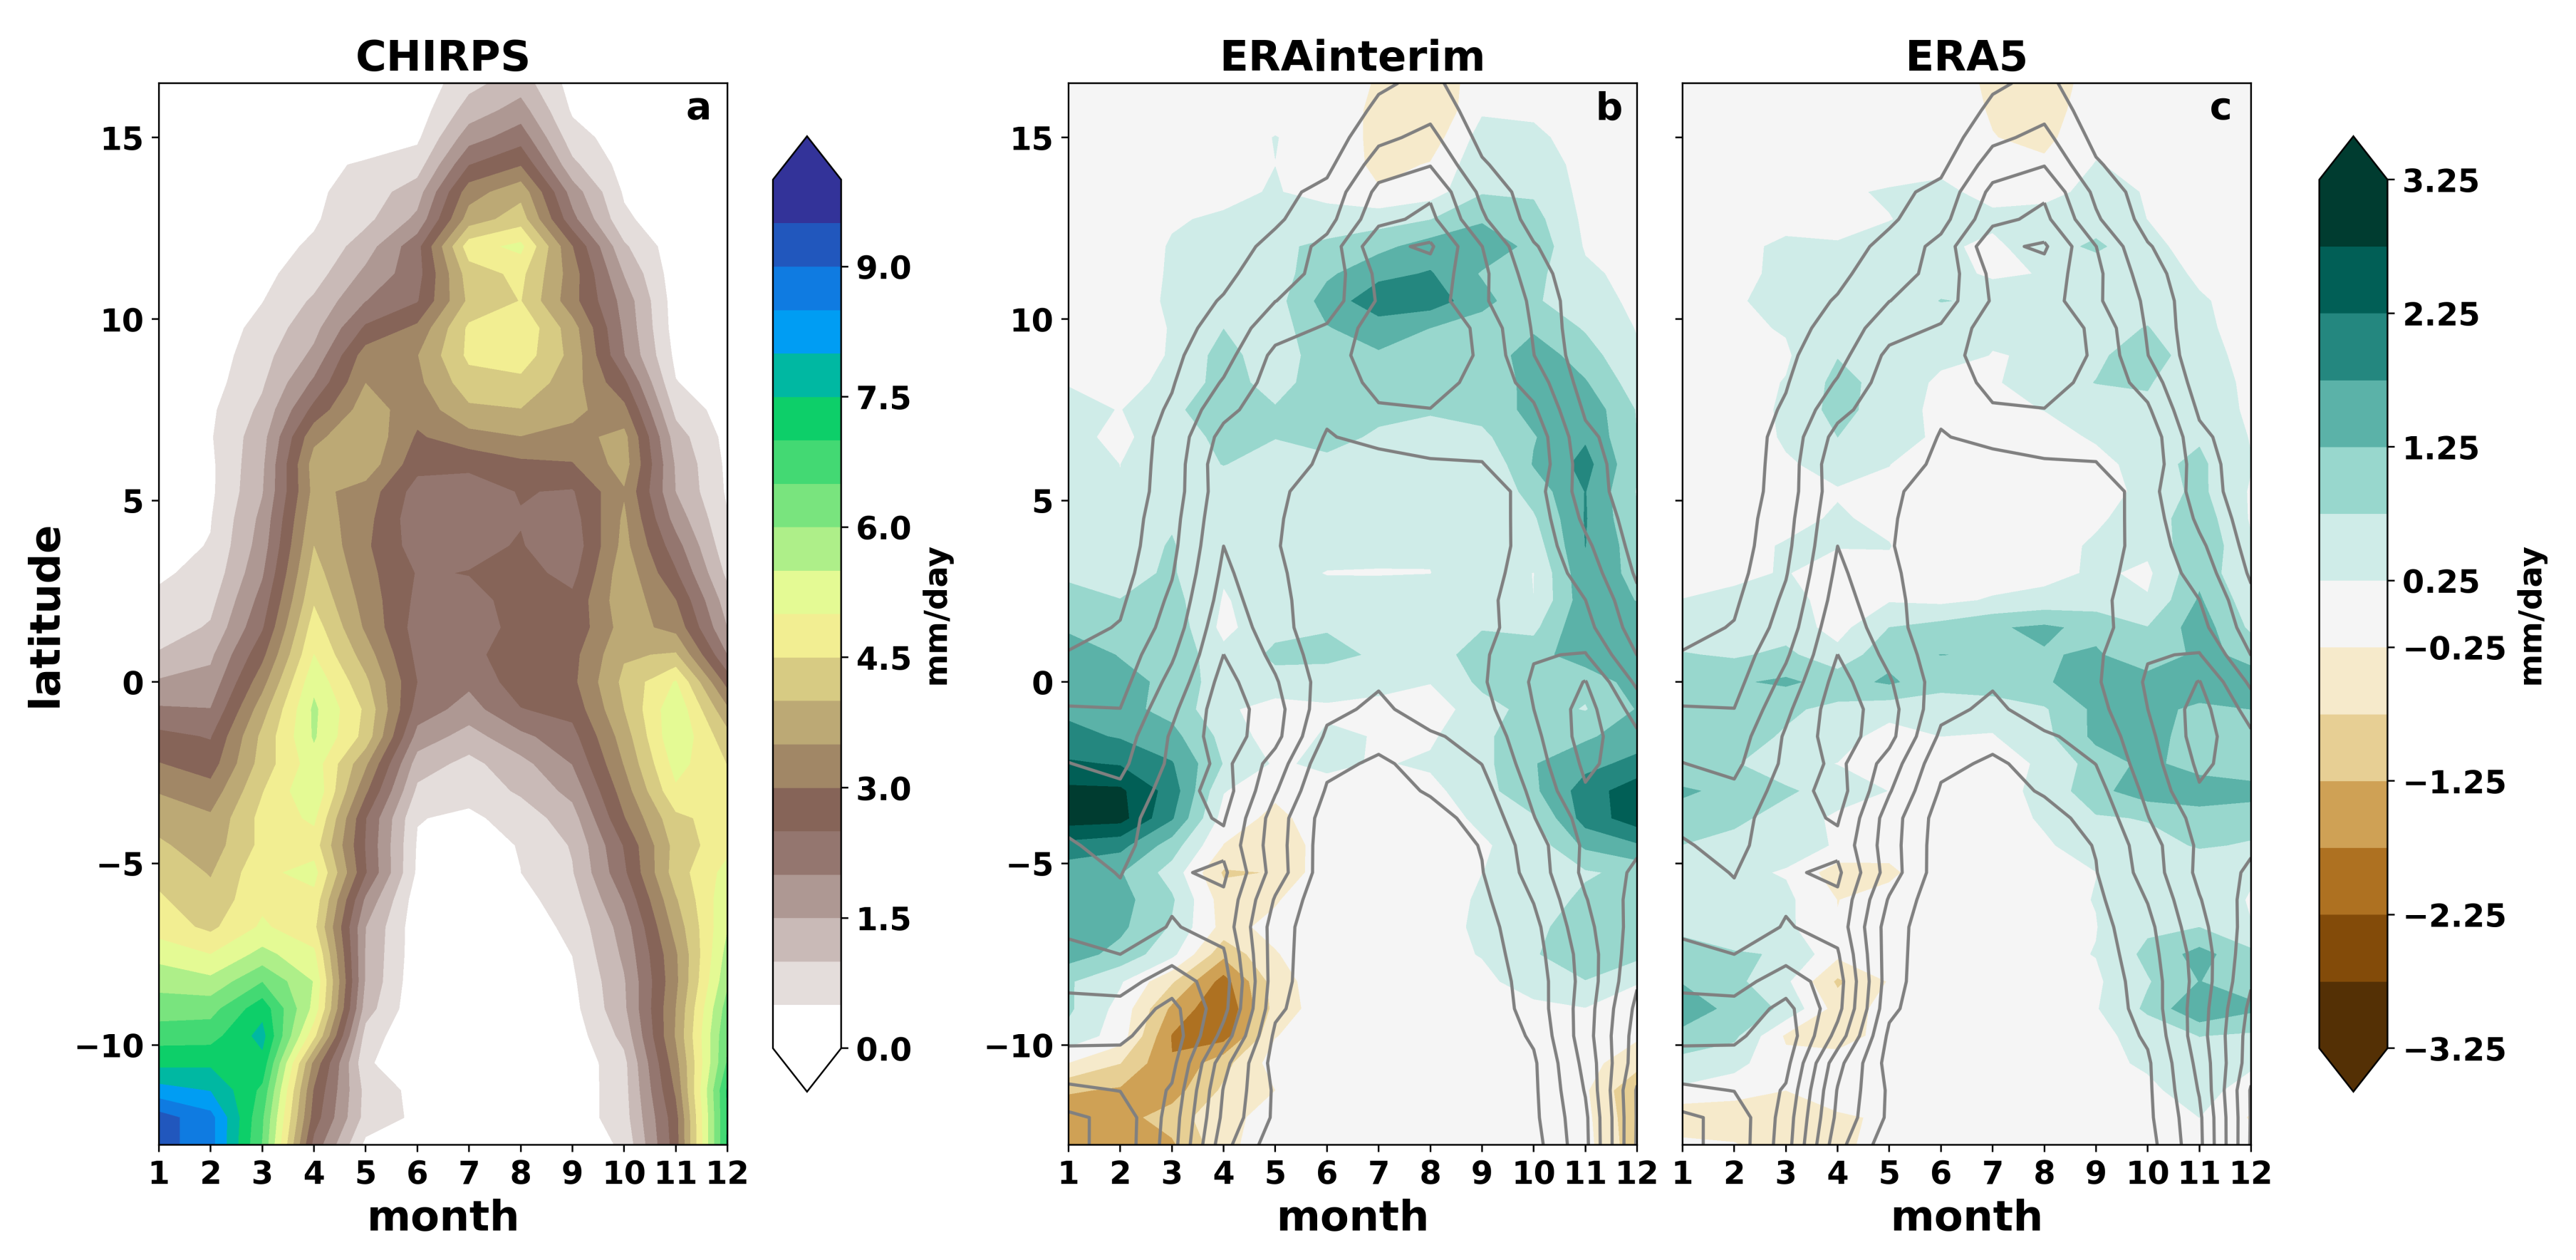
3.2.1. East African Precipitation Cycle

As the tropical regions exhibit a strong seasonality in precipitation, we investigated how well the reanalysis products captured the seasonal cycle of precipitation in our East African focus region. Figure 9 shows the time–latitude diagram of precipitation averaged over the longitude band between 25 ° E and 50 ° E for CHIRPS and the bias in the two reanalysis datasets. CHIRPS shows the north–south migration of the East African rainfall following the movement of the inter-tropical convergence zone (ITCZ). Maximum precipitation is located in the Southern hemisphere around 12 ° S with an average value of more than 9 mm/day during northern hemisphere winter, which is the main rainy season of Southern Tanzania. During northern hemisphere spring the precipitation maximum migrates northward. During northern hemisphere summer the maximum precipitation rate remains in the north of East Africa around 10 ° N with rates just below 5 mm/day representing the main rainy season of Ethiopia (June to September). During northern hemisphere fall the rainbelt wanderes south again resulting in a bimodal precipitation pattern of Uganda, Kenya, Southern Ethiopia, and Northern Tanzania.
ERA-interim and ERA5 both capture the seasonality and position of the rain belt very well (not shown), but total rainfall amounts do not agree everywhere with observations. ERA-interim underestimates the precipitation maximum in the very south of the East Africa box by up to 2.25 mm/day. On the other hand, the rainy seasons of Uganda and Kenya in northern hemisphere spring and fall (precipitation maximum around the equator) are overestimated by more than 2.25 mm/day and in particular the spring rains begin too early in the year. The timing of the main rainy season of Ethiopia in northern hemisphere summer is captured well but also overestimated by up to 1.75 mm/day.
The changes from ERA-interim to ERA5 are striking, in particular over the most northern and southern positions of the precipitation belt: the dry bias in the northern hemisphere winter as well as the wet bias during the Ethiopian rainy season are reduced to less than 0.75 mm/day. In addition, the wet bias in the locations of bimodal rainfall regimes is reduced to below 1.25 mm/day. Consistently with ERA-interim, ERA5 also shows a slightly smaller northward extent of the rainbelt compared to the CHIRPS data.

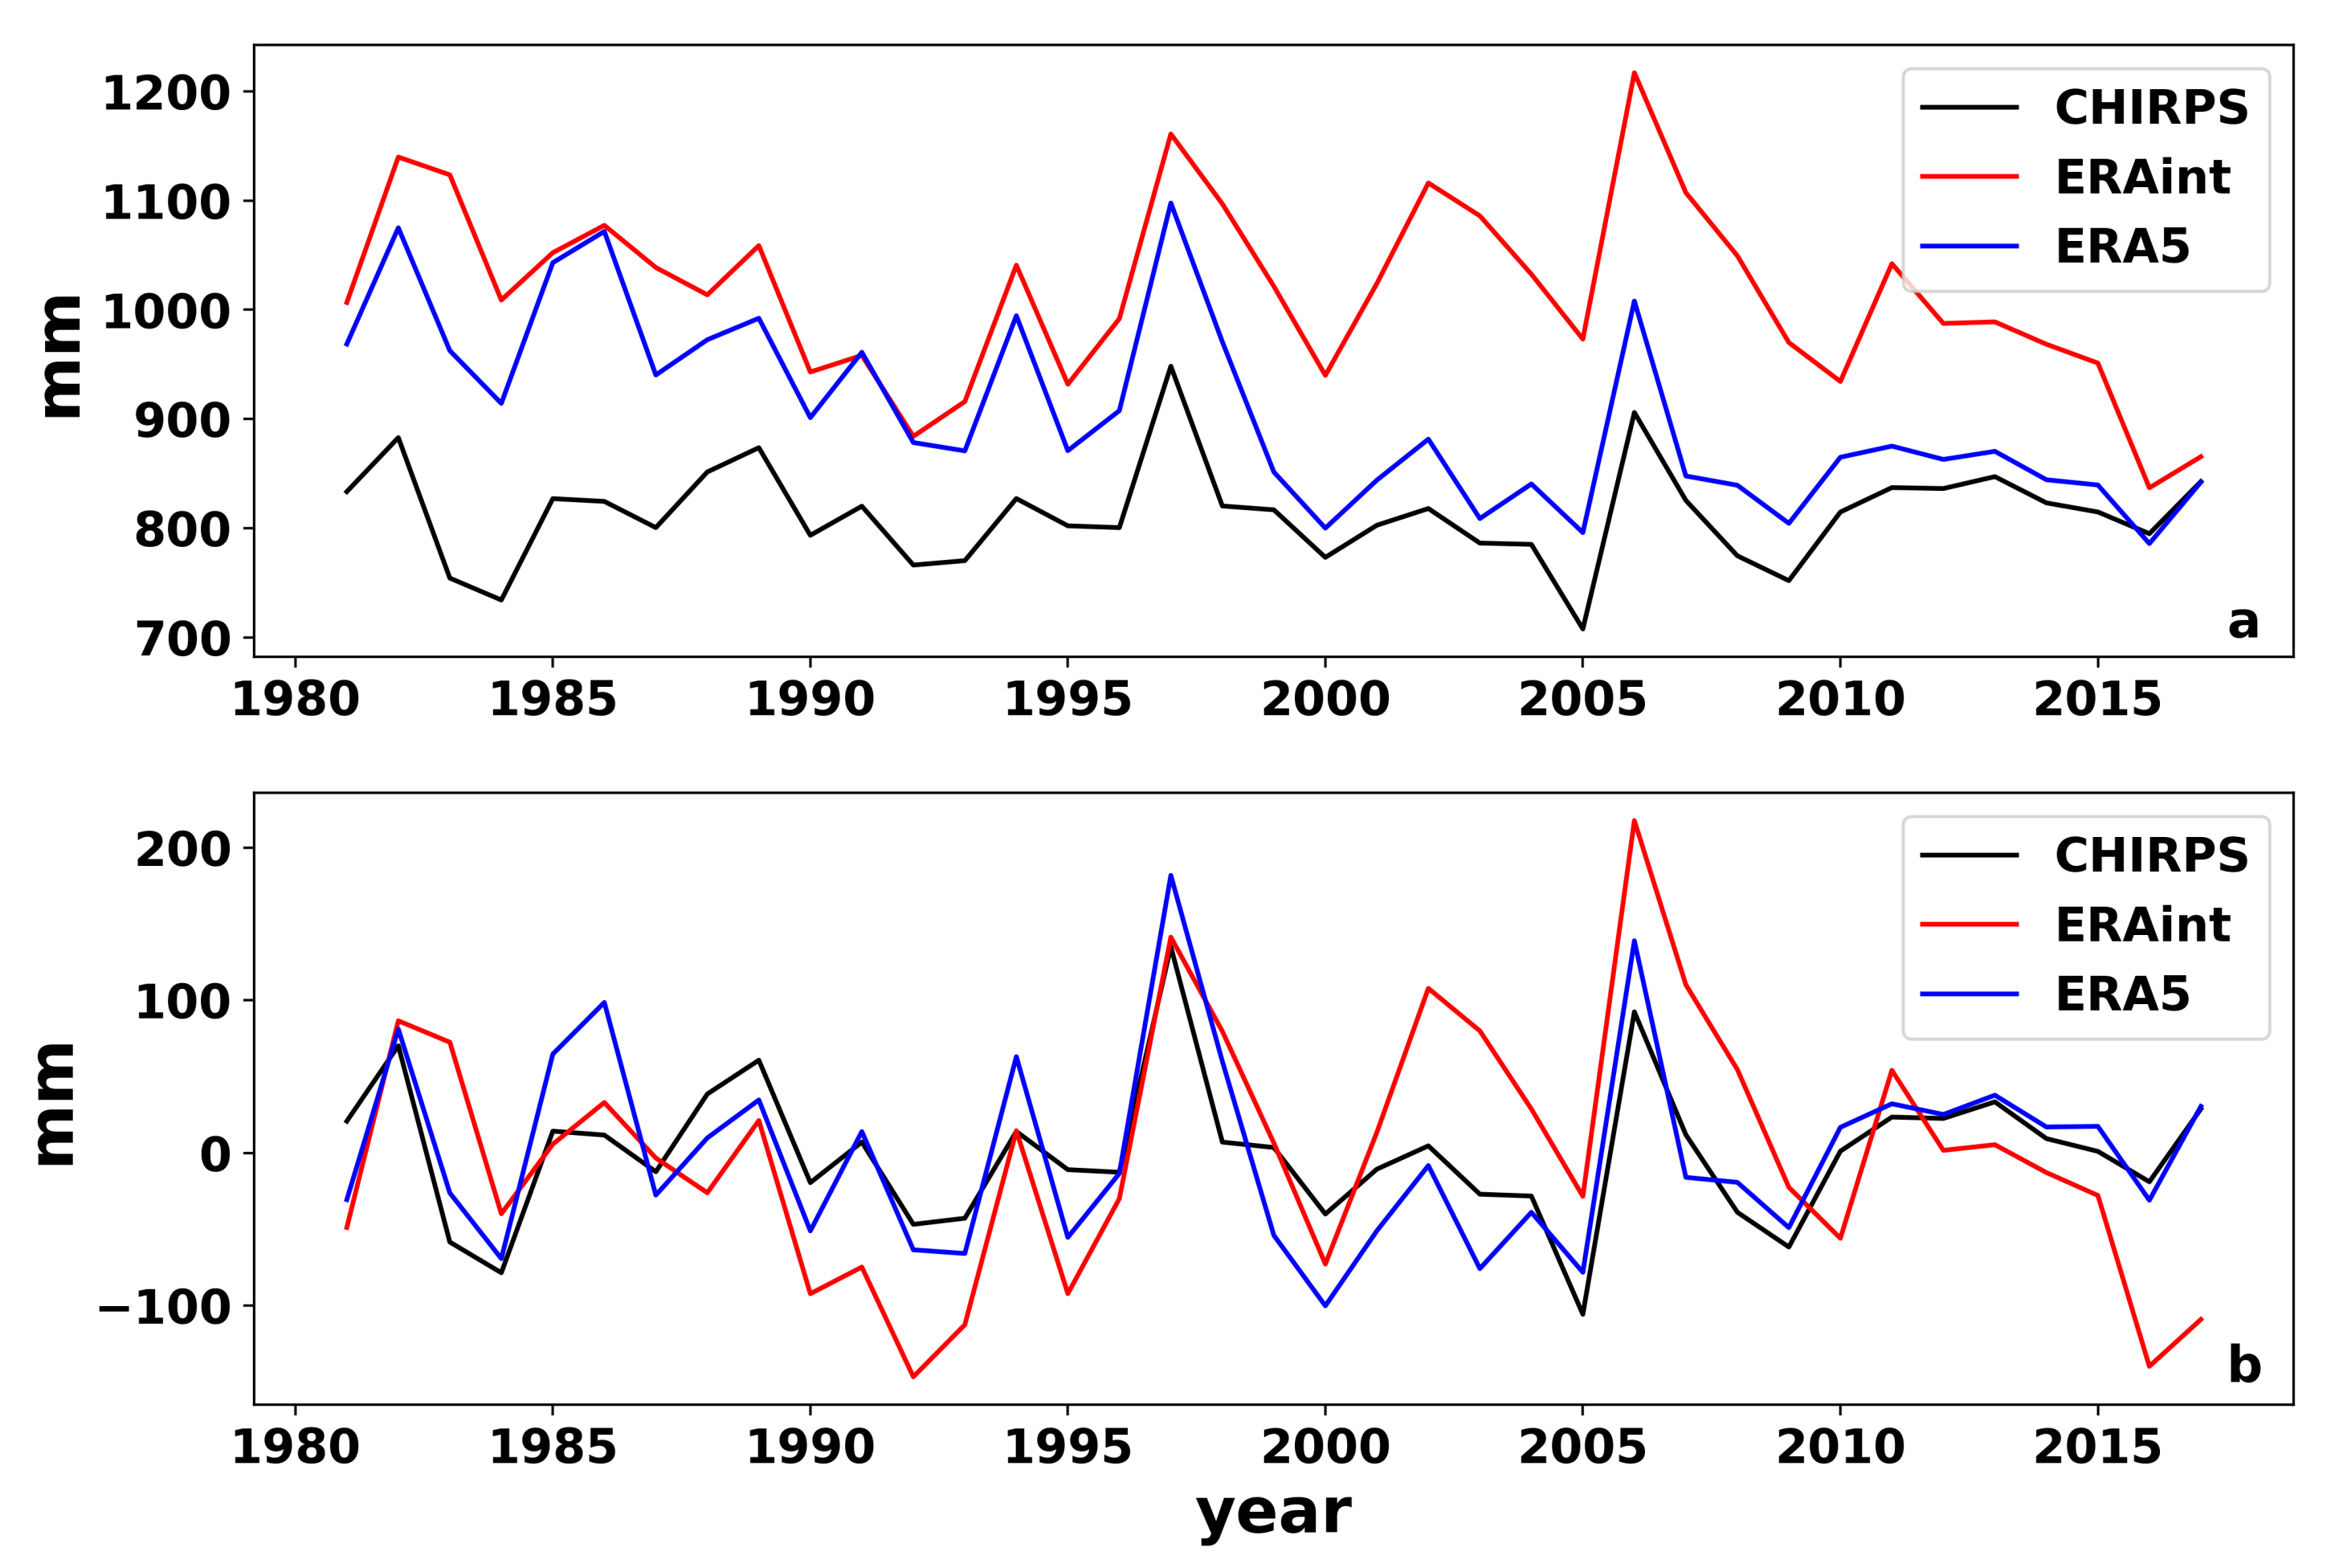
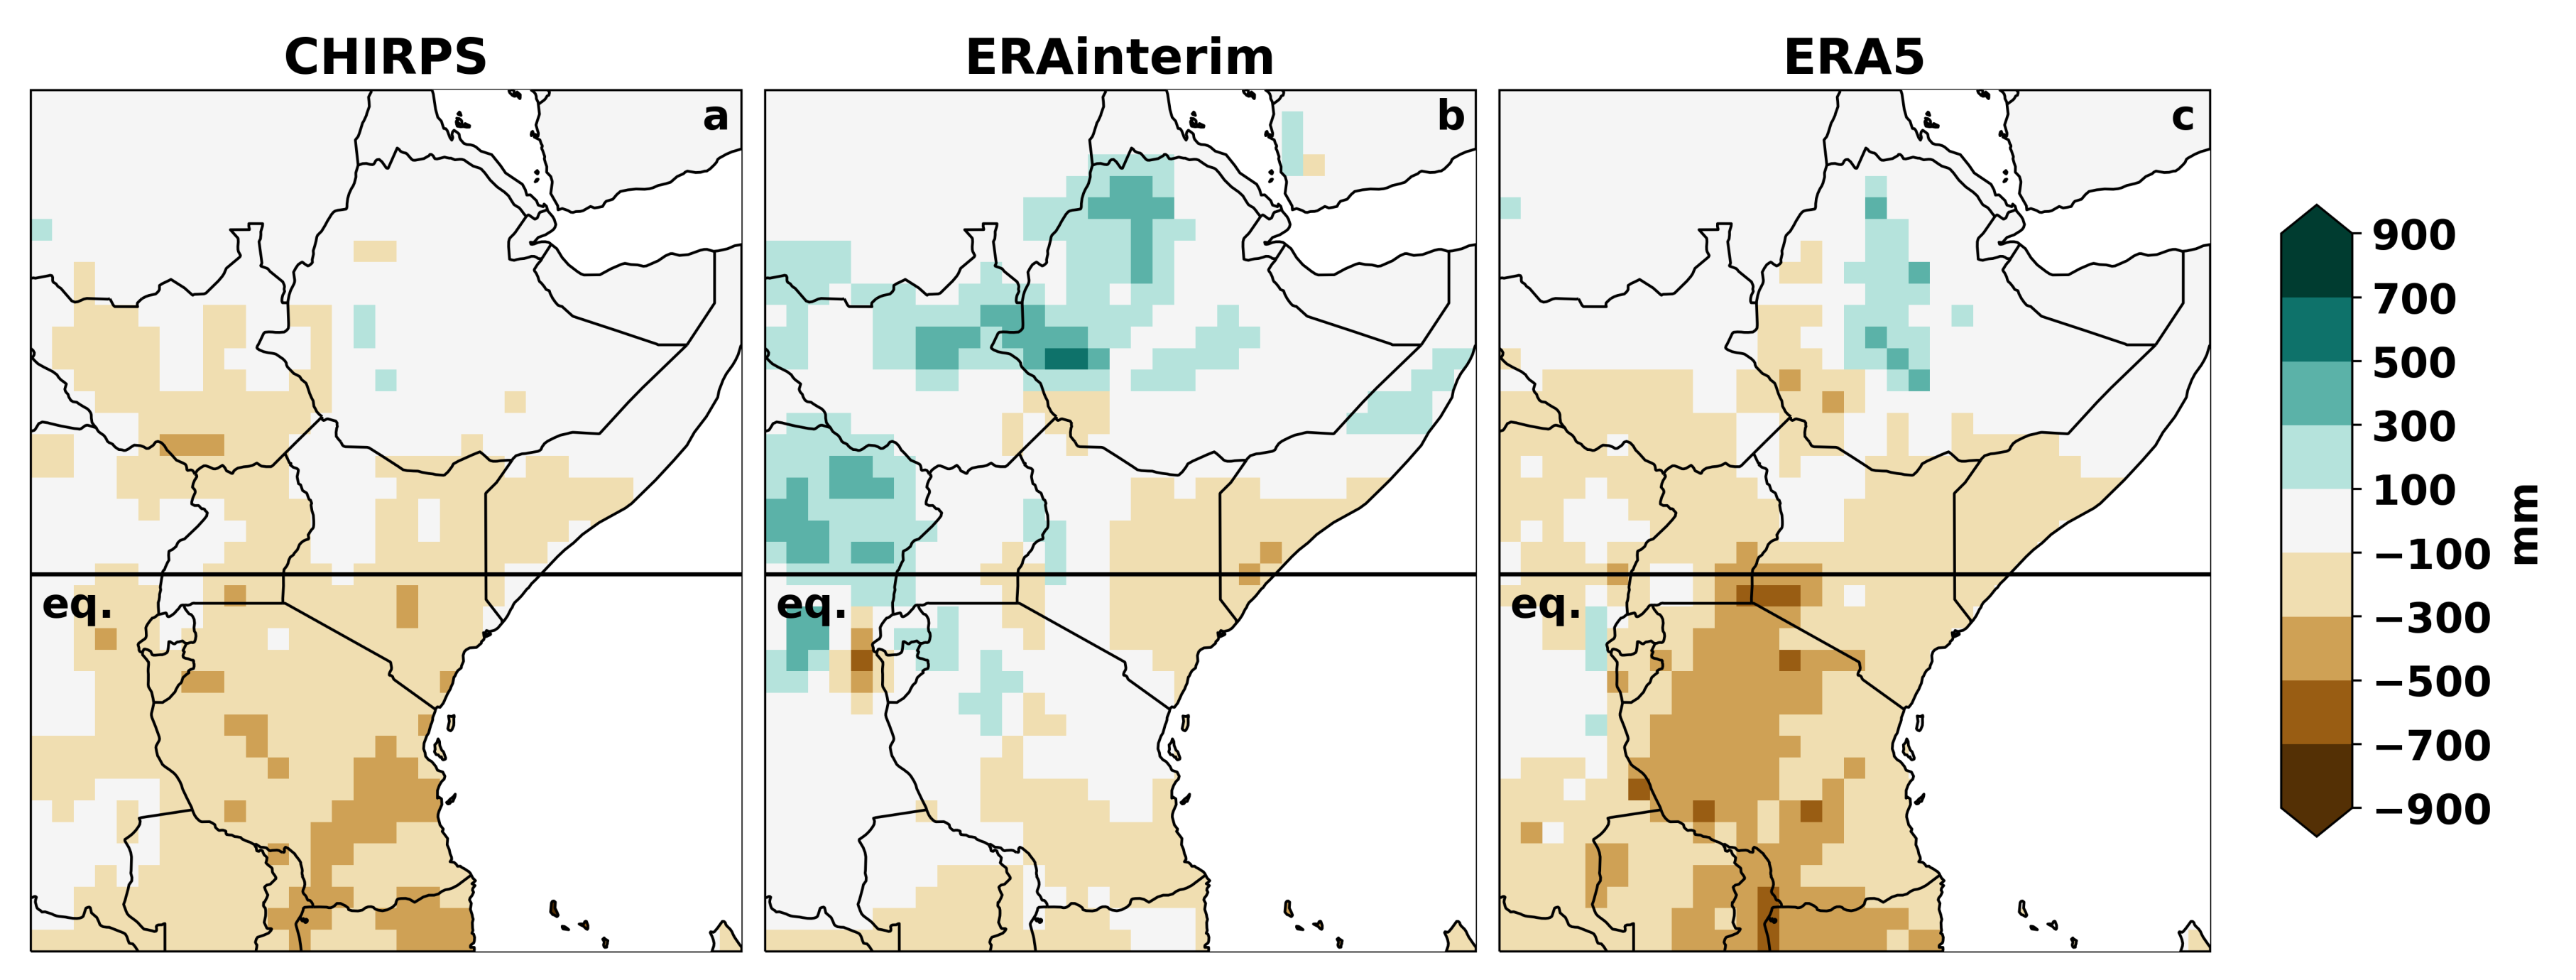
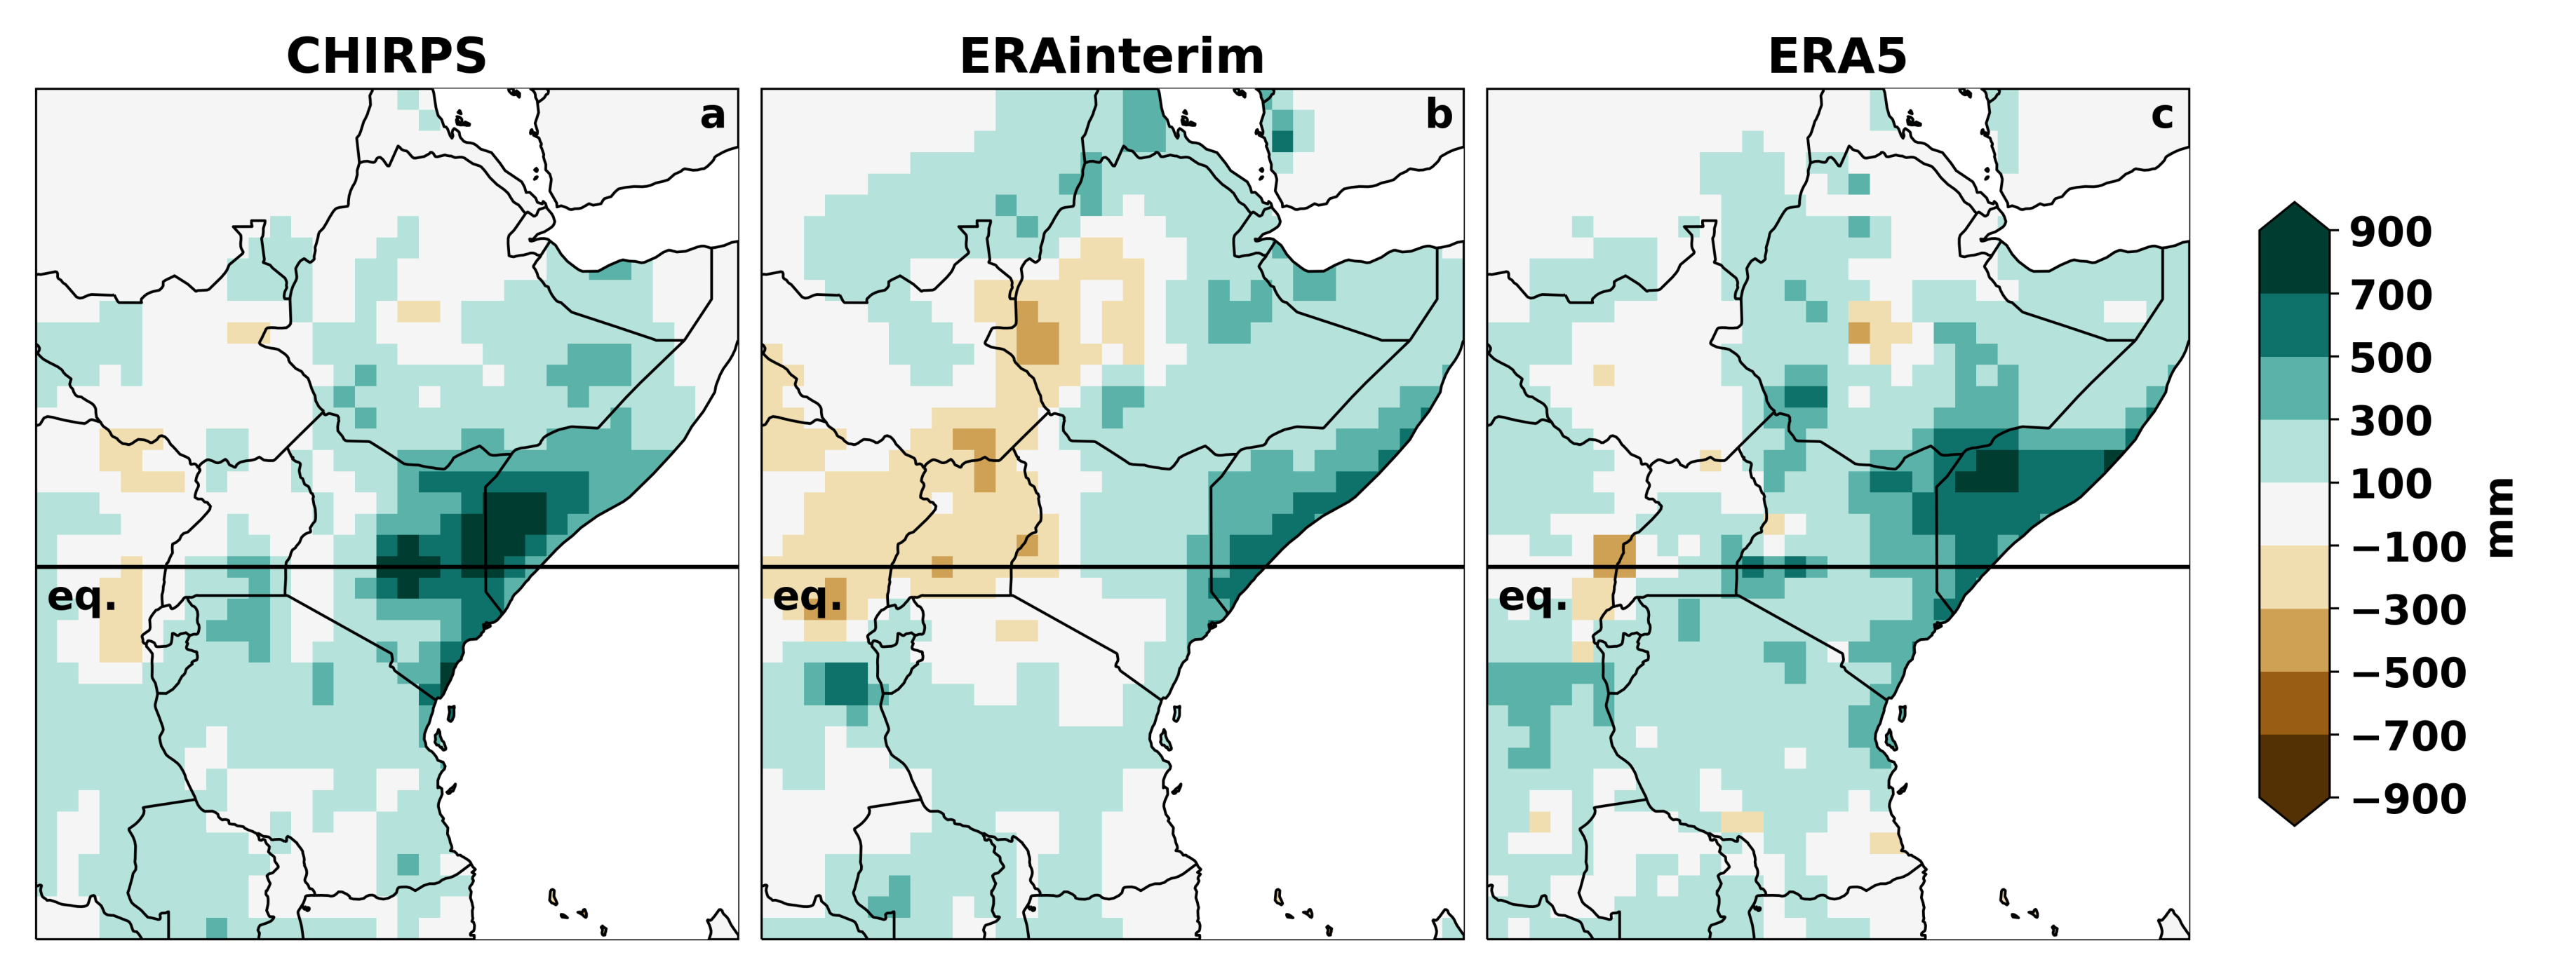
3.2.2. Extreme Precipitation Years

The time series of annual precipitation aggregated within the East Africa box (13 ° S–17 ° N, 25 ° E–50 ° E) is shown in Figure 10a for observations and reanalysis products. Observations do not show a trend in annual mean precipitation. The driest year of the time period is 2005, which corresponds to a strong negative Indian Ocean Dipole (IOD) event during the June to September period [60]⁠. However, also the devastating drought of 1983/1984 in Ethiopia [61]⁠ is captured. The wettest years of the time series are 1997 and 2006, which are associated with combined positive IOD and ENSO (El Niño–Southern Oscillation) years [62]⁠. According to Bahaga et al. [63],⁠ strong positive IOD events contribute more to above-normal rainfall over Eastern Africa compared to positive ENSO years. This is because a warm SST anomaly over the western Indian ocean favors strong moisture flux over Eastern Africa. Although ERA-interim has a consistent strong overall wet bias and therefore fails to capture the dry years, it captures the wet years as well as the lack of a trend. By contrast, ERA5 has an overestimated drying trend. The wet bias is much reduced compared to ERA-interim, particularly starting from the late 1990s, likely due in part to the increase in observational data flowing into the data assimilation procedure. Due to the drying trend, the great drought of 1983/1984 is not particularly dry in ERA5, but the mentioned wet years are well-captured and also the dry year 2005 is very dry in ERA5. The time series shows that the similarity between ERA5 and observations increase over time, with the drying trend in ERA5 reducing the differences from observations. As there is large uncertainty in the trend of precipitation products in East Africa [64], we removed the time series’ trends in Figure 10b. The detrended time series of ERA5 precipitation agree very well with observations, with a correlation of 0.84. This highlights that the year-to-year variability is captured well. By contrast, the detrended time series of ERA-interim precipitation only has a correlation of 0.48 with observations.
We selected the year 2005 as an example of an extremely dry year and 1997 as an example of an extremely wet year for a more detailed look at the rainfall patterns during extreme years. Hastenrath et al. [65]⁠ noted that the deficit rainfall in 2005 led to drought conditions over Equatorial Africa and associated this extreme dry event with the development of a positive pressure anomaly over the western Indian Ocean during the October and November, which resulted in anomalous subsidence over the region. In 1997, on the other hand, the East African October–December rains were in many areas more than 5–10 times the normal [66]⁠.
The observed precipitation anomalies in 2005 show that East Africa was affected by dry conditions mostly in the Southern hemisphere (Figure 11a). All of Tanzania and most of Uganda and Kenya were drier than usual. This is consistent with the anomalous precipitation pattern associated with negative IOD years. Both ERA-interim and ERA5 capture a type of bimodal pattern with a normal to wet north and a dry south (Figure 11b,c). This suggests that both reanalysis datasets capture the apparent relationship between the negative rainfall anomalies over Equatorial and Southern East Africa and a negative IOD correctly. However, ERA-interim strongly overestimates the wet conditions in large parts of Ethiopia and most of South Sudan. While the dry conditions in South Somalia and Eastern Kenya are captured, conditions in Tanzania are also too wet compared to observations. This explains why the average precipitation of East Africa is not particularly dry in 2005 in ERA-interim. ERA5 shows an intensified picture of the observed conditions with slightly too wet conditions in Ethiopia and slightly too dry conditions in the southern hemisphere. For the year 1997, observations shows wet conditions in most of East Africa, with the strongest anomalies in East Kenya and South Somalia, with anomalies between 700 and 900 mm for the year (Figure 12a). This year corresponds to the strongest El-Niño of the century and a positive IOD event. Both of these events led to above-normal rainfall over Southern Ethiopia and the Equatorial and Southern East Africa regions in the winter and spring seasons. ERA-interim and ERA5 reproduce these anomalously wet conditions over the coastal areas of East Africa (Figure 12b,c). However, ERA-interim shows dry anomalies in West Ethiopia and Uganda, and the strongest wet anomalies are located too far East and limited to the coastal areas of Somalia. By contrast, ERA5 captures the observed wet pattern quite well, while slightly underestimating the maximum precipitation rates.

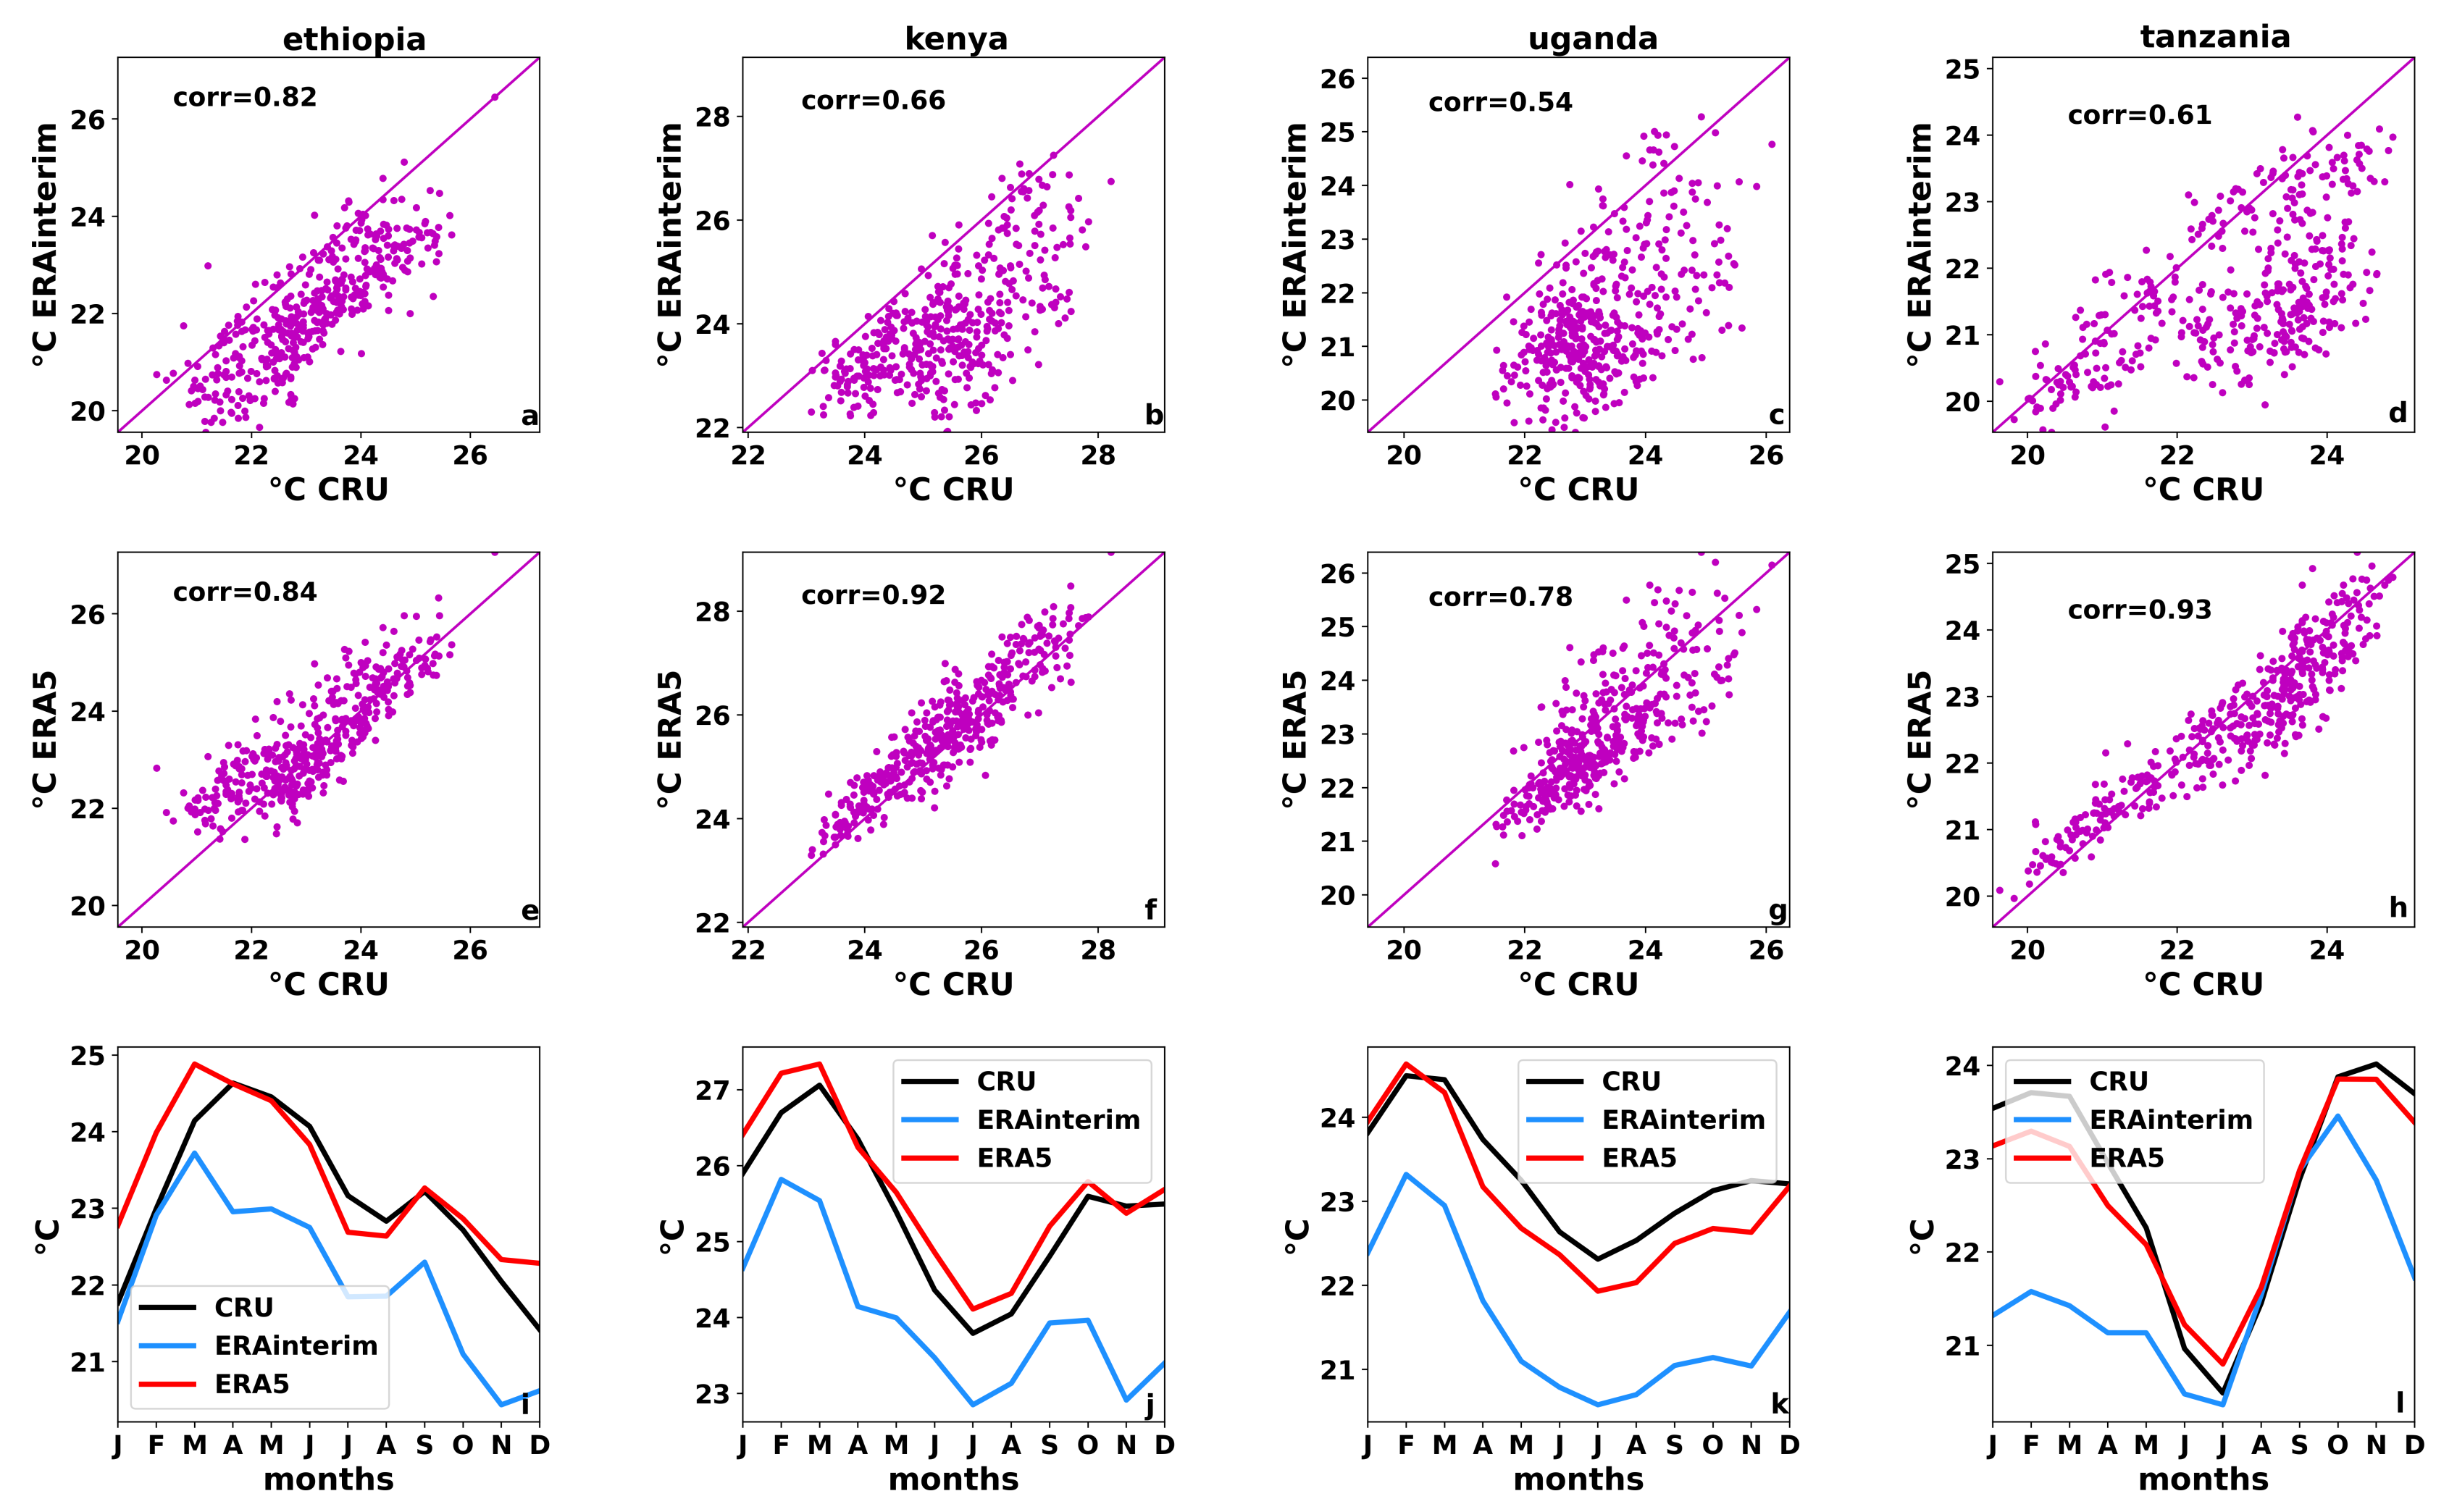
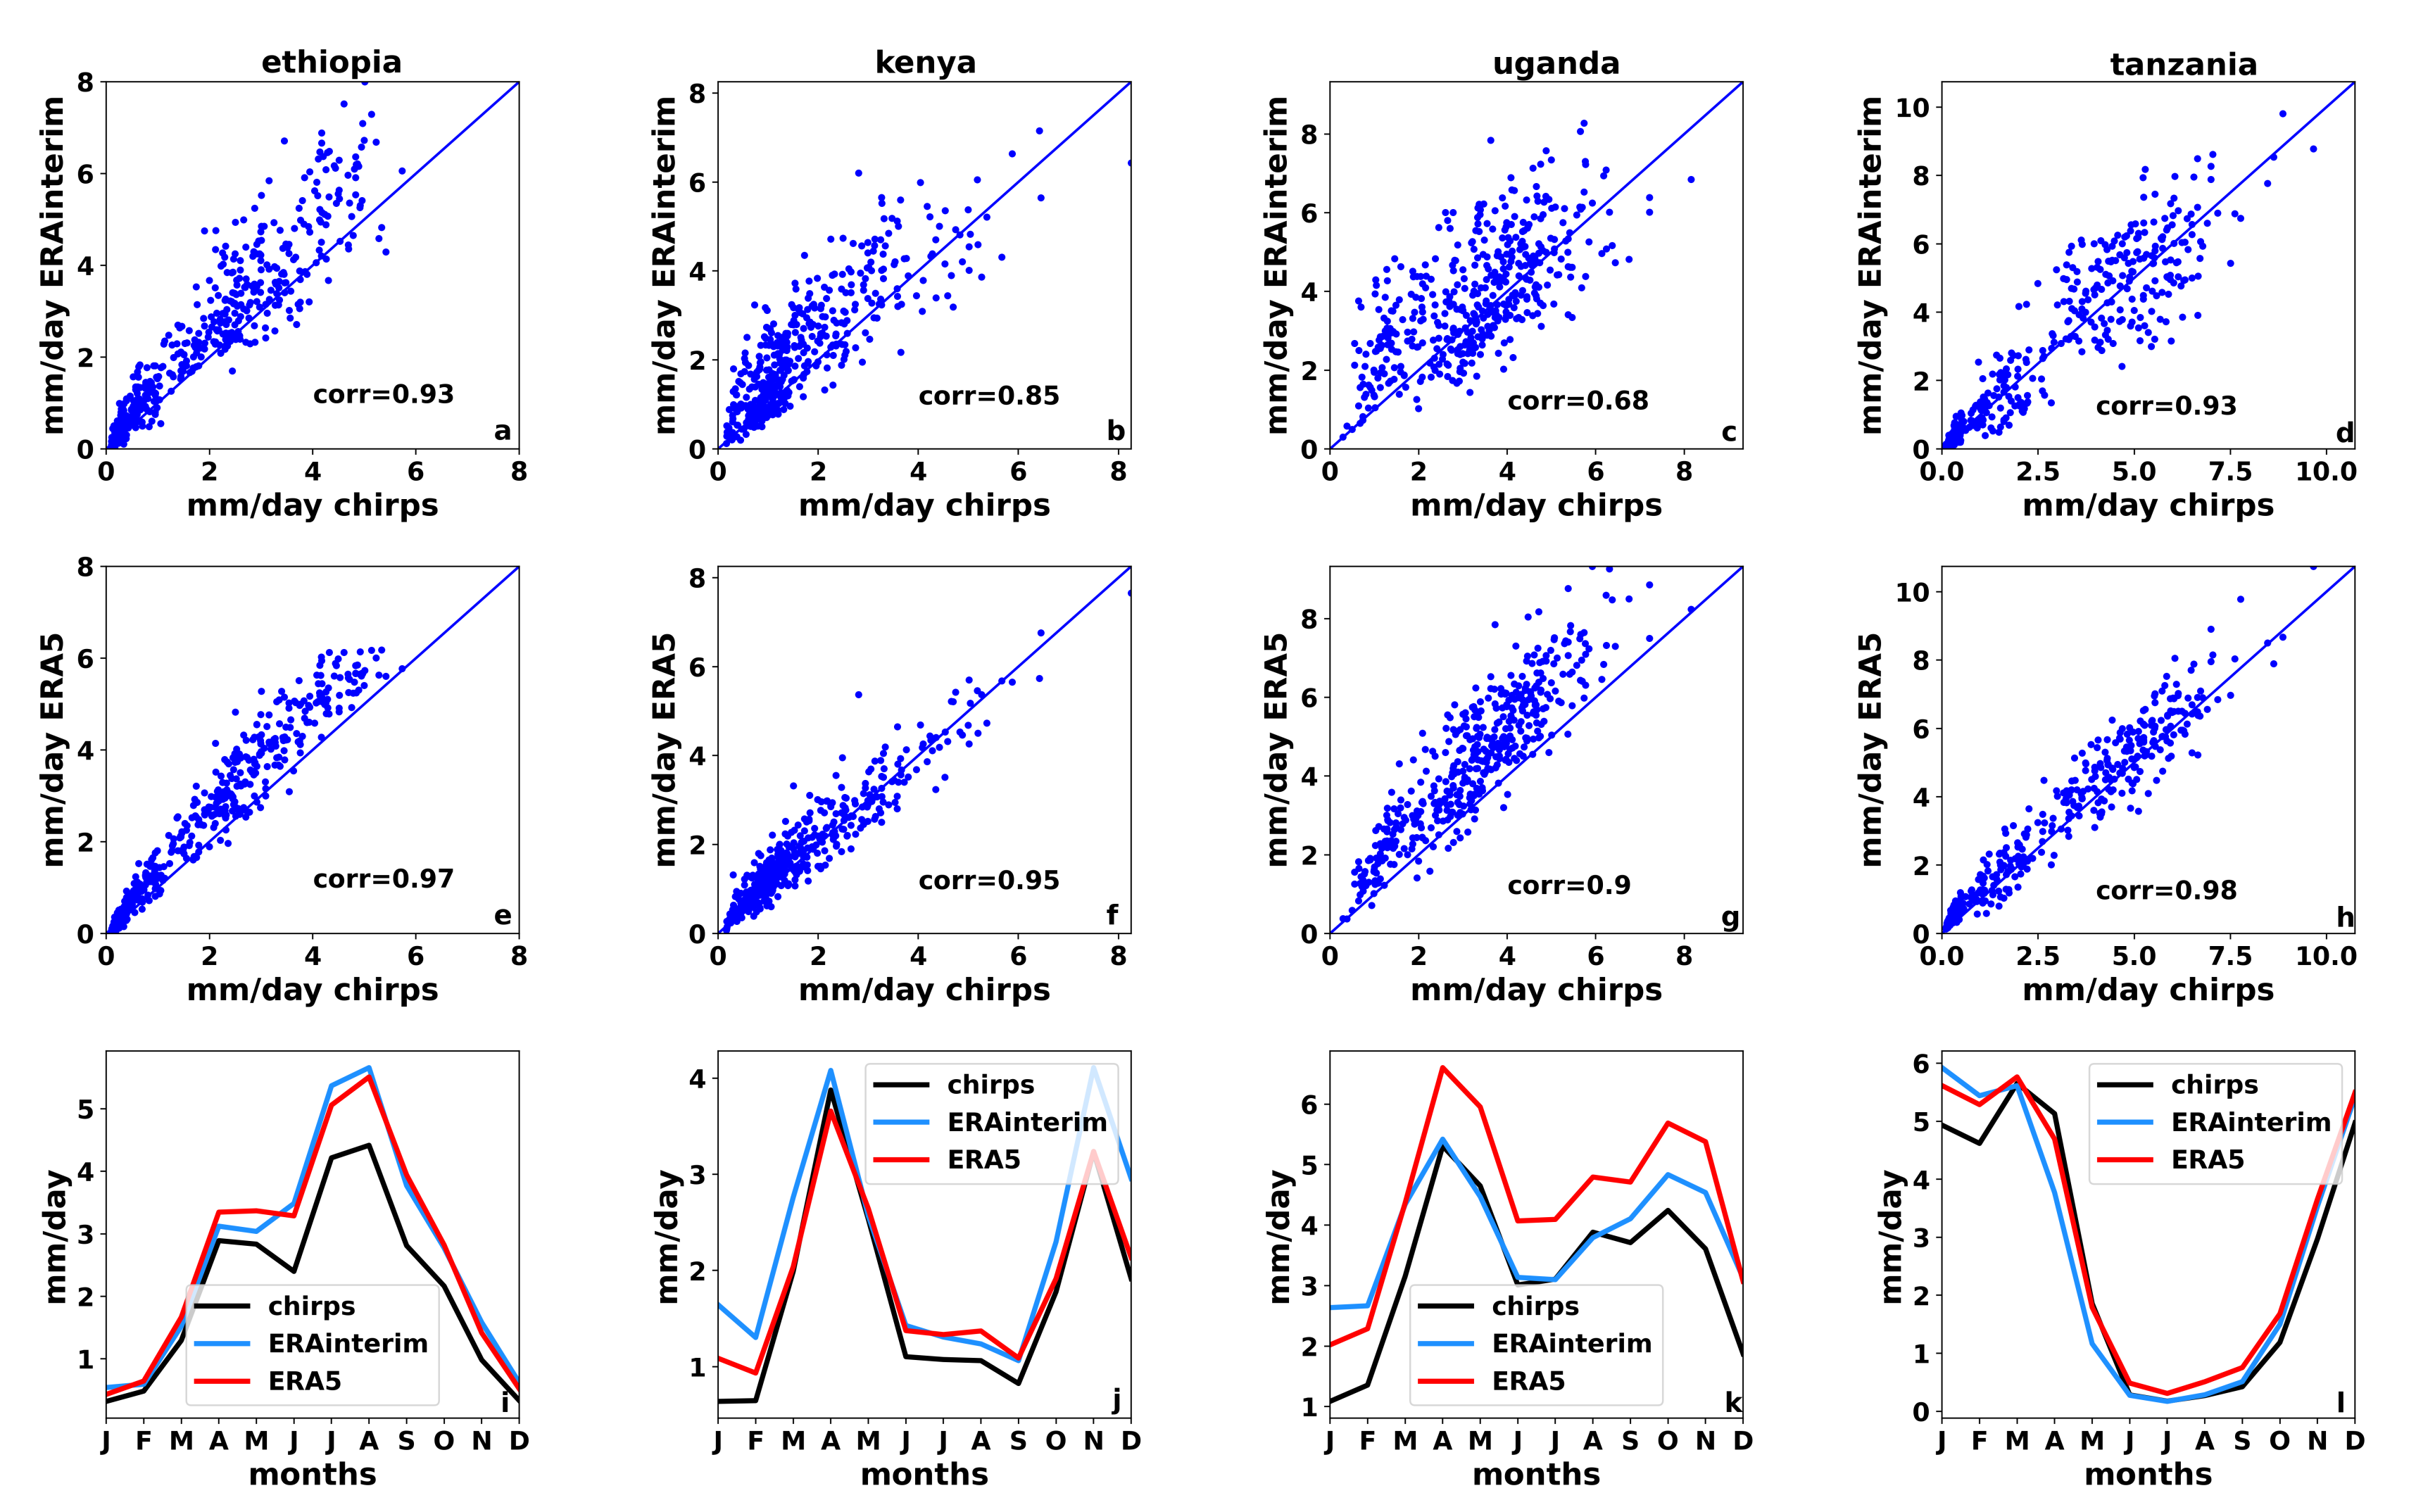
3.3. Country-Level Evaluation

We further narrowed down the analysis to the four focus countries Ethiopia, Kenya, Uganda, and Tanzania. Figure 13 and Figure 14 show scatter plots of reanalysis data versus observations to allow for a more detailed investigation of the temporal temperature and precipitation distribution within the countries and also present the seasonal cycle of temperature and precipitation at the country level.
The scatter plots of near-surface temperature in Figure 13 show that ERA5 is closer to observations than ERA-interim in all four countries, as the values are located much closer to the lines of best fit. While correlation ranges from 0.54 to 0.82 for ERA-interim, the range for ERA5 is from 0.78 to 0.93. The strongest change and best fit for near-surface temperature is found for Tanzania, with a correlation coefficient of 0.93 (from 0.61 in ERA-interim). The least good fit for temperature of both reanalysis products is found in Uganda, and even here ERA5 (0.78) is closer to observations than ERA-interim (0.54).
Figure 13 also displays the annual cycle of near-surface temperature from CRU, ERA-interim and ERA5. Observations show the highest temperatures during late winter/early spring for Ethiopia, Kenya, and Uganda and during November for Tanzania. Conversely, the lowest temperature for Kenya, Uganda, and Tanzania is seen during July, whereas for Ethiopia the coldest month is December. Both reanalysis products reproduce the observed annual cycle well, even if the peak is shifted for Ethiopia and Tanzania by a month. ERA-interim shows an overall cold bias in all four countries. This bias is of a magnitude around 1–2 ° C, while the overall temperature range throughout the year is 2–3 ° C . While this bias is present all year round in Kenya and Uganda, it is only present in Ethiopia after March and from October to June in Tanzania. In all four countries this bias is much reduced in ERA5, which displays a bias around 0.5 ° C at the most. In particular in Tanzania the bias is so unevenly distributed over the year that its reduction brings the ERA5 curve much closer to the observed curve.
The scatter plots for monthly mean precipitation rates in Figure 14 show a similar change for temperature, which is closer to observations for ERA5 than for ERA-interim. As already seen in the African correlation maps, in East Africa the correlation between observed monthly mean precipitation and reanalysis is generally higher than the correlation between observed temperature and reanalysis. For precipitation, the correlation changed from 0.68 to 0.93 for ERA-interim to a range of 0.9 to 0.98 for ERA5. As for temperature, the best fit for monthly mean precipitation is found in Tanzania and the worst fit is found in Uganda.
The annual cycles of precipitation from observations and the reanalysis datasets are displayed in Figure 14 (lower panels) and show that Ethiopia and Tanzania get their maximum rains during their respective summer seasons, whereas the countries around the equator (Kenya and Uganda) receive the peak rains during spring and autumn following the movement of the ITCZ. Both reanalysis products reproduce the observed seasonality of precipitation well despite the difference in amounts. In Ethiopia, both reanalysis products have a wet bias, which is most pronounced in the rainy summer season. This bias is not substantially reduced from ERA-interim to ERA5. In Kenya, both reanalysis products have a wet bias in the dry seasons. However, there is a clear bias reduction in the short rains (northern hemisphere winter), where ERA5 is much closer to observations than the too wet ERA-interim data. In Uganda, despite the increased correlation with observations, the wet bias is more pronounced in ERA5 than in ERA-interim throughout most of the year and in particular in the rainy seasons. In Tanzania, there is little change from ERA-interim to ERA5. Both products overestimate precipitation in the beginning of the year and are close to observations during the rest of the year.

4. Summary and Conclusions

This study assessed the performance improvements of ERA5 over ERA-interim reanalysis over Africa for the 1981–2017 period by comparing with gridded observations. Our analysis for near-surface temperature and precipitation data in Africa showed substantial changes with the introduction of the new reanalysis product. ERA5 data were generally closer to observations than ERA-interim, which agrees with findings of studies on other aspects of the datasets [34,35,36,37]⁠.
Over most of Africa the bias in temperature as well as precipitation was clearly reduced and correlation with observations increased in ERA5 reanalysis. It is interesting to note, that in ERA5 the temporal variability of observed precipitation was better captured than that of temperature in large parts of Africa. This was reflected in higher temporal correlation values for the precipitation than for the temperature field despite more complex processes involved in the generation of precipitation. Further diagnostic study of this seemingly weaker performance of temperature compared to precipitation would be an interesting topic for future study.
Despite a slightly better performance of ERA5 over ERA-interim in representing the observed trend in precipitation, and to some extent that of temperature, this is an aspect where both reanalysis fields performed less well. Both reanalysis products did not capture the observed precipitation trends in most of Africa. This is not surprising, as precipitation trends are uncertain for most regions of the globe, as noted in [64]⁠. The observed temperature trend was much better captured in ERA5 than in ERA-interim, which even showed cooling trends in several regions of Africa. These regions are marked by strong wetting trends as well, which implies cooling due to increased cloud cover. Overall, reanalysis data are generally considered unsuitable for trend analysis [58]⁠.
The representation of the observed precipitation cycle of East Africa has also improved substantially from ERA-interim to ERA5, reducing most of the bias in the zonally averaged precipitation data. In contrast to ERA-interim, ERA5 captured the variability well, but a not-observed drying trend in the data contorts the occurrence of extreme years. However, this result has to be taken with a grain of salt, as the precipitation trend might be underestimated in the CHIRPS data. In particular in the north of East Africa other datasets display a drying trend since the 1950s [64]⁠ that is not captured in the CHIRPS data for the chosen time period.
Analysis at the country level showed the strongest increase in correlation with observations in East Africa in Tanzania with regards to temperature as well as precipitation. The one major lack of improvement we found was in the precipitation bias in Uganda, which has increased from ERA-interim to ERA5, even though variability has improved.
Overall, this study mainly suffers from the uncertainty of observational products that has been shown for precipitation as well as surface temperature data [64,67,68]⁠⁠. Ideally, this study would compare the reanalysis data to station data, but the sparsity of meteorological observations in Africa limits such an analysis approach.
While ERA5 is much closer to observations than its predecessor, there is still room for further improvement. For example, the resolution of 0.25 ° is still considered too coarse for very regional studies and impact modeling. One first step to address this problem is the recently launched land-only version of ERA5, called ERA5-Land. This dataset is a dynamically down-scaled version of ERA5’s land component bias-corrected precipitation at a 9 km resolution [47,69]⁠. It is produced with the Tiled ECMWF Scheme for Surface Exchanges over Land incorporating land surface hydrology (H-TESSEL) and produces surface and sub-subsurface processes on a very local scale. A first analysis of ECMWF showed some improvements of ERA5-Land over ERA5 [69]. Another major improvement of reanalysis data would be assimilation for precipitation.
From our results, we conclude that precipitation and temperature reanalysis in ERA5 are much improved compared to ERA-interim in Africa, and we therefore discourage the continued use of ERA-interim data. In contrast to previous reanalysis datasets, even the precipitation field in ERA5 displays a high agreement with observations. This implies that, though observational precipitation datasets can provide higher resolution and accuracy, reanalysis precipitation can be used when a coherent set of multiple climate variables is needed, like in the investigation of the natural variability of coupled systems or the provision of initial conditions for land surface, hydrological, or vector transmission models [58].
While the results of this study highlight the strengths as well as the limitations of the two reanalysis products over East Africa in terms of monthly mean values of temperature and precipitation, further in-depth analysis of the performance of reanalysis from daily to sub-seasonal time scales targeting extreme events would be required to better assess the robustness and applicability of these dataset for impact studies, such as agricultural and hydrological studies.

Author Contributions

Conceptualization, S.G. and T.D.; methodology, S.G. and T.D.; software, S.G.; validation, S.G. and T.D. and G.T.D.; formal analysis, S.G.; investigation, S.G.; resources, S.G.; data curation, S.G.; writing—original draft preparation, S.G. and T.D. and G.T.D.; writing—review and editing, S.G. and T.D. and G.T.D.; visualization, S.G.; supervision, T.D. and G.T.D. All authors have read and agreed to the published version of the manuscript.

Funding

This research received no external funding.

Acknowledgments

We thank CCAFS East Africa Director Dawit Solomon and the Ethiopian office of CCAFS for hosting Stephanie Gleixner and therefore providing the opportunity for this study. The research was also supported by the EPICC project, funded by IKI and supported by BMU, and the project "Adapting crop and livestock systems in Mali to climate change" funded by the Norwegian Ministry of Foreign Affairs. G.T.D. is currently affiliated with the Canadian Meteorological Centre, Environment and Climate Change Canada.

Conflicts of Interest

The authors declare no conflict of interest.

References

  1. IPCC. Impacts, Adaptation, and Vulnerability. Part B: Regional Aspects. Contribution of Working Group II to the Fifth Assessment Report of the Intergovernmental Panel on Climate Change. In Climate Change 2014; Barros, V., Field, C., Dokken, D., Mastrandrea, M., Mach, K., Bilir, T.E., Ebi, K., Estrada, Y., Genova, R., Girma, B., Eds.; Cambridge University Press: Cambridge, UK; New York, NY, USA, 2014; p. 688. [Google Scholar]
  2. Ahmed, S.A.; Diffenbaugh, N.S.; Hertel, T.W.; Lobell, D.B.; Ramankutty, N.; Rios, A.R.; Rowhani, P. Climate Volatility and Poverty Vulnerability in Tanzania; The World Bank: Washington, DC, USA, 2009. [Google Scholar]
  3. Hertel, T.W.; Burke, M.B.; Lobell, D.B. The poverty implications of climate-induced crop yield changes by 2030. Glob. Environ. Chang. 2010, 20, 577–585. [Google Scholar] [CrossRef] [Green Version]
  4. World Bank. Agriculture for Development; World Bank: Washington, DC, USA, 2008. [Google Scholar]
  5. World Bank. Development and Climate Change. World Development Report 2010; Technical Report; World Bank: Washington, DC, USA, 2010. [Google Scholar]
  6. Dinku, T. Challenges with availability and quality of climate data in Africa. In Extreme Hydrology and Climate Variability; Melesse, A.M., Abtew, W., Senay, G.B.T.E.H., Variability, C., Eds.; Elsevier: Amsterdam, The Netherlands, 2019; Chapter 7; pp. 71–80. [Google Scholar]
  7. Harris, I.; Jones, P.D.; Osborn, T.J.; Lister, D.H. Updated high-resolution grids of monthly climatic observations—The CRU TS3.10 Dataset. Int. J. Climatol. 2014, 34, 623–642. [Google Scholar] [CrossRef] [Green Version]
  8. Maidment, R.I.; Grimes, D.; Black, E.; Tarnavsky, E.; Young, M.; Greatrex, H.; Allan, R.P.; Stein, T.; Nkonde, E.; Senkunda, S.; et al. A new, long-term daily satellite-based rainfall dataset for operational monitoring in Africa. Sci. Data 2017, 4, 170063. [Google Scholar] [CrossRef] [PubMed]
  9. Novella, N.S.; Thiaw, W.M. African rainfall climatology version 2 for famine early warning systems. J. Appl. Meteorol. Climatol. 2013, 52, 588–606. [Google Scholar] [CrossRef]
  10. Dinku, T.; Funk, C.; Peterson, P.; Maidment, R.I.; Tadesse, T.; Gadain, H.; Ceccato, P. Validation of the CHIRPS satellite rainfall estimates over eastern Africa. Q. J. R. Meteorol. Soc. 2018, 144, 292–312. [Google Scholar] [CrossRef] [Green Version]
  11. Funk, C.; Peterson, P.; Landsfeld, M.; Pedreros, D.; Verdin, J.; Rowland, J.; Romero, B.; Husak, G.; Michaelsen, J.; Verdin, A. A quasi-global precipitation time series for drought monitoring. U.S. Geol. Surv. Data Ser. 2014, 832, 1–12. [Google Scholar] [CrossRef]
  12. Harris, I.C.; Osborne, T.; Jones, P.; Lister, D. Version 4 of the CRU TS monthly high-resolution gridded multivariate climate dataset. Sci. Data 2020, 7, 2052–4463. [Google Scholar] [CrossRef] [Green Version]
  13. Osborn, T.J.; Jones, P.D. The CRUTEM4 land-surface air temperature data set: Construction, previous versions and dissemination via Google earth. Earth Syst. Sci. Data 2014, 6, 61–68. [Google Scholar] [CrossRef] [Green Version]
  14. Lenssen, N.; Schmidt, G.; Hansen, J.; Menne, M.; Persin, A.; Ruedy, R.; Zyss, D. Improvements in the GISTEMP uncertainty model. J. Geophys. Res. Atmospheres. Geophys. Res. Atmos. 2019, 124, 6307–6326. [Google Scholar] [CrossRef]
  15. Smith, T.M.; Reynolds, R.W.; Peterson, T.C.; Lawrimore, J. Improvements to NOAA’s historical merged land-ocean surface temperature analysis (1880–2006). J. Clim. 2008, 21, 2283–2296. [Google Scholar] [CrossRef]
  16. Lawrimore, J.H.; Menne, M.J.; Gleason, B.E.; Williams, C.N.; Wuertz, D.B.; Vose, R.S.; Rennie, J. An overview of the Global Historical Climatology Network monthly mean temperature data set, version 3. J. Geophys. Res. Atmos. 2011, 116, 1–18. [Google Scholar] [CrossRef]
  17. Decker, M.; Brunke, M.A.; Wang, Z.; Sakaguchi, K.; Zeng, X.; Bosilovich, M.G. Evaluation of the reanalysis products from GSFC, NCEP, and ECMWF using flux tower observations. J. Clim. 2012, 25, 1916–1944. [Google Scholar] [CrossRef]
  18. Simmons, A.J.; Jones, P.D.; da Costa Bechtold, V.; Beljaars, A.C.; Kållberg, P.W.; Saarinen, S.; Uppala, S.M.; Viterbo, P.; Wedi, N. Comparison of trends and low-frequency variability in CRU, ERA-40, and NCEP/NCAR analyses of surface air temperature. J. Geophys. Res. Atmos. 2004, 109, 1–18. [Google Scholar] [CrossRef]
  19. Lindsay, R.; Wensnahan, M.; Schweiger, A.; Zhang, J. Evaluation of Seven Different Atmospheric Reanalysis Products in the Arctic. J. Clim. 2014, 27, 2588–2606. [Google Scholar] [CrossRef] [Green Version]
  20. Luo, H.; Ge, F.; Yang, K.; Zhu, S.; Peng, T.; Cai, W.; Liu, X.; Tang, W. Assessment of ECMWF reanalysis data in complex terrain: Can the CERA-20C and ERA-interim data sets replicate the variation in surface air temperatures over Sichuan, China? Int. J. Climatol. 2019, 39, 5619–5634. [Google Scholar] [CrossRef]
  21. Sahlu, D.; Moges, S.A.; Nikolopoulos, E.I.; Anagnostou, E.N.; Hailu, D. Evaluation of High-Resolution Multisatellite and Reanalysis Rainfall Products over East Africa. Adv. Meteorol. 2017. [Google Scholar] [CrossRef]
  22. Wang, G.; Zhang, X.; Zhang, S. Performance of three reanalysis precipitation datasets over the qinling-daba mountains, eastern fringe of tibetan plateau, China. Adv. Meteorol. 2019. [Google Scholar] [CrossRef] [Green Version]
  23. Kalnay, E.; Kanamitsu, M.; Kistler, R.; Collins, W.; Deaven, D.; Gandin, L.; Iredell, M.; Saha, S.; White, G.; Wollen, J.; et al. The NCEP/NCAR 40-year reanalysis project. Bull. Am. Meteorol. Soc. 1996, 77, 437–470. [Google Scholar] [CrossRef] [Green Version]
  24. Uppala, S.M.; Kållberg, P.W.; Simmons, A.J.; Andrae, U.; da Costa Bechtold, V.; Fiorino, M.; Gibson, J.K.; Haseler, J.; Hernandez, A.; Kelly, G.A.; et al. The ERA-40 re-analysis. Q. J. R. Meteorol. Soc. 2005, 131, 2961–3012. [Google Scholar] [CrossRef]
  25. Hollmann, R. Precipitation—Essential Climate Variable (ECV) Factsheet; Technical Report; GCOS: Geneva, Switzerland, 2020. [Google Scholar]
  26. Bauer, P.; Thorpe, A.; Brunet, G. The quiet revolution of numerical weather prediction. Nature 2015, 525, 47–55. [Google Scholar] [CrossRef]
  27. Legates, D.R. Climate Models and their Simulation of Precipitation. Energy Environ. 2014, 25, 1163–1175. [Google Scholar] [CrossRef]
  28. Poccard, I.; Janicot, S.; Camberlin, P. Comparison of rainfall structures between NCEP/NCAR reanalyses and observed data over tropical Africa. Clim. Dyn. 2000, 16, 897–915. [Google Scholar] [CrossRef]
  29. Diro, G.; Grimes, D.I.F.; Black, E.; O’Neill, A.; Pardo-Iguzquiza, E. Evaluation of reanalysis rainfall estimates over Ethiopia. Int. J. Climatol. 2009, 29, 67–78. [Google Scholar] [CrossRef]
  30. Diro, G.; Toniazzo, T.; Shaffrey, L. Ethiopian rainfall in climate models. In African Climate and Climate Change; Springer: Dordrecht, The Netherlands, 2011; pp. 51–69. [Google Scholar]
  31. Lemma, E.; Upadhyaya, S.; Ramsankaran, R. Investigating the performance of satellite and reanalysis rainfall products at monthly timescales across different rainfall regimes of Ethiopia. Int. J. Remote Sens. 2019, 40, 4019–4042. [Google Scholar] [CrossRef]
  32. Koutsouris, A.J.; Chen, D.; Lyon, S.W. Comparing global precipitation data sets in eastern Africa: A case study of Kilombero Valley, Tanzania. Int. J. Climatol. 2016, 36, 2000–2014. [Google Scholar] [CrossRef]
  33. Hersbach, H.; Bell, B.; Berrisford, P.; Horányi, A.; Sabater, J.M.; Nicolas, J.; Radu, R.; Schepers, D.; Simmons, A.; Cornel Soci, D.D. Global reanalysis: Goodbye ERA-interim, hello ERA5. ECMWF Newsl. 2019, 159, 17–24. [Google Scholar]
  34. Martens, B.; Schumacher, D.L.; Wouters, H.; Muñoz-Sabater, J.; Verhoest, N.E.C.; Miralles, D.G. Evaluating the surface energy partitioning in ERA5. Geosci. Model Dev. Discuss. 2020, 1–35. [Google Scholar] [CrossRef]
  35. Urraca, R.; Huld, T.; Gracia-Amillo, A.; Martinez-de Pison, F.J.; Kaspar, F.; Sanz-Garcia, A. Evaluation of global horizontal irradiance estimates from ERA5 and COSMO-REA6 reanalyses using ground and satellite-based data. Sol. Energy 2018, 164, 339–354. [Google Scholar] [CrossRef]
  36. Betts, A.K.; Chan, D.Z.; Desjardins, R.L. Near-Surface Biases in ERA5 Over the Canadian Prairies. Front. Environ. Sci. 2019, 7, 129. [Google Scholar] [CrossRef]
  37. Tarek, M.; Brissette, F.P.; Arsenault, R.; De, É.; West, N.D. Evaluation of the ERA5 reanalysis as a potential reference dataset for hydrological modelling over North America. Hydrol. Earth Syst. Sci. 2020, 24, 2527–2544. [Google Scholar] [CrossRef]
  38. Beck, H.E.; Zimmermann, N.E.; McVicar, T.R.; Vergopolan, N.; Berg, A.; Wood, E.F. Present and future köppen-geiger climate classification maps at 1-km resolution. Sci. Data 2018, 5, 1–12. [Google Scholar] [CrossRef] [PubMed] [Green Version]
  39. Nicholson, S. The Turkana low-level jet: Mean climatology and association with regional aridity. Int. J. Climatol. 2016, 36, 2598–2614. [Google Scholar] [CrossRef]
  40. Yang, W.; Seager, R.; Cane, M.A.; Lyon, B. The annual cycle of East African precipitation. J. Clim. 2015, 28, 2385–2404. [Google Scholar] [CrossRef] [Green Version]
  41. Holmes, T.R.; Hain, C.R.; Anderson, M.C.; Crow, W.T. Cloud tolerance of remote-sensing technologies to measure land surface temperature. Hydrol. Earth Syst. Sci. 2016, 20, 3263–3275. [Google Scholar] [CrossRef] [Green Version]
  42. Awange, J.L.; Ferreira, V.G.; Forootan, E.; Andam-Akorful, S.A.; Agutu, N.O.; He, X.F. Uncertainties in remotely sensed precipitation data over Africa. Int. J. Climatol. 2016, 36, 303–323. [Google Scholar] [CrossRef] [Green Version]
  43. Dinku, T.; Ceccato, P.; Grover-Kopec, E.; Lemma, M.; Connor, S.J.; Ropelewski, C.F. Validation of satellite rainfall products over East Africa’s complex topography. Int. J. Remote Sens. 2007, 28, 1503–1526. [Google Scholar] [CrossRef]
  44. Dinku, T.; Ceccato, P.; Connor, S.J. Challenges of satellite rainfall estimation over mountainous and arid parts of east Africa. Int. J. Remote Sens. 2011, 32, 5965–5979. [Google Scholar] [CrossRef]
  45. Dee, D.P.; Uppala, S.M.; Simmons, A.J.; Berrisford, P.; Poli, P.; Kobayashi, S.; Andrae, U.; Balmaseda, M.A.; Balsamo, G.; Bauer, P.; et al. The ERA-interim reanalysis: Configuration and performance of the data assimilation system. Q. J. R. Meteorol. Soc. 2011, 137, 553–597. [Google Scholar] [CrossRef]
  46. Simmons, A.J.; Uppala, S.; Dee, D.; Kobayashi, S. ERA-interim: New ECMWF reanalysis products from 1989 onwards. ECMWF Newsl. 2007, 110, 25–36. [Google Scholar] [CrossRef]
  47. Hennermann, K.; Giusti, M. ERA5: Data Documentation; Technical Report; ECMWF: Reading, UK, 2020. [Google Scholar]
  48. Weedon, G.P.; Balsamo, G.; Bellouin, N.; Gomes, S.; Best, M.J.; Viterbo, P. The WFDEI meteorological forcing data set: WATCH Forcing Data methodology applied to ERA-interim reanalysis data. Water Resour. Res. 2014, 50, 7505–7514. [Google Scholar] [CrossRef] [Green Version]
  49. Muthoni, F.K.; Odongo, V.O.; Ochieng, J.; Mugalavai, E.M.; Mourice, S.K.; Hoesche-Zeledon, I.; Mwila, M.; Bekunda, M. Long-term spatial-temporal trends and variability of rainfall over Eastern and Southern Africa. Theor. Appl. Climatol. 2019, 137, 1869–1882. [Google Scholar] [CrossRef] [Green Version]
  50. Hay, S.I.; Lennon, J.J. Deriving meteorological variables across Africa for the study and control of vector-borne disease: A comparison of remote sensing and spatial interpolation of climate. Trop. Med. Int. Health 1999, 4, 58–71. [Google Scholar] [CrossRef] [PubMed]
  51. Sylla, M.B.; Giorgi, F.; Coppola, E.; Mariotti, L. Uncertainties in daily rainfall over Africa: Assessment of gridded observation products and evaluation of a regional climate model simulation. Int. J. Climatol. 2013, 33, 1805–1817. [Google Scholar] [CrossRef]
  52. Tesfaye, T.W.; Dhanya, C.; Gosain, A. Evaluation of ERA-interim, MERRA, NCEP-DOE R2 and CFSR Reanalysis precipitation Data using Gauge Observation over Ethiopia for a period of 33 years. AIMS Environ. Sci. 2017, 4, 596–620. [Google Scholar] [CrossRef]
  53. Simmons, A.J.; Willett, K.M.; Jones, P.D.; Thorne, P.W.; Dee, D.P. Low-frequency variations in surface atmospheric humidity, temperature, and precipitation: Inferences from reanalyses and monthly gridded observational data sets. J. Geophys. Res. Atmos. 2010, 115. [Google Scholar] [CrossRef]
  54. Lin, R.; Zhou, T.; Qian, Y. Evaluation of Global Monsoon Precipitation Changes based on Five Reanalysis Datasets. J. Clim. 2014, 27, 1271–1289. [Google Scholar] [CrossRef]
  55. Jury, M.R. Climate trends in southern Africa. S. Afr. J. Sci. 2013, 109, 1–11. [Google Scholar] [CrossRef] [Green Version]
  56. Collins, J.M. Temperature Variability over Africa. J. Clim. 2011, 24, 3649–3666. [Google Scholar] [CrossRef] [Green Version]
  57. Bengtsson, L.; Hagemann, S.; Hodges, K.I. Can climate trends be calculated from reanalysis data? J. Geophys. Res. Atmos. 2004, 109. [Google Scholar] [CrossRef] [Green Version]
  58. Trenberth, K.E.; Koike, T.; Onogi, K. Progress and Prospects for Reanalysis for Weather and Climate. Eos Trans. Am. Geophys. Union 2008, 89, 234–235. [Google Scholar] [CrossRef]
  59. Thorne, P.W.; Vose, R.S. Reanalyses Suitable for Characterizing Long-Term Trends. Bull. Am. Meteorol. Soc. 2010, 91, 353–362. [Google Scholar] [CrossRef] [Green Version]
  60. Lim, E.P.; Hendon, H.H. Causes and Predictability of the Negative Indian Ocean Dipole and Its Impact on La Niña During 2016. Sci. Rep. 2017, 7, 12619. [Google Scholar] [CrossRef] [PubMed] [Green Version]
  61. Henricksen, B.L. Reflections on drought: Ethiopia 1983–1984. Int. J. Remote Sens. 1986, 7, 1447–1451. [Google Scholar] [CrossRef]
  62. Aparna, S.G.; McCreary, J.P.; Shankar, D.; Vinayachandran, P.N. Signatures of Indian Ocean Dipole and El Niño–Southern Oscillation events in sea level variations in the Bay of Bengal. J. Geophys. Res. Ocean. 2012, 117. [Google Scholar] [CrossRef] [Green Version]
  63. Bahaga, T.; Mengistu Tsidu, G.; Kucharski, F.; Diro, G. Potential predictability of the sea-surface temperature forced equatorial East African short rains interannual variability in the 20th century. Q. J. R. Meteorol. Soc. 2015, 141, 16–26. [Google Scholar] [CrossRef]
  64. Hartmann, D.; Tank, A.K.; Rusticucci, M.; Alexander, L.; Brönnimann, S.; Charabi, Y.; Dentener, F.; Dlugokencky, E.; Easterling, D.; Kaplan, A.; et al. Observations: Atmosphere and surface. In Climate Change 2013 the Physical Science Basis: Working Group I Contribution to the Fifth Assessment Report of the Intergovernmental Panel on Climate Change; Hartmann, D.L., Klein Tank, A.M., Rusticucci, M., Alexander, L.V., Brönnimann, S., Charabi, Y.A.R., Dentener, F.J., Dlugokencky, E.J., Easterling, D.R., Kaplan, A., et al., Eds.; Cambridge University Press: Cambridge, UK, 2013; pp. 159–254. [Google Scholar]
  65. Hastenrath, S.; Polzin, D.; Mutai, C. Diagnosing the 2005 Drought in Equatorial East Africa. J. Clim. 2007, 20, 4628–4637. [Google Scholar] [CrossRef]
  66. Bell, G.D.; Halpert, M.S. Climate Assessment for 1997. Bull. Am. Meteorol. Soc. 1998, 79, S1–S50. [Google Scholar] [CrossRef] [Green Version]
  67. Beck, H.E.; Vergopolan, N.; Pan, M.; Levizzani, V.; van Dijk, A.I.J.M.; Weedon, G.P.; Brocca, L.; Pappenberger, F.; Huffman, G.J.; Wood, E.F. Global-scale evaluation of 22 precipitation datasets using gauge observations and hydrological modeling. Hydrol. Earth Syst. Sci. 2017, 21, 6201–6217. [Google Scholar] [CrossRef] [Green Version]
  68. Xu, W.H.; Li, Q.X.; Yang, S.; Xu, Y. Overview of global monthly surface temperature data in the past century and preliminary integration. Adv. Clim. Chang. Res. 2014, 5, 111–117. [Google Scholar] [CrossRef]
  69. Muñoz-Sabater, J.; Dutra, E.; Balsamo, G.; Boussetta, S.; Zsoter, E.; Albergel, C.; Agusti-Panareda, A. ERA5-Land: An improved version of the ERA5 reanalysis land component. In Proceedings of the 8th Workshop-Joint ISWG and LSA-SAF Workshop, Lisbon, Portugal, 26–28 June 2018; pp. 26–28. [Google Scholar]
Figure 1. Topography in the study region of East Africa (25 ° E to 50 ° E and 13 ° S to 17 ° N).
Atmosphere 11 00996 g001
Figure 2. Average number of stations used per timestep in the interpolation of CRU (Climatic Research Unit) TS4.02 near-surface temperature from 1981 to 2017. Eight is the maximum number of stations used.
Atmosphere 11 00996 g002
Figure 3. Observed near-surface temperature (CRU) averaged over 1981–2017 (a) and difference between ERA-interim (b)/ERA5 (c) near-surface temperatures averaged over 1981–2017 and observed near-surface temperature averaged over 1981–2017. Hatching represents regions where differences are statistically significant at the 1% level.
Atmosphere 11 00996 g003
Figure 4. Correlation between monthly observed (CRU) and monthly ERA-interim (a)/ERA5 (b) near-surface temperatures from 1981–2017. Hatching represents regions where correlation values are statistically significant at the 1% level.
Atmosphere 11 00996 g004
Figure 5. Observed precipitation (CHIRPS) averaged over 1981–2017 (a) and difference between ERA-interim (b)/ERA5 (c) precipitation averaged over 1981–2017 and CHIRPS precipitation averaged over 1981–2017. Hatching represents regions where differences are statistically significant at the 1% level.
Atmosphere 11 00996 g005
Figure 6. Correlation between monthly observed (CHIRPS) and monthly ERA-interim (a)/ERA5 (b) precipitation from 1981–2017. Hatching represents regions where correlation values are statistically significant at the 1% level.
Atmosphere 11 00996 g006
Figure 7. Trend of annual mean near-surface temperature in observations (CRU, (a)), ERA-interim (b) and ERA5 (c) from 1981 to 2017. Hatching represents regions where trends are significant at the 1% level.
Atmosphere 11 00996 g007
Figure 8. Trend of annually aggregated precipitation in observations (CHIRPS, (a)), ERA-interim (b) and ERA5 (c) from 1981 to 2017. Hatching represents regions where trends are significant at the 1% level.
Atmosphere 11 00996 g008
Figure 9. Monthly mean precipitation averaged over longitude band 25 ° E–50 ° E (East Africa box) and time period 1981–2017 from 13 ° S to 17 ° N in observations (CHIRPS, (a)), and the difference between ERA-interim (b)/ERA5 (c) and observations.
Atmosphere 11 00996 g009
Figure 10. Annual precipitation averaged over longitude band 25 ° E–50 ° E and 13 ° S–17 ° N (East Africa box) in observations (CHIRPS, black), ERA-interim (red), and ERA5 (blue) from 1981 to 2017 as annual sums (a) and detrended annual anomalies (b).
Atmosphere 11 00996 g010
Figure 11. 2005 annual precipitation anomalies in East Africa in CHIRPS (a), ERA-interim (b) and ERA5 (c).
Atmosphere 11 00996 g011
Figure 12. 1997 annual precipitation anomalies in East Africa in CHIRPS (a), ERA-interim (b) and ERA5 (c).
Atmosphere 11 00996 g012
Figure 13. Monthly mean near-surface temperature from 1981 to 2017 in observations (CRU) versus ERA-interim (ad) and ERA5 (eh) in the four focus countries (columns). Annual cycle of monthly mean near-surface temperature (il) averaged over the corresponding country as observed (black line), in ERA-interim (blue line) and ERA5 (red line).
Atmosphere 11 00996 g013
Figure 14. Monthly mean precipitation from 1981 to 2017 in observations (CHIRPS) versus ERA-interim (ad) and ERA5 (eh) in the four focus countries (columns). Annual cycle of monthly mean precipitation (il) averaged over the corresponding country as observed (black line), in ERA- interim (blue line) and ERA5 (red line).
Atmosphere 11 00996 g014

