Article

Temporal Variation and Source Analysis of Carbonaceous Aerosol in Industrial Cities of Northeast China during the Spring Festival: The Case of Changchun

1
Key Laboratory of Wetland Ecology and Environment, Northeast Institute of Geography and Agroecology, Chinese Academy of Sciences, Changchun 130102, China
2
College of Resources and Environment, University of Chinese Academy of Sciences, Beijing 100049, China
3
Center of Atmospheric Environment Research, Jilin Provincial Academy of Environmental Sciences, Changchun 130012, China
4
Department of Atmospheric Environment, Jilin Provincial Ecological Environment Monitoring Center, Changchun 130012, China
*
Author to whom correspondence should be addressed.
These authors contributed equally to this study and share first authorship.
Atmosphere 2020, 11(9), 991; https://doi.org/10.3390/atmos11090991
Submission received: 9 August 2020 / Revised: 9 September 2020 / Accepted: 11 September 2020 / Published: 16 September 2020
(This article belongs to the Special Issue Secondary Organic Aerosol Formation and Composition)

Abstract

:
Carbonaceous aerosol, one of the major components of atmospheric aerosols, significantly affects haze episodes, climate change, and human health. Northeastern China suffers severe air pollution, especially in some periods (e.g., the Spring Festival). However, studies on carbonaceous aerosols in typical northeast industrial cities (i.e., Changchun) are rare, limiting further comprehension of the atmospheric haze formation. In this study, we monitored the concentrations of carbonaceous aerosols (i.e., OC and EC) in Changchun during the Lunar New Year of 2018 (i.e., from Lunar 20 December to Lunar 20 January), and analyzed the temporal variation and source contributions via the HYbrid-Single Particle Lagrangian Integrated Trajectory (HYSPLIT) model with the potential source contribution factor weights (PSCF) method. The daily concentrations of OC and EC were 9.00 ± 2.81 and 1.57 ± 0.46 µg m−3, respectively, and were significantly lower at nighttime than at the day during the Spring Festival. The concentrations during the major period (i.e., OC: 8.13 ± 2.93 µg m−3; EC: 1.47 ± 0.47 µg m−3 in festival days), including the Lunar Little New Year; the Lunar New Year’s Eve; New Year’s Day; Lunar 5 January, and the Spring Lantern Festival, were mainly from the northwestward with the wind speed of 4–6 m/s being lower than that of normal period (OC: 9.87 ± 2.46 µg m−3; EC: 1.67 ± 0.44 µg m−3) from the southeastward with a wind speed of 6–7 m/s. The direction of the airflow trajectory was mainly in local, northwestward, and northward, carrying particulate matter and gaseous pollutants. In major period, the daily concentration of atmospheric pollutants presented a bimodal trend, with peaks appearing regularly from 11:00 a.m. to 12:00 p.m. and 5:00 p.m. 10:00 p.m., which might be related to traffic, cooking, and firecrackers. The OC/EC was greater than 2 during the whole period, indicating the generation of secondary organic aerosols (i.e., SOC). This study was essential to understand the formation mechanisms of severe pollution episodes and develop control measures for the industrial cities of Northeast China during the Spring Festival.

1. Introduction

The complex impacts of carbonaceous aerosols (e.g., elemental carbon (EC) and organic carbon (OC)) on air quality, human health, and climate change are of increasing concern in current environmental research [1,2,3]. Previous studies have confirmed that EC and OC are derived from the primary aerosol from incomplete biomass combustion, road transport, shipping, industrial production, and the secondary organic matter generated by chemical reactions, respectively [4,5,6,7]. Quantifying the concentration level, clarifying spatiotemporal characteristics, identifying emission sources, and exploring variation combined with the external environment (i.e., meteorology and topography) are necessary to understand carbonaceous aerosols [8,9,10]. Hoverer, the different terrain, population density, socioeconomic status, and industrial distribution lead to a complex mixture of various aerosol types [11,12] which increases the difficulty of studying source analysis and transformation mechanism of carbonaceous aerosols. Furthermore, carbonaceous aerosols from the same region in different periods, especially haze-episode periods (i.e., the Chinese Lunar New Year), have distinguishable behaviors in terms of formation mechanisms, chemical conversions, and extinction, limiting the application of regional air quality models [13,14,15]. Therefore, systematic scientific research on carbonaceous aerosols are necessary to carry out to clarify the emission characteristics, spatiotemporal distribution, and source analysis in typical periods of haze in cities.
To date, a series of studies on carbonaceous aerosols have been conducted around the world to estimate the emission characteristics, pollution sources, and chemical conversion mechanisms of typical particulate matter (i.e., PM2.5: PM with a diameter of less than 2.5 µm; PM10: PM with a diameter of less than 10 µm) during haze. Kalita et al. examined the seasonal variability and long-term trends of aerosol distribution over Southeast Asia, finding that the contribution of carbon aerosols from biomass burning and biogenic emissions to the columnar distribution of satellite-based aerosol optical depth (AOD) before the monsoon season (March–May) reached about 60% [16]. Rai et al. assessed the seasonal transport trends and potential source regions of different carbonaceous species of PM10 over the Eastern Himalaya, and evaluated the seasonal transport pathway of carbonaceous aerosols by Backward trajectories, cluster analysis, and concentration-weighted trajectory (CWT) analysis [17]. Ramírez et al. studied the characteristics and temporal variations of organic and elemental carbon aerosols in a tropical high-altitude megacities in Latin America, quantitatively estimated the SOC concentration based on the EC-tracing method, and found the peak concentrations of SOC measured in the months with the highest temperature, indicating their photochemical origin. [18] In the megacities of China (i.e., the Beijing region), long-term observation experiments were carried out to observe the daily and seasonal variation of atmospheric carbonaceous aerosols, exhibiting higher values in the winter than in spring and lower values during the day than at night [19]. Yan et al. provided a comprehensive episode-based analysis of size-resolved carbonaceous aerosol compositions during the winter to understand the spatiotemporal characteristics and its role in haze formation in the central plain urban agglomeration of China [20]. Yin et al. conducted off-line sampling of PM1 by high topographic relief in typical urban agglomerations in mountainous terrain (i.e., western Sichuan Basin, China) to analyze the vertical profiles of carbonaceous aerosols and their key influencing factors in wintertime [21]. However, studies on the variation characteristics and source analysis of atmospheric carbonaceous aerosol for frequent haze episodes periods (i.e., the Spring Festival) are insufficient.
Northeastern China, a well-known site of heavy industry, suffers from air pollution that has been recognized as adversely affecting human health [22]. In recent years, various atmospheric researches in Northeast China have focused on the emission characteristics of anthropogenic sources, the long-term analysis of pollution source in a certain region, or the description of the pollution situation [23,24,25]. Gao et al. reported vehicle emissions in Northeast China, analyzing the temporal and spatial dynamics of transport emissions [26]. Li et al. analyzed the yearly indoor/outdoor PM2.5 concentrations of colleges and universities in Northeast China from the perspective of health effects [27]. Li et al. took a typical agriculture-dominated city (i.e., Suihua) as an example to investigate the characteristics and causes of atmospheric pollution and evaluated the straw burning prohibition [28]. However, comprehensive research on the characteristics and pollution distribution of key pollutants (i.e., carbonaceous aerosols) during the process of haze formation in a specific period, especially during the Spring Festival, which involves concentrated haze episodes, has not been conducted.
Based on a case study in Changchun, the objective of this study is to reveal the emissions characteristics, spatiotemporal distribution, and pollutant sources of carbonaceous aerosols during the Spring Festival (i.e., from 20 December to 20 January of the lunar calendar) in a typical industry-dominated and haze-prone region (i.e., northeastern China), using the HYSPLIT model and PSCF method. The study period was subdivided into major period (i.e., the Lunar Little New Year: 8 February 2018; the Lunar New Year’s Eve: 15 February 2018; New Year’s Day: 16 February 2018; Lunar 5 January: 20 February 2018; and the Spring Lantern Festival: 2 March 2018) and normal period, comparing the carbon concentration variation and emission sources. The results of this work clarified the emission sources and transmission trajectory of atmospheric carbonaceous aerosols in the typical period of Changchun, which will provide an empirical reference for the local government to predict haze events.

2. Methodology

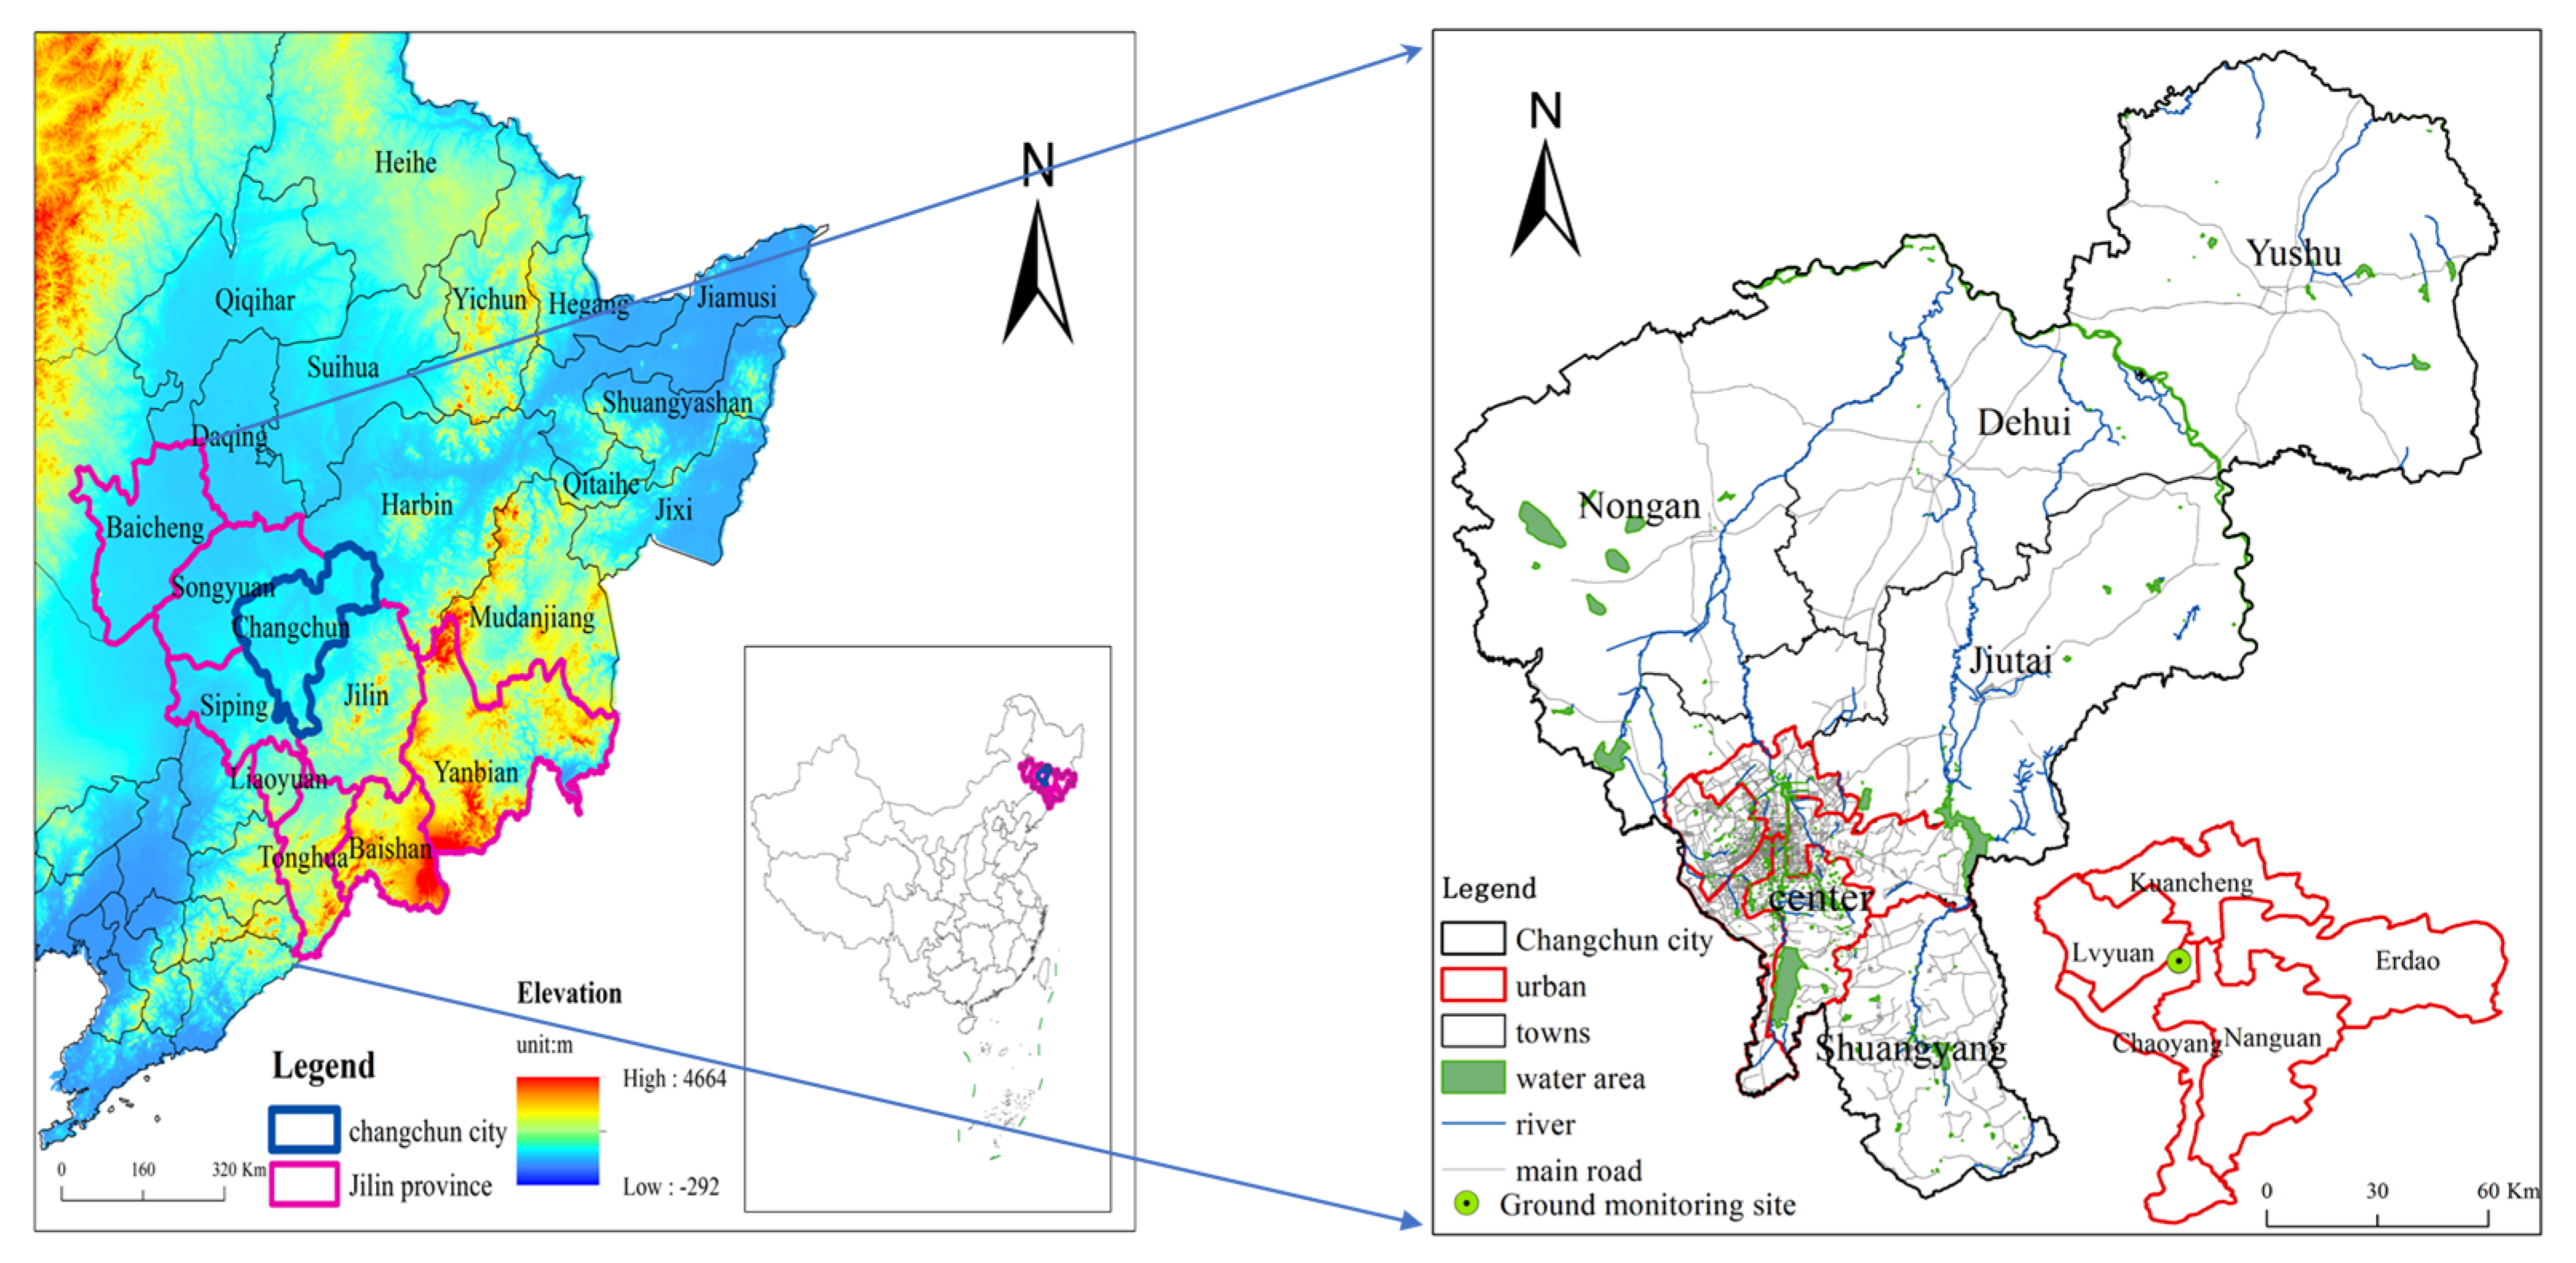
2.1. Study Region and Monitoring Site

Changchun, the capital of Jilin Province, lies at 43°05′ N–45°15′ N and 124°18′ E–127°05′ E. The city has a population of over 7.5 million and comprises an area of 20,565 km2. It is located in the middle of the northeast plain, which is the junction of the Songnen Plain and the Songliao Plain, and is higher in the east than in the west (Figure 1). It is the natural geographic center of Northeast China, delimited by the cities of Songyuan to the northwest, Siping to the southwest, Jilin to the southeast, and Harbin to the northeast. The local climate is characterized by a continental monsoon with four distinct seasons. The average annual temperature is 5.65 °C, with the mean coldest month (i.e., January) temperature of −15.1 °C and the hottest month (i.e., July) temperature of 23.1 °C. Based on regional climate characteristics, the winter generally runs from November to March of the following year, accompanied by long-term low temperature and continuous intense heating. Changchun is a major grain production base in China, having a crop-sown area of 1.326 million hectares and a grain output of 8.646 million tons in 2018 [29]. As a significant node city of the “Belt and Road” northern line and core city in the Harbin–Changchun cities agglomeration, which is defined under the guidance of the “National New-type Urbanization Plan (2014–2020)” in China [30], Changchun is the birthplace of the automobile industry, optoelectronic information, and applied chemistry [31].
Changchun is a typical industrial city in northeastern China and a high haze pollution region in China [32]. The Changchun Environmental Quality Report in 2017 demonstrated that the annual average value of fine particulate matter (i.e., PM2.5, the annual concentration average is 46 µg/m3) and inhalable particulate matter (i.e., PM10, the annual concentration average is 78 µg/m3) exceeded the limits of the secondary standard of “Ambient Air Quality Standards” (GB3095-2012) by 0.31 and 0.11 times, respectively. The number of days with mild pollution or above (i.e., the air quality index (AQI) is greater than 150) on an annual scale are 86, accounting for 23.8% of the total monitoring days [33], of which more than 80% occur in winter. In the state-approved “Harbin–Changchun Conglomeration Development Plan” [34], the regional atmospheric pollution problem in late autumn and early winter, especially during the Spring Festival, was also explicitly raised. In response to the haze events during this period, the government stated clearly in “The 13th Five-Year Plan for the Revitalization of Northeast China” [35] its intent to tackle the pollution problem. Although Changchun implemented a “Firecrackers Burning Prohibition Policy” during the Spring Festival in 2016 to reduce the particulate matter in the environment [36], the firecracker-burning phenomenon still occurs frequently, especially in regions other than urban construction areas. Previous studies have shown that firecrackers release a large amount of carbonaceous aerosols, which significantly promotes the formation of extreme haze episodes.
The monitoring site (43°51′49″ N, 125°17′30″ E) is located in the Chaoyang District, which is the central urban region in Changchun (Figure 1). This region has large population densities and developed traffic, and road congestion often occurs during commuting hours. Moreover, the sampling site is adjacent to the four cities of Nong’an, Jiutai, Dehui, and Yushu in the north, where is the main distribution area of countryside. A few industrial sources are located in the vicinity of the monitoring site. The experimental campaign was launched from 5 February 2018 to 7 March 2018. All hourly pollutants data were collected from this monitoring site.

2.2. Data Source

2.2.1. Atmospheric Carbon Aerosol Data

In this study, hourly atmospheric OC/EC concentrations were measured continuously using an automatic monitoring OC/EC analyzer (Model 4, Sunset Laboratory Inc., Tigard, OR, USA) during the Spring Festival (from 20 December to 20 January of the lunar calendar in 2018), which is considered as the peak period for winter heating and fireworks. The analytical instruments use a thermal optical transmission method, mainly composed of a sampling system, chemical analysis, laser, and CO2 monitoring system. Particles containing carbonaceous aerosols were captured by a round 16-mm quartz filter (Whatman QM-A, 16 mm, Whatman, Maidstone, UK), and then heated incrementally in a nonoxidizing environment (i.e., pure helium gas) through an automatic temperature-raising program, causing the organic carbon to be volatilized, while the same sample was gradually heated in a helium/oxygen (He/O2) mixed gas environment, during which black carbon was oxidized and decomposed into gaseous oxides. The decomposition products generated in the above two steps would be oxidized to CO2 through an oxidation furnace filled with manganese dioxide (MnO2), which was detected quantitatively using a nondispersive infrared (NDIR) detector.

2.2.2. Real-time Pollutants and Meteorological Data

Real-time local atmospheric pollutant concentrations, including PM2.5, PM10, SO2, NO2, O3 (i.e., 1-h average concentration), and CO during the Spring Festival in 2018 were obtained from the monitoring site in Jilin Provincial Ecological Environment Monitoring Center. These data were not only used to characterize the pollutant spatiotemporal variation but also to explore the internal connection with carbonaceous aerosols. Moreover, we also obtained real-time meteorological data of the same monitoring site, including temperature, relative humidity, precipitation, wind direction, wind speed, horizontal visibility, which were used to explore the relationship between pollutants and meteorological factors.

2.3. Air-Mass Backward Trajectories

Evaluating the backward trajectory is a common method to determine the source region and movement of pollutants within the atmosphere [37,38]. The long-distance pollutants transmission from other regions are generally considered to play a vital role in local haze episodes [39]. Therefore, it is necessary to determine the long-term transport characteristics and potential emission sources of pollutants. In this study, the backward trajectory model was applied along with real-time pollution concentration data of Changchun to compute the backward air flow of major period during the 2018 Spring Festival. The Global Data Assimilation System (GDAS), provided by the National Environmental Forecast Center (NCEP) [40], was (metrological data: GDAS 0.5°) used in the backward trajectory model to determine the transport pathways of the pollutant air mass from its potential source areas to the monitoring site. The meteorology from GDAS at spatial resolution of 0.5° × 0.5° is the most commonly used for backward trajectory studies [41,42]. The meteorological factors include ambient temperature, atmospheric pressure, relative humidity, surface precipitation, horizontal and vertical wind speeds, and directions. The HYbrid-Single Particle Lagrangian Integrated Trajectory (HYSPLIT) model was run by using Openair packages under software R3.6.2 [43]. In brief, 72 h back trajectory analyses were carried at a height of 500 m to minimize the impact of surface turbulence [44,45], thereby identifying the dominating backward trajectory clusters and found the contributions of target areas in the following research [46]. Backward trajectory analysis produces large trajectories and created the spatial area of the air parcel reaching the recipient site.
The potential source contribution factor weights (PSCF) is the receptor-based model to calculate the probability that a source is located at latitude and longitude widely used to indicate the potential source and its spatial distribution [47,48]. Ara Begum et al. assessed the ability of the PSCF analysis method against the known source locations of wildfires and found that it performed well for PM2.5, EC, and OC [49]. PSCF is a gridded statistical analysis method based on the backward trajectory model, which can obtain the distribution of the potential source regions along the trajectory to the receptor site, semiquantitatively, and analyze the pollution characteristics of different trajectories and potential source areas [50]. In this study, we explored the distribution of potential sources of PM2.5, which was considered as the primary pollutant during research period, based on the PSCF method. The PSCF algorithm is displayed as follows:
PSCF = m ( i , j ) n ( i , j ) ,
where n(i,j) is the total residence time that the trajectories passed through the cell (i,j) and m(i,j) is the total residence time that the source concentration exceeds a specified threshold when the trajectories passed through the cell (i,j). The limit value of PM2.5 adopted in the study is 75 μg/m3, which is the limits of the secondary standard of “Ambient Air Quality Standards” (GB3095-2012).

2.4. Estimation of Secondary Organic Carbon (SOC)

Generally, Secondary organic carbons (SOC) were considered to be generated when the OC/EC concentration ratio is higher than 2 [51]. It is not possible to obtain direct SOC measurements due to the complex physical and chemical processes involved, thus, an indirect method was used. In this study, the SOC concentrations was estimated by the empirical formula of Turpin et al., based on minimum OC/EC ratios [52]. This method uses EC as a tracer for primary OC, and assumes that EC is not affected by photochemical oxidation reactions, and the ratio of primary OC/EC remains constant throughout the process. The concentration of SOC was computed using the following equation:
SOC = OC total ( OC EC ) min × EC
where SOC is secondary organic carbon, and OC and EC are the real-time local environmental concentrations, respectively.

2.5. Data Analysis

By the design of various pollutants’ concentration over time, the temporal characteristics of air pollution during the research period are determined. PollutionRose, which is a function of openair package in R improved by Carslaw [43] is used to not only visually reflect the meteorological conditions of various regions but also to qualitatively describe the spatial distribution of heavy pollution by counting the wind direction and wind speed in a certain area. The hourly pollutant concentrations (i.e., TC, OC, EC, PM2.5, PM10, SO2, NO2, CO, and O3) and meteorological conditions (e.g., wind speed and wind direction) were determined to analyze the relationships between them. The correlation between various pollutants was also displayed quantitatively to explore their internal potential connections.
The statistical procedures and plotting were performed using SigmaPlot 14.0 (SPSS Inc., Chicago, IL, USA) and ArcGIS 10.4.1 (Esri, Redlands, CA, USA) software. The PollutionRose drawing and backward trajectory analysis were adopted by software R3.6.2 (R Development Core Team, 2009).

3. Results and Discussion

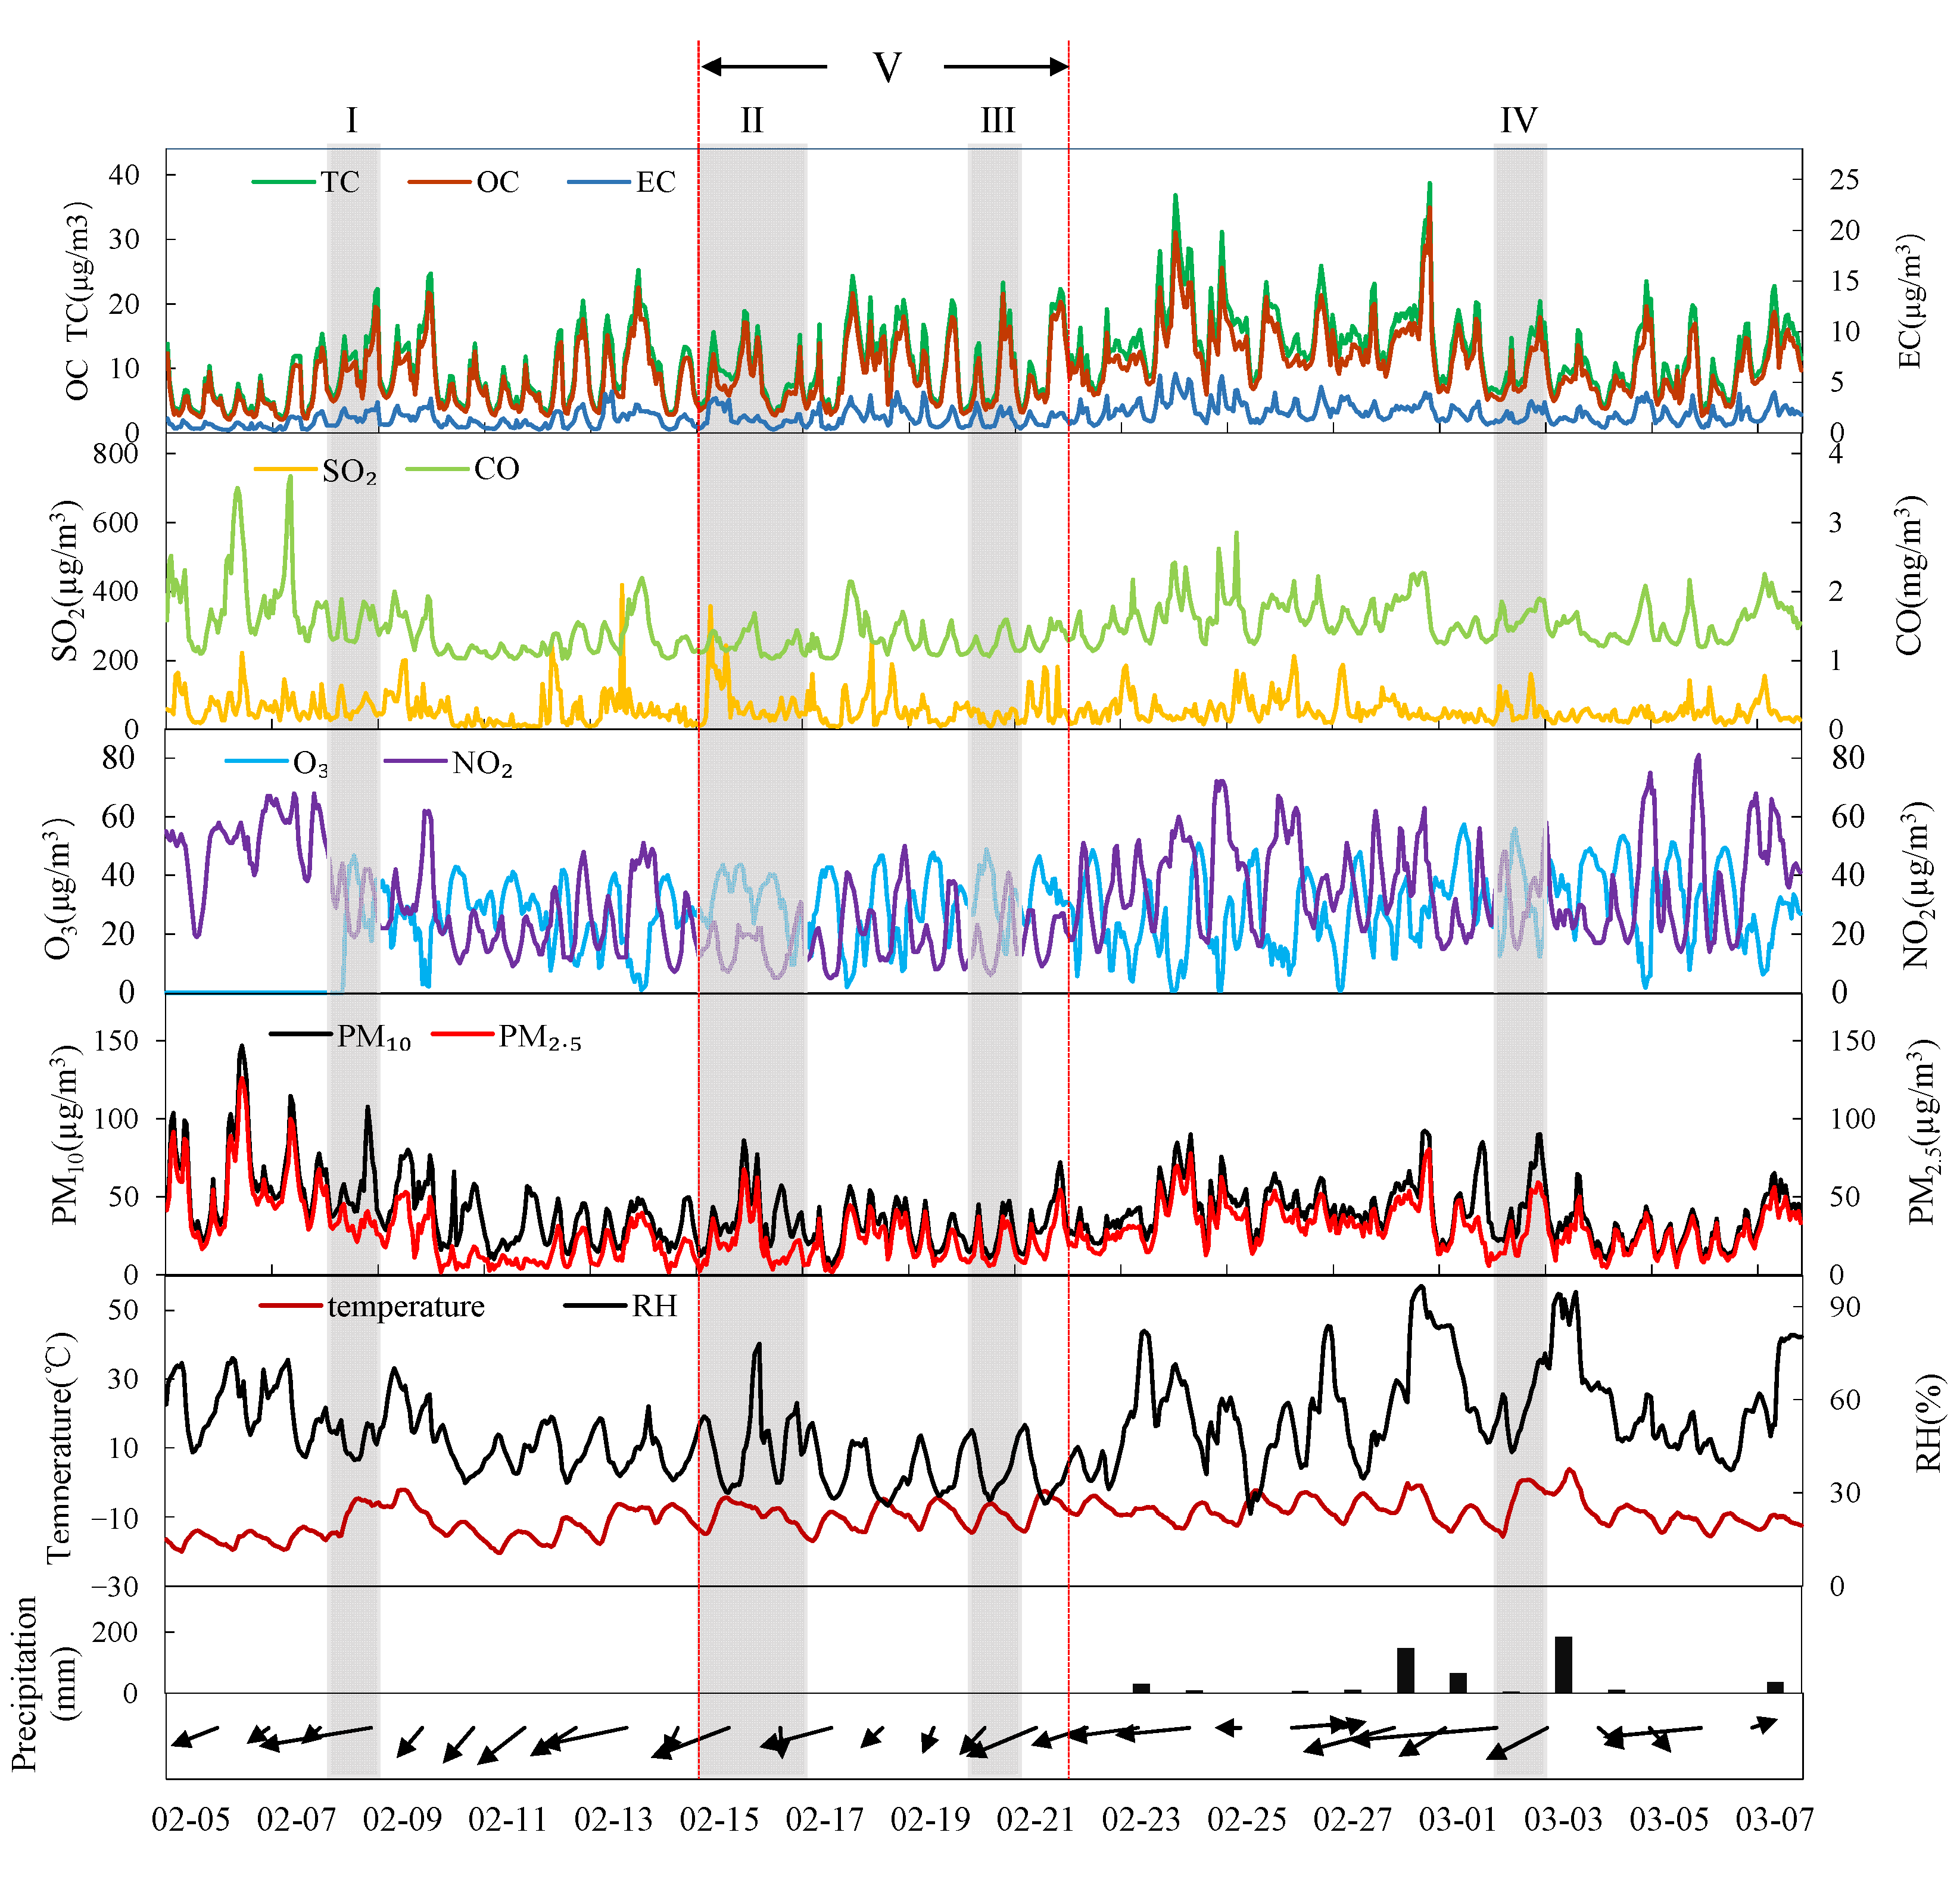
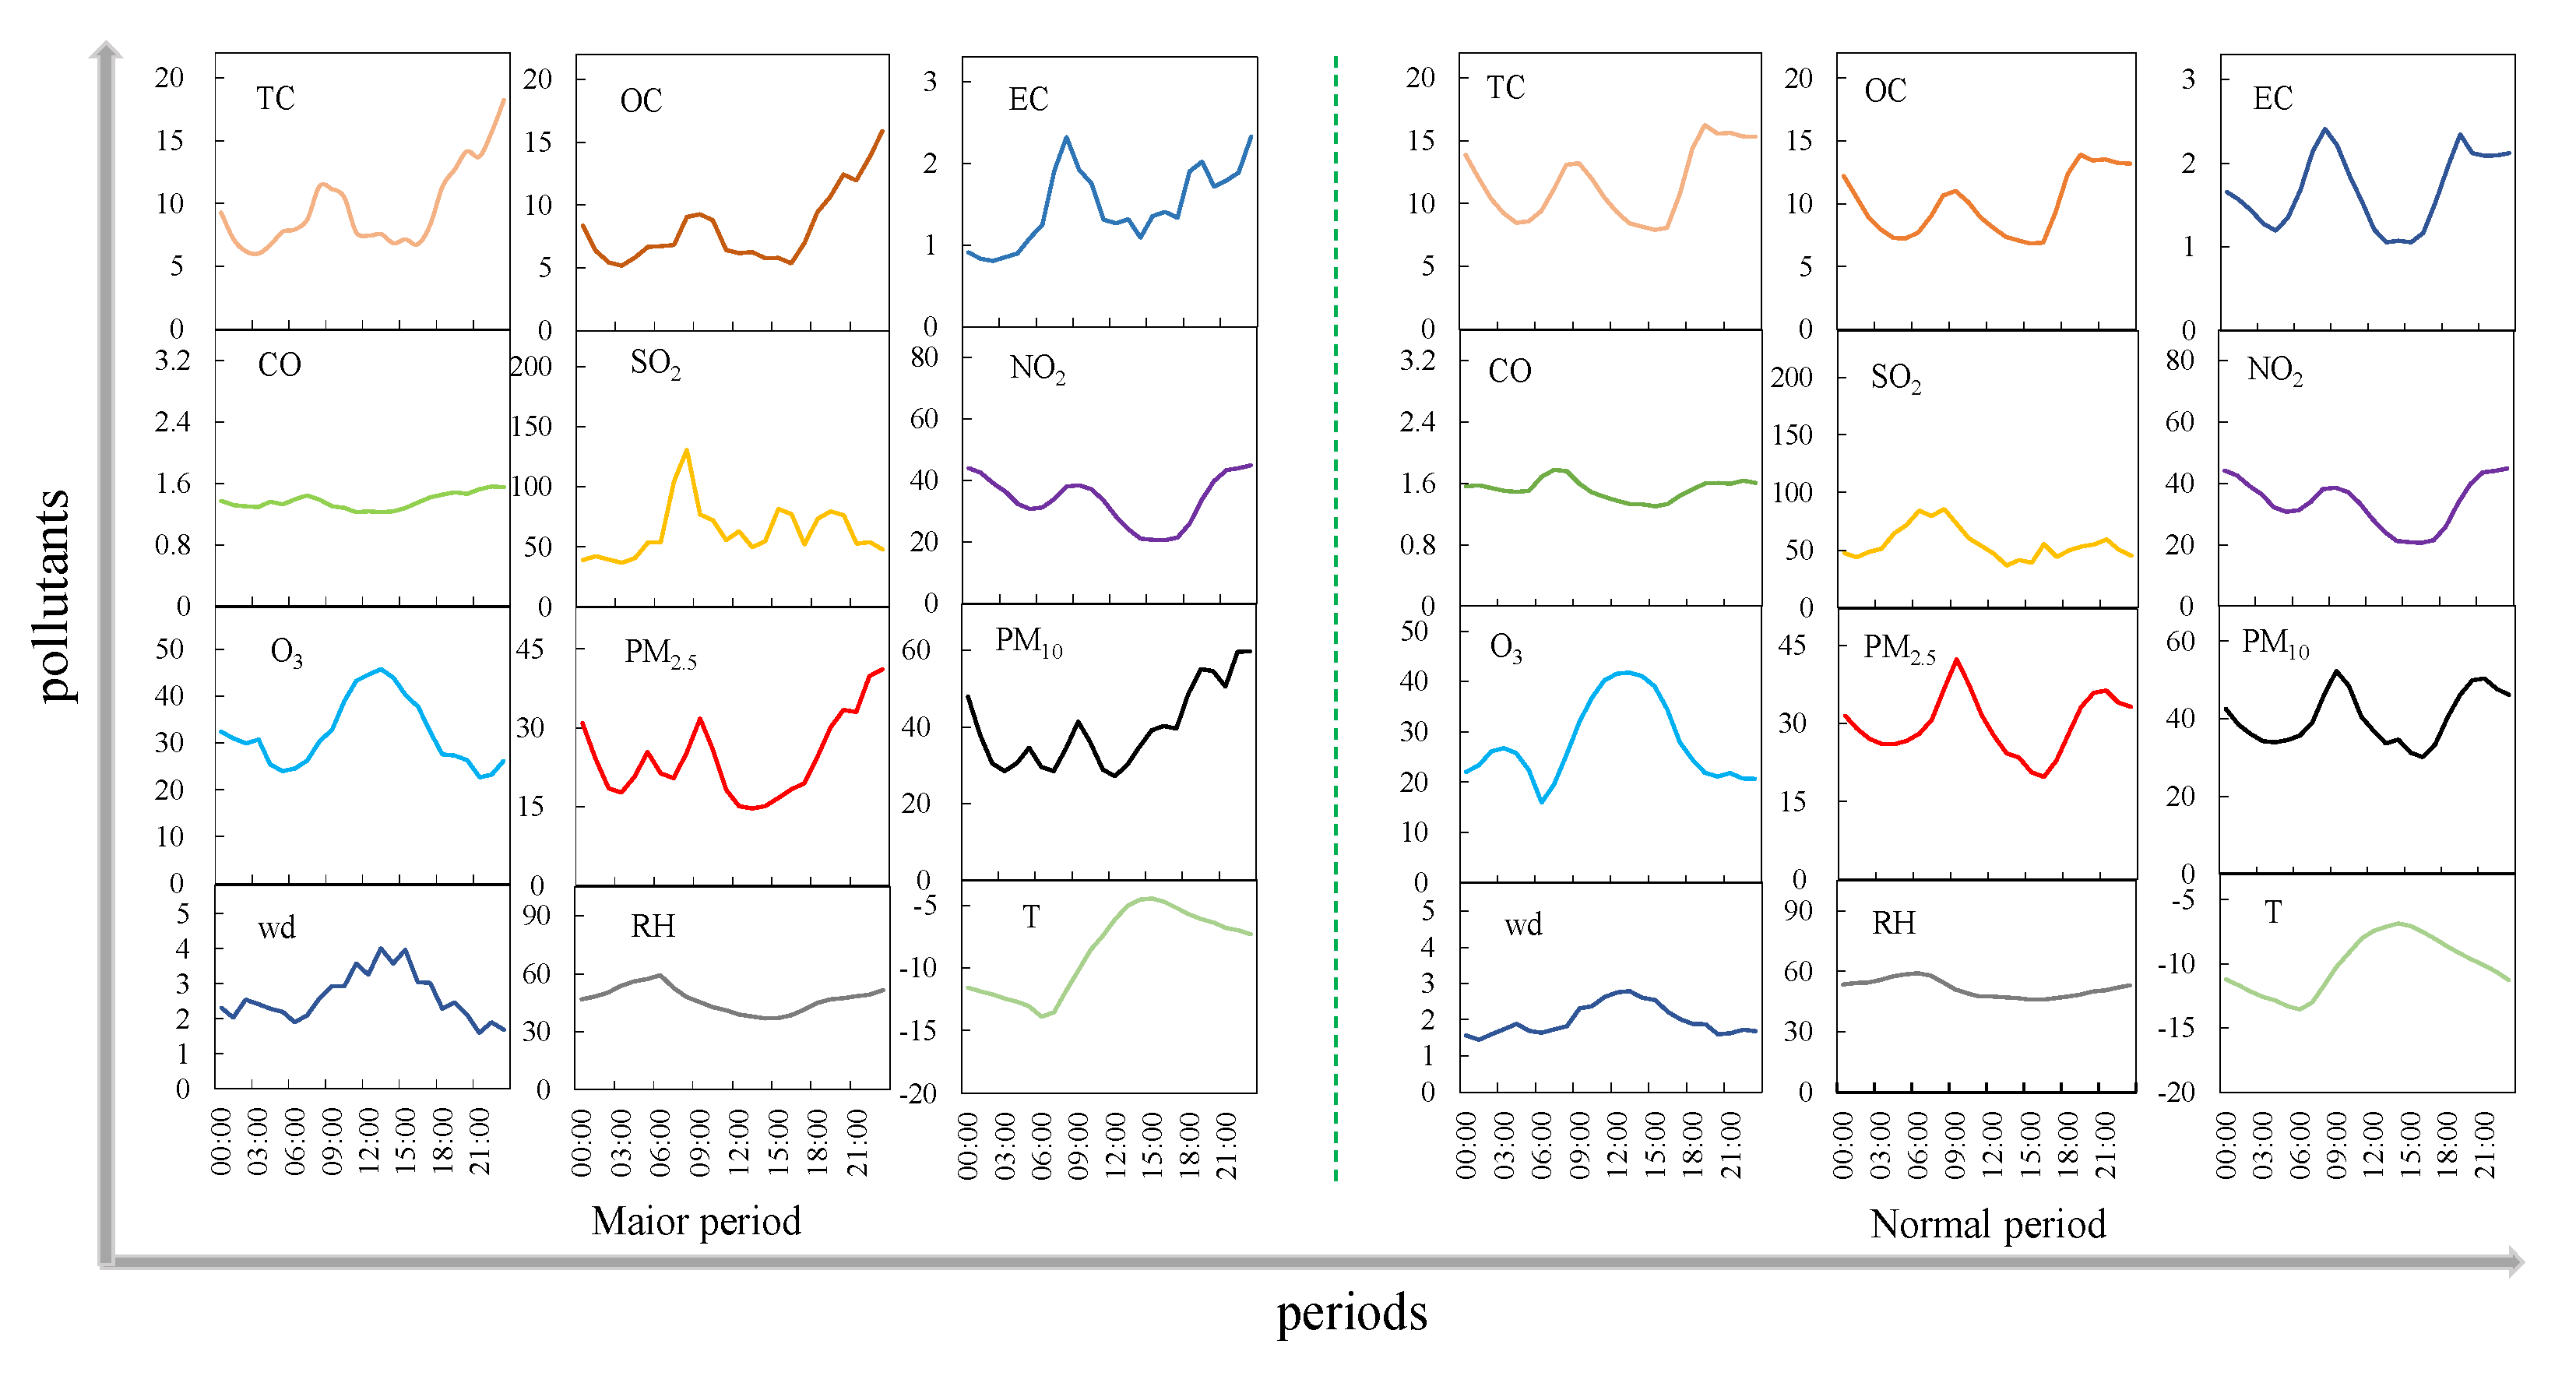
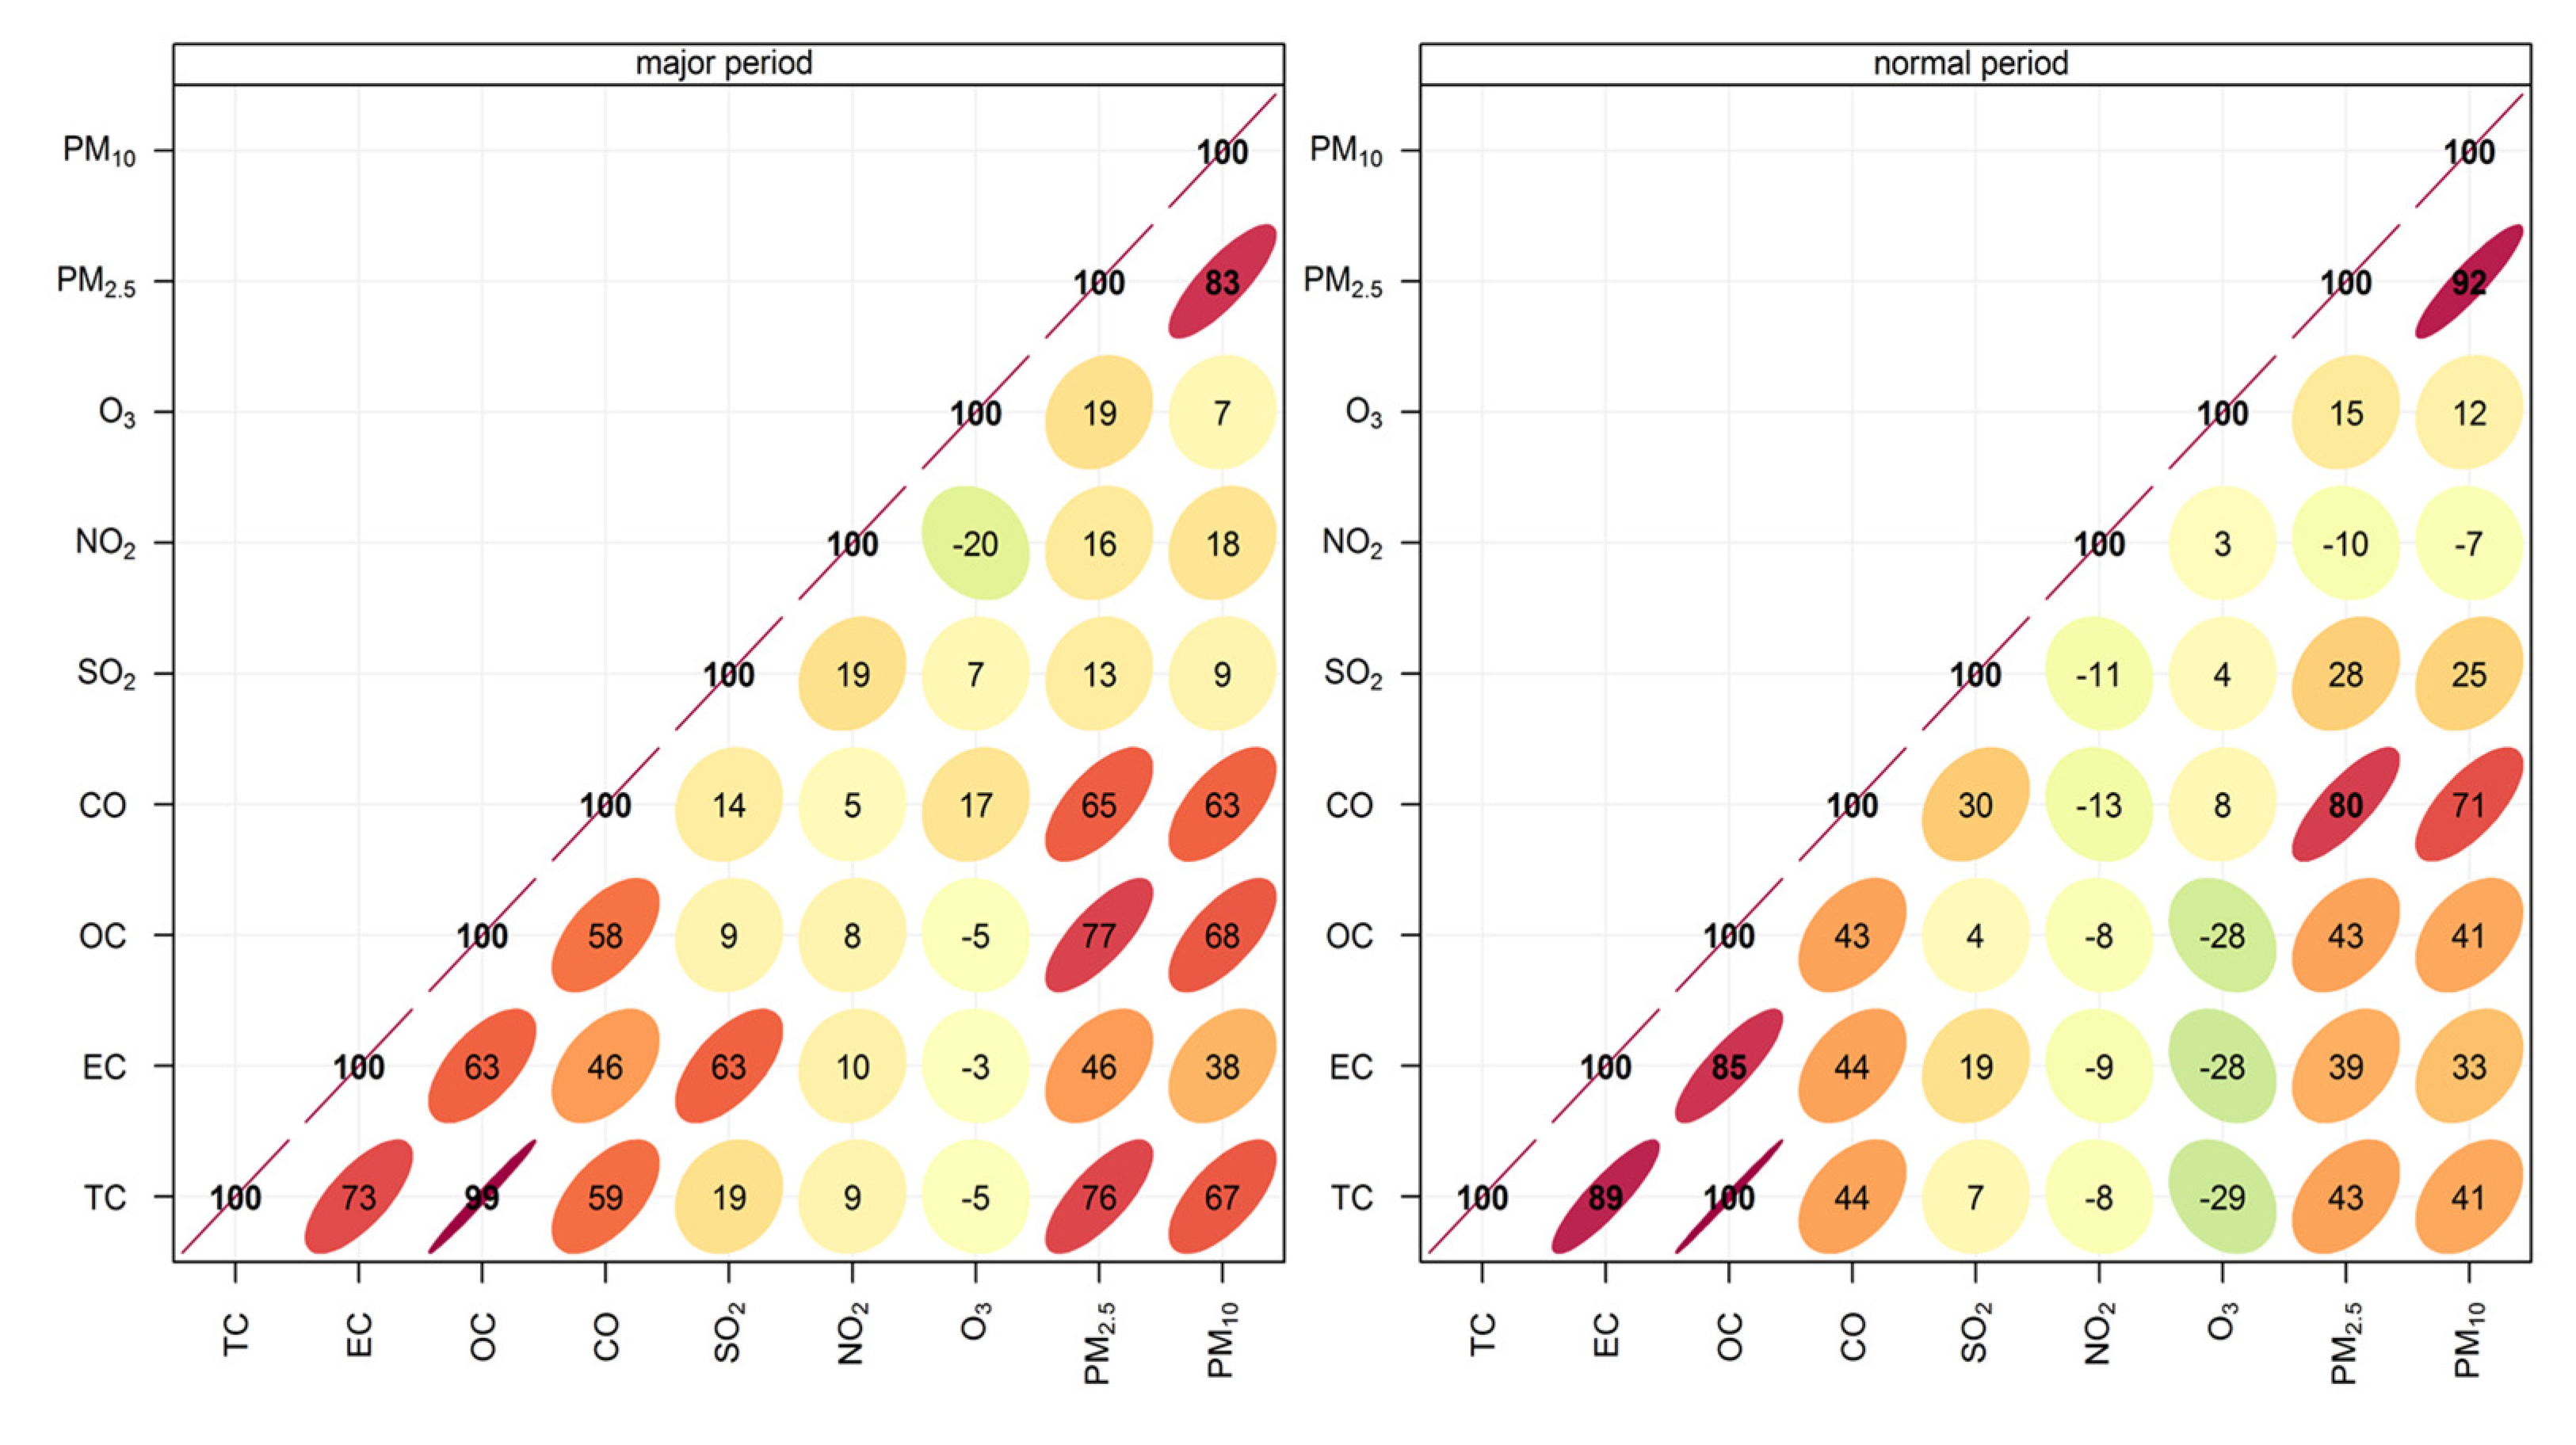
3.1. Temporal Variation of Pollutants

The average values of TC, EC, OC, CO, SO2, NO2, O3, PM2.5, and PM10 in the study period were 10.57 ± 3.19 µg/m3, 1.57 ± 0.46 µg/m3, 9.00 ± 2.81 µg/m3, 1.44 ± 0.14 mg/m3, 59.24 ± 18.73 µg/m3, 27.92 ± 9.11 µg/m3, 30.02 ± 7.92 µg/m3, 26.95 ± 7.23 µg/m3, and 39.82 ± 8.69 µg/m3, respectively (Table 1). The average concentration of SO2 during the entire period was close to the limits of the secondary standard of “Ambient Air Quality Standards” (GB3095–2012) (i.e., the annual average concentration limit of the secondary standard is 60 µg/m3), which might be related to the high-intensity coal-burning emissions from large power plants and industrial production, considered as the largest sources in the northeastern winter in previous studies [53]. Apart from this, small domestic heating boilers burn coal in some regions, especially in rural households and suburban areas, which would observably increase the atmospheric concentration of SO2 because of low-quality coal and backward exhaust gas treatment devices [54]. Simultaneously, fireworks in marginal regions would also increase the SO2 concentration in a specific period [55]. The atmospheric concentrations of carbonaceous aerosols in normal period, whether OC or EC, were greater than in major period, which indicated that more carbon-intensive activities were concentrated during the normal period. Similar variation trends were seen for PM2.5 and PM10. However, the concentrations of SO2, NO2, and O3 had completely different trends: the concentrations during the major period were approximately 1.1–1.5 times those of the normal period. Comparing with the major period, higher relative humidity, lower temperature, and lower wind speed were seen in the normal period, which created an environment that would encourage pollution incidents.
The hourly concentration variations of pollutants during the above festivals are illustrated in Figure 2 and Figure 3. In the major period, the daily concentration of all pollutants presented a bimodal trend, with peaks appearing regularly from 11:00 a.m. to 12:00 p.m. and 5:00 p.m. to 10:00 p.m., which might be related to the increase in human activities and the unfavorable meteorological conditions. Concentrated cooking activities during the first peak period (i.e., 11:00 a.m. to 12:00 p.m.) began to take place, especially in suburban and rural areas, where cooking mainly relies on traditional coal-fired stoves. Massive burning of coal was the main source of pollutants (e.g., PM, SO2, NO2, and CO) during this period [56], while higher relative humidity would further increase the nucleation and aggregation of fine particulate matter, promoting particle formation [57]. Compared with the first concentration peak, the second peak started at 5:00 p.m. and ended at 10:00 p.m., showing a continuous upward trend, with a peak that was higher than that of the former. Complicated factors caused this phenomenon. First, concentrated coal burning for cooking was still the major cause of rising pollution. Afternoon cooking activities in the northeast winter are generally done from 5:00 p.m. to 6:00 p.m. [58], which is consistent with the time when pollution started to rise. Continuous pollutant release from domestic coal during dinner was reported by Liu et al., and the proportion in the evening was higher than that of other periods [54]. Second, lots of firecrackers being burned aggravated the air pollution. Burning firecrackers, as the essential form of celebration during the major festivals, was recorded in urban, suburban, and rural areas. Previous studies have shown that firecracker emissions during the Spring Festival may increase the atmospheric concentrations of PM10, SO2, and NO2, manifesting a rise from 6:00 p.m. and a decrease from 12:00 a.m. [55], which was consistent with the firecracker use in Changchun, indicating that the rising pollutant concentration in this period is inseparable from the burning of firecrackers. Wind direction is a crucial parameter for the regional pollution as it indicates the origin of the air mass and the relative position of the measuring sites to the main sources [59,60]. In this study, the wind direction in this region was mainly northeast or northwest, with the average wind speed of 2.14 m/s. In addition to anthropogenic emissions, poor meteorological environmental factors (i.e., lower ambient temperature, higher relative humidity, lower atmospheric boundary layer height, and lower wind speed) also adversely affect pollutant diffusion and deposition [61].
Significant differences were found in terms of the diurnal variation of various pollutants and meteorological indicators during major and normal period (Figure 3). The results highlighted that carbonaceous aerosols (i.e., OC and EC) and atmospheric particulate matter (i.e., PM2.5, PM10) had the highest concentration peaks at 6:00 p.m. and decreased significantly thereafter during normal period; on the contrary, the atmospheric pollutants concentration during major period would continue to rise after 6:00 p.m. and reached a maximum at 12:00 a.m., with concentrations much higher than the daily average. This is similar to what was reported by Hao et al. [62] when studying the variation characteristics of atmospheric pollutant concentration during the fireworks-burning period of the Spring Festival in Tianjin, indicating that the sharp rise in pollution concentrations during the same time in Changchun might also be affected by the short-term concentrated fireworks. In addition, the lower wind speed after 6:00 p.m. during the major period in 2018 hindered pollutant diffusion and increased its accumulation in the atmosphere. The PM2.5 and EC concentrations were significantly higher at 9:00 a.m. compared to at other times in major or normal period, which might be caused by the emissions of road vehicles. Previous studies have shown that traffic emissions played a key role in the increase of PM2.5 and EC concentration in the diurnal variations, especially at specific period (i.e., daily rush hour) [63]. Changchun is densely populated, with over 7.5 million people and 1.7 million motor vehicles. During the normal period, the increase in the concentration of OC and EC from 8:30 a.m. to 9:30 a.m. is mainly due to the emission of workers’ motor vehicles. Compared with the normal period, most workers would enjoy a short holiday to celebrate the Spring Festival during the major period, and the shopping behavior will increase significantly, resulting in an increase in the frequency of motor vehicle use. Moreover, low temperature significantly promoted traffic emissions (e.g., PM2.5 and BC) of the cold-start process has been showed by Gao et al.’s research into on-road emissions in low-temperature areas in the winter (i.e., Changchun) [26].
The correlations between the nine pollutant concentrations in this study during the Spring Festival of Changchun in 2018 were displayed for the major and normal period, showing a clear difference between them (Figure 4). The correlation coefficient between OC and EC in normal period is 0.85, which represents a better correlation, being significantly higher than in the major period (i.e., 0.63). Cao et al. and Turpin et al. reported that the source of carbon aerosol particles can be distinguished by the relationship between OC and EC—a better correlation indicates more unitary pollutant sources released [52,64]. In this study, the correlation of OC and EC during the normal period was higher than during the major period, demonstrating that the source of carbonaceous aerosol was relatively simple, which might reflect the combined contribution of vehicle exhaust gas and coal-fired heating [65]. By contrast, the coefficient of major period was low, reflecting the more complicated source of atmospheric carbonaceous aerosol during this period. The major period of the Spring Festival is generally considered as the concentrated time of firework burning, which would release a large amount of pollutants in a short time (e.g., heavy metal ions, black carbon, and particulate matter), increasing the chemical transformation of atmospheric substances [66]. Although Changchun has implemented a Firecrackers Burning Prohibition Plan (FBPP) since 2016, many regions (i.e., suburban areas and rural areas) still burn firecrackers as the most common form of celebrating the Chinese New Year, limiting the effectiveness of the control policy. The correlation coefficient between SO2 and PM2.5 was less than 0.3, displaying a weak correlation whether in the major or normal period, which directly reflects the positive effect of ultralow emission coal-fired power plants due to the coal combustion in power or heating plants being the foremost source of the above emissions during the winter in the northeastern China. CO and PM2.5 illustrated a strong correlation throughout the study period, especially in normal period, when the value was above 80, possibly caused by insufficient coal combustion from domestic heating boilers.

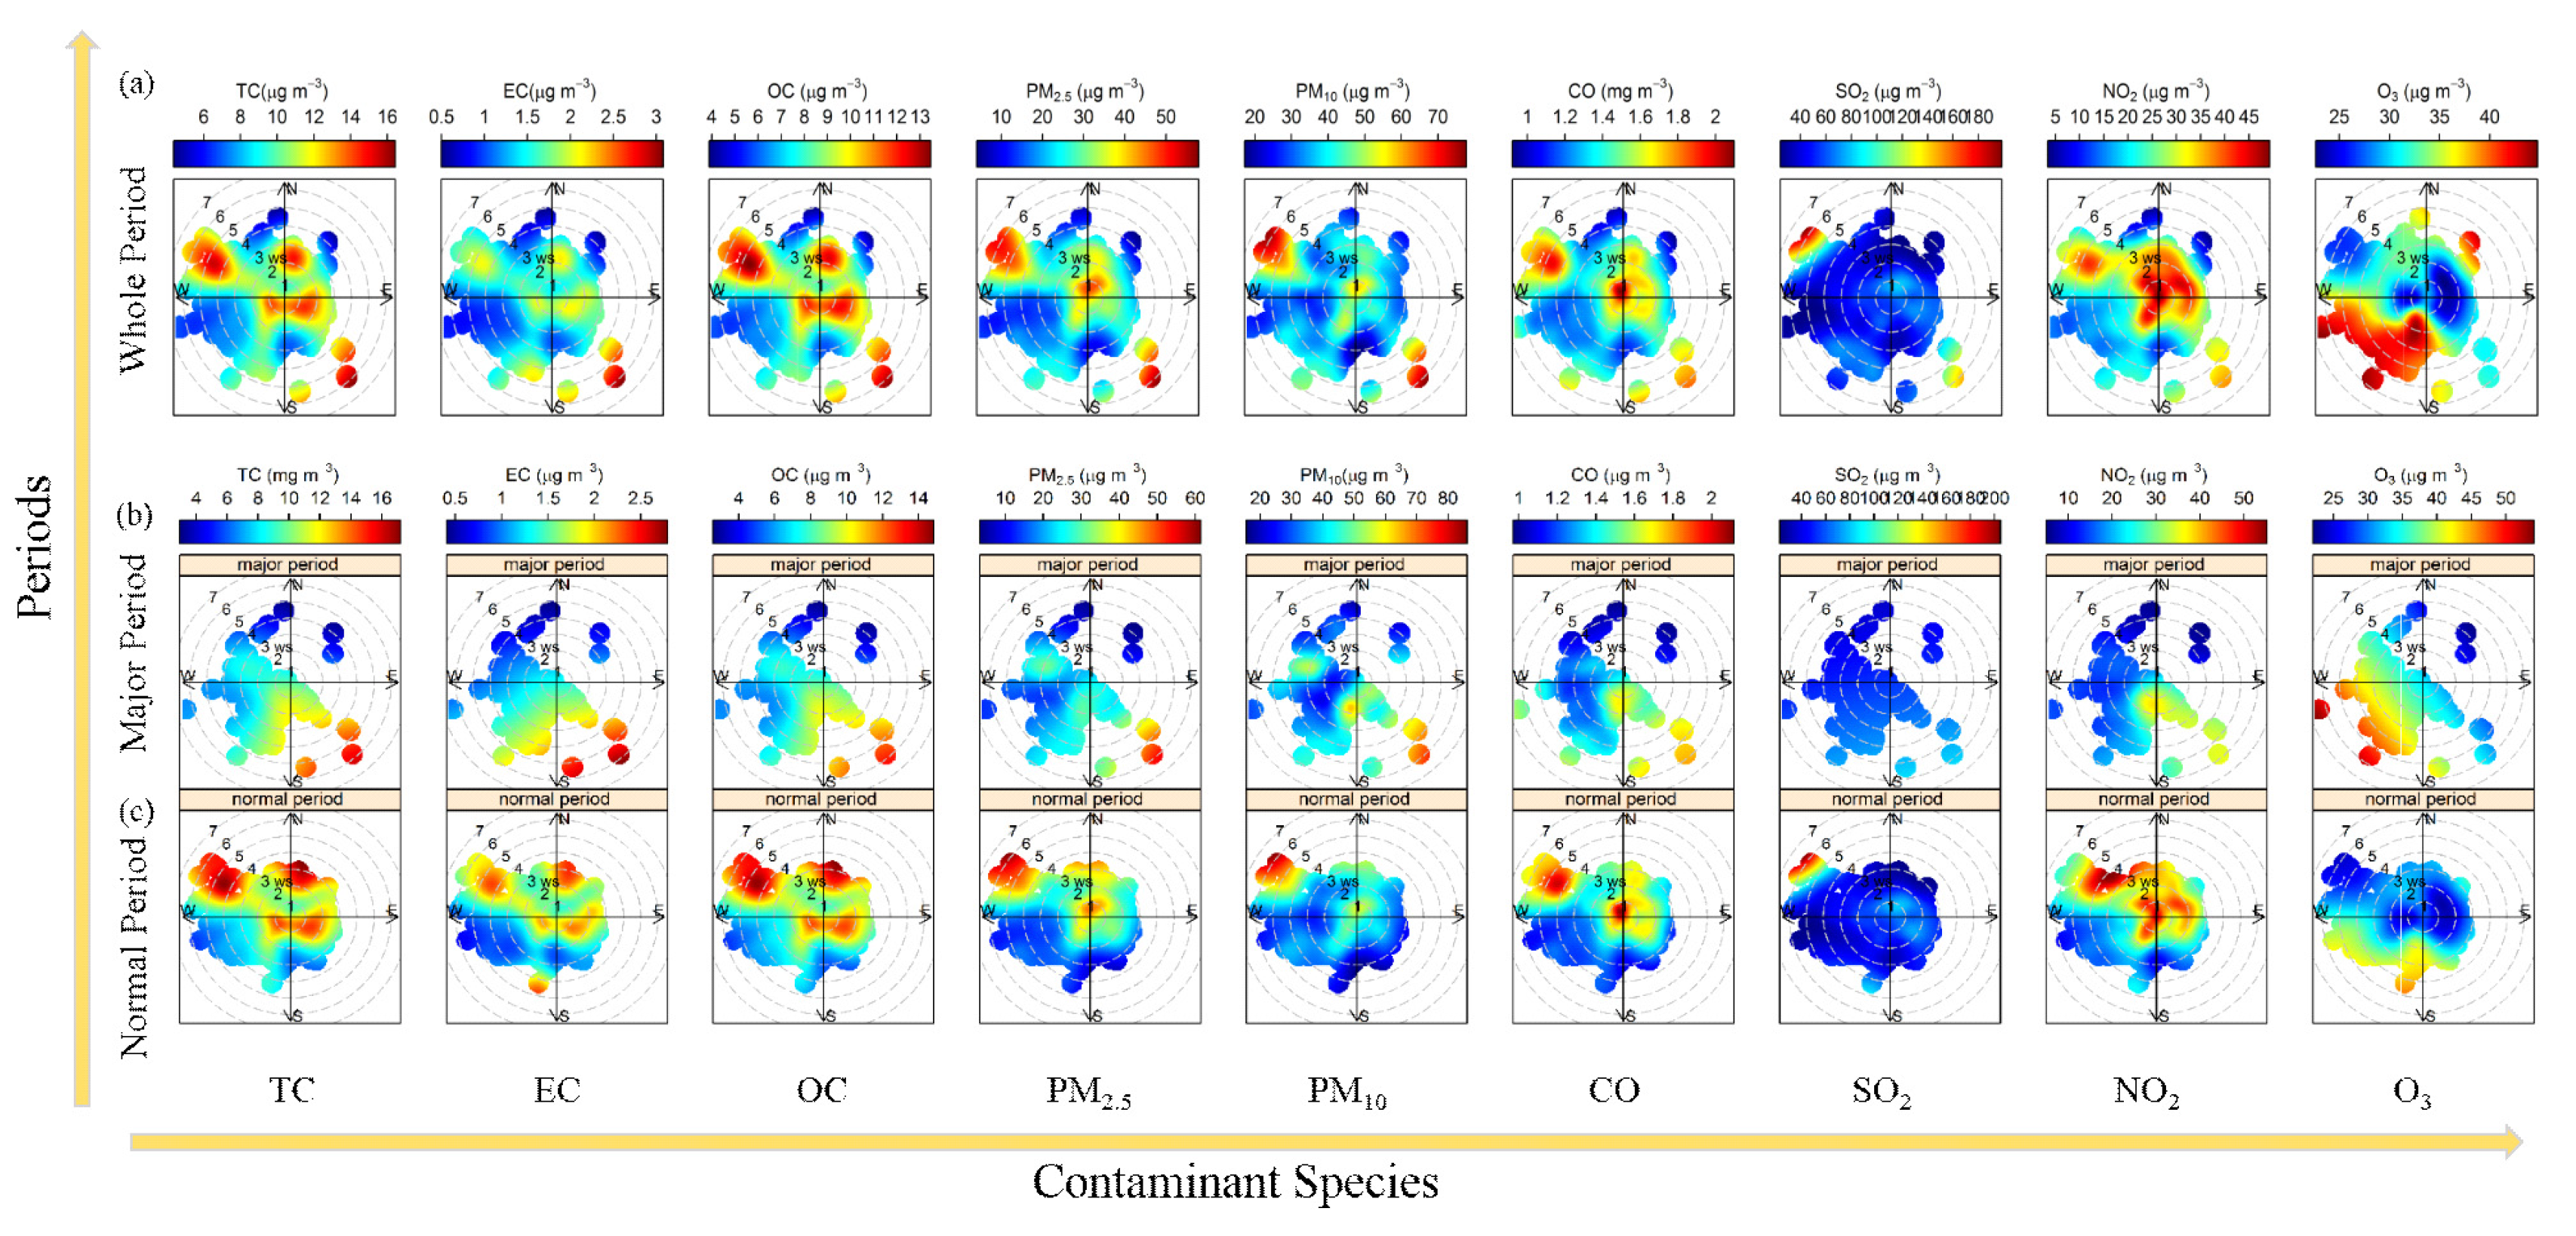
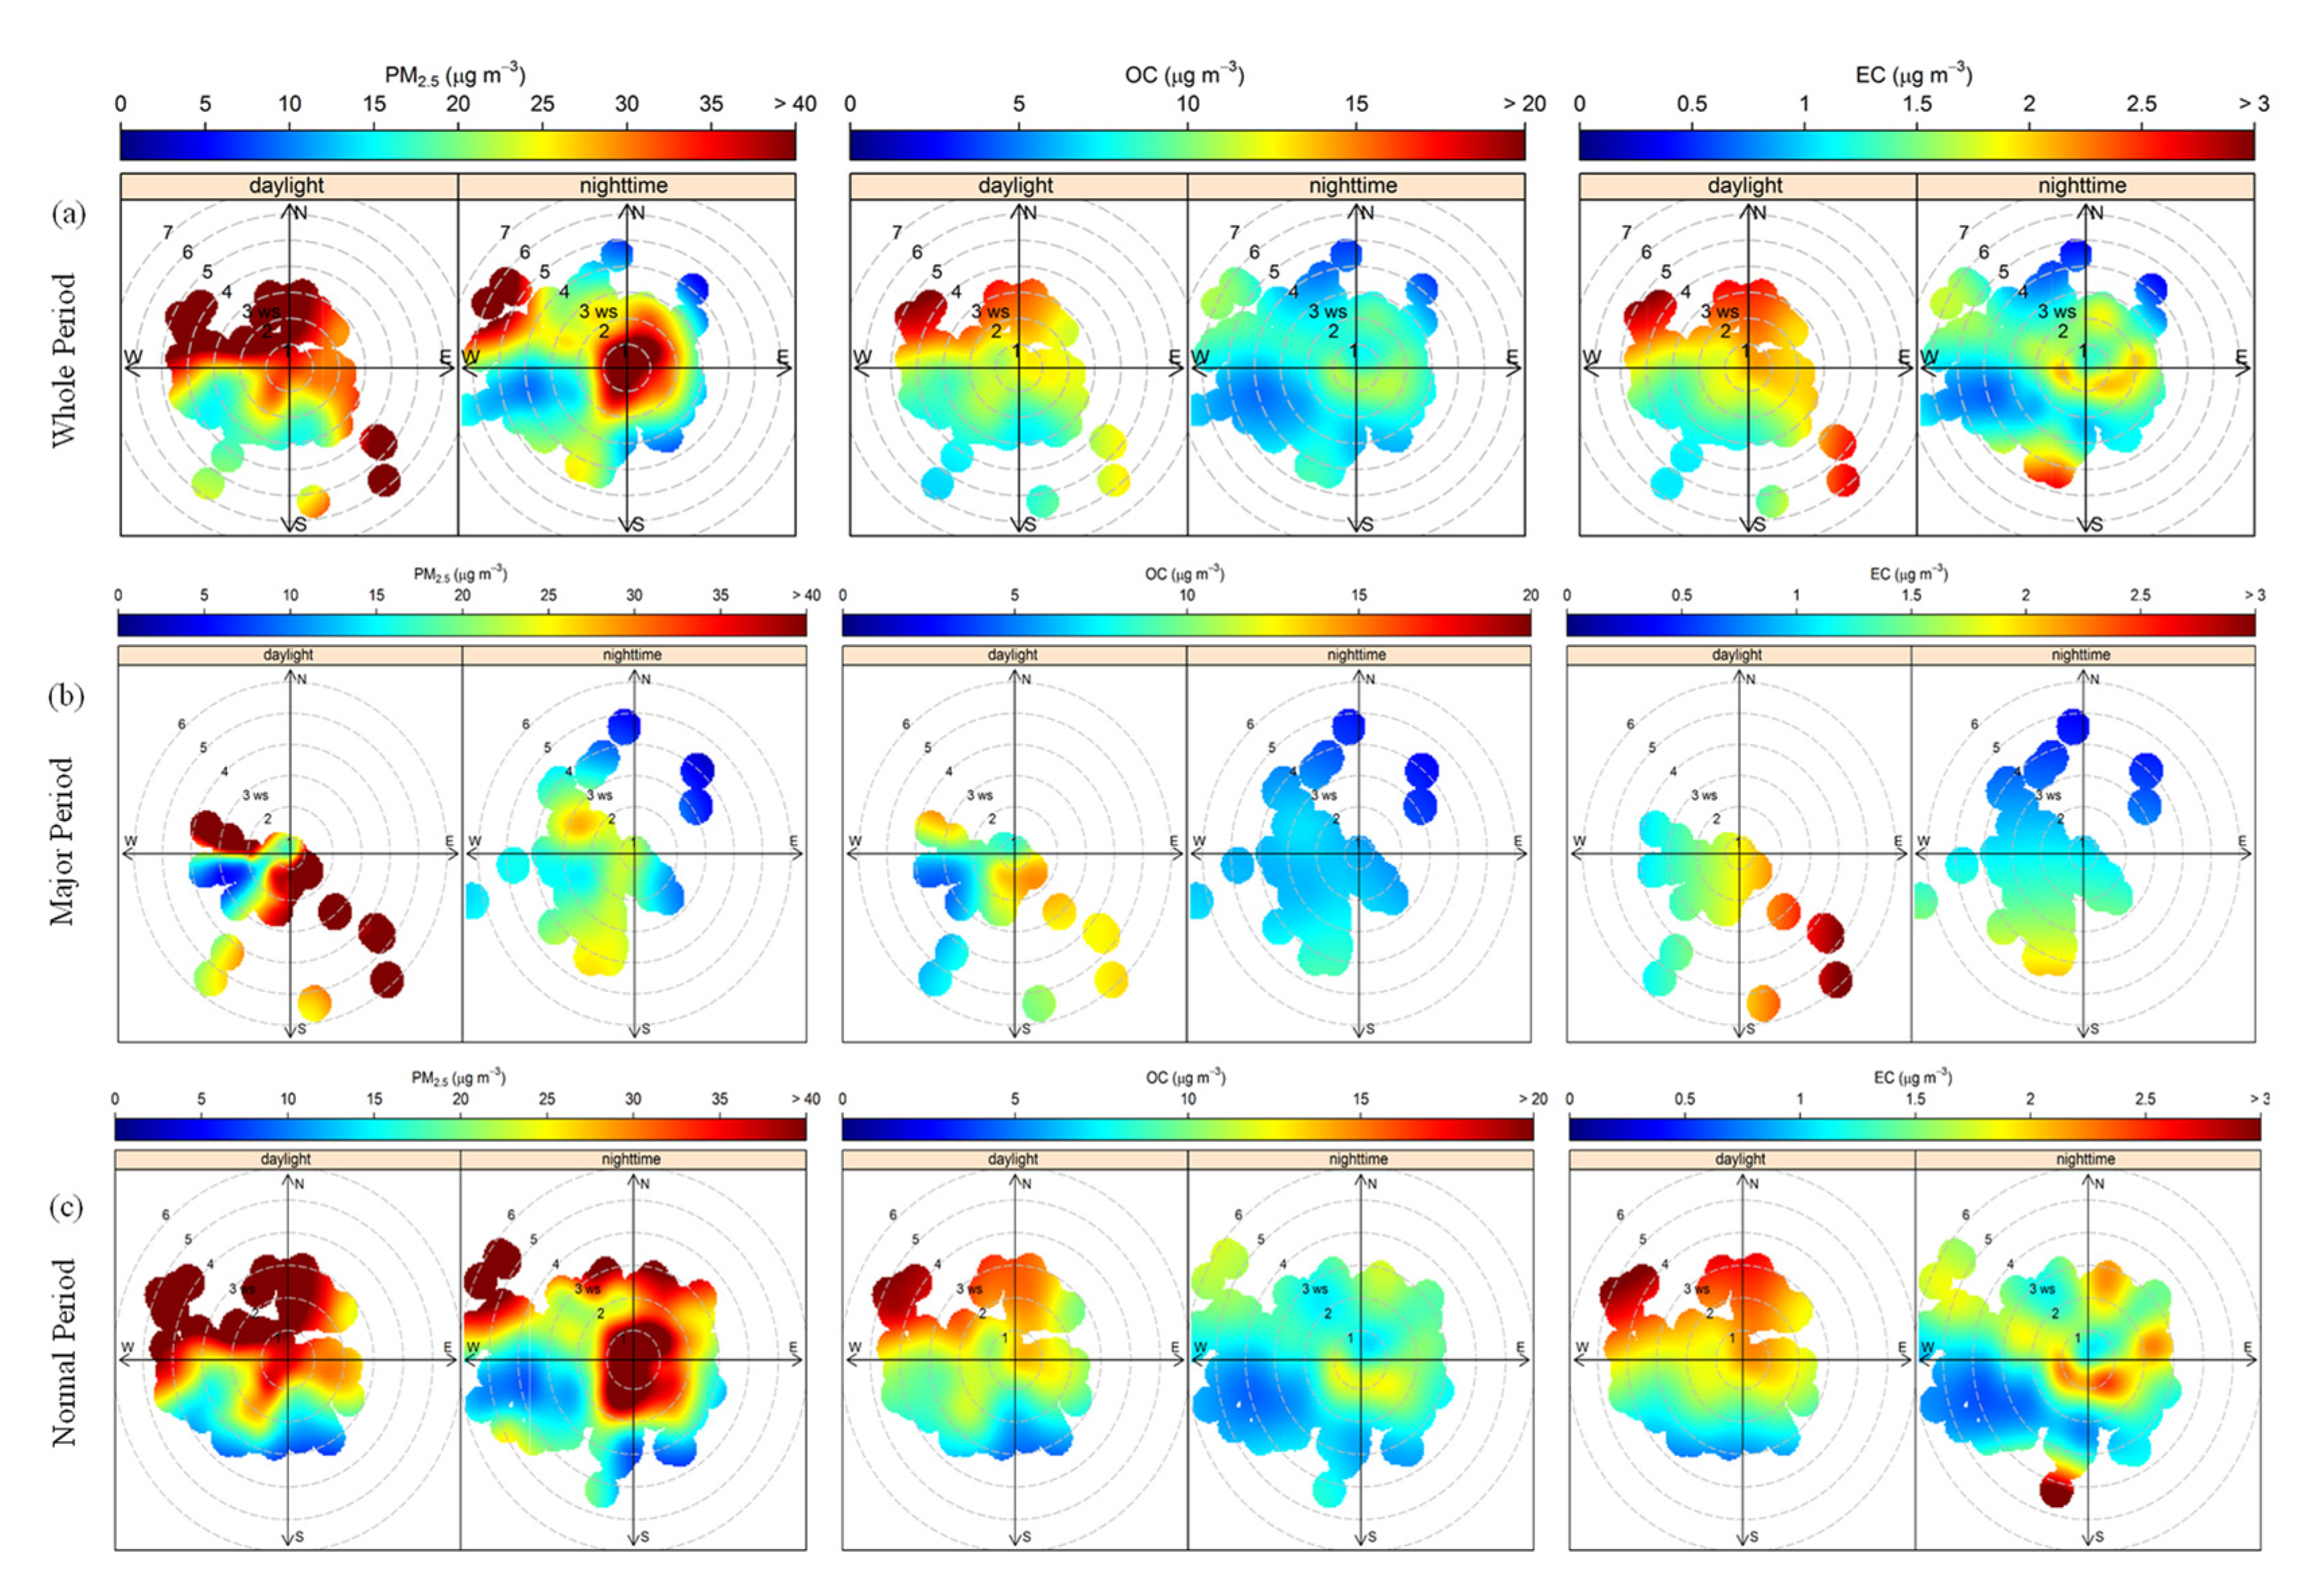
3.2. Relationship of Pollutants with Wind Speed and Wind Direction

The regional transmission of pollutants was also influenced by different wind directions and wind speeds [67,68]. In the whole period, the areas with high concentrations of TC, OC, PM2.5, CO, and SO2 were attributed largely to the northwesterly, southeasterly, and southerly wind with speed of 4–7 m/s; while high values of NO2 and O3 were from northwesterly and southwesterly wind with speeds of 3–7 and 1–6 m/s, respectively (Figure 5a). Generally, the pollution situation in the normal period was more serious than in the major period. Except for O3, the pollutant mass concentration during the normal period was highly similar during the whole period, occurring mainly in the local emission and northwesterly wind with speed of 0–7 m/s. Compared to the normal period, high pollution levels appeared to the southeast during the major period, with the wind speed of only 5–7 m/s (Figure 5b,c).
Analyzing the relationships between EC, OC, and PM2.5 and wind speeds and wind directions, which were highly correlated during the study period, can help us to improve our understanding of spatiotemporal variation and identify sources of carbonaceous aerosols (Figure 6). A significant influence of wind speed and wind direction was found in this study on the concentration distribution of PM2.5, OC, and EC, which varied between daylight and nighttime. For the whole period, a high PM2.5 concentration was recorded north of the monitoring site, with wind speeds of 1–5 m/s in the daylight, which was higher than at nighttime; the PM2.5 pollution that occurred around the station at nighttime was more serious, which explains why the release of fine particles dominates the local emissions during this period. The concentrations of OC and EC from the north at nighttime was obviously lower than in the daylight, indicating that the initial carbonaceous aerosol emissions were mostly concentrated in the daylight, which was consistent with the concentration variation of PM2.5. It is noted that nighttime PM2.5 concentrations greater than 40 µg/m3 appeared in the central region and the surrounding regions had a low or calm wind state (i.e., the hourly wind speed was 1–3 m/s).
The relationships among pollutant concentrations, wind directions, and wind speeds, divided by different periods, suggested that more intensive emissions occurred during the normal period and were concentrated in the northwestern and surrounding regions of the monitoring site. On the one hand, the factories were closed during major holidays, greatly reducing emissions; on the other hand, high pollutant concentrations were regularly concentrated northwest of the monitoring site, where the rural and suburban areas are located. Pollutant emissions were closely related to local human activities and regulatory policies, especially fireworks-burning prohibitions during the period. Thus, large-scale illegal fireworks burning, coupled with the meteorological conditions, resulted in higher pollutant concentrations in rural and marginal areas.

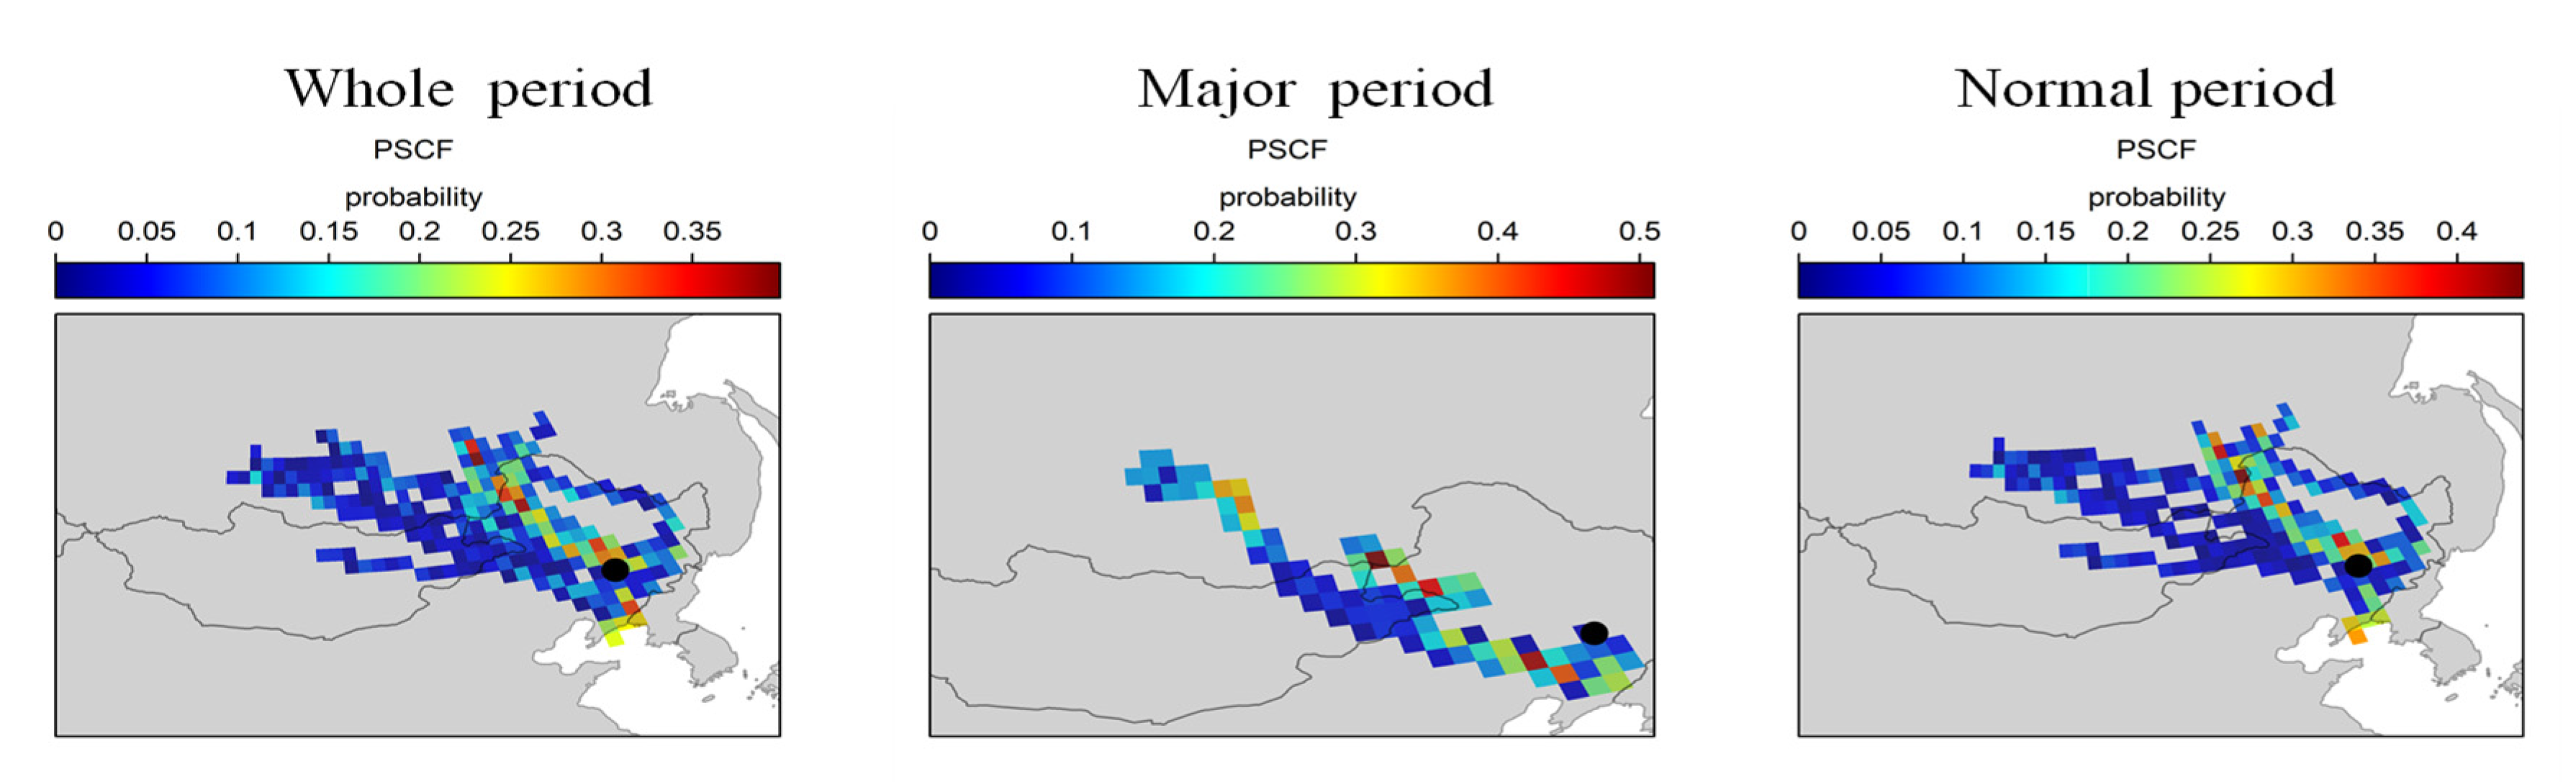
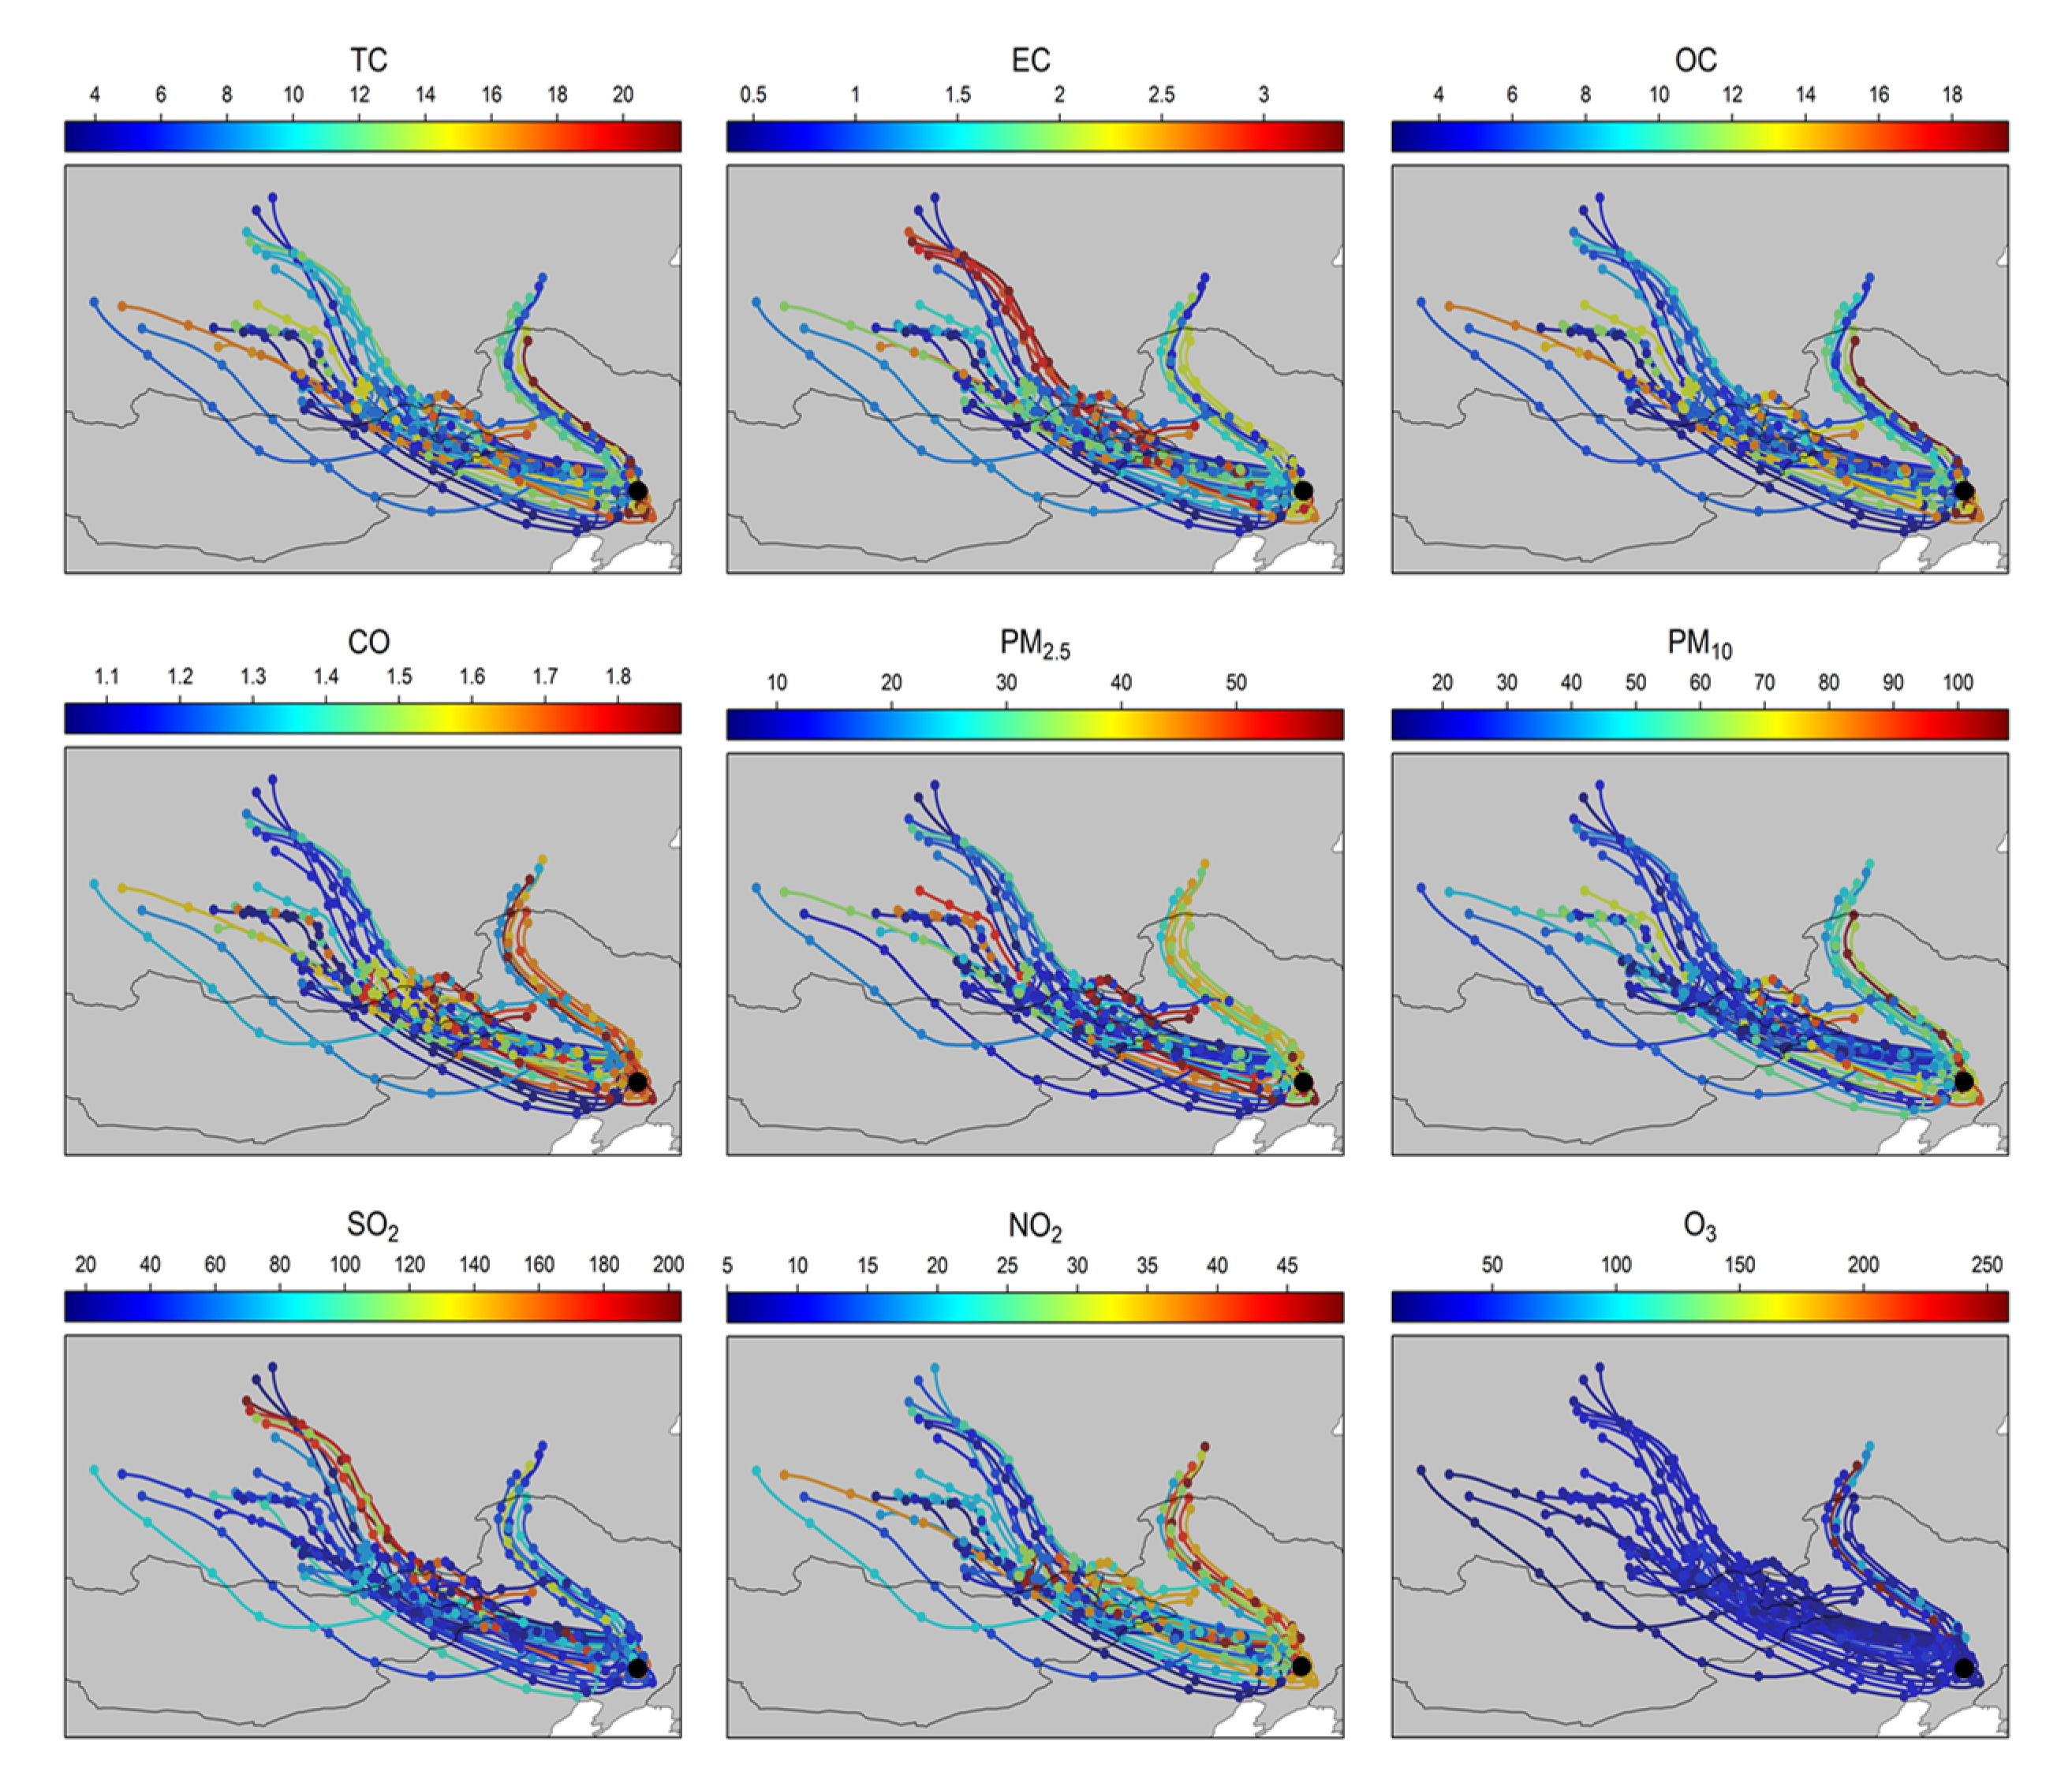
3.3. Pollutant Transportation Trajectories and Potential Sources

The backward trajectory, an analysis method for atmospheric pollutants transport and diffusion, was used with pollutant concentration data to compute the backward air flow trajectories, characterizing the influence of air mass from the source direction on the pollutant’s concentration during the major festival period in Changchun (Figure A1). The direction of the airflow trajectory was mainly in local, northwestward, and northward, carrying a large amount of particulate matter and gaseous pollutants, but clear differences in terms of the contribution of various pollutants to the overall concentration can be observed from the three directions. Regarding carbonaceous aerosols (i.e., OC and EC) and particulate matter (i.e., PM2.5, PM10), the pollutants were mainly based on local pollution sources, followed by the long-distance transportation from the northwest airflow trajectory from eastern Mongolia, Inner Mongolia, Baicheng, and Songyuan, and a fraction of pollutants from northern Heilongjiang Province (e.g., Qiqihar and Daqing). The emission of higher SO2 and EC and lower PM2.5 generally characterize the insufficient coal combustion. In Northeast China, coal burning in winter can be summarized into three aspects: coal fired in power and heating plants for heating supply, household boilers for heating and cooking, and industrial production [53]. Among them, industrial coal consumption will be significantly weakened because of the factory shutdowns for holiday celebrations. Although local pollution sources dominated for CO emissions, the short-distance and high-intensity transmission from Qiqihar, Daqing, and Suihua of Heilongjiang Province cannot be ignored. During the study period, local emissions were not the foremost source of high atmospheric SO2 concentrations; long-distance transmission from northeastern Changchun was dominant. The above results indicate that pollutants during the Spring Festival in Changchun not only originated from localized source emissions, but the airflow transportation from the northwestward and northward could also adversely affect air quality.
Based on the potential source contribution factor weights (PSCF) method, which can semiquantitatively obtain the distribution of potential pollution source and the concentration weight of airflow trajectories [69], we analyzed the pollution contribution of trajectories and potential sources of PM2.5 during the 2018 Spring Festival in Changchun (Figure 7). Higher PSCF values were identified as significant potential sources that have a substantial effect on PM2.5, and vice versa. Regardless of the period, the potential sources of pollutants were concentrated in the monitoring site and its surrounding areas, southwest of Heilongjiang Province, and east of the East Fourth League. The scale of potential source areas during major period was significantly lower than during normal period. These results indicated that the distribution of air pollution concentration during the Changchun Spring Festival of 2018 was not only affected by localized pollution emissions but also by long-distance transportation of pollution from regions outside the province by strong winds.

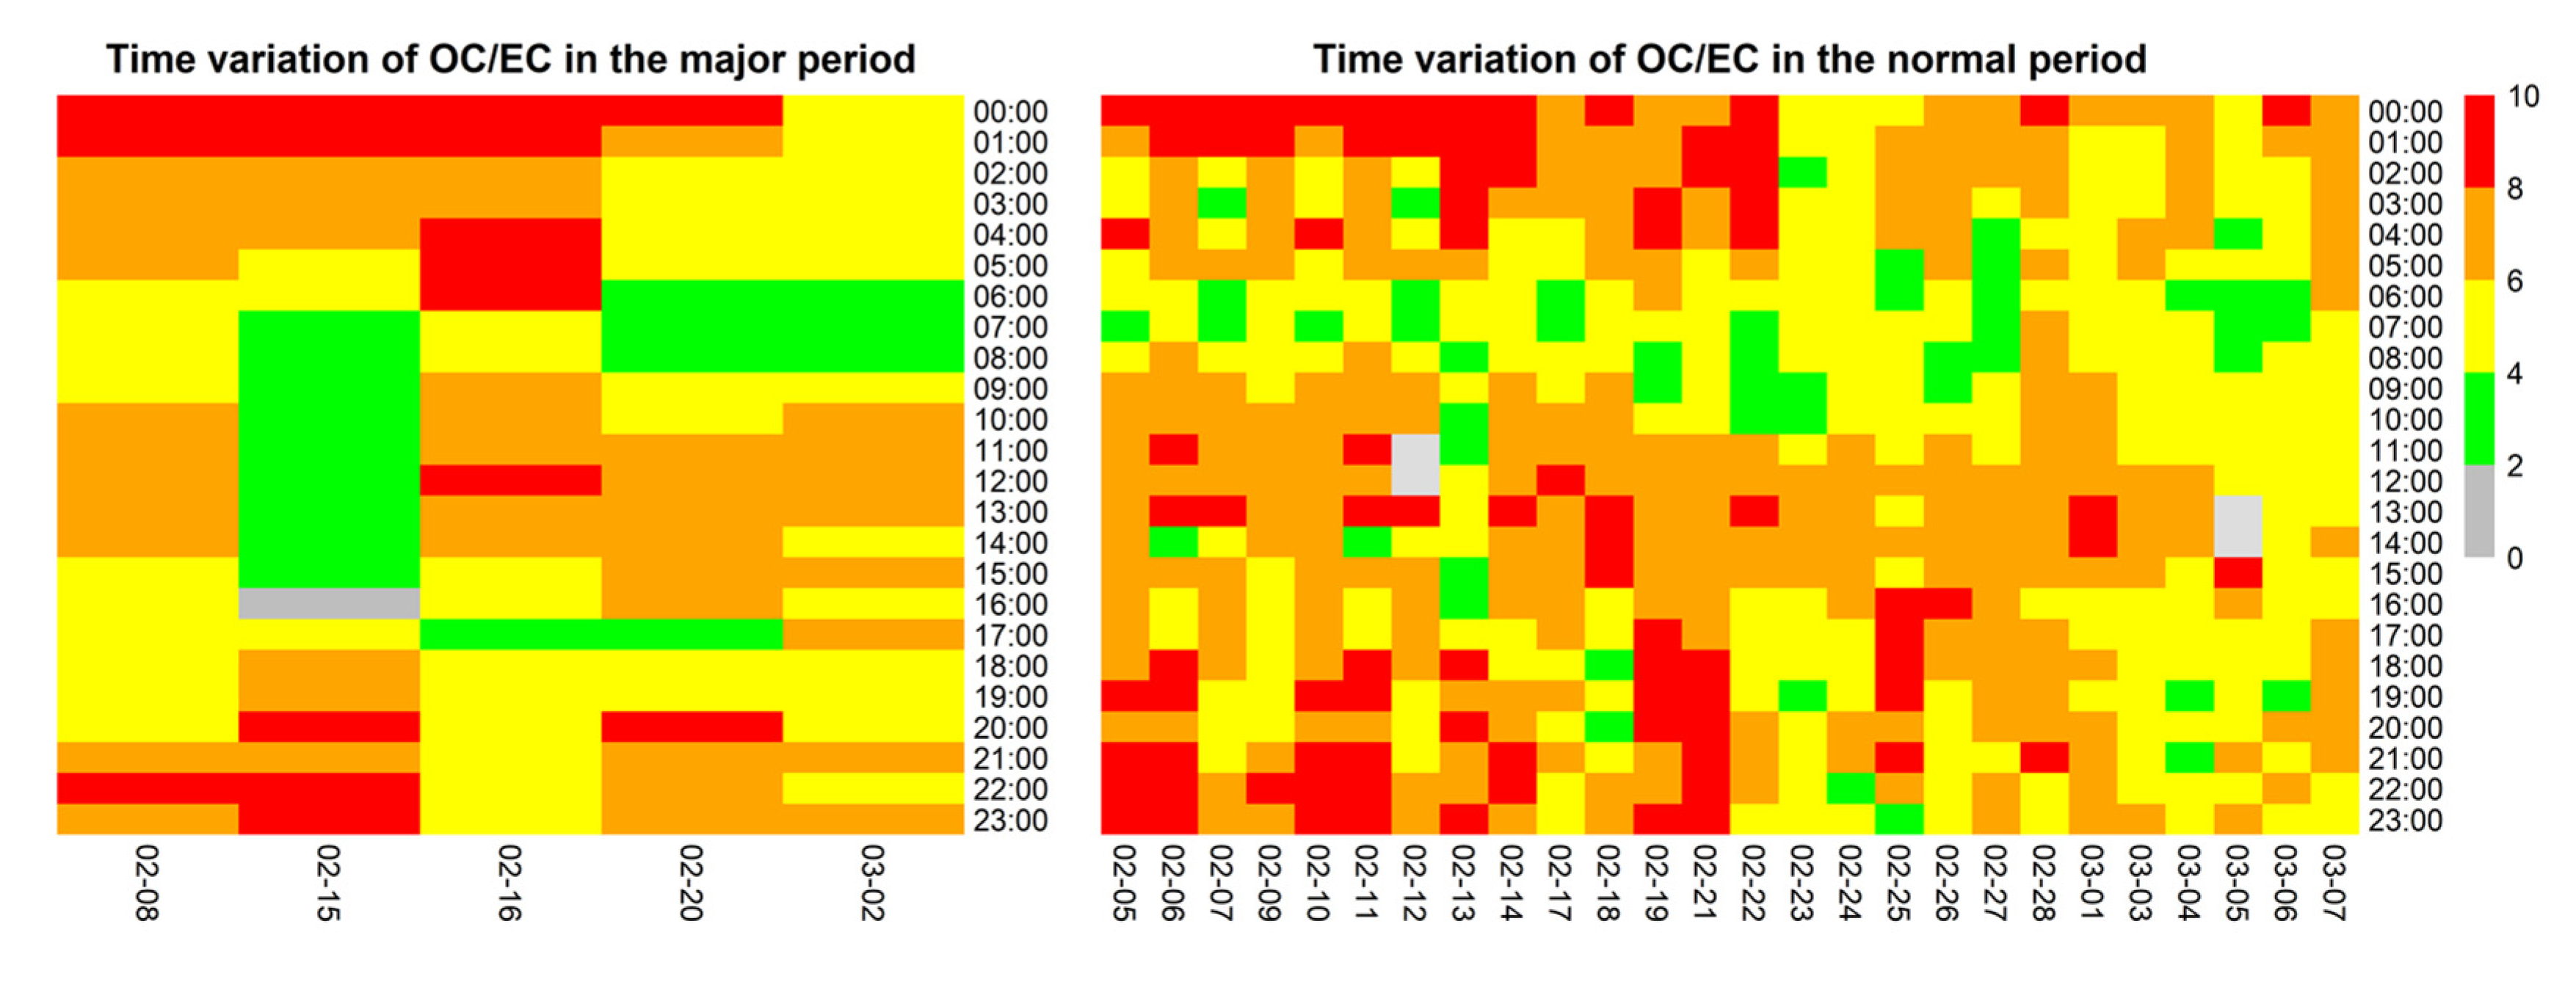
3.4. Variation Characteristics of OC/EC and SOC

Turpin et al. [52] indicated that the value of OC/EC > 2 is used as an indicator of SOC formation when EC mainly from incomplete combustion emissions of coal consumption and traffic. Our data demonstrated that the minimum ratio of OC/EC in the major period and normal period was 3.6 and 4.2, representing the generation of SOC during research period. The SOC concentration is estimated based on the EC-tracer method, as shown in Section 2.4. The ratios of OC, EC, PM2.5, and SOC during the 2018 Spring Festival in Changchun indicated that the proportions of OC and EC in PM2.5 were 33% and 6%, respectively (Table 2). The annual average mass concentration of SOC was 5.02 µg/m3, accounting for 56% of OC, which was significantly higher than what was reported by Huang et al. in a study of OC and EC in PM2.5 of Guangzhou [70]. Different from Guangzhou, coal-fired heating and firecracker-burning occurred frequently during the Spring Festival in Changchun, although the local government had issued a strict fireworks-burned prohibition policy. During the study period, the proportion of SOC/OC in the major period (60%) was higher than that of normal festivals (52%), indicating that the environment in the major period was more conducive to SOC formation.
The OC/EC ratio, regarded as an empirical evaluation indicator for regional pollution sources, was reported in previous studies. In general, when the ratio ranges from 1.0 to 4.2, on-road vehicles are considered to be the major emission source in the carbonaceous fraction [71,72]; when the ratio is between 2.5 and 10.5, coal combustion is the primary source [73]. The temporal variation of OC/EC in different periods is displayed in Figure 8. The average ratios of OC/EC during the nighttime (i.e., 10:00 p.m. to 2:00 a.m. of the following day) were higher than 6, which indicated that the most important source of the carbonaceous fractions was coal burning. The period in which the ratio of OC/EC falls between 2.0 and 4.0 regularly occurred from 6:00 pm. to 10:00 p.m. and 4:00 p.m. to 7:00 p.m., implying that the pollutant emissions of the carbonaceous fractions were related to road vehicles. During the study period, the variation of OC/EC in the daylight was greater than in the nighttime, which reflected that SOC were more likely to be generated in a strong light environment [74].

4. Conclusions

To reveal the temporal variation of aerosols’ chemical composition within typical industrial cities in Northeast China during a special period (i.e., the Spring Festival), the spatial distribution and potential sources of carbonaceous aerosols (i.e., OC and EC) in Changchun were studied by the HYSPLIT model and PSCF method, combined with the hourly pollutant and meteorological data from Lunar 20 December to Lunar 20 January during the 2018 Spring Festival. The high levels of pollutants were mainly concentrated in the daytime from local, northwestward, and northward of the monitoring station, with a wind speed of 4–7 m/s. The correlation between OC and EC during the major period was lower than during normal period, indicating that the emission sources of carbonaceous aerosols were more complex, which might reflect the combined effect of automobile exhaust gas and coal-fired heating. In major period, the diurnal concentration of atmospheric pollutants presented a bimodal trend, with the peaks appearing regularly from 11:00 a.m. to 12:00 p.m. and 5:00 p.m. to 10:00 p.m., which was consistent with the regular patterns of traffic, cooking, and firecrackers. The OC/EC was greater than 2, demonstrating the generation of secondary organic aerosols (i.e., SOC). A significantly higher proportion of SOC in OC in major period than in normal period indicated a more favorable environment for the formation of organic particulate matter in the atmosphere, which could worsen urban air quality by accelerating the chemical transformation of pollutants. Therefore, further strengthening the control measures on emissions (e.g., firecracker burning) is recommended to improve pollution prevention during this period. Moreover, improving quality assurance of automobile production and prohibiting the operation of substandard diesel vehicles to fundamentally reduce pollution emissions from motor vehicles. It is also significant that establish pollution warning mechanism based on local pollution emissions characteristics implement enterprise staggered production and maintain appropriate heating intensity to reduce the possibility of haze episodes during festivities period.

Author Contributions

Formal analysis, M.Z.; writing—original draft preparation, M.Z. and S.Z; supervision, W.C. and S.Z; funding acquisition, W.C. and S.Z.; project administration, Q.B., J.F., C.Y., Y.Q., and S.Z. All authors have read and agreed to the published version of the manuscript.

Funding

This research was funded under the auspices of the National Key R&D Program of China (No. 2017YFC0212303, No. 2017YFC0212301), the Key Research Program of Frontier Sciences, Chinese Academy of Sciences (No. QYZDB-SSW-DQC045), the National Natural Science Foundation of China (No. 41775116), the Youth Innovation Promotion Association of Chinese Academy of Sciences (No. 2017275), the Northeast Institute of Geography and Agroecology, CAS (No. IGA-135-05)).

Acknowledgments

We would also like to thank the students involved in the experiments and the teachers for their meteorological data.

Conflicts of Interest

The authors declare no conflict of interest.

Appendix A

Figure A1. Back trajectory pathway among various pollutants during 72 h in the major period of the Spring Festival, local time, in Changchun (black circle).
Atmosphere 11 00991 g0a1

References

  1. Singh, P.; Sarawade, P.; Adhikary, B. Carbonaceous aerosol from open burning and its impact on regional weather in South Asia aerosol. Air Qual. Res. 2020, 20, 419–431. [Google Scholar] [CrossRef] [Green Version]
  2. Zhang, Z.Z.; Gao, Y.; Yuan, Q.; Tan, Y.; Li, H.W.; Cui, L.; Huang, Y.; Cheng, Y.; Xiu, G.L.; Lai, S.C.; et al. Effects of indoor activities and outdoor penetration on PM2.5 and associated organic/elemental carbon at residential homes in four Chinese cities during winter. Sci. Total Environ. 2020, 739, 1–11. [Google Scholar]
  3. Chen, Y.J.; Wang, H.L.; Singh, B.; Ma, P.L.; Rasch, P.J.; Bond, T.C. Investigating the linear dependence of direct and indirect radiative forcing on emission of carbonaceous aerosols in a global climate model. J. Geophys. Res. Atmos. 2018, 123. [Google Scholar] [CrossRef]
  4. Qi, M.X.; Jiang, L.J.; Liu, Y.X.; Xiong, Q.L.; Sun, C.Y.; Li, X.; Zhao, W.J.; Yang, X.C. Analysis of the Characteristics and Sources of Carbonaceous Aerosols in PM2.5 in the Beijing, Tianjin, and Langfang Region, China. Int. J. Environ. Res. Public Health 2018, 15, 1483. [Google Scholar] [CrossRef] [Green Version]
  5. Song, J.; Zhao, Y.; Zhang, Y.; Fu, P.; Zheng, L.; Yuan, Q.; Wang, S.; Huang, X.; Xu, W.; Cao, Z.; et al. Influence of biomass burning on atmospheric aerosols over the western South China Sea: Insights from ions, carbonaceous fractions and stable carbon isotope ratios. Environ. Pollut. 2018, 242, 1800–1809. [Google Scholar] [CrossRef] [PubMed]
  6. Contini, D.; Vecchi, R.; Viana, M. Carbonaceous aerosols in the atmosphere. Atmosphere 2018, 9, 181. [Google Scholar] [CrossRef] [Green Version]
  7. Zhang, F.; Guo, H.; Chen, Y.; Matthias, V.; Zhang, Y.; Yang, X.; Chen, J. Size-segregated characteristics of organic carbon (OC), elemental carbon (EC) and organic matter in particulate matter (PM) emitted from different types of ships in China. Atmos. Chem. Phys. 2020, 20, 1549–1564. [Google Scholar] [CrossRef] [Green Version]
  8. Wu, Z.L.; Hu, L.M.; Guo, T.F.; Lin, T.; Guo, Z.G. Aeolian transport and deposition of carbonaceous aerosols over the Northwest Pacific Ocean in spring. Atmos. Environ. 2020, 223, 1–8. [Google Scholar] [CrossRef]
  9. Miyakawa, T.; Komazaki, Y.; Zhu, C.; Taketani, F.; Pan, X.; Wang, Z.; Kanaya, Y. Characterization of carbonaceous aerosols in Asian outflow in the spring of 2015: Importance of non-fossil fuel sources. Atmos. Environ. 2019, 214. [Google Scholar] [CrossRef]
  10. Hao, Y.F.; Meng, X.P.; Yu, X.P.; Lei, M.L.; Li, W.J.; Yang, W.W.; Shi, F.T.; Xie, S.D. Exploring the characteristics and sources of carbonaceous aerosols in the agro-pastoral transitional zone of Northern China. Environ. Pollut. 2019, 249, 589–597. [Google Scholar] [CrossRef]
  11. Duarte, R.M.; Matos, J.T.; Paula, A.S.; Lopes, S.P.; Ribeiro, S.; Santos, J.F.; Patinha, C.; Eduardo, F.D.; Soares, R.; Duarte, A.C. Tracing of aerosol sources in an urban environment using chemical, Sr isotope, and mineralogical characterization. Environ. Sci. Pollut. Res. Int. 2017, 24, 1–11. [Google Scholar] [CrossRef] [PubMed]
  12. Shi, G.L.; Peng, X.; Liu, J.Y.; Tian, Y.Z.; Song, D.L.; Yu, H.F.; Feng, Y.C.; Russell, A.G. Quantification of long-term primary and secondary source contributions to carbonaceous aerosols. Environ. Pollut. 2016, 219, 1–9. [Google Scholar] [CrossRef] [PubMed]
  13. Wang, X.F.; Jing, H.; Dhungel, B.; Wang, W.N.; Kumfer, B.M.; Axelbaum, R.L.; Biswas, P. Characterization of organic and black carbon aerosol formation during coal combustion: An experimental study in a 1MW pilot scale coal combustor. Fuel 2016, 180, 653–658. [Google Scholar] [CrossRef] [Green Version]
  14. Zhou, S.Z.; Yang, L.X.; Gao, R.; Wang, X.F.; Gao, X.M.; Nie, W.; Xu, P.J.; Zhang, Q.Z.; Wang, W.X. A comparison study of carbonaceous aerosols in a typical North China Plain urban atmosphere: Seasonal variability, sources and implications to haze formation. Atmos. Environ. 2016. [Google Scholar] [CrossRef]
  15. Ashwini, K.; Kirpa, R.; Narendra, O. Variations in carbonaceous species at a high-altitude site in western India: Role of synoptic scale transport. Atmos. Environ. 2016, 125, 371–382. [Google Scholar] [CrossRef]
  16. Kalita, G.; Kunchala, R.K.; Fadnavis, S.; Kaskaoutis, D.G. Long term variability of carbonaceous aerosols over Southeast Asia via reanalysis: Association with changes in vegetation cover and biomass burning. Atmos. Res. 2020, 245. [Google Scholar] [CrossRef]
  17. Rai, A.; Mukherjee, S.; Chatterjee, A.; Choudhary, N.; Kotnala, G.; Mandal, T.K.; Sharma, S.K. Seasonal variation of OC, EC, and WSOC of PM10 and their CWT analysis over the eastern himalaya. Aerosol Sci. Eng. 2020. [Google Scholar] [CrossRef]
  18. Ramírez, O.; Sánchez de la Campa, A.M.; de la Rosa, J. Characteristics and temporal variations of organic and elemental carbon aerosols in a high–altitude, tropical Latin American megacity. Atmos. Res. 2018, 210, 110–122. [Google Scholar] [CrossRef]
  19. Ji, D.S.; Zhang, J.K.; He, J.; Wang, X.J.; Pang, B.; Liu, Z.R.; Wang, L.; Wang, Y.S. Characteristics of atmospheric organic and elemental carbon aerosols in urban Beijing, China. Atmos. Environ. 2016, 125, 293–306. [Google Scholar] [CrossRef]
  20. Yan, G.X.; Zhang, J.W.; Zhang, P.Z.; Cao, Z.G.; Zhu, G.F.; Liu, Z.R.; Wang, Y.S. Episode-based analysis of size-resolved carbonaceous aerosol compositions in wintertime of Xinxiang: Implication for the haze formation processes in central China. Appl. Sci. 2020, 10, 3498. [Google Scholar] [CrossRef]
  21. Yin, D.Y.; Zhao, S.P.; Qu, J.J.; Yu, Y.; Kang, S.C.; Ren, X.L.; Zhang, J.; Zou, Y.; Dong, L.X.; Li, J.L.; et al. The vertical profiles of carbonaceous aerosols and key influencing factors during wintertime over western Sichuan Basin, China. Atmos. Environ. 2020, 223, 1–16. [Google Scholar] [CrossRef]
  22. Cui, Y.; Zhao, C.Y.; Zhou, X.Y.; AO, X.; Wang, T.; Li, Q.; Liu, M.Y.; Ma, F.S. Climatic characteristics of haze days in Northeast of China over the past 50 years. China Environ. Sci. 2016, 36, 1630–1637. [Google Scholar]
  23. Li, R.M.; Chen, W.W.; Xiu, A.J.; Zhao, H.M.; Zhang, X.L.; Zhang, S.C.; Tong, D.Q. A comprehensive inventory of agricultural atmospheric particulate matter (PM10 and PM2.5) and gaseous pollutants (VOCs, SO2, NH3, CO, NOx and HC) emissions in China. Ecol. Indic. 2019, 107, 105609. [Google Scholar] [CrossRef]
  24. Chen, W.W.; Tong, D.Q.; Dan, M. Typical atmospheric haze during crop harvest season in northeastern China: A case in the Changchun region. J. Environ. Sci. 2017, 54, 101–113. [Google Scholar] [CrossRef] [PubMed]
  25. He, Y.X.; Zhang, X.L.; Chen, W.W.; Zhang, X.; Zhao, H. Spatial-temporal characteristics of regional air quality in Northern China based on multi-satellites aerosol products. Acta Sci. Circumstantiate 2018, 38, 608–617. [Google Scholar]
  26. Gao, C.K.; Xu, Q.J.; Xing, Y.H.; Na, H.M. Emission inventory of atmospheric pollutants from on-road vehicles in low-temperature areas in winter. Northeast. Univ. (Nat. Sci.) 2019, 40, 1343–1349. [Google Scholar]
  27. Bai, L.; He, Z.J.; Li, C.H.; Chen, Z. Investigation of yearly indoor/outdoor PM2.5 levels in the perspectives of health impacts and air pollution control: Case study in Changchun, in the northeast of China. Sustain. Cities Soc. 2020, 53. [Google Scholar] [CrossRef]
  28. Li, L.L.; Wang, K.; Chen, W.W.; Zhao, Q.L.; Liu, L.J.; Liu, W.; Liu, Y.; Jiang, J.Q.; Liu, J.M.; Zhang, M.D. Atmospheric pollution of agriculture-oriented cities in Northeast China: A case in Suihua. J. Environ. Sci. 2020, 97, 85–95. [Google Scholar] [CrossRef]
  29. National Bureau of Statistics of China. China Statistical Yearbook 2019; China Statistics Press: Beijing, China, 2019. (In Chinese) [Google Scholar]
  30. Xinhua News Agency. Available online: http://www.gov.cn/zhengce/2014-03/16/content_2640075.htm (accessed on 23 August 2020).
  31. Jl.ifeng News. Available online: http://jl.ifeng.com/a/20171013/6064848_0.shtml (accessed on 30 May 2020).
  32. Ma, S.Q.; Chen, W.W.; Zhang, S.C.; Tong, Q.S.; Bao, Q.Y.; Gao, Z.T. Characteristics and cause analysis of heavy haze in changchun city in northeast China. Chin. Geogr. Sci. 2017, 27, 989–1002. [Google Scholar] [CrossRef] [Green Version]
  33. Bureau of Ecology and Environment of Changchun. Available online: http://hjj.changchun.gov.cn/xxfb/hjzl/hjzkbg/201807/t20180705_1003455.html (accessed on 31 May 2020).
  34. National Development and Reform Commission. Available online: http://www.ndrc.gov.cn/zcfb/zcfbtz/201603/W020160311487622568348.pdf (accessed on 10 June 2020).
  35. State Council of the People’s Republic of China. The 13th Five-Year Plan for the Revitalization of Northeast China. Available online: https://www.gov.cn/xinwen/2016-12/20/5150168/files/7779d2ddc7d24744ac036acaf6a89037.pdf (accessed on 20 June 2020).
  36. Ecology and Environment Department of Jilin Province. Available online: http://sthjt.jl.gov.cn/zwzx/qshb/201601/t20160118_3403978.html (accessed on 25 June 2020).
  37. Rai, P.; Furger, M.; El Haddad, I.; Kumar, V.; Wang, L.; Singh, A.; Dixit, K.; Bhattu, D.; Petit, J.; Ganguly, D.; et al. Real-time measurement and source apportionment of elements in Delhi’s atmosphere. Sci. Total Environ. 2020, 140332. [Google Scholar] [CrossRef]
  38. Stein, A.F.; Draxler, R.R.; Rolph, G.D.; Stunder, B.J.B.; Cohen, M.D.; Ngan, F. NOAA’s HYSPLIT atmospheric transport and dispersion modeling system. Bull. Am. Meteorol. Soc. 2015, 96, 2059–2077. [Google Scholar] [CrossRef]
  39. An, Z.S.; Huang, R.J.; Zhang, R.Y.; Tie, X.X.; Li, G.H.; Cao, J.J.; Zhou, W.J.; Shi, Z.G.; Han, Y.M.; Gu, Z.J.; et al. Severe haze in northern China: A synergy of anthropogenic emissions and atmospheric processes. Proc. Natl. Acad. Sci. USA 2019, 201900125. [Google Scholar] [CrossRef] [PubMed] [Green Version]
  40. Physical Sciences Laboratory. Available online: https://www.esrl.noaa.gov/psd/data/histdata (accessed on 27 June 2020).
  41. Godłowska, J.; Hajto, M.J.; Tomaszewska, A.M. Spatial analysis of air masses backward trajectories in order to identify distant sources of fine particulate matter emission. Arch. Environ. Prot. 2015, 41, 28–35. [Google Scholar] [CrossRef] [Green Version]
  42. Lu, Z.; Streets, D.G.; Zhang, Q.; Wang, S. A novel back-trajectory analysis of the origin of black carbon transported to the Himalayas and Tibetan Plateau during 1996–2010. Geophys. Res. Lett. 2012, 39. [Google Scholar] [CrossRef] [Green Version]
  43. Carslaw, D.C.; Ropkins, K. Openair—an R package for air quality data analysis. Environ. Model. Softw. 2012, 27–28, 52–61. [Google Scholar] [CrossRef]
  44. Molnár, P.; Tang, L.; Sjöberg, K.; Wichmann, J. Long-range transport clusters and positive matrix factorization source apportionment for investigating transboundary PM2.5 in Gothenburg, Sweden. Environ. Sci. Process. Impacts 2017, 19, 1270–1277. [Google Scholar] [CrossRef] [Green Version]
  45. Mishra, A.K.; Shibata, T. Synergistic analyses of optical and microphysical properties of agricultural crop residue burning aerosols over the Indo-Gangetic Basin (IGB). Atmos. Environ. 2012, 57, 205–218. [Google Scholar] [CrossRef]
  46. Yang, W.; Wang, G.; Bi, C. Analysis of long-range transport effects on PM2.5 during a short severe haze in Beijing, China. Aerosol Air Qual. Res. 2017, 17, 1610–1622. [Google Scholar] [CrossRef]
  47. Fleming, Z.L.; Monks, P.S.; Manning, A.J. Review: Untangling the influence of air-mass history in interpreting observed atmospheric composition. Atmos. Res. 2012, 104–105, 1–39. [Google Scholar] [CrossRef] [Green Version]
  48. Pekney, N.J.; Davidson, C.I.; Zhou, L.; Hopke, P.K. Application of PSCF and CPF to PMF-Modeled Sources of PM2.5 in Pittsburgh. Aerosol Sci. Technol. 2006, 40, 952–961. [Google Scholar] [CrossRef] [Green Version]
  49. Ara Begum, B.; Kim, E.; Jeong, C.H.; Lee, D.-W.; Hopke, P.K. Evaluation of the potential source contribution function using the 2002 Quebec forest fire episode. Atmos. Environ. 2005, 39, 3719–3724. [Google Scholar] [CrossRef]
  50. Byčenkienė, S.; Dudoitis, V.; Ulevicius, V. The use of trajectory cluster analysis to evaluate the long-range transport of black carbon aerosol in the south-eastern baltic region. Adv. Meteorol. 2014, 1–11. [Google Scholar] [CrossRef] [Green Version]
  51. Chow, J.C.; Watson, J.G.; Lu, Z.Q.; Lowenthal, D.H.; Frazier, C.A.; Solomon, P.A.; Thuillier, R.H.; Magliano, K. Descriptive analysis of PM2.5 and PM10 at regionally representative locations during SJVAQS/AUSPEX. Atmos. Environ. 1996, 30, 2079–2112. [Google Scholar] [CrossRef]
  52. Turpin, B.J.; Huntzicker, J.J. Identification of secondary organic aerosol episodes and quantitation of primary and secondary organic aerosol concentrations during SCAQS. Atmos. Environ. 1995, 29, 3527–3544. [Google Scholar] [CrossRef]
  53. Chen, W.W.; Liu, Y.; Wu, X.W.; Bao, Q.Y.; Gao, Z.T.; Zhang, X.L.; Zhao, H.M.; Zhang, S.C.; Xiu, A.J.; Cheng, T.H. Spatial and temporal distribution characteristics of air quality and cause analysis of heavy pollution in Northeast China. Environ. Sci. 2019, 40, 4810–4823. [Google Scholar]
  54. Liu, Y.; Shen, X.J.; Chen, W.W. Study on air pollutants emission Inventory from civilian coal combustion in Changchun, Northeast China. Environ. Pollut. Control 2019, 41, 1211–1217. [Google Scholar]
  55. Jin, X.; Xie, X.; Lu, X.B.; Xu, J.H.; Zhu, Z.F. Effect of setting off fireworks on ambient air quality on the New Year’s Eve. Adm. Tech. Environ. Monit. 2015, 27, 64–66. [Google Scholar]
  56. Liu, P.F.; Zhang, C.L.; Xue, C.Y.; Mu, Y.J.; Liu, J.F.; Zhang, Y.Y.; Tian, D.; Ye, C. The contribution of residential coal combustion to atmospheric PM2.5 in northern China during winter. Atmos. Chem. Phys. 2017, 17, 11503–11520. [Google Scholar] [CrossRef] [Green Version]
  57. Li, R.; Wang, Z.Z.; Cui, L.L.; Fu, H.B.; Zhang, L.W.; Kong, L.D.; Chen, W.D.; Chen, J.M. Air pollution characteristics in China during 2015–2016: Spatiotemporal variations and key meteorological factors. Sci. Total Environ. 2018, 648, 902–915. [Google Scholar] [CrossRef]
  58. Wu, X.W.; Chen, W.W.; Wang, K.; Xiu, A.J.; Zhang, S.C.; Zhao, H.M.; Zhang, X.L. PM2.5 and VOCS emission inventories from cooking in Changchun city. China Environ. Sci. 2018, 38, 2882–2889. [Google Scholar]
  59. Ketzel, M.; Wahlin, P.; Kristensson, A.; Swietlicki, E.; Berkowicz, R.; Nielsen, O.J.; Palmgren, F. Particle size distribution and particle mass measurements at urban, near-city and rural level in the copenhagen area and southern Sweden. Atmos. Chem. Phys. 2004, 4, 281–292. [Google Scholar] [CrossRef] [Green Version]
  60. Xiang, S.; Hu, Z.C.; Zhai, W.J.; Wen, D.Q.; Noll, E.K. Concentration of ultrafine particles near roadways in an urban area in Chicago, Illinois. Aerosol Air Qual. Res. 2018, 18, 895–903. [Google Scholar] [CrossRef]
  61. Yang, Y. Study of Air Pollution Characteristics in Harbin Municipal District Based on Mesoscale Coupling Model; Harbin Institute of Technology: Harbin, China, 2016; pp. 50–54. [Google Scholar]
  62. Hao, T.Y.; Han, S.Q.; Cai, Z.Y.; Meng, L.H.; Wang, Y. Impacts of fireworks on air pollution during the Spring Festival in Tianjin city. Res. Environ. Sci. 2019, 32, 573–583. [Google Scholar]
  63. Yan, H.; Wu, Y.; Zhang, S.J.; Song, S.J.; Fu, L.X.; Hao, J.M. Emission characteristics and concentrations of vehicular black carbon in a typical freeway traffic environment of Beijing. Acta Sci. Circumstantiae 2014, 34, 1891–1899. [Google Scholar]
  64. Cao, J.Y.; Li, S.C.; Li, Y.; Judith, C.C.; Kochy, F. Physical and chemical characteristics and source analysis of organic carbon and elemental carbon in the atmosphere of Xian in autumn and winter. Prog. Nat. Sci. 2005, 15, 1460–1466. [Google Scholar]
  65. Chen, W.W.; Zhang, S.C.; Tong, Q.S.; Zhang, X.L.; Zhao, H.M.; Ma, S.Q.; Xiu, A.J.; He, Y.X. Regional characteristics and causes of haze events in northeast China. Chin. Geogr. Sci. 2018, 28, 836–850. [Google Scholar] [CrossRef] [Green Version]
  66. Tan, Q.W.; Liu, H.; Yang, X.Y.; Zhang, T.Y.; Chen, Y. Heavy metal concentration in PM2.5 from firework displays is a major factor of atmospheric pollution during Spring Festival in Chengdu, China. J. Pollut. Eff. Control. 2018, 6, 1–6. [Google Scholar]
  67. Wang, L.; Liu, Z.; Sun, Y.; Ji, D.S.; Wang, Y.S. Long-range transport and regional sources of PM2.5 in Beijing based on long-term observations from 2005 to 2010. Atmos. Res. 2015, 157, 37–48. [Google Scholar] [CrossRef]
  68. Wu, X.W.; Chen, W.W.; Zhang, S.C.; Li, R.M.; Zhang, M.D.; Liu, J.; Jiang, Y.B.; Liu, Y. Temporal variation and chemical components of rural ambient pm2.5 during main agricultural activity periods in the black soil region of northeast China. Atmosphere 2019, 10, 510. [Google Scholar] [CrossRef] [Green Version]
  69. Wang, Q. Study of air pollution transportation source in Shanghai using trajectory model. Res. Environ. Sci. 2013, 26, 357–363. [Google Scholar]
  70. Huang, H.; Cao, J.J.; Zeng, B.Q.; Li, S.C.; He, J.H.; Zou, C.W.; Zou, S.C.; Li, S.M. Characterization of organic carbon, elemental carbon and water-soluble organic carbon in pm2.5 of guangzhou city. Anal. Sci. 2010, 26, 255–260. [Google Scholar]
  71. Schauer, J.J.; Kleeman, M.J.; Cass, G.R. Measurement of emissions from air pollution sources. 1. C1 through C29 organic compounds from meat charbroiling. Environ. Technol. 1999, 33, 1566–1577. [Google Scholar] [CrossRef]
  72. Schauer, J.J.; Kleeman, M.J.; Cass, G.R. Measurement of emissions from air pollution sources. 2. C1 through C30 organic compounds from medium duty diesel trucks. Environ. Sci. Technol. 1999, 33, 1578–1587. [Google Scholar] [CrossRef]
  73. Chen, Y.J.; Zhi, G.R.; Feng, Y.L.; Fu, J.M.; Feng, J.L.; Sheng, G.Y.; Simoneit, B.R.T. Measurements of emission factors for primary carbonaceous particles from residential raw-coal combustion in China. Geophys. Res. Lett. 2006, 33, 382–385. [Google Scholar] [CrossRef]
  74. Zhang, X.Y.; Wang, X.; Zhou, Y.; Wei, H.L.; Pu, W.; Shi, J.S.; Dai, M.K. Characteristics of carbonaceous aerosols and their source in the atmosphere during summer in Lanzhou. Plateau Meteorol. 2017, 36, 528–537. [Google Scholar] [CrossRef]
Figure 1. The location of the study region in northeastern China and its regional geography and elevation status. The bright purple area on the left indicates Jilin Province, Northeast China, and the dark blue indicates the administrative boundary of Changchun, which is the capital of Jilin Province and the subject of this study. The light red area on the right represents the urban center of the Changchun region, and the green circles are the ground monitoring sites in this study.
Atmosphere 11 00991 g001
Figure 2. Hourly variations in the pollutant concentrations (i.e., total carbon (TC), organic carbon (OC), elemental carbon (EC), particulate matter (PM2.5 and PM10), SO2, NO2, CO, and O3) and meteorological parameters (i.e., temperature, relative humidity, precipitation, wind direction, and wind speed) in Changchun during the Spring Festival (i.e., from Lunar 20 December to Lunar 20 January of the following year). The shaded areas represent five typical holiday periods: I (i.e., the Lunar Little New Year); II (i.e., the Chinese New Year’s Eve); III (i.e., Lunar 5 January); IV (i.e., the Spring Lantern Festival), and V (i.e., Chinese Lunar New Year legal holidays, from Lunar 30 December to Lunar 7 January of the following year).
Atmosphere 11 00991 g002
Figure 3. Diurnal concentration variations of various pollutants and the trends of meteorological factors by major and normal period during the Spring Festival in Changchun City, Jilin Province. Note: except for CO, the units of remaining pollutants are µg/m3, while for CO is in mg/m3; the units of wind speed, relative humidity, and ambient temperature are m/s, %, and °C, respectively.
Atmosphere 11 00991 g003
Figure 4. Correlation of atmospheric pollutants in different periods (i.e., major and normal periods) of the Spring Festival in Changchun in 2018. The correlation degree between pollutants is displayed synergistically by the shape (i.e., ellipses), colors, and numerical values.
Atmosphere 11 00991 g004
Figure 5. The relationship of pollutant concentration (from left to right: TC, EC, OC, PM2.5, PM10, CO, SO2, NO2, and O3) to wind direction and wind speed during the 2018 Spring Festival (i.e., from Lunar 20 December to Lunar 20 January of the following year) in Changchun. (a) Relationship of various pollutant concentration to wind direction and wind speed throughout the entire Spring Festival. (b,c) Relationship of pollutant concentration to wind direction and wind speed in the major and normal period of the Spring Festival, respectively.
Atmosphere 11 00991 g005
Figure 6. Relationship of PM2.5, OC, and EC concentration to wind direction and wind speed in Changchun by periods (i.e., (a) whole, (b) major, and (c) normal) and circadian rhythms (i.e., daylight vs. nighttime).
Atmosphere 11 00991 g006
Figure 7. Potential source contribution factor weights (PSCF) distribution characteristics of PM2.5 in different periods in Changchun during the 2018 Spring Festival.
Atmosphere 11 00991 g007
Figure 8. Temporal variation of OC/EC ratio by major and normal periods.
Atmosphere 11 00991 g008
Table 1. Daily average values of pollutants (i.e., total carbon (TC), organic carbon (OC), elemental carbon (EC), CO, SO2, NO2, O3, particulate matter (PM10 and PM2.5)) and meteorological elements (i.e., ambient temperature, relative humidity, and wind speed) in different periods (i.e., major period and normal period) of the Spring Festival in Changchun. Except for CO, the unit of remaining pollutants is µg/m3, while for CO, it is mg/m3; the units of wind speed, relative humidity, and ambient temperature are m/s, %, and °C, respectively.
IndexPeriods
Whole Major Normal
TC10.57 ± 3.199.60 ± 3.2911.54 ± 2.84
EC1.57 ± 0.461.47 ± 0.471.67 ± 0.44
OC9.00 ± 2.818.13 ± 2.939.87 ± 2.46
CO1.44 ± 0.141.36 ± 0.101.52 ± 0.13
SO259.24 ± 18.7362.77 ± 22.2755.71 ± 13.97
NO227.92 ± 9.1122.28 ± 6.2333.56 ± 8.03
O330.02 ± 7.9232.00 ± 7.3528.04 ± 8.12
PM2.526.95 ± 7.2324.22 ± 7.6529.69 ± 5.72
PM1039.82 ± 8.6939.50 ± 10.4340.12 ± 6.73
Wind speed2.30 ± 0.652.61 ± 0.691.99 ± 0.43
Relative humidity49.06 ± 5.9346.69 ± 6.4551.43 ± 4.31
Ambient temperature−9.41 ± 2.88−8.69 ± 3.32−10.12 ± 2.20
Table 2. The proportional relationship between PM2.5, OC, EC, and SOC in different periods.
ItemOC/PM2.5EC/PM2.5OC/ECSOC (µg/m3)SOC/OC
Whole period0.330.065.735.0256%
Major period0.340.065.534.8660%
Normal period0.330.065.905.1252%

