Article

Grazing under Irrigation Affects N2O-Emissions Substantially in South Africa

1
Institute of Crop Science and Plant Breeding, Grass and Forage Science/Organic Agriculture, Christian-Albrechts-University Kiel, D-24118 Kiel, Germany
2
Department of Agronomy, Stellenbosch University, Stellenbosch 7600, South Africa
*
Author to whom correspondence should be addressed.
Atmosphere 2020, 11(9), 925; https://doi.org/10.3390/atmos11090925
Submission received: 20 June 2020 / Revised: 13 August 2020 / Accepted: 25 August 2020 / Published: 29 August 2020

Abstract

:
Fertilized agricultural soils serve as a primary source of anthropogenic N2O emissions. In South Africa, there is a paucity of data on N2O emissions from fertilized, irrigated dairy-pasture systems and emission factors (EF) associated with the amount of N applied. A first study aiming to quantify direct N2O emissions and associated EFs of intensive pasture-based dairy systems in sub-Sahara Africa was conducted in South Africa. Field trials were conducted to evaluate fertilizer rates (0, 220, 440, 660, and 880 kg N ha−1 year−1) on N2O emissions from irrigated kikuyu–perennial ryegrass (Pennisetum clandestinum–Lolium perenne) pastures. The static chamber method was used to collect weekly N2O samples for one year. The highest daily N2O fluxes occurred in spring (0.99 kg ha−1 day−1) and summer (1.52 kg ha−1 day−1). Accumulated N2O emissions ranged between 2.45 and 15.5 kg N2O-N ha−1 year−1 and EFs for mineral fertilizers applied had an average of 0.9%. Nitrogen in yielded herbage varied between 582 and 900 kg N ha−1. There was no positive effect on growth of pasture herbage from adding N at high rates. The relationship between N balance and annual N2O emissions was exponential, which indicated that excessive fertilization of N will add directly to N2O emissions from the pastures. Results from this study could update South Africa’s greenhouse gas inventory more accurately to facilitate Tier 3 estimates.

1. Introduction

The main greenhouse gas (GHG) contributors towards net global warming potential from the agricultural sector are carbon dioxide (CO2), methane (CH4), and nitrous oxide (N2O) [1]. N2O is released into the atmosphere during the processes of denitrification (reduction of nitrate (NO3) to di-nitrogen gas (N2) by soil microbes) under anaerobic conditions and nitrification (oxidation from NH4+ to NO3) under aerobic conditions [2]. N2O has a 121-year atmospheric life span and a global warming potential of 265 times that of CO2 compared over a 100-year period [3]. This makes mitigation strategies of N2O critical to control GHG emissions from the agricultural sector.
Globally, agricultural soils serve as a primary source of anthropogenic N2O emissions [4,5]. The GHG national inventory report of South Africa [6] stated that the energy (10.7%) and Agriculture, Forestry and Other Land Use (AFOLU) (84.5%) sectors were the largest contributors to the total N2O emissions in 2015. It is predicted that South African agricultural soils are responsible for 28% of N2O emissions from the AFOLU sector as a result of fertilizer application, urea for animal feed, and animal excreta [7].
The GHG calculations are currently based partially on default factors given by the Intergovernmental Panel on Climate Change (IPCC) with few country-specific results. Research is becoming more available on models which are used to predict GHG emissions from agricultural soils based on specific regions [8,9]. These studies highlight the advantages of using regional-based models to predict GHG emissions more accurately using simplified meta-models as an alternative to process-based models [9]. In order to propose mitigation strategies, it is important to create country-specific emission factors. South Africa is, inter alia, a signatory of the United Nations Framework Convention on Climate Change (UNFCCC) [6]. This implies that the country should update GHG inventories, quantify emissions, subsequently promote mitigation and adopt methods to prevent human-induced climate change.
Despite the decrease in the number of milk producers in South Africa, total milk production increased by 31% from 2009 until 2019 [10]. The majority of milk production is located in the Western Cape, Eastern Cape, and KwaZulu-Natal Provinces where dairy systems are predominantly pasture based. Depending on rainfall and other climatic conditions, three different production systems which are commonly used could be described as pasture-based, partially pasture-based, and total mixed ration systems [11]. These different production systems emit different amounts of GHG emissions due to various parameters found in each system [12]. Most dairy farming systems in South Africa are based on pastures [13]. These pastures consist mainly of a kikuyu (Pennisetum clandestinum)-base, which dominates in summer and early autumn. Ryegrass (Lolium spp.) is over-sown into the kikuyu-base during autumn and dominates in winter and spring. Over-sowing ryegrass into kikuyu is a technique for ensuring fodder production throughout the year by bridging in the winter/spring feed gap and it also contributes to improving the forage quality of the pasture [14]. Dairy farmers generally use high amounts of fertilizer to promote plant growth and maximize herbage yield to sustain milk production. It was estimated in 2015 that South Africa consumed around 42,7000 tons of nitrogen fertilizer [6].
Agricultural fertilizers are the largest use of reactive nitrogen (N). Applying mineral fertilizer has major advantages in food, fuel, and fiber production [15]. However, the use of N fertilizer in agricultural systems is not always efficient and effective. Sometimes less than 50% of the N applied is utilized by plants [16]. Nonetheless, efficient fertilizer usage in agricultural practices is important to ensure increased productivity. As a consequence, the result of increased N fertilizer used in farming practices has contributed to a rise in anthropogenic N2O emissions [17]. Nitrogen fertilization is one of the most expensive inputs in situations where pastures are fertilized with between 200 and 600 kg of N ha−1 year−1 [18]. It has been identified that poorly managed fertilizer practices can lead to great economic losses [19] which provides a strong case to manage and use N fertilization more efficiently.
Irrigation is used in combination with mineral fertilizers to increase plant available N and soil water availability to sustain plant yield. Rainfall in the southern Cape area is occasionally inadequate to maintain a high pasture production potential and farmers have to rely on permanent irrigation systems [20]. However, irrigation and fertilization could increase the amount of N2O emitted from soils [21].
It has been well documented that increasing levels of N2O emissions can be attributed to an increase in the use of mineral fertilizers [22,23,24,25,26]. However, the relevancy of fertilizer guidelines which are followed should be questioned as yield response is often not observed [27]. The risk of nitrate leaching and other forms of environmental pollution is increased if N is applied in excess of plant needs [28]. Excess N is becoming more apparent on farms with a high N inputs as a result of poor management. The imbalance of N in these systems should lead to opportunities to try and reduce surplus inputs while reducing major N losses and focus on useful cycling of N to improve the nitrogen-use efficiency, which could also assist in mitigation strategies [29]. Viljoen et al. (2020) [27] suggested that N fertilizer rates should be revised in the southern Cape region in South Africa as herbage yield response is no longer observed at high rates of N inputs, as the soil has the capacity to supply mineralized N from soil organic matter.
More consumers are becoming aware and concerned about the origin and impact that products have on the environment, which is expected to increase the demand for food products that generate low GHG emissions [30]. On the other hand, it should be important to consumers to also reduce food wastage and to encourage diets with a low N footprint which could help reduce the global demand and usage by using less fertilizers to grow food [15]. This would be in line with the European Nitrogen Assessment (ENA) which creates a better public awareness by identifying the challenges and threats associated with N pollution [29] and how to approach them as mitigation options.
In view of the arguments above, it is important to evaluate dairy-pasture systems in terms of associated greenhouse gas emissions. In the current study we aimed to obtain quantitative values for N2O emissions from pasture-based dairy production systems in South Africa. We evaluated the effect of different N fertilizer rates on N2O emissions. Subsequently, the emission factors (EF) associated with different N fertilizer rates were calculated and compared to the recommended IPCC values [1]. The EFs associated with different N fertilization rates will allow for development of strategies and policies which could assist in adaptation of farming practices that will reduce anthropogenic GHG emissions.
Accordingly, in this paper, we present results from field trials to address these important questions: (1) What would be the response of N2O emissions under managed soils in the southern Cape region of South Africa to N fertilization, under irrigation and intensive grazing practices, because of N levels exceeding plant requirements? (2) Can high stocking rates on intensively managed, highly fertilized and irrigated dairy pastures lead to high amounts of N returned through excreta to the soil and result in a high N surplus which could underestimate predicted N2O emissions? (3) Could the EFs, calculated from N2O emission values from intensively managed, grazed systems under irrigation, accurately predict N2O emissions compared to the suggested EF as set by the IPCC Tier 1 default value for N fertilizers?

2. Materials and Methods

2.1. Experimental Site Description

A field experiment was conducted at Outeniqua Research Farm (33°58′38″ S; 22°25′16″ E; 201 m.a.s.l.) of the Western Cape Department of Agriculture, South Africa. The research farm is located near the city of George in the southern Cape region of South Africa. The area has a temperate climate with mean monthly temperatures ranging between 7–18 °C and 15–25 °C in winter and summer, respectively. Rainfall is evenly distributed throughout the year and has a mean annual average precipitation of 728 mm. The soil type on the experimental site can be classified as a Podzol (IUSS Working Group 2015) which is locally known as a Witfontein soil form (Soil Classification Working Group 1991). Soil properties in different depths are shown in Table 1. Soil bulk densities for the 0–10, 10–20, and 20–30 cm layers were 1.3, 1.5, and 1.5 g cm−3, respectively [31]. Winter was defined as months June–August, spring as September–November, summer as December–February, autumn as March–May.

2.2. Experimental Layout and Treatments

An experiment was laid out as a randomized block design with five N fertilizer rates as treatments, replicated in four blocks. Plots were 15 × 15 m. Different N fertilization treatments in the form of limestone ammonium nitrate (LAN) were applied in fixed rates of 0, 20, 40, 60, and 80 kg N ha−1 (respectively defined as N0, N20, N40, N60, and N80) approximately four days after each grazing. The study took place over a period of 372 productive days from June 2018 to June 2019. A total of 12 grazing cycles could be managed and therefore 11 fertilization events applied. Consequently, the total amounts of N fertilizer applied per productive year were 0, 220, 440, 660, and 880 kg N ha−1 for the treatments.

2.3. Pasture and Grazing Management

The experimental site consisted of kikuyu over-sown with ryegrass and managed under no-tillage practices. A previous trial, two years prior to the current study (2016–2017), was carried out using the same N fertilization rates as in the current study applied to the same experimental plots for the respective treatments. Thus, no artifact effects of previous N fertilizer management practices were expected. More information can be found in Viljoen et al. (2020) [27]. During over-sowing of ryegrass, pastures were first grazed to a height of ca. 50 mm above ground level and mulched afterwards. In autumn 2018 the kikuyu was over-sown with annual Italian ryegrass (Lolium multiflorum ssp. italicum) cv. Fox and in autumn 2019 the kikuyu pasture was over-sown with annual Italian ryegrass cv. Thabu Plus. The botanical composition of the pasture is mainly driven by seasonal growth with kikuyu dominating in summer and ryegrass in winter and it was comparable between treatments. However, the control plots (N0) had a higher component of unsown legumes (Trifolium spp.) compared to the other treatments and they contributed 14% to the sward. It is known that the contribution of legumes in a sward increases as the added amount of fertilizer decreases [27].
Pastures were under permanent sprinkler irrigation with 15 m spacing between sprinklers. Irrometer tensiometers (Calafrica SA, Nelspruit, South Africa) were installed at a depth of 15 cm and irrigation was scheduled to maintain a soil water matrix potential between −25 and −10 kPa. Pasture was intensively strip-grazed by Jersey cows with grazing cycles between ca. 28 days in summer and ca. 35 days in winter. Cows were allowed to voluntarily graze the experimental plots and were not only restricted to specific treatments. The cows grazed pastures to ground level so that residual effects in determining herbage yield were considered minimal. Cows were allocated between 8 and 10 kg DM pasture with an additional concentrate feeding in the milking parlor of 5–6 kg concentrate. The concentrate fed consisted of 12–15% crude protein (CP), a metabolizable energy content of 11 MJ kg−1, 0.4% P, and 1% Ca, all on a DM basis.

2.4. N2O Measurements

N2O emissions were captured using the static chamber method [33]. Basal rings made from polyvinyl chloride (PVC) (55 cm diameter and 15 cm height) were installed in the soil two weeks prior to the onset of the experiment to a soil depth of 10 cm in each plot. This was done to avoid high measured gas fluxes which might be captured shortly after establishment. This period would also allow for the recovery of roots which might have been damaged during the insertion process [34]. The PVC chambers (60 cm diameter and 35 cm height) were deployed onto the basal rings during measurement and secured with a resistance rubber band to make an air-tight seal. The first measurement was taken immediately after deployment of chambers onto basal rings, and thereafter at 20, 40, and 60 min. Samples were obtained using a 30 mL syringe through a septum cap located at the top of the chamber and were immediately transferred into 12 mL pre-evacuated exetainers (Labco, High Wycombe, UK). Gas samples were analyzed for N2O through a gas chromatograph (SCION 456-GC, Bruker, Leiderdorp, The Netherlands) equipped with a 63Ni electron-capture-detector using He as carrier gas. Samples were injected using an autosampler (model 271 LH, Gilson Inc., Middleton, WI, USA). Data were processed using the software Compass CDS (Version 3.0.1). N2O emissions were measured from the beginning of June 2018 and continued until the beginning of June 2019. Gas measurements were performed on a weekly basis unless in the case of a fertilization event, where it was done in three consecutive days after fertilization. Samples were collected according to the described interval in the morning at 11:00 am.

2.5. Flux Calculations

The N2O flux was calculated based on the increased chamber headspace concentration within 60 min of chamber deployment. Flux calculations were based on the calculation done by Beetz et al. [35] and can be found in Equation (1).
F = k × 273.15 T + 273.15 × V A × Δ c Δ t
where F is the calculated flux (µg N2O-N m−2 h−1), k is a unit conversion factor (1.25 kg N m−3 for N2O), T is the mean temperature inside the chamber headspace (°C), V is the chamber volume (m3), A is the collar area (m2), and Δc/Δt is the change in concentration within the chamber headspace over time (N2O: ppb h−1).
Fluxes were calculated for each treatment and replicated by linear regression between measured N2O concentrations and time. The accumulated N2O emissions were calculated by linear interpolation between the measured daily fluxes for each replication. The accumulated period included 12 months for all treatments.

2.6. Nitrogen Balance

For the calculation of N balance, the N excreted by the dairy animals was considered. To do so, the N excreted by grazing animals was calculated using Equation (2) as described by Nennich et al. (2005) [36].
N exc = [ DMI × CP diet × 84.1 ] + [ BW × 0.196 ]
where Nexc is the N excreted by grazing animals (g N day−1), DMI is the dry matter intake of the cows (15 kg day−1), CPdiet is the crude protein content in the diet (0.2 g g−1 of DM), and BW is the body weight of the animal (400 kg). During the study period, 12 grazing days with ≈114 animals were carried out leading to a total amount of excreted N of 450 kg N ha−1 year−1.
N input was calculated using a simple equation, adding the amount of N excreted by grazing animals and N applied as mineral fertilizer from different treatment rates, using Equation (3).
N input = N exc + N fert
where Ninput (kg N ha−1) is the amount of N applied to different treatments, Nexc is the nitrogen excreted by the grazing animals (kg N ha−1), and Nfert is the different N fertilization rates applied (kg N ha−1).
The N balance for all treatment rates was calculated using the different N inputs and N outputs as shown in Equation (4). N yield in the harvested biomass was considered as the nitrogen output.
N balance = N input N yield
where Nbalance is the difference of N (kg N ha−1) utilized/not utilized by subtracting Nyield (kg N ha−1) from the Ninput (kg N ha−1).

2.7. Regression Analysis and Emission Factors

Both the linear and nonlinear regressions were used to predict annual N2O emissions (E1–E4) as a function of Ninput and Nbalance.
According to the Tier 1 approach of the IPCC guidelines the N2O-N emitted from soil can be calculated as a percentage (0.01) of N applied from mineral fertilizers (Equation (5)) (IPCCmin). However, as grazing was a part of our experiments a different EF had to be adopted for animal excreta N (0.02). The sum of N2O-N derived from mineral fertilizer application and excreta were defined as IPCCmin+exc and calculated using Equation (6).
IPCC min = N min.fert × 0.01
IPCC min + exc = IPCC min + ( N exc × 0.02 )
Moreover, we compared IPCC default values and regression-based predictions with an EF derived from our experimental data based on Equation (1) (EFdata); whereby EFdata was calculated under the assumption that emissions from excreta of grazing animals are captured by the control treatment and after deduction EFdata is referring to the amount of mineral fertilizer applied:
EF data = N 2 O fert N 2 O control N min.fert × 100
where N2Ofert is the accumulated N2O-N emissions from the different fertilization rates used in the current study (kg N2O-N ha−1), N2Ocontrol is the accumulated N2O-N emissions from the treatment which received no mineral fertilizer (kg N2O-N ha−1) and the mineral fertilizer applied is the different fertilization rates applied (kg N ha−1). The EFdata was calculated for each treatment and block. An average value was used to predict annual N2O emissions from the EFdata and the annual N-rate of mineral fertilizer applied in order to compare the different N2O prediction approaches.
Based on the different approaches the measured values were compared with the predicted values. The performance of the different approaches was evaluated on the basis of the coefficient of determination (R2), root mean squared error (RMSE), and Nash–Sutcliffe model efficiency coefficient (NSE) [37].

2.8. Pasture Sampling

2.8.1. Herbage Yield and Forage Quality

Herbage yield was sampled by cutting the pasture prior to grazing. Metal rings with an area of 0.0985 m2 were used to make 30 mm above ground cuttings. Ten ring samples per plot were cut by hand shears and collected in a bag. The rings were placed randomly within the different plots. Samples were placed in an oven (Scientific Manufacturing cc. (SMC) Oven, ODS, 1400 L, Killarney Gardens, South Africa) to dry at 60 °C for 72 h. The DM content and herbage yield (kg DM ha−1) could then be determined. Dried pasture herbage samples from each plot were dried and milled (SWC Hammer mill, 1 mm sieve), then photometrically analyzed using a Gallery™ Discrete Analyzer (Thermo Fisher Scientific, Waltham, MA, USA) to determine the N content of the pasture herbage from different plots. The N yield (kg N ha−1 year−1) could then be determined for the different fertilizer treatments.

2.8.2. Soil Sampling

Prior to grazing, soil samples from each plot were taken on the same day as herbage samples, which leads to a sample interval of approximately once per month. Three soil cores (⌀ 7.5 cm) per plot were collected one day prior to every grazing to a 10 cm depth and seasonally sampled at three depths; 0–10, 10–20, and 20–30 cm. Subsamples were pooled and composited. Soil wet weight was recorded and then soil was left to dry in an oven (ODS, 1400 L, SMC Oven, Killarney Gardens, South Africa) at 30 °C for ca. 7 days. The weight was recorded after the soil had dried and gravimetric soil water (SWC) content determined.
The volumetric water content as a fraction of the total pore space was determined and used to calculate the water filled pore space (WFPS). A particle density of 2.65 g cm−3 was assumed.
Salicylic acid [38] and indophenol-blue [39] methods were used to analyze for NO3-N and NH4+-N, respectively. Nmin content was defined as the sum of the NO3-N and NH4+-N contents. Nmin (kg ha−1) was calculated using the appropriate bulk densities [31] for the corresponding soil depths.

2.9. Weather Data, Soil Temperature, and Soil Water

Air temperature was logged using a Decagon Em50 Weather Logger (Decagon Devices Inc., Pullman, Washington, DC, USA) which recorded daily temperatures in 15-min intervals. In addition, soil temperature was logged using a DFM capacitance probe (DFM Software Solutions cc, 2012) located in the experimental site. Rain gauges were used to manually record rainfall during the experimental period. Monthly rainfall and mean daily temperatures for the trial period are shown in Figure 1.

2.10. Statistical Analyses

The statistical software R 3.6.1 (2019) [40] was used to analyze the data using the packages “nlme” [41] and “multcomp” [42]. The data evaluation started by defining an appropriate statistical mixed model [43,44]. Data distribution was visually assumed to be normal and heteroscedastic [45] with regard to the fertilization treatments. These assumptions were based on a graphical residual analysis. The statistical model included treatment as fixed factor. Block was regarded as the random factor. Based on this model a one-way analysis of variance (ANOVA) was conducted to test the hypothesis of the experiment. Furthermore, multiple contrast tests (e.g., see Bretz et al. 2011 [46]) were implemented in order to compare the several levels of the tested fertilization treatments. In addition, simple linear and nonlinear regression models were developed to predict N2O emissions as a function of Ninput and Nbalance. Statistical significance of the tested factors, comparisons of means, and regression equations (intercepts and slopes) were considered when p < 0.05.

3. Results

3.1. Weather Results and Environmental Variables

The mean monthly rainfall for the trial period was 49 ± 27.9 mm, compared to the long-term average of 60 ± 13.7 mm (30 years) (Figure 1). The winter of 2018 had below average rainfall and the highest rainfall occurred during spring in September, 101 mm (Figure 1). January had a low average rainfall (24 mm) compared to the long-term average. Daily temperatures recorded during the trial period ranged from 7.9 to 29.2 °C with an average of 16.1 °C. As a result of temperatures being higher, irrigation applied to pasture was higher in spring and summer and had a mean value of 11 mm over the trial period.
The mean values and standard error of the mean for Nmin, NH4+-N, and NO3-N during the entire trial period are presented in Table 2. Soil inorganic N, NH4+-N, and NO3-N were more concentrated at a shallow soil depth (0–10 cm). The minimum Nmin values for all treatments occurred in May 2019 and peaks in Nmin were observed in October 2018, January 2019, and March 2019 with the maximum value observed during March 2019 (see Supplementary Table S1). The mean annual Nmin ranged between 23.06 ± 1.19 (N20) and 60.02 ± 7.53 kg N ha−1 (N80) and the N60 and N80 treatments differed (p < 0.05) from the N0, N20, and N40 treatments (0–10 cm soil depth). The mean NH4+-N ranged between 16.42 ± 0.87 (N80) and 23.99 ± 1.93 kg ha−1 (N80). Differences (p < 0.05) in NH4+-N were found between the N60 and N0 treatments (0–10 cm) soil depth. The NO3-N ranged from 5.66 ± 0.73 (N20) to 36.03 ± 6.17 kg ha−1 and the highest value was associated with the N80 treatment. The N60 and N80 treatments differed from the N0, N20, and N40 treatments in terms of NO3-N. The WFPS ranged from 40.40 ± 2.11% (N80) to 54.61 ± 2.65% (N0) during the course of the trial and mean values between the various treatment plots did not differ (p > 0.05) from each other.

3.2. Herbage and Nitrogen Yield

The herbage and N yield are shown in Table 3. Different fertilizer rates had an effect on herbage yield (p < 0.05). Herbage yield was within the range of 18.7 ± 1.1 (N0) to 21.5 ± 0.7 t DM ha−1 (N80). The only significant difference was found between the N80 treatment compared with the N40 and N20 treatments (p < 0.05). The N0, N20, N40, and N60 treatments did not differ (p > 0.05) from each other.
The N yield differed significantly (p < 0.05) between treatments N20, N40, N60, and N80. No differences (p > 0.05) were found between the N0 and N20 treatments. The N yield from the different treatment plots increased as the amount of fertilizer applied increased and was in the range between 582 ± 38.9 (N0) and 900 ± 35.3 kg N ha−1 (N80).

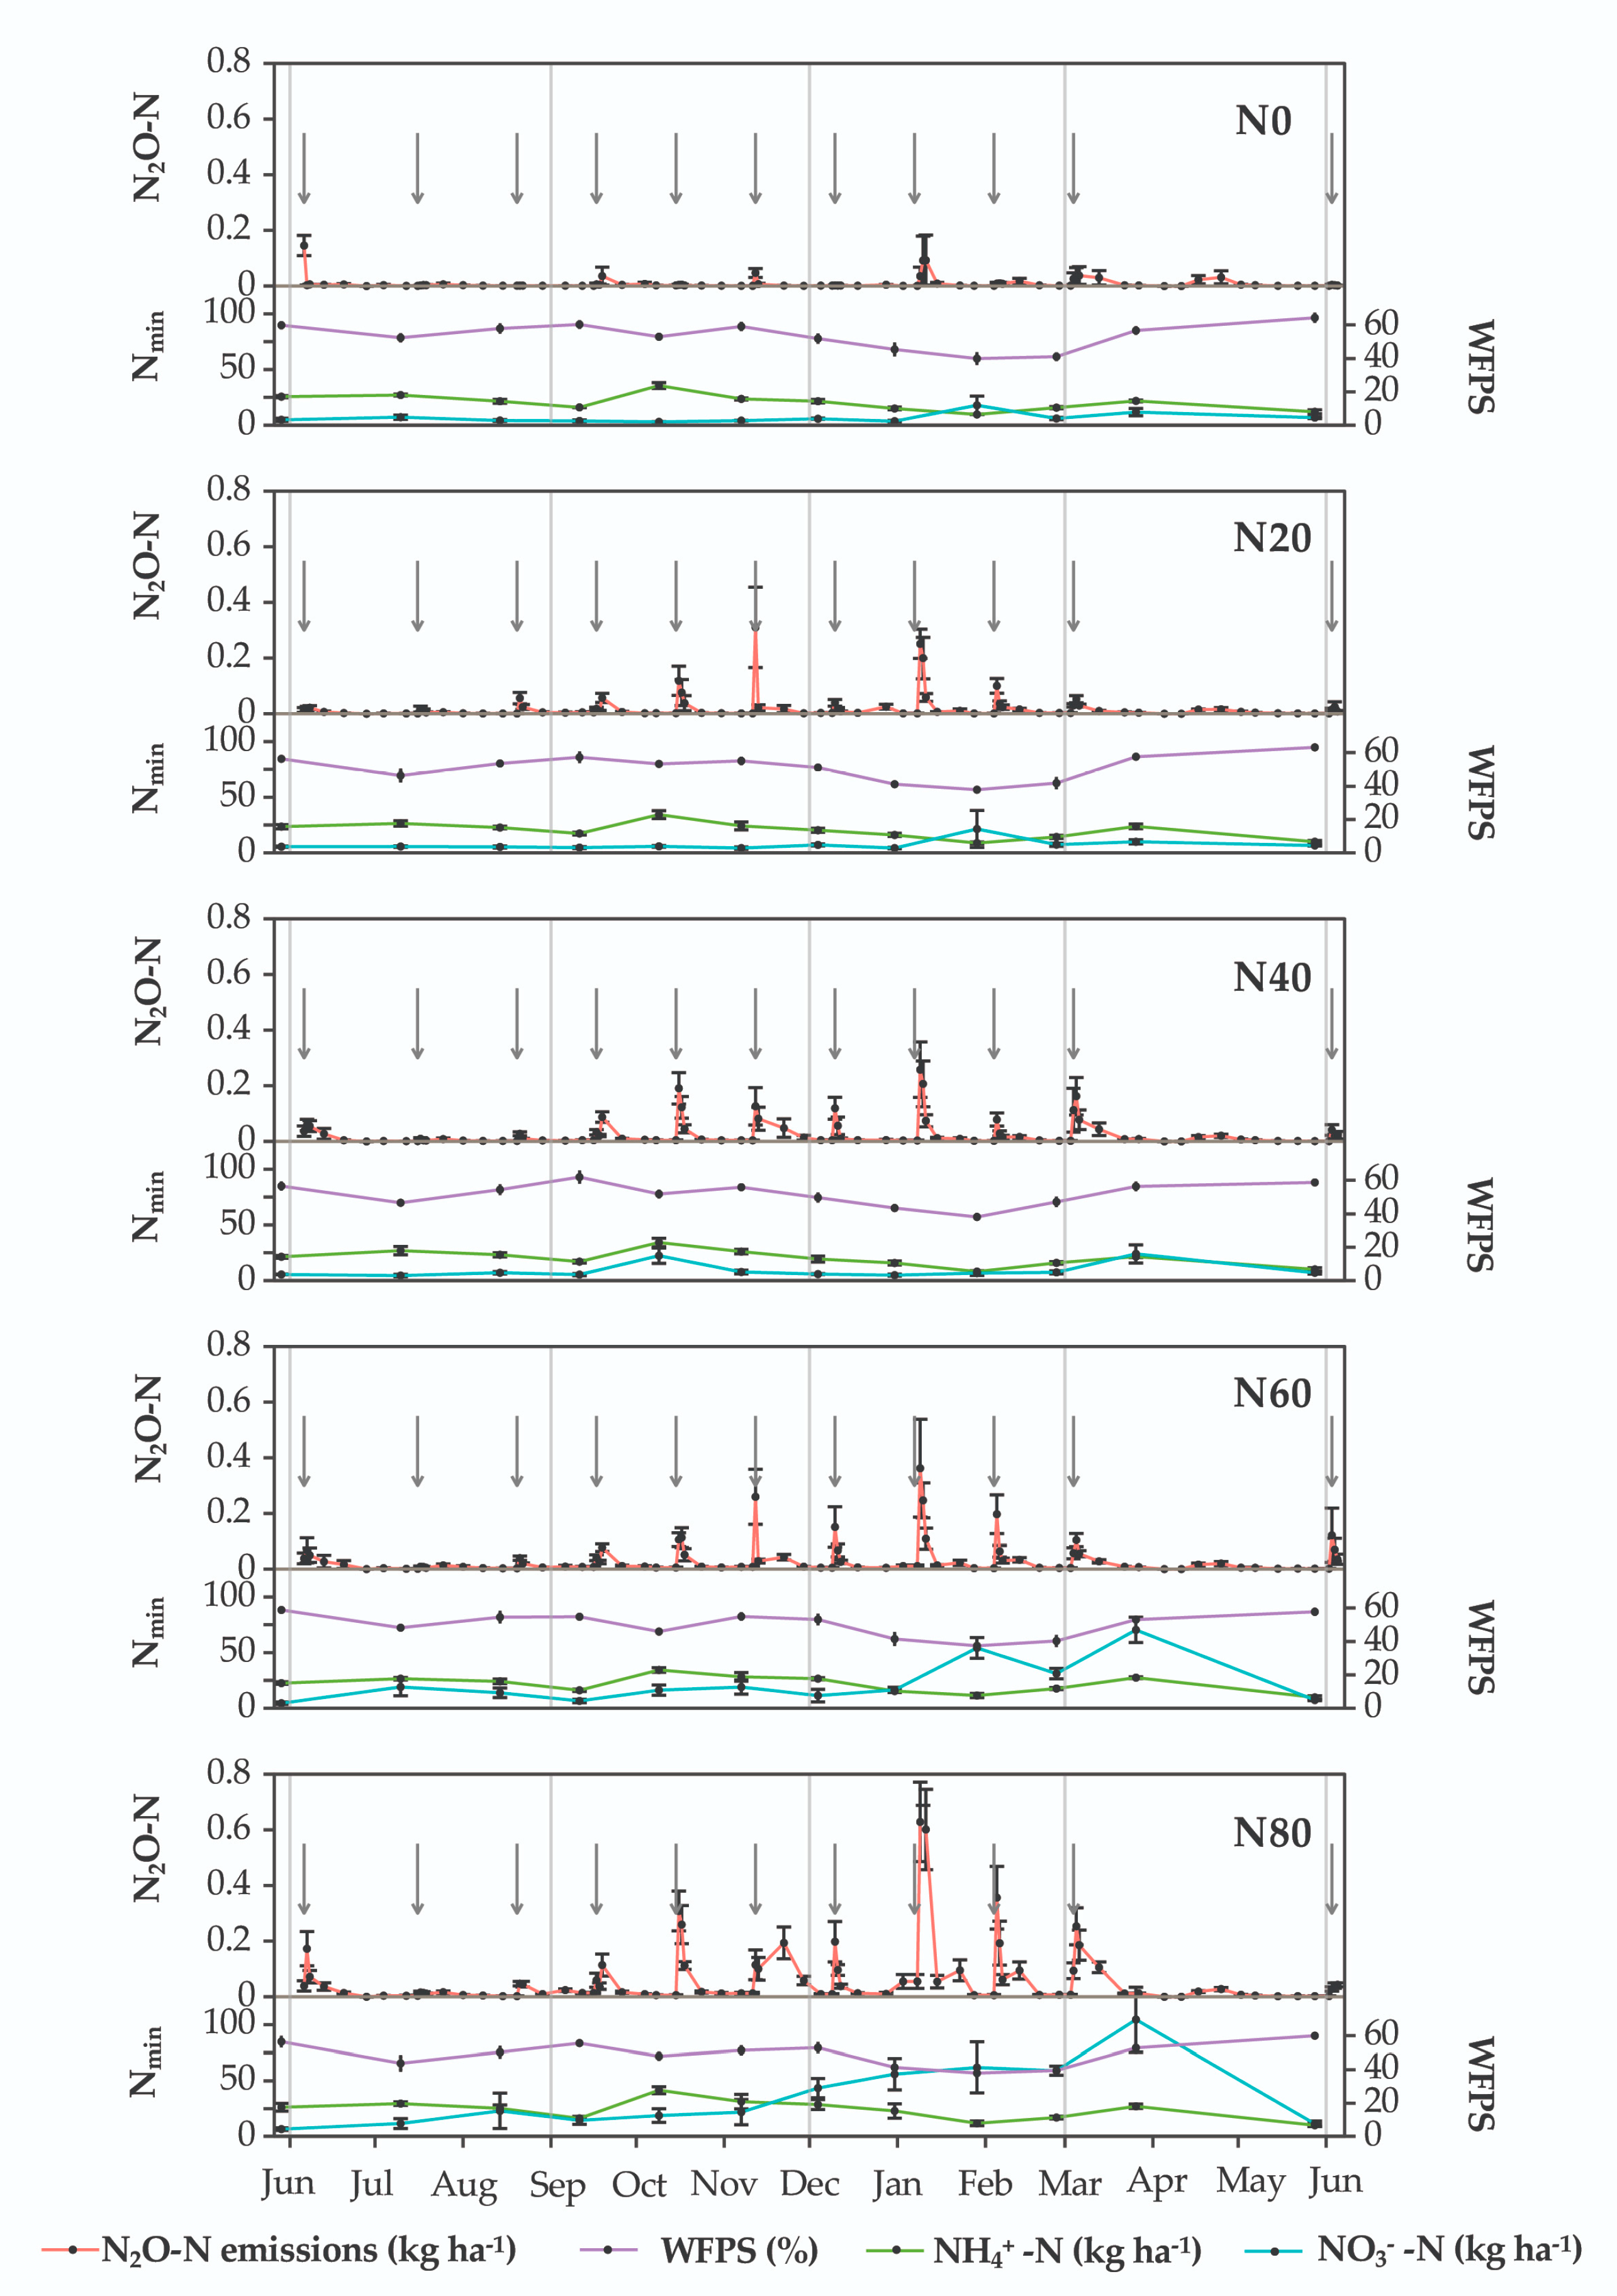
3.3. Daily N2O Fluxes

The daily N2O fluxes over the trial period (June 2018 to June 2019) for the different N fertilizer treatments are shown in Figure 2. Variation in N2O emissions within different weeks were observed, especially in the weeks where N was added as mineral fertilizer. We observed N2O emissions to be episodic with small fluxes throughout the measurement period, except in warmer months where higher fluxes were observed. The minimum daily N2O-N fluxes were close to zero (0.01 kg N2O-N ha−1 day−1) in N0, whereas it ranged between 0.01 and 1.47 kg N2O-N ha−1 day−1 for the different N fertilizer rates during single measurements on sampling days. The highest N2O fluxes were observed for treatments N60 and N80, which occurred during spring and summer and reached peak fluxes of 0.99 and 1.47 kg N2O-N ha−1 day−1, respectively. The lowest N2O fluxes over all treatments were observed during winter and oscillated between 0.01 and 0.49 kg N2O-N ha−1 day−1. N2O fluxes peaked after fertilizer application in all treatments over the measured trial period (Figure 2). Higher N2O fluxes were observed in summer when there were fewer days between rotational grazing events (ca. 28 days) compared with winter grazing (ca. 35 days).

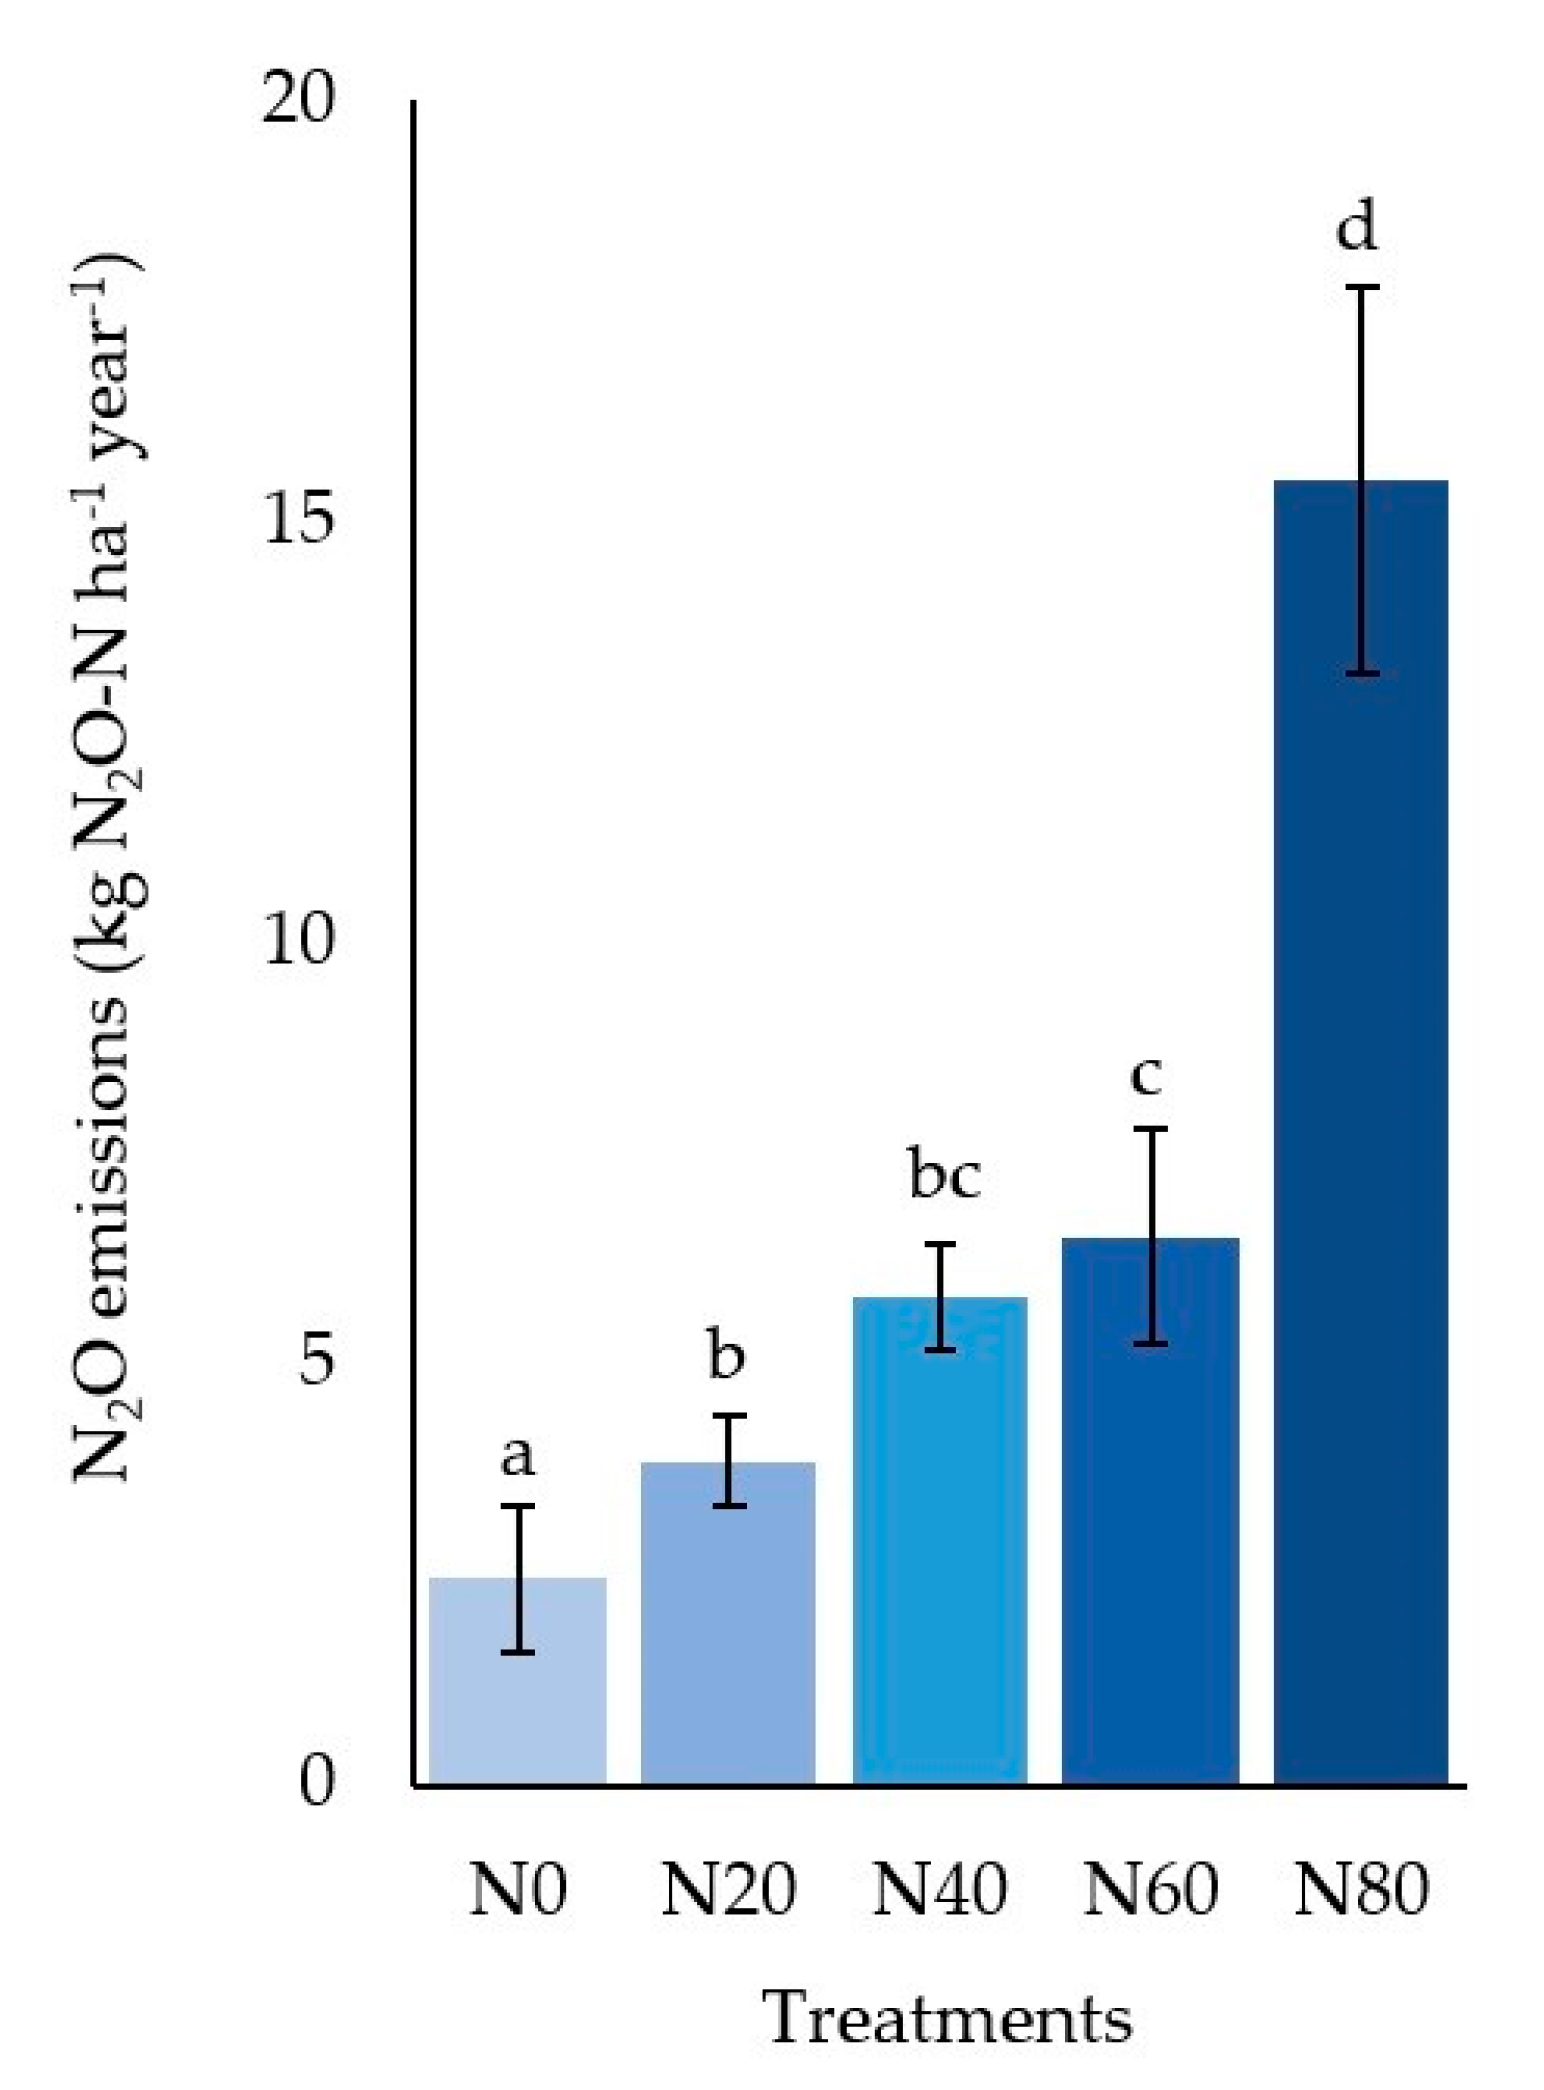
3.4. Accumulated N2O-Losses

The mean accumulated N2O emissions averaged 6.8 ± 5.1 kg N2O-N ha−1 year−1 over the trial period (Figure 3). Accumulated N2O emissions from fertilized treatments were found to be significantly higher (p < 0.05) than the control. Estimated accumulated N2O emissions ranged from 0.7 to 19.3 kg N2O-N ha−1 year−1 during the experimental period (Figure 3). The N80 treatment resulted in the highest accumulated N2O emissions (15.5 kg N2O-N ha−1 year−1) whereas the control plot resulted in the lowest N2O emissions (2.45 kg N2O-N ha−1 year−1). The N20, N40, and N60 treatments resulted in higher emissions than N0 but lower emissions than N80 (3.85, 5.79, and 6.50 kg N2O-N ha−1 year−1, respectively).

3.5. Regressions and Emission Factors

The accumulated N2O emissions showed a significant linear and nonlinear relationship with Ninput and Nbalance (p < 0.05) (Figure 4). However, the best fit was obtained using the nonlinear approach and the amount of total Ninput (Equation (3)). Considering the slopes of the linear regressions each kg of additional N will provoke a share of 1.3% and 1.8% for Ninput and Nbalance, respectively.
The EFdata differed significantly (p < 0.05) between treatments where the N80 treatment differed from the N20 and N60 but not the N40 treatment (data not shown). On average between the different treatments, the EFdata accounted for 0.9% ± 0.1%. Comparing the different approaches with regards to their ability to predict the annual N2O emission sufficiently, the nonlinear regression E3 performed the best (Table 4). In comparison, the IPCC approaches showed a good fit but slightly underestimating (IPCCmin) or heavily overestimating (IPCCmin+exc) the measured values. The regressions E1, E2, and E3 showed comparable R2 and RMSE values but higher NSE compared to IPCC approaches.

4. Discussion

4.1. Nitrogen Yield

The herbage production from pastures in the current study was in the range of 18.7–21.5 t DM ha−1 year−1. This is comparable to previously reported herbage production values for the southern Cape region of South Africa of between 13.5 and 22.9 t DM ha−1 year−1 [18,27,47,48]. Surprisingly, fertilization with mineral N-fertilizers had only a small effect on the herbage production during the current trial, achieving herbage yields and N yields of 19 t DM and 582 kg N ha−1 year−1 even in the non-N fertilized treatments. Viljoen et al. (2020) [27] demonstrated that the soil at the trial site has the ability to release a significant amount of plant-available N from soil organic matter following soil microbial mediated processes. Additionally, because of animal excreta in intensively grazed systems, the plant nutritional value is relevant. The predicted amount of N applied through excreta accounted for more than 400 kg N ha−1 year−1, providing the majority of N in the controlled system.
The typical CP value for grazed kikuyu and ryegrass is affected by season and found to be in the range of 10.7–23.7% and 19–28%, respectively [14]. It is well documented that N content of pasture herbage increases when fertilizer is added [27]. This was also observed in the current study where CP and N yield were the highest in the N80 treatment (880 kg N ha−1 year−1). However, at the same time the high rate of N fertilization led to a N surplus of >400 kg N ha−1 year−1, which means a potential economic loss and environmental threats such as increased GHG emissions and N-leaching to groundwater bodies [49]. High N fertilization rates led to CP contents of >25% with the consequence of high feeding costs and also associated with marginal benefits regarding CP in milk yield [50]. Moreover, high N fertilizer rates in pasture are associated with elevated ammonia volatilization through animal excreta as a result of high protein content found in the diet [50]. It is therefore important for common farming practices to consider the current N-status of the soil as well as the quantity of animal excreta N when fertilization is planned. From our experiment on a farm with a long history of dairy management and with high amounts of additional N inputs from concentrates fed in the milking parlor, a mineral fertilizer rate significantly below 200 kg N ha−1 year−1 is still sufficient to provide adequate herbage yields ≈19 t DM ha−1 with a high CP content (≈18%) for dairy, whilst still maintaining the sward N level. It has to be considered that the overall N input from livestock excreta is maybe slightly overestimated in the N0 and N20 treatments, but underestimated in the N60 and N80 treatments due to the experimental constraint that all plots were grazed in the same manner and thus excreta was potentially not evenly distributed at every grazing interval.

4.2. Daily N2O Fluxes

The use of mineral fertilizer and the effect thereof on N2O emissions is well documented in the literature [24,51,52,53,54], and is also supported by our results. The highest fluxes were observed during the first two weeks after fertilization, which is also in agreement with other observations [55,56,57,58]. Fluxes of N2O are very closely related to environmental conditions as well as soil chemical and physical characteristics [59]. Regarding environmental variables, beyond the availability of N in the soil, the key drivers are soil moisture and temperature as they influence N2O diffusion to the atmosphere [17] and determine the relative rates of nitrification and denitrification [60,61] by influencing the microbial activity [17,62]. The WFPS in the measured period was in the range of 37–64% and averaged around 51% (Figure 2). Plants therefore did not experience water stress because irrigation was applied. N2O production is highest around 60% WFPS and lowest below 30% [63], thus irrigated pastures provided favorable conditions for elevated N2O emissions with regards to soil water. Moreover, a higher frequency of N2O peaks can be assumed as a result from the sum of naturally and artificial rainfall events. Accordingly, large fluxes of N2O coincide with irrigation events as reported by Liu et al. (2006) [57]. In the current study, rainfall and irrigation, together with higher temperatures, were highest during spring and summer (Figure 1). This allowed perfect soil conditions for N-mineralization to take place, accelerating nitrification and denitrification processes and, as a result, increased N2O fluxes [64,65,66]. Accordingly, we found a positive correlation for soil surface (0–1 cm) temperature (r = 0.22), WFPS (r = 0.18), and Nmin (NH4-N) (r = 0.11) and NO3-N (r = 0.33) on measured N2O-fluxes. However, even though we found increasing soil N concentration with increasing fertilization (Table 2 and Figure 2), correlations with N2O are flawed by the poor soil sampling intervals. However, this still indicates the importance of soil chemical properties and environmental variables, which needs to be taken into consideration when locally adapted dynamic modeling approaches are developed in the future.
In addition, sward management is also an explanatory reason for the variability of N2O-fluxes from grazed pastures. Kikuyu pastures in the southern Cape region of South Africa are usually mulched to ground level and over-sown during autumn [48]. The high N2O fluxes observed in April 2019 could be as a result of over-sowing practices and as a consequence, some soil disturbance caused by the furrows created by the seed-drill. A study done by Hao et al. (2001) [21] reported significantly higher N2O emissions during autumn under tillage practices, which also implies that soil disturbance is the cause of the elevated flux observed in the current study during autumn. Higher N mineralization occurs as a result of soil disturbance [67] and mulching [68] and leads to a higher amount of plant available N in soil. However, a small leaf surface area of the plants during autumn would limit the uptake of N as N requirements by plants during autumn are low, resulting in more available N in soil which causes higher N2O-N losses.

4.3. Accumulated N2O-losses

The relationship between Ninput and direct N2O emissions from managed agricultural soils is generally assumed to be linear [69,70]. However, others stated that a linear approach may be too conservative [52] and nonlinear approaches are more suitable to predict annual N2O emissions [26,49,52,54]. The nonlinear relationships are heavily dependent on the plant N demand leading to different slopes with regards to the crop and its specific N requirements. The plant N demand is also influenced by seasons [27]. As described by Kim et al. (2013) [52], direct N2O-N emissions are controlled by competition for available N between plants and microbes when N is provided. Accordingly, the N2O-N emissions would increase linearly as Ninput is increased. However, when N supply is high and exceeds the requirements of plants and microbes, the response would be better explained by an exponential function. As a result, the N surplus from excess N added would lead to lower plant N uptake efficiency [71] leaving residual N as a substrate for additional N2O-N emissions [72].
In our study, cows grazed pastures year-round which makes high N returns to pastures unavoidable. High levels of N surplus on pastures under intensive grazing are a result of N returned via urine and feces during grazing combined with the added N fertilizer (Table 2). This N surplus is the principal driver of N2O production from these managed soils [73]. Rafique et al. (2011) [49] found on highly productive grassland that an input of 300 kg N ha−1 year−1 (which equaled the N-plant demand) the annual N2O-N emissions were less than 5 kg N2O-N ha−1 year−1, but that larger N2O-N emissions were observed when Ninput exceeded 300 kg N ha−1 year−1, ranging from 5.0 to 12.6 kg N2O-N ha−1 year−1. Accordingly, we found the lowest emissions in the control, which exclusively received only excreted N, resulting in a negative N-balance as no legumes were seeded in the grassland sward.

4.4. Predictions of Annual N2O Emissions from Pastures

The IPCC suggested a methodology to estimate N2O emissions from managed soils according to mineral and organic fertilizers as well as animal excreta. It is considered that 1% of added fertilizer and 2% of animal excreta N is converted to N2O-N [1]. Regarding this proposed linear approach, we also found a linear relationship between the annual accumulated N2O emissions and Ninput.
However, in this study we distinguished between the linear approaches by evaluating the effect of mineral fertilizers applied (after emissions from the grazed-only control treatment were deducted) and the Ninput (from mineral fertilizers and excreta). Measured emissions were compared with a calculated EFdata value as well as with the IPCC default values. After deducting the background emissions from grazing, our calculated EF was on average 0.9% and thus in agreement with the IPCC default value of 1% for mineral fertilizers. Previous research on N2O emissions focused on one level of N fertilization but as a growing number of field experiments with multiple N fertilization rates have indicated, the relationship is better described as nonlinear [26]. The EFs from the current study follow the same relationship as N2O emissions increase nonlinearly when high levels of Ninput, taking fertilizer and animal excreta into account, exceed plant needs [74]. It was also suggested by Rafique et al. (2011) [49] that the IPCC tier 1 default value should consider a nonlinear relationship between Ninput and N2O emission in grazed grasslands. In accordance with that, our study indicated that the inclusion of the IPCC default value for animal excreta heavily overpredicted the measured N2O emissions. It is important to note that grazing animals excrete much of the consumed N as urine and manure back onto pastures, and when deposited unevenly this results in highly localized concentrations or so called “hot spots” of N in soils [75]. In the present study our use of the chamber method might, theoretically, have carried a possible risk that we could not consider all the N2O-N emissions emitted by these soils as excreta did not always fall within the chamber bases. However, this is not very likely as it can be assumed that an even distribution of ‘hot spots’ occurred during 11 grazing cycles and chambers were randomly spread. Recent studies also indicated that the IPCC EF for animal excreta is overpredicted in the grazing period, supporting the validity of our results regarding grazing impact [75,76,77].

4.5. Mitigation Strategies

It is evident that excreta are a major contributor to the N2O emissions on pasture-based systems [78]. Thus, mitigation can be achieved by taking animal excreta carefully into account when planning N fertilization. In our study, animal excreta-derived N already provided adequate herbage yield and CP contents without adding additional mineral fertilizer. However, when additional mineral fertilizer is used, it should be carefully planned and managed. It is suggested in a recent article by Viljoen et al. (2020) [27] that a variable N fertilization rate, when plant demands for N are high, could be adapted seasonally and be increased or decreased as the season dictates. This would further aid in mitigating N2O emissions. Such an approach would be more sustainable and more economically viable in pasture-based dairy systems in the southern Cape of South Africa depending on the practices on the specific farms.
Improved crop varieties and boosting soil health, which would lead to improved nitrogen-use efficiency, is one way of mitigation [15]. Using alternative forage species incorporated into pastures could be another mitigation strategy in reducing N2O emissions derived from animal excreta due to biological nitrification inhibition and/or changes in the soil water content [75]. The effective management of forage legumes in a pasture could lead to less N fertilizer used and as a result less N2O emissions [79]. Moreover, legume-based forage production shows an efficient N cycling which results in less N surpluses and lower environmental loads of reactive N [80]. However, with an increase in N fertilizer, the legume component of pasture is likely to decrease. A recent review highlighted the potential of plant species to reduce N2O emissions by looking at plant-effects on urinary-N2O emissions [81].
One of the most effective strategies considered for the reduction of N2O emissions under irrigation may be to combine the use of nitrification inhibitors [82] with reduced water volumes, spaced over more applications [83]. Different irrigation methods such as drip and sub-surface drip irrigation can also reduce N2O emissions, when compared to surface irrigation methods [84].
The final aim should be to maintain current yields or improve them to sustain a high milk production, all whilst reducing the negative environmental effects associated with dairy production.

5. Conclusions

Excessive use of mineral fertilizers on intensive rotational grazed pastures in South Africa resulted in high N surpluses (> 400 kg N ha−1 year−1) and provided the majority of N in the system. Our results indicated that the relationship between N2O-N losses and N input, when plant N demand is considered, can best be described by a nonlinear function rather than a linear function. The suggested EFs of the IPCC tier 1 default value for grazing systems led to an overestimation of N2O emissions. A better approach would be to replace EFs of the IPCC tier 1 default value with regional EF values which are dependent on the N balance. This could lead to more accurate N2O emissions from managed soils on a regional scale, where other environmental threats such as groundwater pollution and eutrophication are also addressed at the same time.

Supplementary Materials

The following are available online at https://www.mdpi.com/2073-4433/11/9/925/s1, Table S1: The mean mineralizable nitrogen (Nmin), NH4+-N, NO3-N, and WFPS for the different N fertilization treatments (N0, N20, N40, N60, and N80) for soil depth 0–10 cm, during the trial period (June 2018–June 2019). The standard error of the mean is shown in brackets. The N0, N20, N40, N60, and N80 refer to the different treatments used and were 0, 220, 440, 660, and 880 kg N ha−1 year−1 respectively.

Author Contributions

Conceptualization, H.P.J.S. and T.R.; Methodology, P.A.S., T.R. and H.P.J.S.; Software, C.K.; Formal analysis, C.K. and H.P.J.S.; Investigation, H.P.J.S.; Data curation, C.K.; Writing—original draft preparation, H.P.J.S.; Writing—review and editing, T.R., P.A.S., C.K. and F.T.; Visualization, T.R. and H.P.J.S.; Supervision, T.R., P.A.S. and F.T.; Funding acquisition, F.T. and P.A.S. All authors have read and agreed to the published version of the manuscript.

Funding

This research received financial support from Milk South Africa. H.P.J.S. is supported by the Evangelisches Studienwerk Villigst foundation, under the research program: “Third Ways of Feeding The World”. The Western Cape Department of Agriculture and Stellenbosch University also contributed to the project.

Acknowledgments

The primary investigator wishes to thank the Evangelisches Studienwerk Villigst foundation for funding provided in the form of a doctoral scholarship. The Western Cape Department of Agriculture is acknowledged for making Outeniqua Research Farm available for conducting the study. Robin Meeske, Sigrun Ammann, and Janke van der Colf for their guidance and assistance on Outeniqua Research Farm. Charné Viljoen, Anesmé van Wyk, Ranier van Heerden, and Lonwabu Kuboni are greatly acknowledge for assistance with gas sample collections throughout the whole trial period. Katrin Helmich is thanked for laboratory analyses. The authors would also like to thank Milk South Africa for valuable comments to improve the quality of this article. The authors acknowledge financial support by Land Schleswig-Holstein within the funding program Open Access Publikationsfonds. Anonymous reviewers are thanked for valuable comments which improved the quality of the manuscript.

Conflicts of Interest

The authors declare no conflict of interest.

References

  1. Eggleston, H.S.; Buendia, L.; Miwa, K.; Ngara, T.; Tanabe, K. IPCC Guidelines for National Greenhouse Gas Inventories; Institute for Global Environmental Strategies (IGES): Hayama, Japan, 2006. [Google Scholar]
  2. Stevens, R.J.; Laughlin, R.J.; Burns, L.C.; Arah, J.R.M.; Hood, R.C. Measuring the contributions of nitrification and denitrification to the flux of nitrous oxide from soil. Soil Biol. Biochem. 1997, 29, 139–151. [Google Scholar] [CrossRef]
  3. Team, C.W.; Pachauri, R.K.; Meyer, L.A. IPCC 2014, Climate Change 2014: Synthesis Report. Contribution of Working Groups I, II and III to the Fifth Assessment Report of the Intergovernmental Panel on Climate Change; IPCC: Geneva, Switzerland, 2014. [Google Scholar]
  4. Reay, D.S.; Davidson, E.A.; Smith, K.A.; Smith, P.; Melillo, J.M.; Dentener, F.; Crutzen, P.J. Global agriculture and nitrous oxide emissions. Nat. Clim. Chang. 2012, 2, 410–416. [Google Scholar] [CrossRef]
  5. Bellarby, J.; Foereid, B.; Hastings, A.F.S.J.; Smith, P. Cool Farming: Climate Impacts of Agriculture and Mitigation Potential; Greenpeace International: Amsterdam, The Netherlands, 2008; Volume 44. [Google Scholar]
  6. DEA. Greenhouse Gas Inventory for South Africa: 2000 to 2015; National Inventory Report; Department of Environmental Affairs: Pretoria, Republic of South Africa, 2016. Available online: https://www.environment.gov.za/sites/default/files/reports/GHG-National-Inventory-Report-SouthAfrica-2000-2015.pdf (accessed on 13 January 2020).
  7. Department of Environmental Affairs. South Africa’s Low-Emission Development Strategy 2050; Department of Environmental Affairs: Pretoria, South Africa, 2018. [Google Scholar]
  8. Aneja, V.P.; Schlesinger, W.H.; Li, Q.; Nahas, A.; Battye, W.H. Characterization of atmospheric nitrous oxide emissions from global agricultural soils. SN Appl. Sci. 2019, 1, 1622. [Google Scholar] [CrossRef] [Green Version]
  9. Ramanantenasoa, M.M.J.; Génermont, S.; Gilliot, J.M.; Bedos, C.; Makowski, D. Meta-modeling methods for estimating ammonia volatilization from nitrogen fertilizer and manure applications. J. Environ. Manag. 2019, 236, 195–205. [Google Scholar] [CrossRef] [PubMed]
  10. Milk Producers’ Organization. Lacto Data. A Milk SA Publication Compiled by the Milk Producers’ Organization. Milk Producer Statistics. 2019. Available online: https://milksa.co.za/taxonomy/term/38 (accessed on 20 January 2020).
  11. Gertenbach, W. Dairy Farming in South Africa-Where to Now? Institute for Animal Production Western Cape Department of Agriculture. 2007. Available online: http://www.fao.org/fileadmin/templates/est/COMM_MARKETS_MONITORING/Dairy/Documents/18_William_Gertenbach__paper.pdf (accessed on 6 March 2020).
  12. Reinecke, R.; Casey, N.H. A whole farm model for quantifying total greenhouse gas emissions on South African dairy farms. S. Afr. J. Anim. Sci. 2017, 47, 883. [Google Scholar] [CrossRef]
  13. Milk Producers’ Organization. Lacto Data. A Milk SA Publication Compiled by the Milk Producers’ Organization. Milk Producer Statistics. 2017. Available online: https://milksa.co.za/taxonomy/term/38 (accessed on 20 January 2020).
  14. Van der Colf, J. The production Potential of Kikuyu (Pennisetum Clandestinum) Pastures Over-Sown with Ryegrass (Lolium spp.). Master´s Thesis, University of Pretoria, Pretoria, South Africa, 2011. [Google Scholar]
  15. Houlton, B.Z.; Almaraz, M.; Aneja, V.; Austin, A.T.; Bai, E.; Cassman, K.G.; Compton, J.E.; Davidson, E.A.; Erisman, J.W.; Galloway, J.N.; et al. A World of Cobenefits: Solving the Global Nitrogen Challenge. Earths Future 2019, 7, 865–872. [Google Scholar] [CrossRef] [Green Version]
  16. Mosier, A.R.; Doran, J.W.; Freney, J.R. Managing soil denitrification. J. Soil Water Conserv. 2002, 57, 505–512. [Google Scholar]
  17. Signor, D.; Cerri, C.E.P. Nitrous oxide emissions in agricultural soils: A review. Pesqui. Agropecuária Trop. 2013, 43, 322–338. [Google Scholar] [CrossRef]
  18. Swanepoel, P.A.; Habig, J.; du Preez, C.C.; Botha, P.R.; Snyman, H.A. Biological quality of a podzolic soil after 19 years of irrigated minimum-till kikuyu-ryegrass pasture. Soil Res. 2014, 52, 64–75. [Google Scholar] [CrossRef] [Green Version]
  19. Sutton, M.A.; Oenema, O.; Erisman, J.W.; Leip, A.; van Grinsven, H.; Winiwarter, W. Too much of a good thing. Nature 2011, 472, 159–161. [Google Scholar] [CrossRef] [Green Version]
  20. Botha, P.R. Factors influencing the persistence and production potential of kikuyu (Pennisetum clandestinum) over-sown with different ryegrass and clover species in the southern Cape. Elsenbg. Joernall 2009, 3, 4–9. [Google Scholar]
  21. Hao, X.; Chang, C.; Carefoot, J.M.; Janzen, H.H.; Ellert, B.H. Nitrous oxide emissions from an irrigated soil as affected by fertilizer and straw management. Nutr. Cycl. Agroecosyst. 2001, 60, 1–8. [Google Scholar] [CrossRef]
  22. Mosier, A.; Schimel, D.; Valentine, D.; Bronson, K.; Parton, W. Methane and nitrous oxide fluxes in native, fertilized and cultivated grasslands. Nature 1991, 350, 330–332. [Google Scholar] [CrossRef]
  23. Breitenbeck, G.A.; Blackmer, A.M.; Bremner, J.M. Effects of different nitrogen fertilizers on emission of nitrous-oxide from soil. Geophys. Res. Lett. 1980, 7, 85–88. [Google Scholar] [CrossRef]
  24. Velthof, G.L.; Oenema, O.; Postma, R.; van Beusichem, M.L. Effects of type and amount of applied nitrogen fertilizer on nitrous oxide fluxes from intensively managed grassland. Nutr. Cycl. Agroecosyst. 1996, 46, 257–267. [Google Scholar] [CrossRef]
  25. Zanatta, J.A.; Bayer, C.; Vieira, F.C.B.; Gomes, J.; Tomazi, M. Nitrous oxide and methane fluxes in south Brazilian gleysol as affected by nitrogen fertilizers. Rev. Bras. Ciência do Solo 2010, 34, 1653–1665. [Google Scholar] [CrossRef] [Green Version]
  26. Shcherbak, I.; Millar, N.; Robertson, G.P. Global metaanalysis of the nonlinear response of soil nitrous oxide (N2O) emissions to fertilizer nitrogen. Proc. Natl. Acad. Sci. USA 2014, 111, 9199–9204. [Google Scholar] [CrossRef] [Green Version]
  27. Viljoen, C.; van der Colf, J.; Swanepoel, P.A. Benefits are Limited with High Nitrogen Fertiliser Rates in Kikuyu-Ryegrass Pasture Systems. Land 2020, 9, 173. [Google Scholar] [CrossRef]
  28. Swanepoel, P.A.; du Preez, C.C.; Botha, P.R.; Snyman, H.A. A critical view on the soil fertility status of minimum-till kikuyu–ryegrass pastures in South Africa. Afr. J. Range For. Sci. 2015, 32, 113–124. [Google Scholar] [CrossRef]
  29. Sutton, M.A.; Howard, C.M.; Brownlie, W.J.; Skiba, U.; Hicks, W.K.; Winiwarter, W.; van Grinsven, H.; Bleeker, A.; Westhoek, H.; Oenema, O.; et al. The European Nitrogen Assessment 6 years after: What was the outcome and what are the future research challenges? Proc. Int. Conf. Innov. Solut. Sustain. Manag. Nitrogen 2017, 40–49. [Google Scholar]
  30. Roy, P.; Nei, D.; Orikasa, T.; Xu, Q.; Okadome, H.; Nakamura, N.; Shiina, T. A review of life cycle assessment (LCA) on some food products. J. Food Eng. 2009, 90, 1–10. [Google Scholar] [CrossRef]
  31. Swanepoel, P.A.; du Preez, C.C.; Botha, P.R.; Snyman, H.A.; Habig, J. Soil quality characteristics of kikuyu-ryegrass pastures in South Africa. Geoderma 2014, 232–234, 589–599. [Google Scholar] [CrossRef]
  32. Sparks, D.L.; Page, A.L.; Helmke, P.A.; Loeppert, R.H. Methods of Soil Analysis, Part 3: Chemical Methods, 14th ed.; John Wiley & Sons.: Madison, WI, USA, 2020. [Google Scholar]
  33. Hutchinson, G.L.; Mosier, A.R. Improved Soil Cover Method for Field Measurement of Nitrous Oxide Fluxes. Soil Sci. Soc. Am. J. 1981, 45, 311–316. [Google Scholar] [CrossRef]
  34. Rochette, P. Towards a standard non-steady-state chamber methodology for measuring soil N2O emissions. Anim. Feed Sci. Technol. 2011, 166–167, 141–146. [Google Scholar] [CrossRef]
  35. Beetz, S.; Liebersbach, H.; Glatzel, S.; Jurasinski, G.; Buczko, U.; Höper, H. Effects of land use intensity on the full greenhouse gas balance in an Atlantic peat bog. Biogeosciences 2013, 10, 1067–1082. [Google Scholar] [CrossRef] [Green Version]
  36. Nennich, T.D.; Harrison, J.H.; VanWieringen, L.M.; Meyer, D.; Heinrichs, A.J.; Weiss, W.P.; St-Pierre, N.R.; Kincaid, R.L.; Davidson, D.L.; Block, E. Prediction of manure and nutrient excretion from dairy cattle. J. Dairy Sci. 2005, 88, 3721–3733. [Google Scholar] [CrossRef] [Green Version]
  37. Loague, K.; Green, R.E. Statistical and graphical methods for evaluating solute transport models: Overview and application. J. Contam. Hydrol. 1991, 7, 51–73. [Google Scholar] [CrossRef]
  38. Cataldo, D.A.; Maroon, M.; Schrader, L.E.; Youngs, V.L. Rapid colorimetric determination of nitrate in plant tissue by nitration of salicylic acid. Commun. Soil Sci. Plant Anal. 1975, 6, 71–80. [Google Scholar] [CrossRef]
  39. Page, A.L.; Miller, R.H.; Keeney, D.R. Methods of Soil Analysis Part 2 (Agronomy Monographs 9); Wiley: Madison, WI, USA, 1982. [Google Scholar]
  40. R Core Team. R: A Language and Environment for Statistical Computing; R Foundation for Statistical Computing: Vienna, Austria, 2019. [Google Scholar]
  41. Pinheiro, J.; Bates, D.; DebRoy, S.; Sarkar, D.; R Core Team. Nlme: Linear and Nonlinear Mixed Effects Models. R Package Version 3.1-147. 2020. Available online: https://CRAN.R-project.org/package=nlme (accessed on 11 March 2020).
  42. Hothorn, T.; Bretz, F.; Westfall, P. Simultaneous inference in general parametric models. Biom. J. 2008, 50, 346–363. [Google Scholar] [CrossRef] [Green Version]
  43. Laird, N.M.; Ware, J.H. Random-effects models for longitudinal data. Biometrics 1982, 38, 963–974. [Google Scholar] [CrossRef]
  44. Verbeke, G.; Molenberghs, G. Linear Mixed Models for Longitudinal Data. In Springer Series in Statistics; Springer: Berlin/Heidelberg, Germany, 2000. [Google Scholar]
  45. Kozak, M.; Piepho, H.P. What’s normal anyway? Residual plots are more telling than significance tests when checking ANOVA assumptions. J. Agron. Crop Sci. 2018, 204, 86–98. [Google Scholar] [CrossRef]
  46. Bretz, F.; Hothorn, T.; Westfall, P. Multiple Comparisons Using R, 1st ed.; Chapman and Hall/CRC: London, UK, 2011. [Google Scholar]
  47. Botha, P.R.; Meeske, R.; Snyman, H.A. Kikuyu over-sown with ryegrass and clover: Grazing capacity, milk production and milk composition. Afr. J. Range Forage Sci. 2008, 25, 103–110. [Google Scholar] [CrossRef]
  48. Van der Colf, J.; Botha, P.R.; Meeske, R.; Truter, W.F. Seasonal dry matter production, botanical composition and forage quality of kikuyu over-sown with annual or perennial ryegrass. Afr. J. Range Forage Sci. 2015, 32, 133–142. [Google Scholar] [CrossRef] [Green Version]
  49. Rafique, R.; Hennessy, D.; Kiely, G. Nitrous Oxide Emission from Grazed Grassland Under Different Management Systems. Ecosystems 2011, 14, 563–582. [Google Scholar] [CrossRef]
  50. Frank, B.; Swensson, C. Relationship between content of crude protein in rations for dairy cows and milk yield, concentration of urea in milk and ammonia emissions. J. Dairy Sci. 2002, 85, 1829–1838. [Google Scholar] [CrossRef] [Green Version]
  51. Maharjan, B.; Venterea, R.T.; Rosen, C. Fertilizer and irrigation management effects on nitrous oxide emissions and nitrate leaching. Agron. J. 2014, 106, 703–714. [Google Scholar] [CrossRef] [Green Version]
  52. Kim, D.G.; Hernandez-Ramirez, G.; Giltrap, D. Linear and nonlinear dependency of direct nitrous oxide emissions on fertilizer nitrogen input: A meta-analysis. Agric. Ecosyst. Environ. 2013, 168, 53–65. [Google Scholar] [CrossRef]
  53. Van der Weerden, T.J.; Cox, N.; Luo, J.; Di, H.J.; Podolyan, A.; Phillips, R.L.; Saggar, S.; de Klein, C.A.M.; Ettema, P.; Rys, G. Refining the New Zealand nitrous oxide emission factor for urea fertiliser and farm dairy effluent. Agric. Ecosyst. Environ. 2016, 222, 133–137. [Google Scholar] [CrossRef]
  54. Bouwman, A.F.; Boumans, L.J.M.; Batjes, N.H. Emissions of N2O and NO from fertilized fields: Summary of available measurement data. Glob. Biogeochem. Cycles 2002, 16, 1058. [Google Scholar] [CrossRef]
  55. Bergstrom, D.W.; Tenuta, M.; Beauchamp, E.G. Nitrous oxide production and flux from soil under sod following application of different nitrogen fertilizers. Commun. Soil Sci. Plant Anal. 2001, 32, 553–570. [Google Scholar] [CrossRef]
  56. Liu, X.J.; Mosier, A.R.; Halvorson, A.D.; Zhang, F.S. Tillage and nitrogen application effects on nitrous and nitric oxide emissions from irrigated corn fields. Plant Soil 2005, 276, 235–249. [Google Scholar] [CrossRef]
  57. Liu, X.J.; Mosier, A.R.; Halvorson, A.D.; Zhang, F.S. The impact of nitrogen placement and tillage on NO, N2O, CH4 and CO2 fluxes from a clay loam soil. Plant Soil 2006, 280, 177–188. [Google Scholar] [CrossRef]
  58. Schils, R.L.M.; Van Groenigen, J.W.; Velthof, G.L.; Kuikman, P.J. Nitrous oxide emissions from multiple combined applications of fertiliser and cattle slurry to grassland. Plant Soil 2008, 310, 89–101. [Google Scholar] [CrossRef] [Green Version]
  59. Davidson, E.A.; Swank, W.T. Environmental parameters regulating gaseous nitrogen losses from two forested ecosystems via nitrification and denitrification. Appl. Environ. Microbiol. 1986, 52, 1287–1292. [Google Scholar] [CrossRef] [PubMed] [Green Version]
  60. Dobbie, K.E.; Smith, K.A. The effects of temperature, water-filled pore space and land use on N2O emissions from an imperfectly drained gleysol. Eur. J. Soil Sci. 2001, 52, 667–673. [Google Scholar] [CrossRef]
  61. Firestone, M.K.; Davidson, E.A. Microbiologial Basis of NO and N2O production and consumption in soil. Exch. Trace Gases Terr. Ecosyst. Atmos. 1989, 47, 7–21. [Google Scholar]
  62. Oertel, C.; Matschullat, J.; Zurba, K.; Zimmermann, F.; Erasmi, S. Greenhouse gas emissions from soils—A review. Chemie der Erde 2016, 76, 327–352. [Google Scholar] [CrossRef] [Green Version]
  63. Gao, B.; Ju, X.; Su, F.; Meng, Q.; Oenema, O.; Christie, P.; Chen, X.; Zhang, F. Nitrous oxide and methane emissions from optimized and alternative cereal cropping systems on the North China Plain: A two-year field study. Sci. Total Environ. 2014, 472, 112–124. [Google Scholar] [CrossRef]
  64. Akiyama, H.; Tsuruta, H.; Watanabe, T. N2O and NO emissions from soils after the application of different chemical fertilizers. Chemosph. Glob. Chang. Sci. 2000, 2, 313–320. [Google Scholar] [CrossRef]
  65. Brentrup, F.; Küsters, J.; Lammel, J.; Kuhlmann, H. Methods to estimate on-field nitrogen emissions from crop production as an input to LCA studies in the agricultural sector. Int. J. Life Cycle Assess. 2000, 5, 349–357. [Google Scholar] [CrossRef]
  66. McAuliffe, G.A.; López-Aizpún, M.; Blackwell, M.S.A.; Castellano-Hinojosa, A.; Darch, T.; Evans, J.; Horrocks, C.; le Cocq, K.; Takahashi, T.; Harris, P.; et al. Elucidating three-way interactions between soil, pasture and animals that regulate nitrous oxide emissions from temperate grazing systems. Agric. Ecosyst. Environ. 2020, 300, 106978. [Google Scholar] [CrossRef]
  67. Kristensen, H.L.; McCarty, G.W.; Meisinger, J.J. Effects of Soil Structure Disturbance on Mineralization of Organic Soil Nitrogen. Soil Sci. Soc. Am. J. 2000, 64, 371–378. [Google Scholar] [CrossRef]
  68. Fang, S.; Xie, B.; Zhang, H. Nitrogen dynamics and mineralization in degraded agricultural soil mulched with fresh grass. Plant Soil 2007, 300, 269–280. [Google Scholar] [CrossRef]
  69. Van Beek, C.L.; Pleijter, M.; Jacobs, C.M.J.; Velthof, G.L.; van Groenigen, J.W.; Kuikman, P.J. Emissions of N2O from fertilized and grazed grassland on organic soil in relation to groundwater level. Nutr. Cycl. Agroecosyst. 2010, 86, 331–340. [Google Scholar] [CrossRef] [Green Version]
  70. Flechard, C.R.; Ambus, P.; Skiba, U.; Rees, R.M.; Hensen, A.; van Amstel, A.; van den Pol-van Dasselaar, A.; Soussana, J.F.; Jones, M.; Clifton-Brown, J.; et al. Effects of climate and management intensity on nitrous oxide emissions in grassland systems across Europe. Agric. Ecosyst. Environ. 2007, 121, 135–152. [Google Scholar] [CrossRef]
  71. Hong, N.; Scharf, P.C.; Davis, J.G.; Kitchen, N.R.; Sudduth, K.A. Economically Optimal Nitrogen Rate Reduces Soil Residual Nitrate. J. Environ. Qual. 2007, 36, 354–362. [Google Scholar] [CrossRef] [Green Version]
  72. McSwiney, C.P.; Robertson, G.P. Nonlinear response of N2O flux to incremental fertilizer addition in a continuous maize (Zea mays L.) cropping system. Glob. Chang. Biol. 2005, 11, 1712–1719. [Google Scholar] [CrossRef]
  73. Saggar, S.; Andrew, R.M.; Tate, K.R.; Hedley, C.B.; Rodda, N.J.; Townsend, J.A. Modelling nitrous oxide emissions from dairy-grazed pastures. Nutr. Cycl. Agroecosyst. 2004, 68, 243–255. [Google Scholar] [CrossRef]
  74. Van Groenigen, J.W.; Velthof, G.L.; Oenema, O.; van Groenigen, K.J.; Van Kessel, C. Towards an agronomic assessment of N2O emissions: A case study for arable crops. Eur. J. Soil Sci. 2010, 61, 903–913. [Google Scholar] [CrossRef]
  75. Luo, J.; Balvert, S.F.; Wise, B.; Welten, B.; Ledgard, S.F.; de Klein, C.A.M.; Lindsey, S.; Judge, A. Using alternative forage species to reduce emissions of the greenhouse gas nitrous oxide from cattle urine deposited onto soil. Sci. Total Environ. 2018, 610–611, 1271–1280. [Google Scholar] [CrossRef]
  76. Chadwick, D.R.; Cardenas, L.M.; Dhanoa, M.S.; Donovan, N.; Misselbrook, T.; Williams, J.R.; Thorman, R.E.; McGeough, K.L.; Watson, C.J.; Bell, M.; et al. The contribution of cattle urine and dung to nitrous oxide emissions: Quantification of country specific emission factors and implications for national inventories. Sci. Total Environ. 2018, 635, 607–617. [Google Scholar] [CrossRef] [PubMed]
  77. Kelliher, F.M.; Cox, N.; van der Weerden, T.J.; de Klein, C.A.M.; Luo, J.; Cameron, K.C.; Di, H.J.; Giltrap, D.; Rys, G. Statistical analysis of nitrous oxide emission factors from pastoral agriculture field trials conducted in New Zealand. Environ. Pollut. 2014, 186, 63–66. [Google Scholar] [CrossRef] [Green Version]
  78. Rochette, P.; Chantigny, M.H.; Ziadi, N.; Angers, D.A.; Bélanger, G.; Charbonneau, É.; Pellerin, D.; Liang, C.; Bertrand, N. Soil Nitrous Oxide Emissions after Deposition of Dairy Cow Excreta in Eastern Canada. J. Environ. Qual. 2014, 43, 829–841. [Google Scholar] [CrossRef]
  79. Wang, W.; Robertson, G.P.; Parton, W.J.; Dalal, R.C. Nitrous oxide emission from Australian agricultural lands and mitigation options: A review. Aust. J. Soil Res. 2003, 41, 165–195. [Google Scholar]
  80. Reinsch, T.; Malisch, C.; Loges, R.; Taube, F. Nitrous oxide emissions from grass–clover swards as influenced by sward age and biological nitrogen fixation. Grass Forage Sci. 2020. [Google Scholar] [CrossRef]
  81. De Klein, C.A.M.; van der Weerden, T.J.; Luo, J.; Cameron, K.C.; Di, H.J. A review of plant options for mitigating nitrous oxide emissions from pasture-based systems. N. Z. J. Agric. Res. 2020, 63, 29–43. [Google Scholar] [CrossRef]
  82. Jamali, H.; Quayle, W.; Scheer, C.; Baldock, J. Mitigation of N2O emissions from surface-irrigated cropping systems using water management and the nitrification inhibitor DMPP. Soil Res. 2016, 54, 481–493. [Google Scholar] [CrossRef]
  83. Jamali, H.; Quayle, W.C.; Baldock, J. Reducing nitrous oxide emissions and nitrogen leaching losses from irrigated arable cropping in Australia through optimized irrigation scheduling. Agric. For. Meteorol. 2015, 208, 32–39. [Google Scholar] [CrossRef]
  84. Deng, J.; Guo, L.; Salas, W.; Ingraham, P.; Charrier-Klobas, J.G.; Frolking, S.; Li, C. Changes in Irrigation Practices Likely Mitigate Nitrous Oxide Emissions From California Cropland. Glob. Biogeochem. Cycles 2018, 32, 1514–1527. [Google Scholar] [CrossRef]
Figure 1. Long-term rainfall (mm) (2009–2019) compared to the rainfall (mm) and irrigation (mm) measured during the trial period. Average daily temperature (°C) is also given.
Atmosphere 11 00925 g001
Figure 2. Daily N2O-N fluxes, Nmin (NH4+-N and NO3-N) and WFPS for the different N fertilization (N0, N20, N40, N60, and N80) during the trial period. Arrows indicate fertilization events. The error bars denote standard errors. The N0, N20, N40, N60, and N80 refer to the different treatments used and were 0, 220, 440, 660, and 880 kg N ha−1 year−1, respectively.
Atmosphere 11 00925 g002
Figure 3. Accumulated N2O-N emissions for the different N fertilization treatments (N0, N20, N40, N60, and N80) over the trial period. Error bars denote standard error of the mean. Different letters indicate significant differences between the treatments (p < 0.05). The N0, N20, N40, N60, and N80 refer to the fertilizer rates used as treatments and were 0, 220, 440, 660, and 880 kg N ha−1 year−1, respectively.
Atmosphere 11 00925 g003
Figure 4. The linear relationship between accumulated N2O-N losses (kg N2O-N ha−1 year−1) in relation to (E1) increased levels of N-input (kg N ha−1 year−1) as well as (E2) increased levels of N balance (kg N ha−1 year−1). The nonlinear relationship between accumulated N2O-N losses (kg N2O-N ha−1 year−1) in relation to (E3) increased levels of N-input (kg N ha−1 year−1) as well as (E4) increased levels of N balance (kg N ha−1 year−1).
Atmosphere 11 00925 g004
Table 1. Soil physical and chemical property ranges for different soil depths (cm). Exchangeable base cations (Ca, Mg, K, and Na) and extractable P were determined in a citric acid solution [32].
Soil DepthpHRAcidityCECCaMgNaKPSCuZnMnBOrganic C
(cm)(KCl)(Ohm)(cmol kg−1)(mg kg−1)(%)
0–105.01451.08.5442235153423019.181.857.039.860.421.59
10–205.43850.55.229114412413136.550.651.733.100.301.14
20–305.33250.75.427912415316115.891.111.452.810.311.28
CEC: cation exchange capacity, R: electrical resistance.
Table 2. The mean (± standard error) mineralizable nitrogen (Nmin), NH4+-N, NO3-N, and the water-filled pore space (WFPS) for the N fertilization treatments (N0, N20, N40, N60, and N80) for soil depths 0–10, 10–20, and 20–30 cm. The standard error of the mean is shown in brackets. The N0, N20, N40, N60, and N80 refer to the different treatments used and were 0, 220, 440, 660, and 880 kg N ha−1 year−1, respectively. Means in the same row with no common superscript differed (p < 0.05).
Variable Depth (cm)N0N20N40N60N80
Nmin
(kg ha−1)
0–1026.95 a ± 0.6727.48 a ± 1.6128.86 a ± 1.9844.12 b ± 1.6860.02 b ± 7.53
10–2026.74 a ± 2.5126.74 a ± 2.9425.93 a ± 0.5528.23 a ± 1.4738.73 a ± 6.82
20–3024.90 ab ± 2.3523.06 a ± 1.1923.95 a ± 1.5925.39 a ± 0.7431.47 b ± 1.39
NH4+-N
(kg ha−1)
0–1020.40 a ± 0.7220.15 ab ± 1.4719.90 ab ± 1.0721.66 b ± 0.4823.99 ab ± 1.93
10–2018.19 a ± 0.4018.01 a ± 0.9918.91 a ± 0.5417.67 a ± 0.5919.47 a ± 1.96
20–3016.43 a ± 0.7817.40 a ± 1.4117.79 a ± 1.2317.73 a ± 1.0516.42 a ± 0.87
NO3-N
(kg ha−1)
0–106.55 a ± 1.087.33 a ± 1.388.95 a ± 1.2322.47 b ± 1.2336.03 b ± 6.17
10–208.55 a ± 2.398.73 a ± 3.237.02 a ± 0.2710.56 a ± 1.7019.27 a ± 6.38
20–308.47 ab ± 2.135.66 a ± 0.736.16 a ± 0.707.66 a ± 1.5715.05 b ± 1.59
WFPS
(%)
0–1053.48 a ± 1.2151.19 a ± 0.4151.72 a ± 0.9250.02 a ± 1.1549.17 a ± 1.32
10–2054.61 a ± 2.6550.48 a ± 2.0550.48 a ± 2.2648.69 a ± 2.3050.44 a ± 2.50
20–3046.52 a ± 3.5441.34 a ± 1.0147.06 a ± 3.2643.03 a ± 3.7440.4 a ± 2.11
Table 3. Means (± standard error) of herbage yield, N-yield, Ninput, Nbalance, and measured annual N2O-N emissions. The N0, N20, N40, N60, and N80 refer to the fertilizer rates used as treatments and were 0, 220, 440, 660, and 880 kg N ha−1 year−1, respectively. Ninput and Nbalance were calculated using Equations (3) and (4) and were not independent from treatments, and therefore not subjected to statistical analysis. Means in the same row with no common superscript differed significantly (p < 0.05).
Unit Variable N0N20N40N60N80
(t ha−1 year−1)Herbage Yield18.7 a ± 1.1020.6 ab ± 0.6520.3 a ± 0.4020.6 ab ± 0.4721.5 b ± 0.70
(kg ha−1 year−1)N yield582 a ± 38.90645 a ± 17.70707 b ± 13.50797 c ± 13.00900 d ± 35.30
Ninput45067089011101330
Nbalance−131.97 ± 38.9325.06 ± 17.66182.93 ± 13.43312.58 ± 13.01430.36 ± 35.28
N2O-N2.45 a ± 0.863.85 b ± 0.545.79 bc ± 0.636.5 c ± 1.2815.5 d ± 2.29
Table 4. The predicted annual N2O emissions based on the Intergovernmental Panel on Climate Change (IPCC) emission factors (EFs) (IPCCmin + IPCCmin+exc). The EFs are calculated based on the N2O measurements (EFdata) and linear (E1–E2) and nonlinear (E3–E4) regression approaches for the different N fertilization treatments (N0, N20, N40, N60, and N80 expressed as kg N2O-N ha−1 year−1). The R square (R2), root mean square error (RMSE), and the Nash–Sutcliffe model efficiency coefficient (NSE) are shown as a result of the comparison between measured and predicted annual N2O emissions indicating the best fit of measured vs. predicted values. The N0, N20, N40, N60, and N80 refer to the different mineral fertilizer application rates used and were 0, 220, 440, 660, and 880 kg N ha−1 year−1, respectively.
TreatmentN0N20N40N60N80R2RMSENSE
IPCCmin0.02.24.46.68.80.593.150.30
IPCCmin+exc9.0011.213.415.617.80.623.05−1.07
EFdata0.01.93.85.87.70.593.150.11
E11.14.06.99.712.60.623.050.64
E21.24.27.29.611.90.563.300.58
E33.33.64.57.315.30.772.360.72
E42.73.65.48.413.30.712.650.63

