Meteorological Storm Influence on the Ionosphere Parameters


Abstract
:1. Introduction
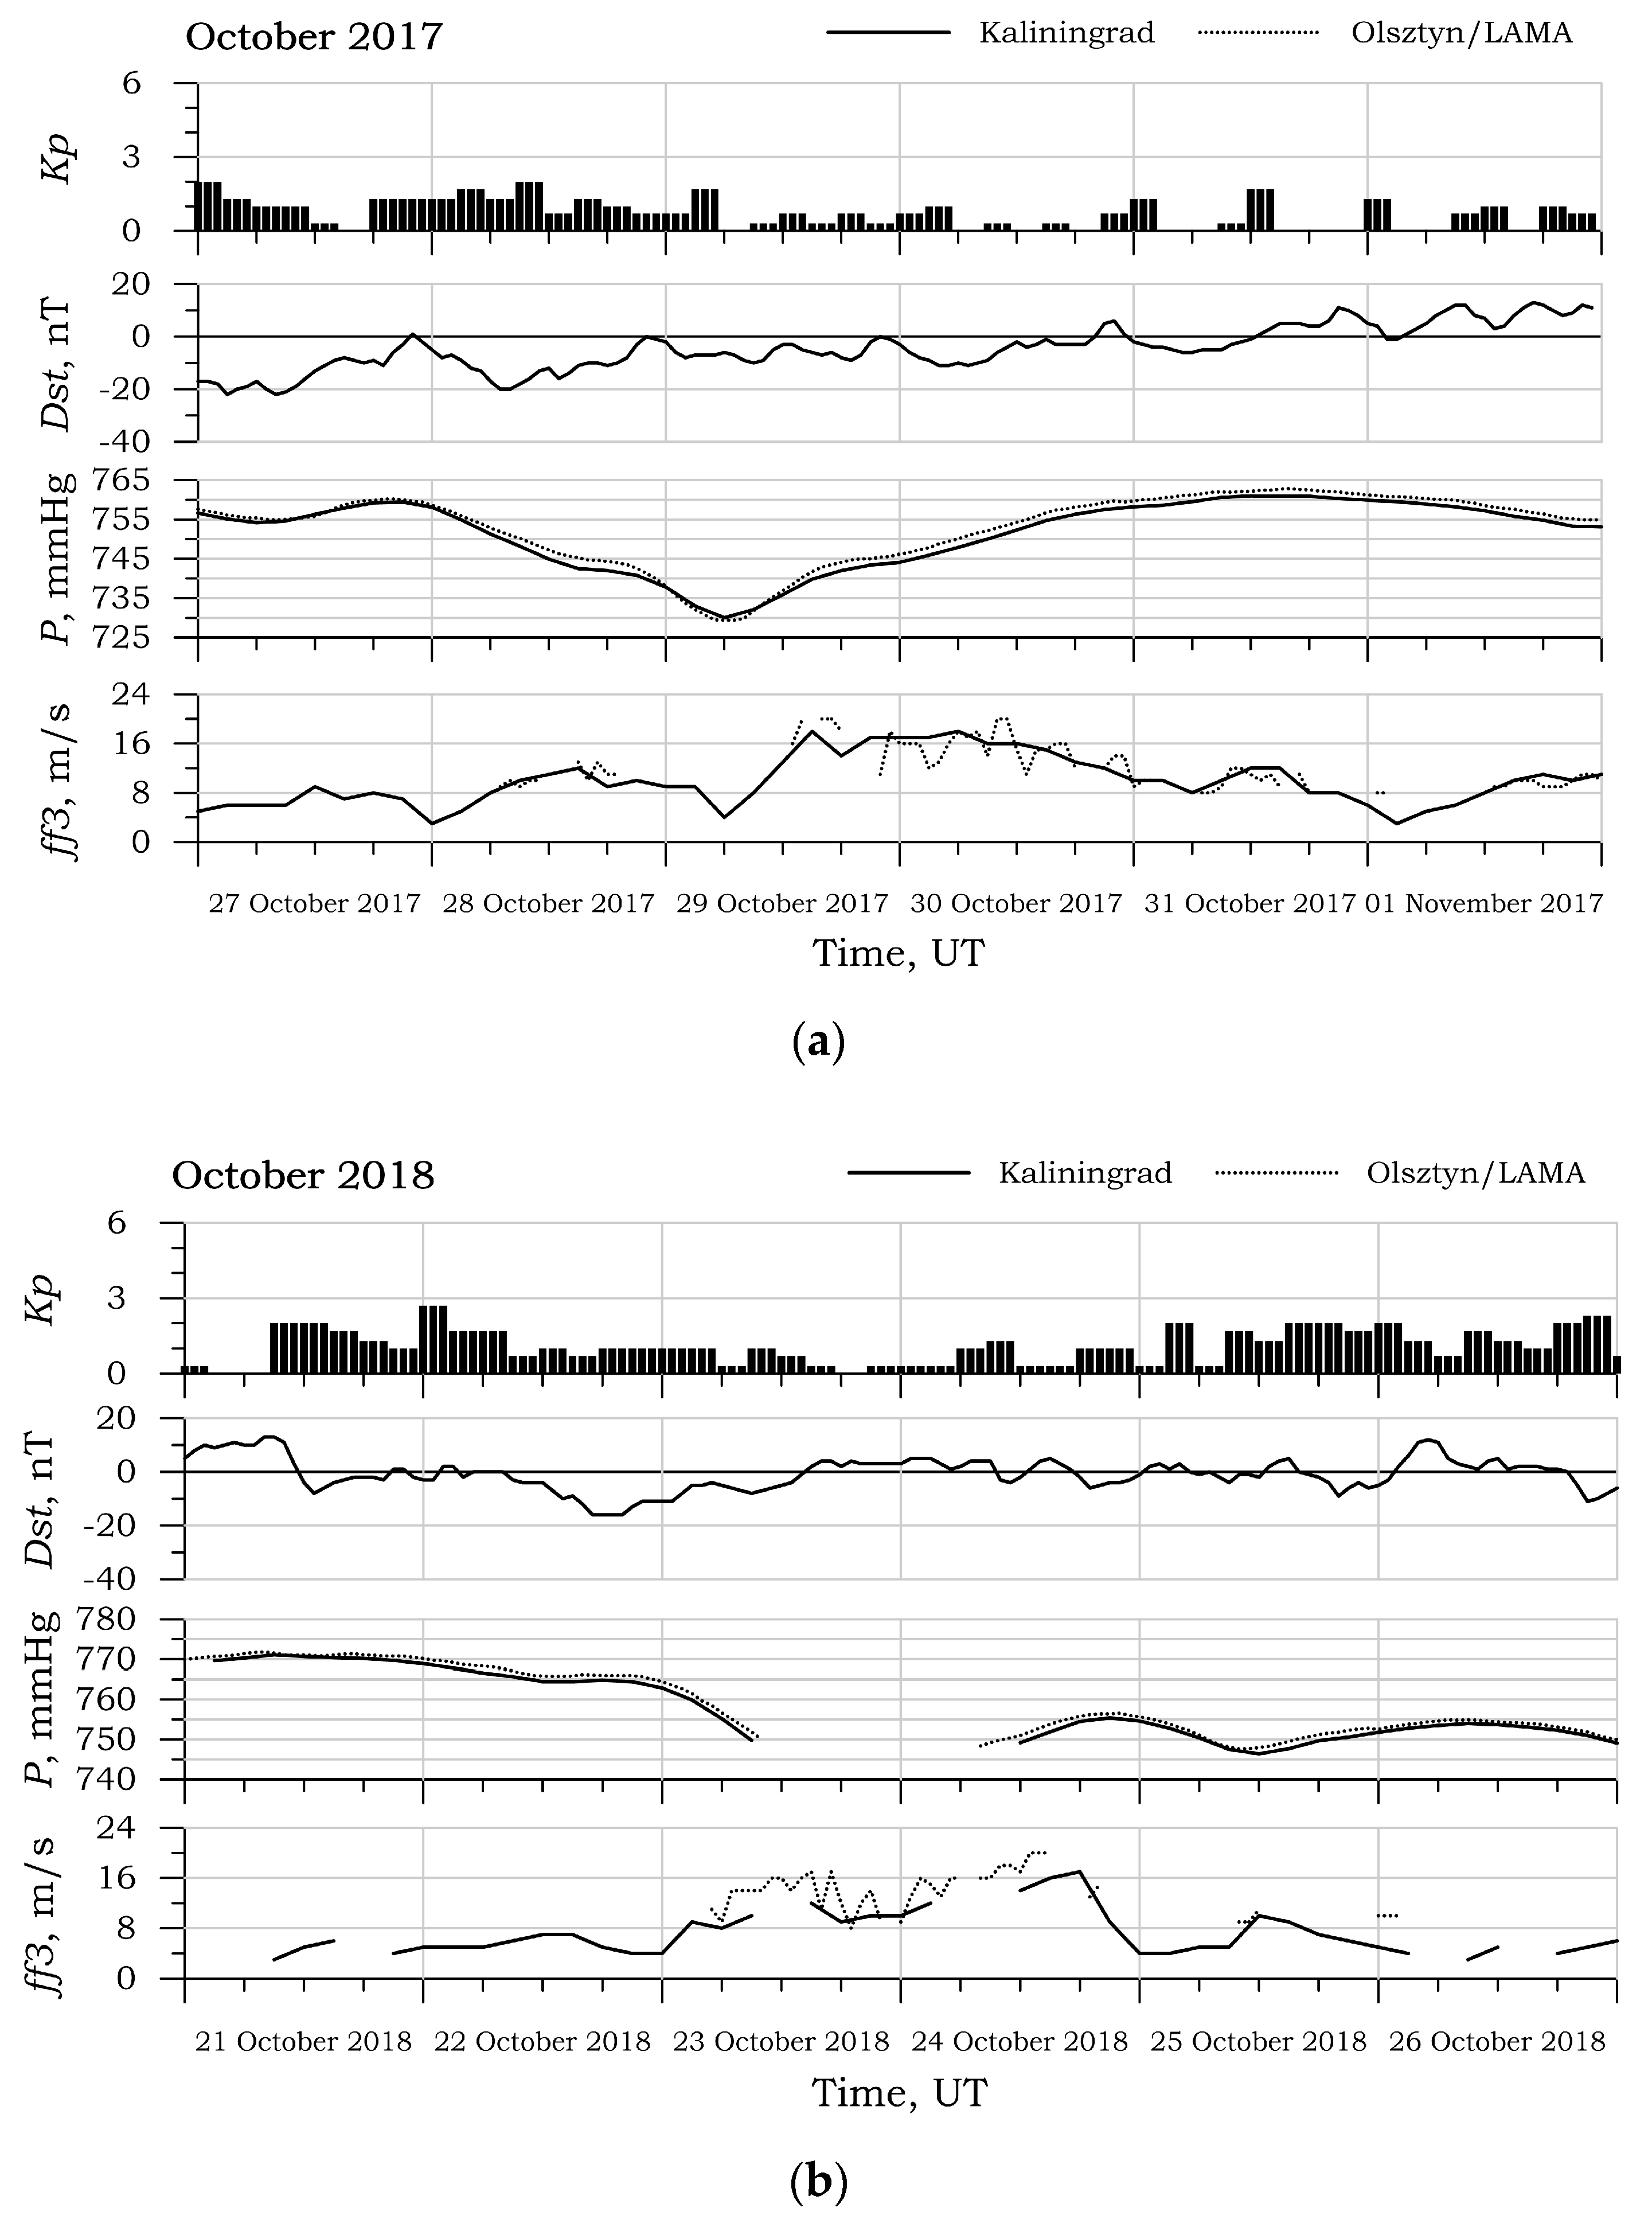
2. Events Selection
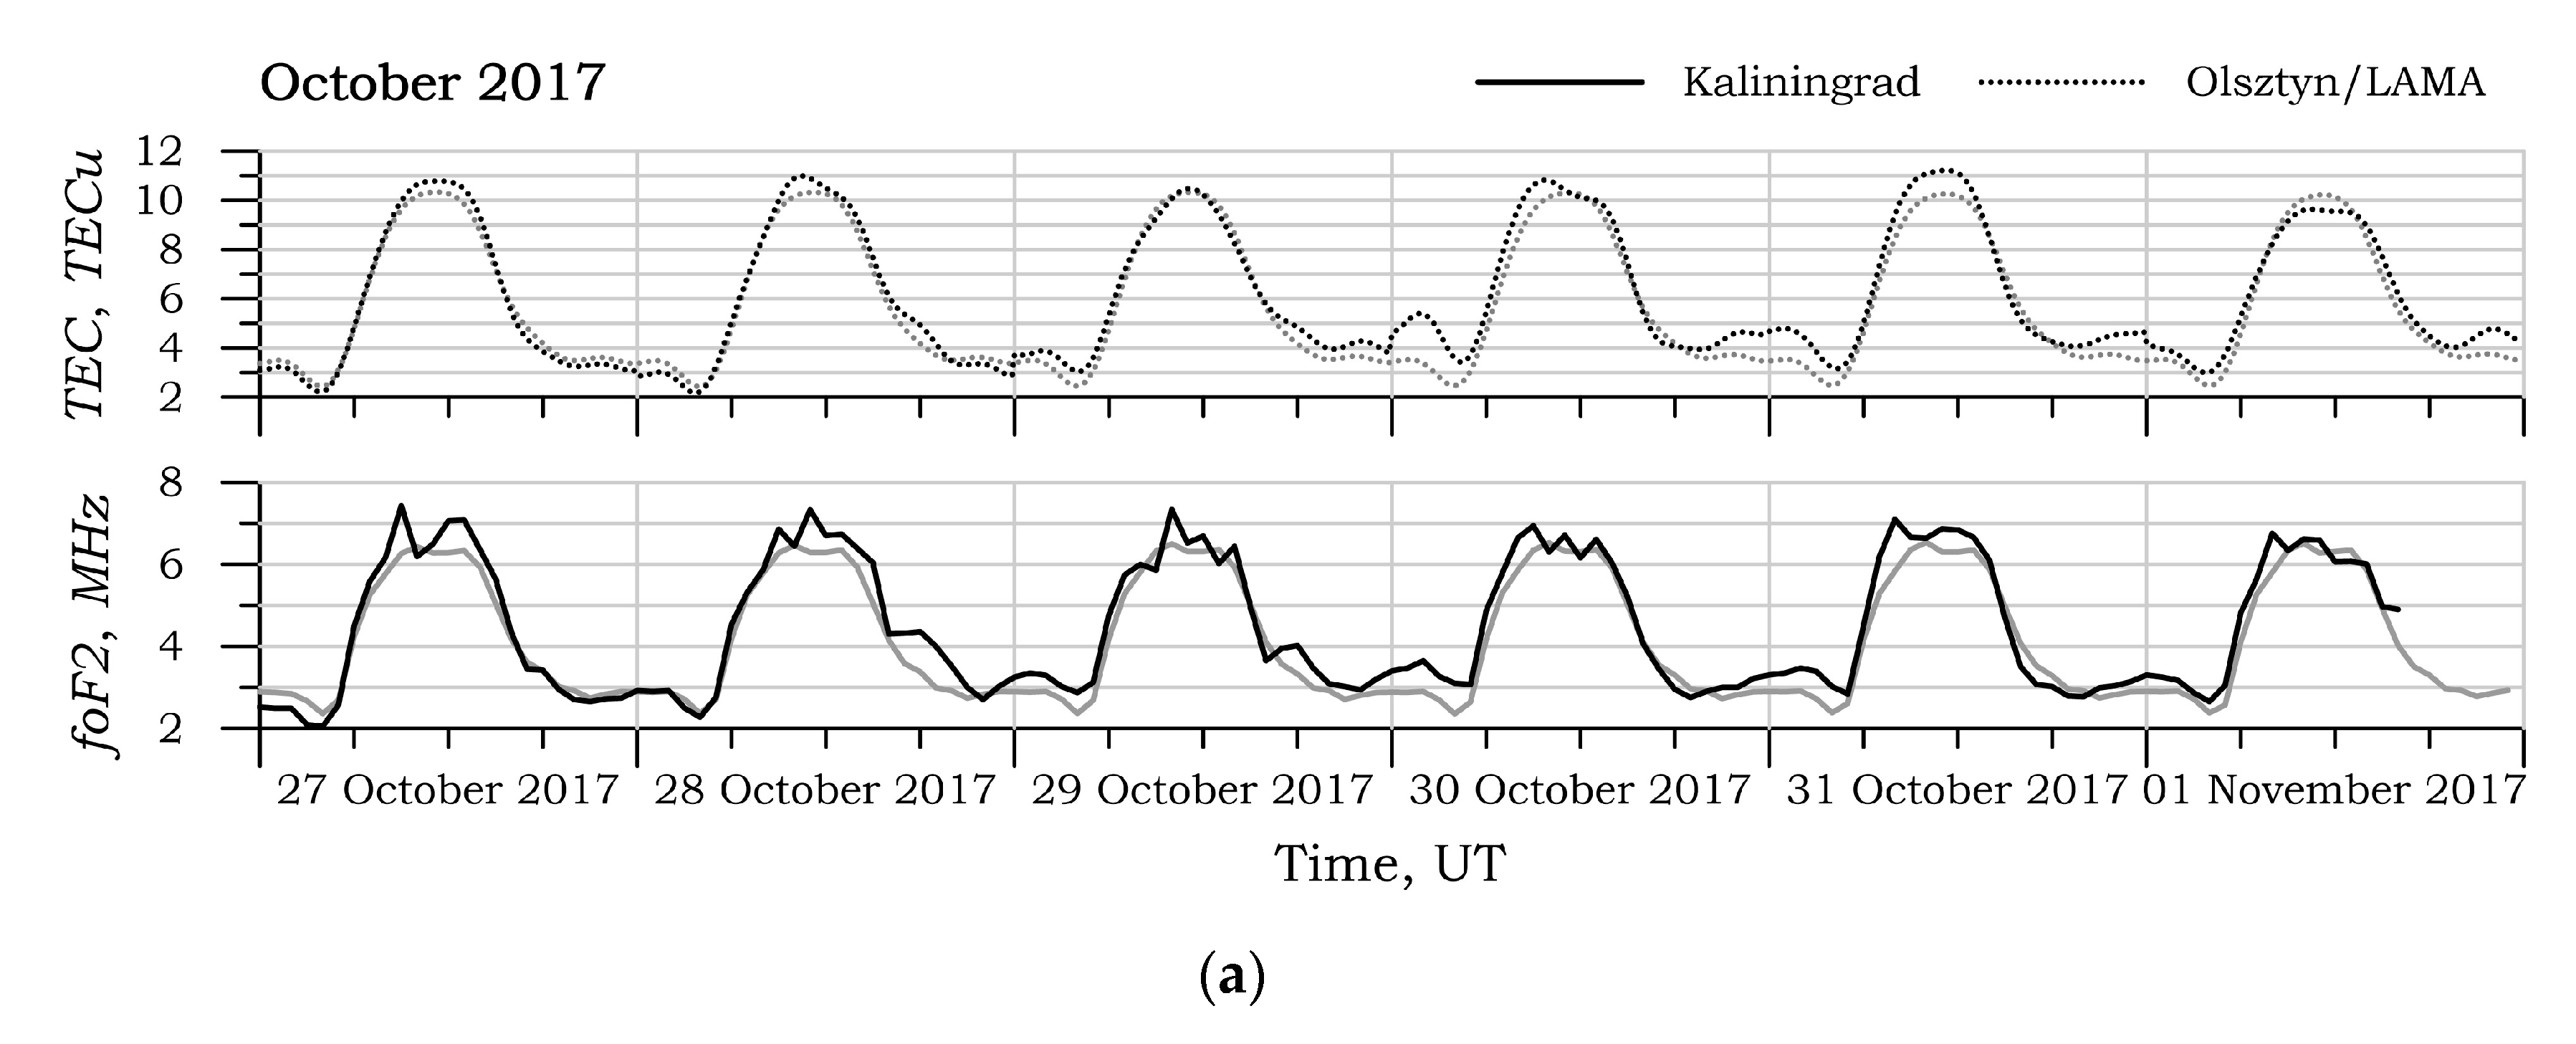
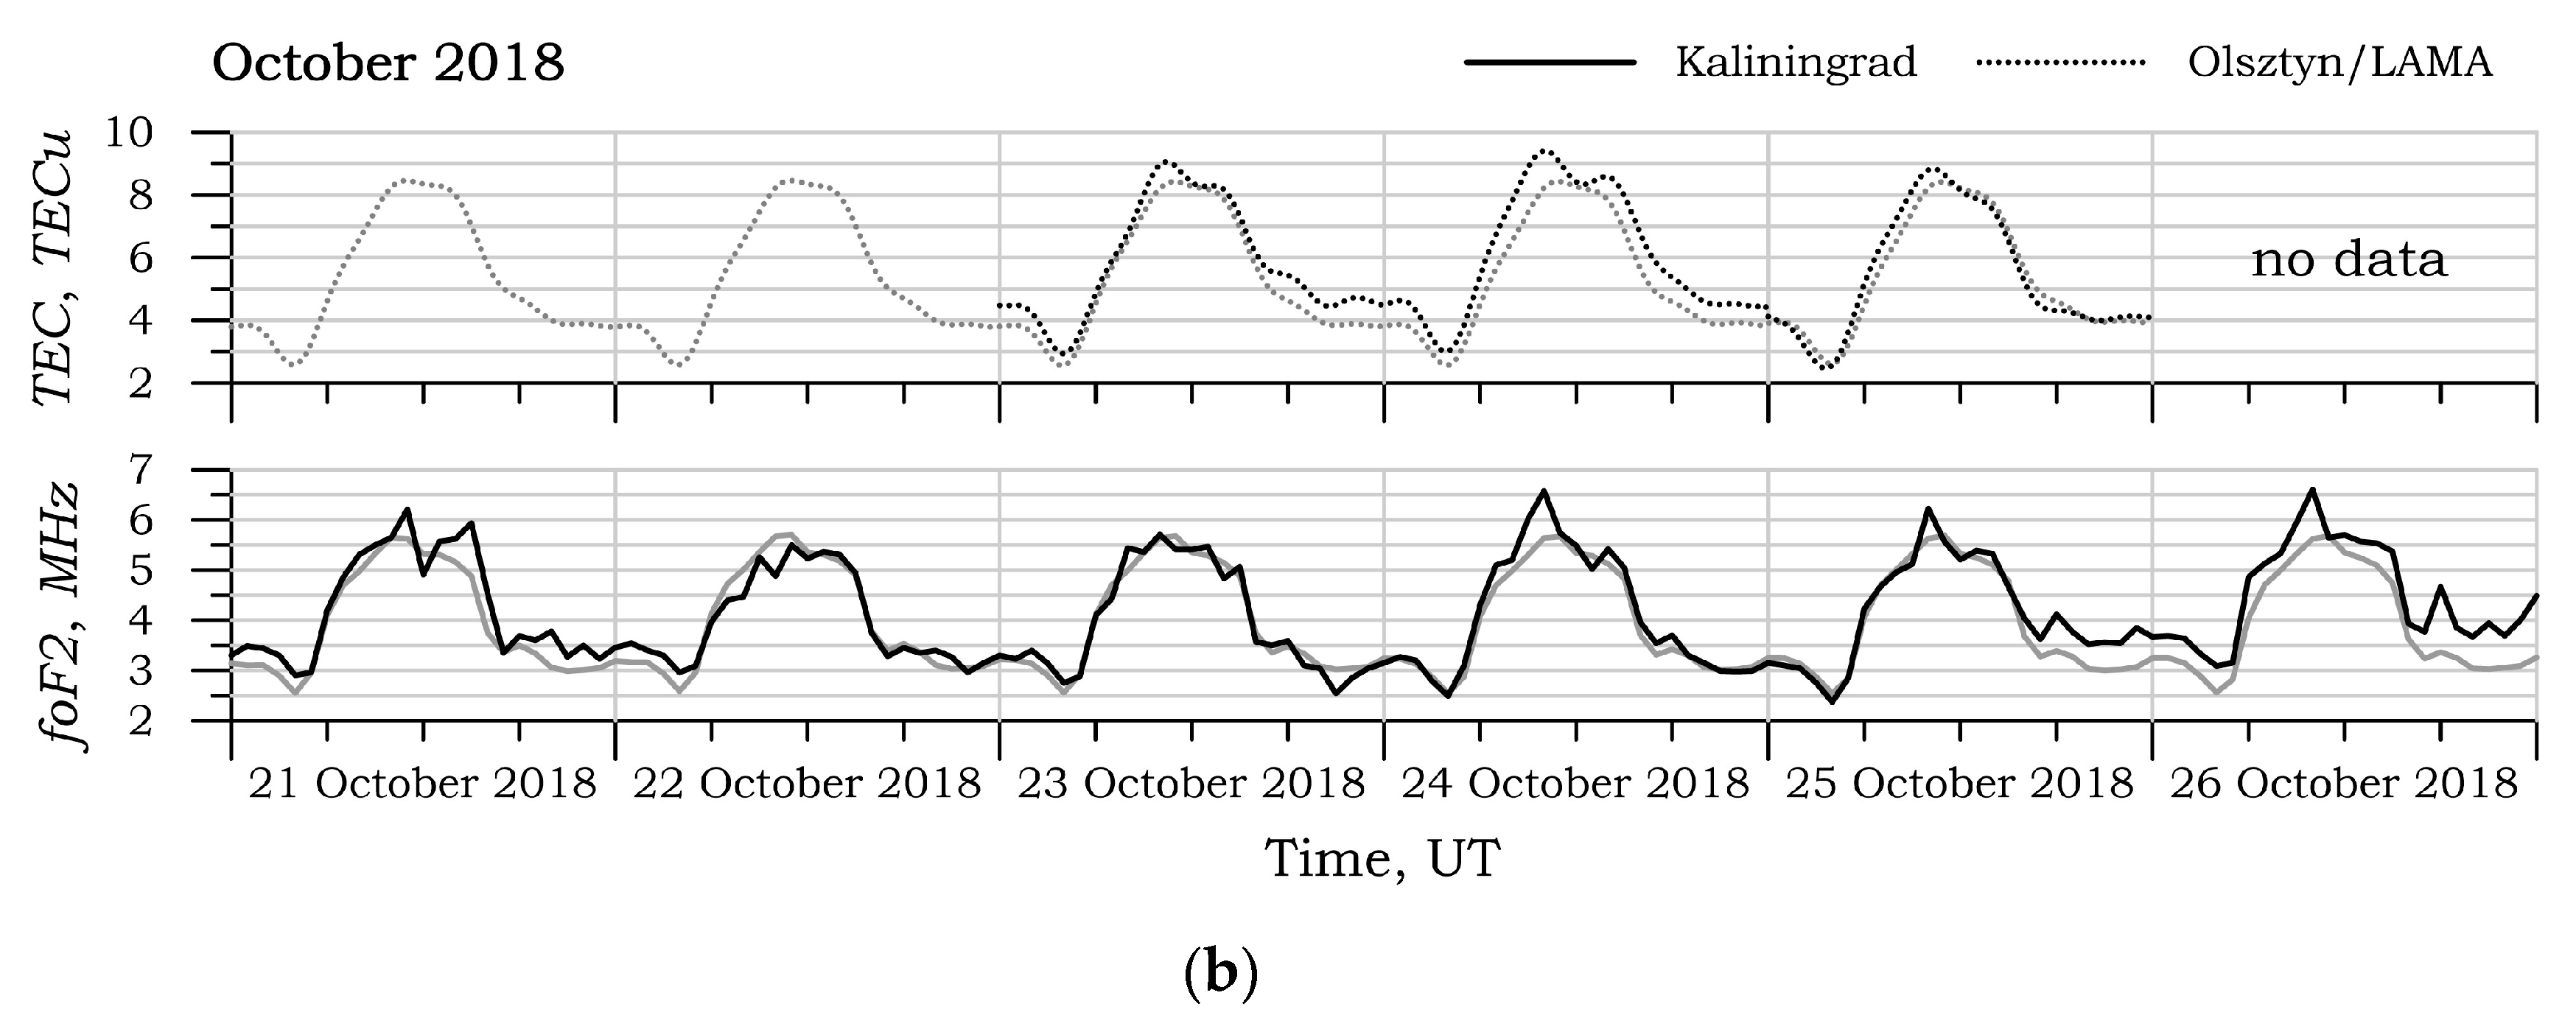
3. Influence of Meteorological Storm on E and F Regions of the Ionosphere
4. Spectral Analysis
5. Conclusions
Author Contributions
Funding
Acknowledgments
Conflicts of Interest
References
- Mannucci, A.J.; Tsurutani, B.T.; Iijima, B.A.; Komjathy, A.; Saito, A.; Gonzalez, W.D.; Guarnieri, F.L.; Kozyra, J.U.; Skoug, R. Dayside global ionospheric response to the major interplanetary events of October 29–30 2003 “Halloween Storms”. Geophys. Res. Lett. 2005, 32, L12S02. [Google Scholar] [CrossRef] [Green Version]
- Yue, X.; Wang, W.; Lei, J.; Burns, A.; Zhang, Y.; Wan, W.; Liu, L.; Hu, L.; Zhao, B.; Schreiner, W.S. Long-lasting negative ionospheric storm effects in low and middle latitudes during the recovery phase of the 17 March 2013 geomagnetic storm. J. Geophys. Res. Space Phys. 2016, 121, 9234–9249. [Google Scholar] [CrossRef] [Green Version]
- Forbes, J.M.; Maute, A.; Zhang, X.; Hagan, M.E. Oscillation of the ionosphere at planetary-wave periods. J. Geophys. Res. Space Phys. 2018, 123, 7634–7649. [Google Scholar] [CrossRef]
- Martinis, C.R.; Manzano, J.R. The influence of active meteorological systems on the ionosphere F region. Ann. Geofis. 1999, 1, 1–7. [Google Scholar] [CrossRef]
- Isaev, N.V.; Kostin, V.M.; Belyaev, G.G.; Ovcharenko, O.Y.; Trushkina, E.P. Disturbances of the topside ionosphere caused by typhoons. Geomagn. Aeron. 2010, 50, 243–255. [Google Scholar] [CrossRef]
- Isaev, N.V.; Sorokin, V.M.; Chmyrev, V.M.; Serebryakova, O.N.; Yashchenko, A.K. Disturbance of the electric field in the ionosphere by sea storms and typhoons. Cosm. Res. 2002, 40, 547–553. [Google Scholar] [CrossRef]
- Polyakova, A.S.; Perevalova, N.P. Comparative analysis of TEC disturbances over tropical cyclone zones in the north-west Pacific Ocean. Adv. Space Res. 2013, 52, 1416–1426. [Google Scholar] [CrossRef]
- Chernigovskaya, M.A.; Shpynev, B.G.; Ratovsky, K.G. Meteorological effects of ionospheric disturbances from vertical radio sounding data. J. Atmos. Sol.-Terr. Phys. 2015, 136, 235–243. [Google Scholar] [CrossRef]
- Chou, M.Y.; Lin, C.C.H.; Yue, J.; Tsai, H.F.; Sun, Y.Y.; Liu, J.Y.; Chen, C.H. Concentric traveling ionosphere disturbances triggered by Super Typhoon Meranti (2016). Geoph. Res. Lett. 2017, 44, 1219–1226. [Google Scholar] [CrossRef]
- Li, W.; Yue, J.; Yang, Y.; Li, Z.; Guo, J.; Pan, Y.; Zhang, K. Analysis of ionospheric disturbances associated with powerful cyclones in East Asia and North America. J. Atmos. Sol.-Terr. Phys. 2017, 161, 43–54. [Google Scholar] [CrossRef]
- Borchevkina, O.P.; Karpov, I.V. Ionospheric irregularities in periods of meteorological disturbances. Geomagn. Aeron. 2017, 57, 624–629. [Google Scholar] [CrossRef]
- Zakharov, V.I.; Kunitsyn, V.E. Regional features of atmospheric manifestations of tropical cyclones according to ground- based GPS network data. Geomagn. Aeron. 2012, 52, 533–545. [Google Scholar] [CrossRef]
- Karpov, I.V.; Borchevkina, O.P.; Dadashev, R.Z.; Ilminskaya, A.V. Influence of meteorological storms on ionospheric parameters in the Baltic region in 2010. Solar-Terr. Phys. 2016, 2, 77–81. [Google Scholar] [CrossRef]
- Depuev, V.H.; Depueva, A.H. Reaction of the critical frequency of the F2 layer to a sharp depletion in atmospheric pressure. Geomagn. Aeron. 2010, 50, 804–813. [Google Scholar] [CrossRef]
- Karpov, I.V.; Borchevkina, O.P.; Karpov, M.I. Local and regional ionospheric disturbances during meteorological disturbances. Geomagn. Aeron. 2019, 59, 458–466. [Google Scholar] [CrossRef]
- Karpov, I.V.; Karpov, M.I.; Borchevkina, O.P.; Yakimova, G.A.; Koren’kova, N.A. Spatial and temporal variations of the ionosphere during meteorological disturbances in December 2010. Russ. J. Phys. Chem. B 2019, 13, 714–719. [Google Scholar] [CrossRef]
- Astafyeva, E.; Zakharenkova, I.; Förster, M. Ionospheric response to the 2015 St. Patrick’s Day storm: A global multi-instrumental overview. J. Geophys. Res. Space Phys. 2015, 120, 9023–9037. [Google Scholar] [CrossRef] [Green Version]
- Perevalova, N.P.; Afraimovich, E.L.; Voeykov, S.V.; Zhivetiev, I.V. Parameters of large-scale TEC disturbances during the strong magnetic storm on 29 October 2003. J. Geophys. Res. Space Phys. 2008, 113, A00A13. [Google Scholar] [CrossRef] [Green Version]
- Qian, L.; Burns, A.G.; Chamberlin, P.C.; Solomon, S.C. Variability of thermosphere and ionosphere responses to solar flares. J. Geophys. Res. Space Phys. 2011, 116, A10309. [Google Scholar] [CrossRef] [Green Version]
- Qian, L.; Wang, W.; Burns, A.G.; Chamberlin, P.C.; Coster, A.; Zhang, S.-R.; Solomon, S.C. Solar Flare and Geomagnetic Storm Effects on the Thermosphere and Ionosphere During 6–11 September 2017. J. Geophys. Res. Space Phys. 2019, 124, 2298–2311. [Google Scholar] [CrossRef]
- Rycroft, M.J.; Harrison, R.G.; Nicoll, K.A.; Mareev, E.A. An overview of earth’s global electric circuit and atmospheric conductivity. Space Sci. Rev. 2008, 137, 83–105. [Google Scholar] [CrossRef]
- Rycroft, M.J.; Harrison, R.G. Electromagnetic atmosphere-plasma coupling: The global atmospheric electric circuit. Space Sci. Rev. 2012, 168, 363–384. [Google Scholar] [CrossRef]
- Laštovička, J. Forcing of the ionosphere by waves from below. J. Atmos. Sol.-Terr. Phys. 2006, 68, 479–497. [Google Scholar] [CrossRef]
- Blanc, E.; Farges, T.; Pichon, A.; Heinrich, P. Ten year observations of gravity waves from thunderstorms in western Africa. J. Geophys. Res. Atmos. 2014, 119, 6409–6418. [Google Scholar] [CrossRef]
- Yiğit, E.; Medvedev, A.S. Influence of parameterized small-scale gravity waves on the migrating diurnal tide in Earth’s thermosphere. J. Geophys. Res. Space Phys. 2017, 122, 4846–4864. [Google Scholar] [CrossRef]
- Yigit, E.; Koucká Knížová, P.; Georgieva, K.; Ward, W. A review of vertical coupling in the Atmosphere-Ionosphere system: Effects of waves, sudden stratospheric warmings, space weather, and of solar activity. J. Atmos. Sol.-Terr. Phys. 2016, 141, 1–12. [Google Scholar] [CrossRef]
- Yamazaki, Y.; Richmond, A.D. A theory of ionospheric response to upward-propagating tides: Electrodynamic effects and tidal mixing effects. J. Geophys. Res. Space Phys. 2013, 118, 5891–5905. [Google Scholar] [CrossRef] [Green Version]
- Cai, X.; Yuan, T.; Eccles, J.V.; Pedatella, N.M.; Xi, X.; Ban, C.; Liu, A.Z. A numerical investigation on the variation of sodium ion and observed thermospheric sodium layer at Cerro Pachón, Chile during equinox. J. Geophys. Res. Space Phys. 2019, 124, 10395–10414. [Google Scholar] [CrossRef]
- Oliver, W.L.; Otsuka, Y.; Sato, M.; Takami, T.; Fukao, S. A climatology of F region gravity wave propagation over the middle and upper atmosphere radar. J. Geophys. Res. 1997, 102, 14499–14512. [Google Scholar] [CrossRef]
- Xu, S.; Yue, J.; Xue, X.; Vadas, S.L.; Miller, S.D.; Azeem, I.; Straka, W.; Hoffmann, L.; Zhang, S. Dynamical Coupling Between Hurricane Matthew and the Middle to Upper Atmosphere via Gravity Waves. J. Geophys. Res. Space Phys. 2019, 124, 3589–3608. [Google Scholar] [CrossRef] [Green Version]
- Djuth, F.T.; Sulzer, M.P.; Gonzales, S.A.; Mathews, J.D.; Elder, J.H.; Walterscheid, R.L. A continuum of gravity waves in the Arecibo thermosphere? Geophys. Res. Lett. 2004, 31, L16801. [Google Scholar] [CrossRef]
- Fritts, D.C.; Vadas, S.L.; Wan, K.; Werne, J.A. Mean and variable forcing of the middle atmosphere by gravity waves. J. Atmos. Sol.-Terr. Phys. 2006, 68, 247–265. [Google Scholar] [CrossRef]
- Fritts, D.C.; Alexander, M.J. Gravity wave dynamics and effects in the middle atmosphere. Rev. Geophys. 2003, 41, 1–64. [Google Scholar] [CrossRef] [Green Version]
- Plougonven, R.; Zhang, F. Internal gravity waves from atmospheric jets and fronts. Rev. Geophys. 2014, 52, 33–76. [Google Scholar] [CrossRef] [Green Version]
- Plougonven, R.; Snyder, C. Inertial Gravity waves spontaneously generated by jets and fronts. Part I: Different baroclinic life cycles. J. Atmos. Sci. 2007, 64, 2502–2520. [Google Scholar] [CrossRef] [Green Version]
- Gavrilov, N.M.; Koval, A.V. Parameterization of mesoscale stationary orographic wave forcing for use in numerical models of atmospheric dynamics. Izv. Atmos. Ocean. Phys. 2013, 49, 244–251. [Google Scholar] [CrossRef]
- Gavrilov, N.M.; Koval, A.V.; Pogoreltsev, A.I.; Savenkova, E.N. Numerical modeling of inhomogeneous orographic wave influence on planetary waves in the middle atmosphere. Adv. Space Res. 2013, 51, 2145–2154. [Google Scholar] [CrossRef]
- Astafyeva, E. Ionospheric Detection of Natural Hazards. Rev. Geophys. 2019, 57, 1265–1288. [Google Scholar] [CrossRef]
- Klimenko, M.V.; Klimenko, V.V.; Karpov, I.V.; Zakharenkova, I. Simulation of Seismo-Ionospheric effects initiated by internal gravity wave. Russ. J. Phys. Chem. B. 2011, 5, 393–401. [Google Scholar] [CrossRef]
- Shalimov, S.; Rozhnoi, A.; Solov’eva, M.; Ol’shanskaya, E. Impact of earthquakes and tsunamis on the ionosphere. Izv. Phys. Solid Earth 2019, 55, 168–181. [Google Scholar] [CrossRef]
- Jakowski, N.; Stankov, S.M.; Wilken, V.; Borries, C.; Altadill, D.; Chum, J.; Buresova, D.; Boska, J.; Sauli, P.; Hruska, F.; et al. Ionospheric behavior over Europe during the solar eclipse of 3 October 2005. J. Atmos. Sol.-Terr. Phys. 2008, 70, 836–853. [Google Scholar] [CrossRef]
- Altadill, D.; Sole, J.G.; Apostolov, E.M. Vertical structure of a gravity wave like oscillation in the ionosphere generated by the solar eclipse. J. Geophys. Res. 2001, 106, 21419–21428. [Google Scholar] [CrossRef]
- Jones, T.B.; Wright, D.M.; Milner, J.; Yeoman, T.K.; Reid, T.; Chapman, P.J.; Senior, A. The detection of atmospheric waves produced by the total solar eclipse of 11 August 1999. J. Atmos. Sol.-Terr. Phys. 2004, 66, 363–374. [Google Scholar] [CrossRef] [Green Version]
- Kumar, K.V.; Ajeet, K.M.; Kumar, S.; Singh, R. 22 July 2009 Total Solar Eclipse induced gravity waves in ionosphere as inferred from GPS observations over EIA. Adv. Space Res. 2016, 58, 1755–1762. [Google Scholar] [CrossRef]
- Rybnov, Y.S.; Soloviev, S.P. Synchronous variations in the atmospheric pressure and electric field during the passage of the solar terminator. Geomagn. Aeron. 2019, 59, 234–241. [Google Scholar] [CrossRef]
- Koucká Knížová, P.; Podolská, K.; Potužníková, K.; Kouba, D.; Mošna, Z.; Boška, J.; Kozubek, M. Evidence of vertical coupling: Meteorological 2018 storm related effects observed on 23 September up to the ionosphere. Ann. Geophys. 2020, 38, 73–93. [Google Scholar] [CrossRef] [Green Version]
- Azeem, I.; Barlage, M. Atmosphere-ionosphere coupling from convectively generated gravity waves. Adv. Space Res. 2018, 61, 1931–1941. [Google Scholar] [CrossRef]
- Šindelářová, T.; Burešová, D.; Chum, J. Observations of acoustic-gravity waves in the ionosphere generated by severe tropospheric weather. Stud. Geophys. Geod. 2009, 53, 403–418. [Google Scholar] [CrossRef]
- Kazimirovsky, E.S. Coupling from below as a source of ionospheric variability: A review. Ann. Geophys. 2002, 45, 1–29. [Google Scholar] [CrossRef]
- Koucká Knížová, P.; Mošna, Z.; Kouba, D.; Potužníková, K.; Boška, J. Influence of meteorological systems on the ionosphere over Europe. J. Atmos. Sol.-Terr. Phys. 2015, 136, 244–250. [Google Scholar] [CrossRef]
- Rozhnoi, A.; Solovieva, M.; Levin, B.; Hayakawa, M.; Fedun, V. Meteorological effects in the lower ionosphere as based on VLF/LF signal observations. Nat. Hazards Earth Syst. Sci. 2014, 14, 2671–2679. [Google Scholar] [CrossRef] [Green Version]
- Balachandran, N.K. Gravity waves from thunderstorms. Mon. Weather Rev. 1980, 108, 804–816. [Google Scholar] [CrossRef] [Green Version]
- Medvedev, A.S.; Gavrilov, N.M. The nonlinear mechanism of gravity wave generation by meteorological motions in the atmosphere. J. Atmos. Sol.-Terr. Phys. 1995, 57, 1221–1231. [Google Scholar] [CrossRef]
- Azeem, I.; Yue, J.; Hoffmann, L.; Miller, S.D.; Straka, W.C., III; Crowley, G. Multisensor profiling of a concentric gravity wave event propagating from the troposphere to the ionosphere. Geophys. Res. Lett. 2015, 42, 7874–7880. [Google Scholar] [CrossRef]
- Li, W.; Yue, J.; Wu, S.; Yang, Y.; Li, Z.; Bi, J.; Zhang, K. Ionospheric responses to typhoons in Australia during 2005–2014 using GNSS and FORMOSAT-3/COSMIC measurements. GPS Solut. 2018, 22, 61. [Google Scholar] [CrossRef]
- Grigor’ev, G.I. Acoustic-gravity waves in the earth’s atmosphere (review). Radiophys. Quantum Electron. 1999, 42, 3–25. [Google Scholar] [CrossRef]
- Nekrasov, A.K.; Shalimov, S.L.; Shukla, P.K.; Stenflo, L. Nonlinear disturbances in the ionosphere due to acoustic gravity waves. J. Atmos. Sol.-Terr. Phys. 1995, 57, 737–741. [Google Scholar] [CrossRef]
- Yigit, E.; Medvedev, A.S. Internal wave coupling processes in Earth’s atmosphere. Adv. Space Res. 2015, 55, 983–1003. [Google Scholar] [CrossRef] [Green Version]
- Snively, J.B.; Pasko, V.B. Breaking of thunderstorm-generated gravity waves as a source of short-period ducted waves at mesopause altitudes. Geophys. Res. Lett. 2003, 30, 2254–2257. [Google Scholar] [CrossRef] [Green Version]
- Schubert, G.; Hickey, M.P.; Walterscheid, R.L. Physical processes in acoustic wave heating of the thermosphere. J. Geophys. Res. 2005, 110, D07106. [Google Scholar] [CrossRef] [Green Version]
- Karpov, I.; Kshevetskii, S. Numerical study of heating the upper atmosphere by acoustic-gravity waves from a local source on the Earth’s surface and influence of this heating on the wave propagation conditions. J. Atmos. Sol.-Terr. Phys. 2017, 164, 89–96. [Google Scholar] [CrossRef]
- Qian, L.; Solomon, S.C.; Kane, T.J. Seasonal variation of thermospheric density and composition. J. Geophys. Res. 2009, 114, A01312. [Google Scholar] [CrossRef]
- Akmaev, R.A. Simulation of large-scale dynamics in the mesosphere and lower thermosphere with the Doppler-spread parameterization of gravity waves 1. Implementation and zonal mean climatologies. J. Geophys. Res. 2001, 106, 1193–1204. [Google Scholar] [CrossRef]
- Akmaev, R.A. Simulation of large-scale dynamics in the mesosphere and lower thermosphere with the Doppler-spread parameterization of gravity waves 2. Eddy mixing and the diurnal tide. J. Geophys. Res. 2001, 106, 1205–1213. [Google Scholar] [CrossRef]
- Karpov, I.V.; Vasiliev, P.A. Ionospheric disturbances due to the influence of localized thermospheric sources. Geomagn. Aeron. 2020, 60, 477–482. [Google Scholar] [CrossRef]
- Available online: https://rp5.ru (accessed on 16 September 2019).
- Karpov, I.V.; Kshevetsky, S.P.; Borchevkina, O.P.; Radievsky, A.V.; Karpov, A.I. Disturbances of the upper atmosphere and ionosphere caused by acoustic-gravity wave sources in the lower atmosphere. Russ. J. Phys. Chem. B 2016, 10, 127–132. [Google Scholar] [CrossRef]
- Karpov, I.V.; Borchevkina, O.P.; Vasilev, P.A. Simulation of ionospheric effects induced by meteorological storms. Russ. J. Phys. Chem. B 2020, 14, 362–366. [Google Scholar] [CrossRef]
- Liu, J.; Wang, W.; Burns, A.; Solomon, S.C.; Zhang, S.; Zhang, Y.; Huang, C. Relative importance of horizontal and vertical transports to the formation of ionospheric storm-enhanced density and polar tongue of ionization. J. Geophys. Res. Space Phys. 2016, 121, 8121–8133. [Google Scholar] [CrossRef]
- Cai, X.; Burns, A.G.; Wang, W.; Coster, A.; Qian, L.; Liu, J.; Solomon, S.C.; Eastes, R.W.; Daniell, R.E.; McClintock, W.E. Comparison of GOLD nighttime measurements with total electron content: Preliminary results. J. Geophys. Res. Space Phys. 2020, 125, e2019JA027767. [Google Scholar] [CrossRef]
- Mathews, J.D. Sporadic E: Current views and recent progress. J. Atmos. Sol.-Terr. Phys. 1998, 60, 413–435. [Google Scholar] [CrossRef]
- Haldoupis, C. Midlatitude sporadic E. A typical paradigm of atmosphere-ionosphere coupling. Space Sci. Rev. 2012, 168, 441–461. [Google Scholar] [CrossRef]
- Yuan, T.; Wang, J.; Cai, X.; Sojka, J.; Rice, D.; Oberheide, J.; Criddle, N. Investigation of the seasonal and local time variations of the high-altitude sporadic Na layer (Nas) formation and the associated midlatitude descending E layer (Es) in lower E region. J. Geophys. Res. Space Phys. 2014, 119, 5985–5999. [Google Scholar] [CrossRef]
- Cai, X.; Yuan, T.; Eccles, J.V.; Raizada, S. Investigation on the distinct nocturnal secondary sodium layer behavior above 95 km in winter and summer over Logan, UT (41.7° N, 112° W) and Arecibo Observatory, PR (18.3° N, 67° W). J. Geophys. Res. Space Phys. 2019, 124, 9610–9625. [Google Scholar] [CrossRef]
- Parkinson, M.L.; Dyson, P.L. Measurements of mid-latitude E-region, sporadic-E, and TID-related drifts using HF Doppler-sorted interferometry. J. Atmos. Sol.-Terr. Phys. 1998, 60, 509–522. [Google Scholar] [CrossRef]
- Barta, V.; Haldoupis, C.; Sátori, G.; Buresova, D.; Chum, J.; Pozoga, M.; Berényi, K.A.; Bór, J.; Popek, M.; Kis, Á.; et al. Searching for effects caused by thunderstorms in midlatitude sporadic E layers. J. Atmos. Sol.-Terr. Phys. 2017, 161, 150–159. [Google Scholar] [CrossRef] [Green Version]
- Fukao, S.; Yamamoto, M.; Tsunoda, R.T.; Hayakawa, H.; Mukai, T. The SEEK (Sporadic-E Experiment over Kyushu) Campaign. Geophys. Res. Lett. 1998, 25, 1761–1764. [Google Scholar] [CrossRef]
- Bourdillon, A.; Lefur, E.; Haldoupis, C.; Le Roux, Y.; Menard, J.; Delloue, J. Decameter mid-latitude sporadic-E irregularities in relation with gravity waves. Ann. Geophys. 1997, 15, 925–934. [Google Scholar] [CrossRef]
- Scotto, C. Sporadic-E layer and meteorological activity. Ann. Geophys. 1995, 38, 21–24. [Google Scholar] [CrossRef]
- Pilipenko, S.G.; Kozak, L.V. Wind shifts in the Earth’s atmosphere over powerful hurricanes. Space Sci. Technol. 2012, 18, 43–50. [Google Scholar] [CrossRef]
- Liperovsky, V.A.; Pokhotelov, E.V.; Liperovskaya, E.V.; Parrot, M.; Meister, C.-V.; Alimov, O.A. Modification of sporadic E-layers caused by seismic activity. Surv. Geophys. 2000, 21, 449–486. [Google Scholar] [CrossRef]
- Gavrilov, N.M.; Kshevetskii, S.P. Numerical modeling of propagation of breaking nonlinear acoustic-gravity waves from the lower to the upper atmosphere. Adv. Space Res. 2013, 51, 1168–1174. [Google Scholar] [CrossRef]
- Karpov, I.V.; Kshevetskii, S.P. Formation of large-scale disturbances in the upper atmosphere caused by acoustic gravity wave sources on the Earth’s surface. Geomagn. Aeron. 2014, 54, 513–522. [Google Scholar] [CrossRef]
- Petrukhin, N.S.; Pelinovsky, E.N.; Batsyna, E.K. Reflectionless propagation of acoustic waves through the Earth’s atmosphere. JETP Lett. 2011, 93, 564–567. [Google Scholar] [CrossRef]
- Drobzheva, Y.V.; Krasnov, V.M. Acoustic energy transfer to the upper atmosphere from surface chemical and underground nuclear explosions. J. Atmos. Sol.-Terr. Phys. 2006, 68, 578–585. [Google Scholar] [CrossRef]
- Drobyazko, I.N.; Gavrilov, N.M. Wave energy and momentum fluxes coming to the middle and upper atmosphere from tropospheric mesoscale turbulence. Phys. Chem. Earth Part C 2001, 26, 449–452. [Google Scholar] [CrossRef]
- Heale, C.J.; Snively, J.B. Gravity wave propagation through a vertically and horizontally inhomogeneous background wind. J. Geophys. Res. Atmos. 2015, 120, 5931–5950. [Google Scholar] [CrossRef] [Green Version]
- Yuan, T.; Heale, C.J.; Snively, J.B.; Cai, X.; Pautet, P.-D.; Fish, C.; Zhao, Y.; Taylor, M.J.; Pendleton, W.R., Jr.; Wickwar, V.; et al. Evidence of dispersion and refraction of a spectrally broad gravity wave packet in the mesopause region observed by the Na lidar and Mesospheric Temperature Mapper above Logan, Utah. J. Geophys. Res. Atmos. 2016, 121, 579–594. [Google Scholar] [CrossRef] [Green Version]
- Astafyeva, E.I.; Afraimovich, E.L.; Voeykov, S.V. Generation of secondary waves due to intensive large-scale AGW traveling. Adv. Space Res. 2008, 41, 1459–1462. [Google Scholar] [CrossRef]
- Baran, L.W.; Shagimuratov, I.I.; Tepenitzina, N.J. The Use of GPS for Ionospheric Studies. Artif. Satell. J. Planet. Geod. 1997, 32, 49–60. [Google Scholar]
- Hersbach, H.; Dee, D. ERA-5 reanalysis is in production. ECMWF Newsl. 2016, 147, 7. [Google Scholar]
- Šauli, P.; Boška, J. Tropospheric events and possible related gravity wave activity effects on the ionosphere. J. Atmos. Sol.-Terr. Phys. 2001, 63, 945–950. [Google Scholar] [CrossRef]
- Boška, J.; Šauli, P. Observations of gravity waves of meteorological origin in the F-Region. Phys. Chem. Earth Part C 2001, 26, 425–428. [Google Scholar] [CrossRef]
- Šindelářová, T.; Burešová, D.; Chum, J.; Hruska, F. Doppler observations of infrasonic waves of meteorological origin at ionospheric heights. Adv. Space Res. 2009, 43, 1644–1651. [Google Scholar] [CrossRef]
- Hickey, M.P.; Walterscheid, R.L.; Schubert, G. Gravity wave heating and cooling of the thermosphere: Sensible heat flux and viscous flux of kinetic energy. J. Geophys. Res. Atmos. 2011, 116, A12326. [Google Scholar] [CrossRef] [Green Version]
- Hickey, M.P.; Schubert, G.; Walterscheid, R.L. Acoustic wave heating of the thermosphere. J. Geophys. Res. Space Phys. 2001, 106, 21543–21548. [Google Scholar] [CrossRef] [Green Version]


© 2020 by the authors. Licensee MDPI, Basel, Switzerland. This article is an open access article distributed under the terms and conditions of the Creative Commons Attribution (CC BY) license (http://creativecommons.org/licenses/by/4.0/).
Share and Cite
Borchevkina, O.; Karpov, I.; Karpov, M. Meteorological Storm Influence on the Ionosphere Parameters. Atmosphere 2020, 11, 1017. https://doi.org/10.3390/atmos11091017
Borchevkina O, Karpov I, Karpov M. Meteorological Storm Influence on the Ionosphere Parameters. Atmosphere. 2020; 11(9):1017. https://doi.org/10.3390/atmos11091017
Chicago/Turabian StyleBorchevkina, Olga, Ivan Karpov, and Mikhail Karpov. 2020. "Meteorological Storm Influence on the Ionosphere Parameters" Atmosphere 11, no. 9: 1017. https://doi.org/10.3390/atmos11091017