Sea Breeze Front and Outdoor Thermal Comfort during Summer in Northeastern Brazil


Abstract
:1. Introduction
- Apply a SBF day classification using an identification SBF method;
- Pinpoint the weather conditions that favour the development of SBF;
- Evaluate the outdoor thermal comfort conditions under SBF days and Non-SBF days using air temperature and thermal comfort index data from an urban meteorological network and Local Climate Zone classification.
2. Methodology
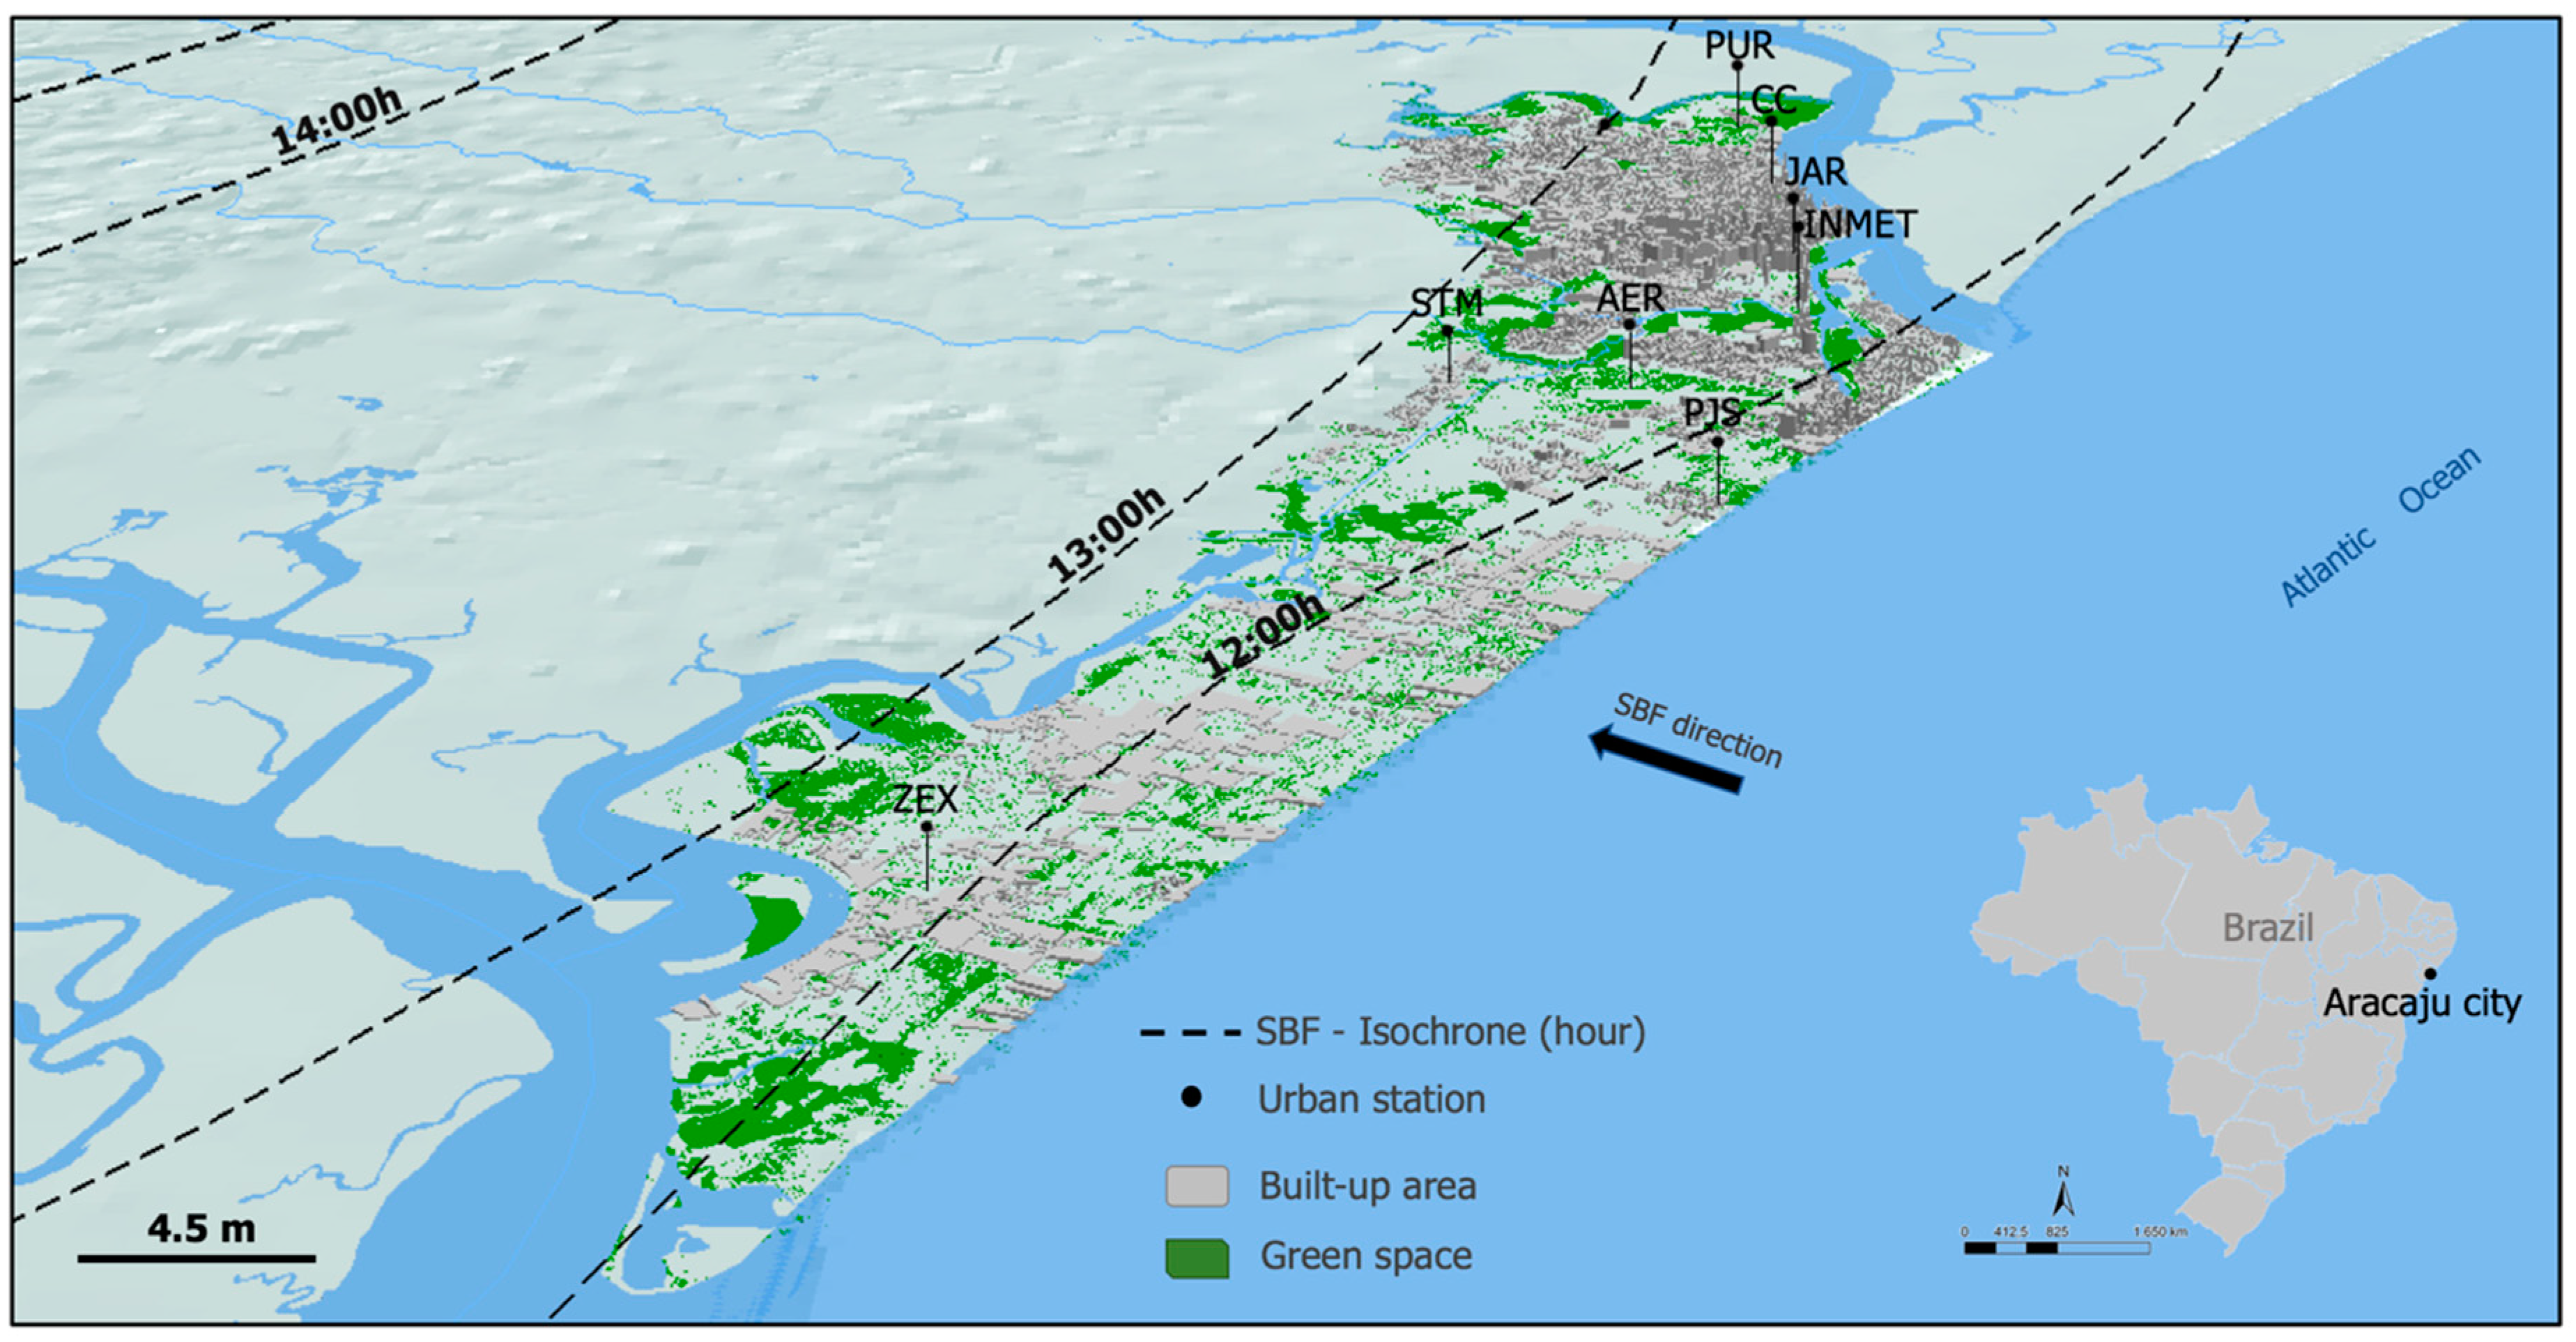
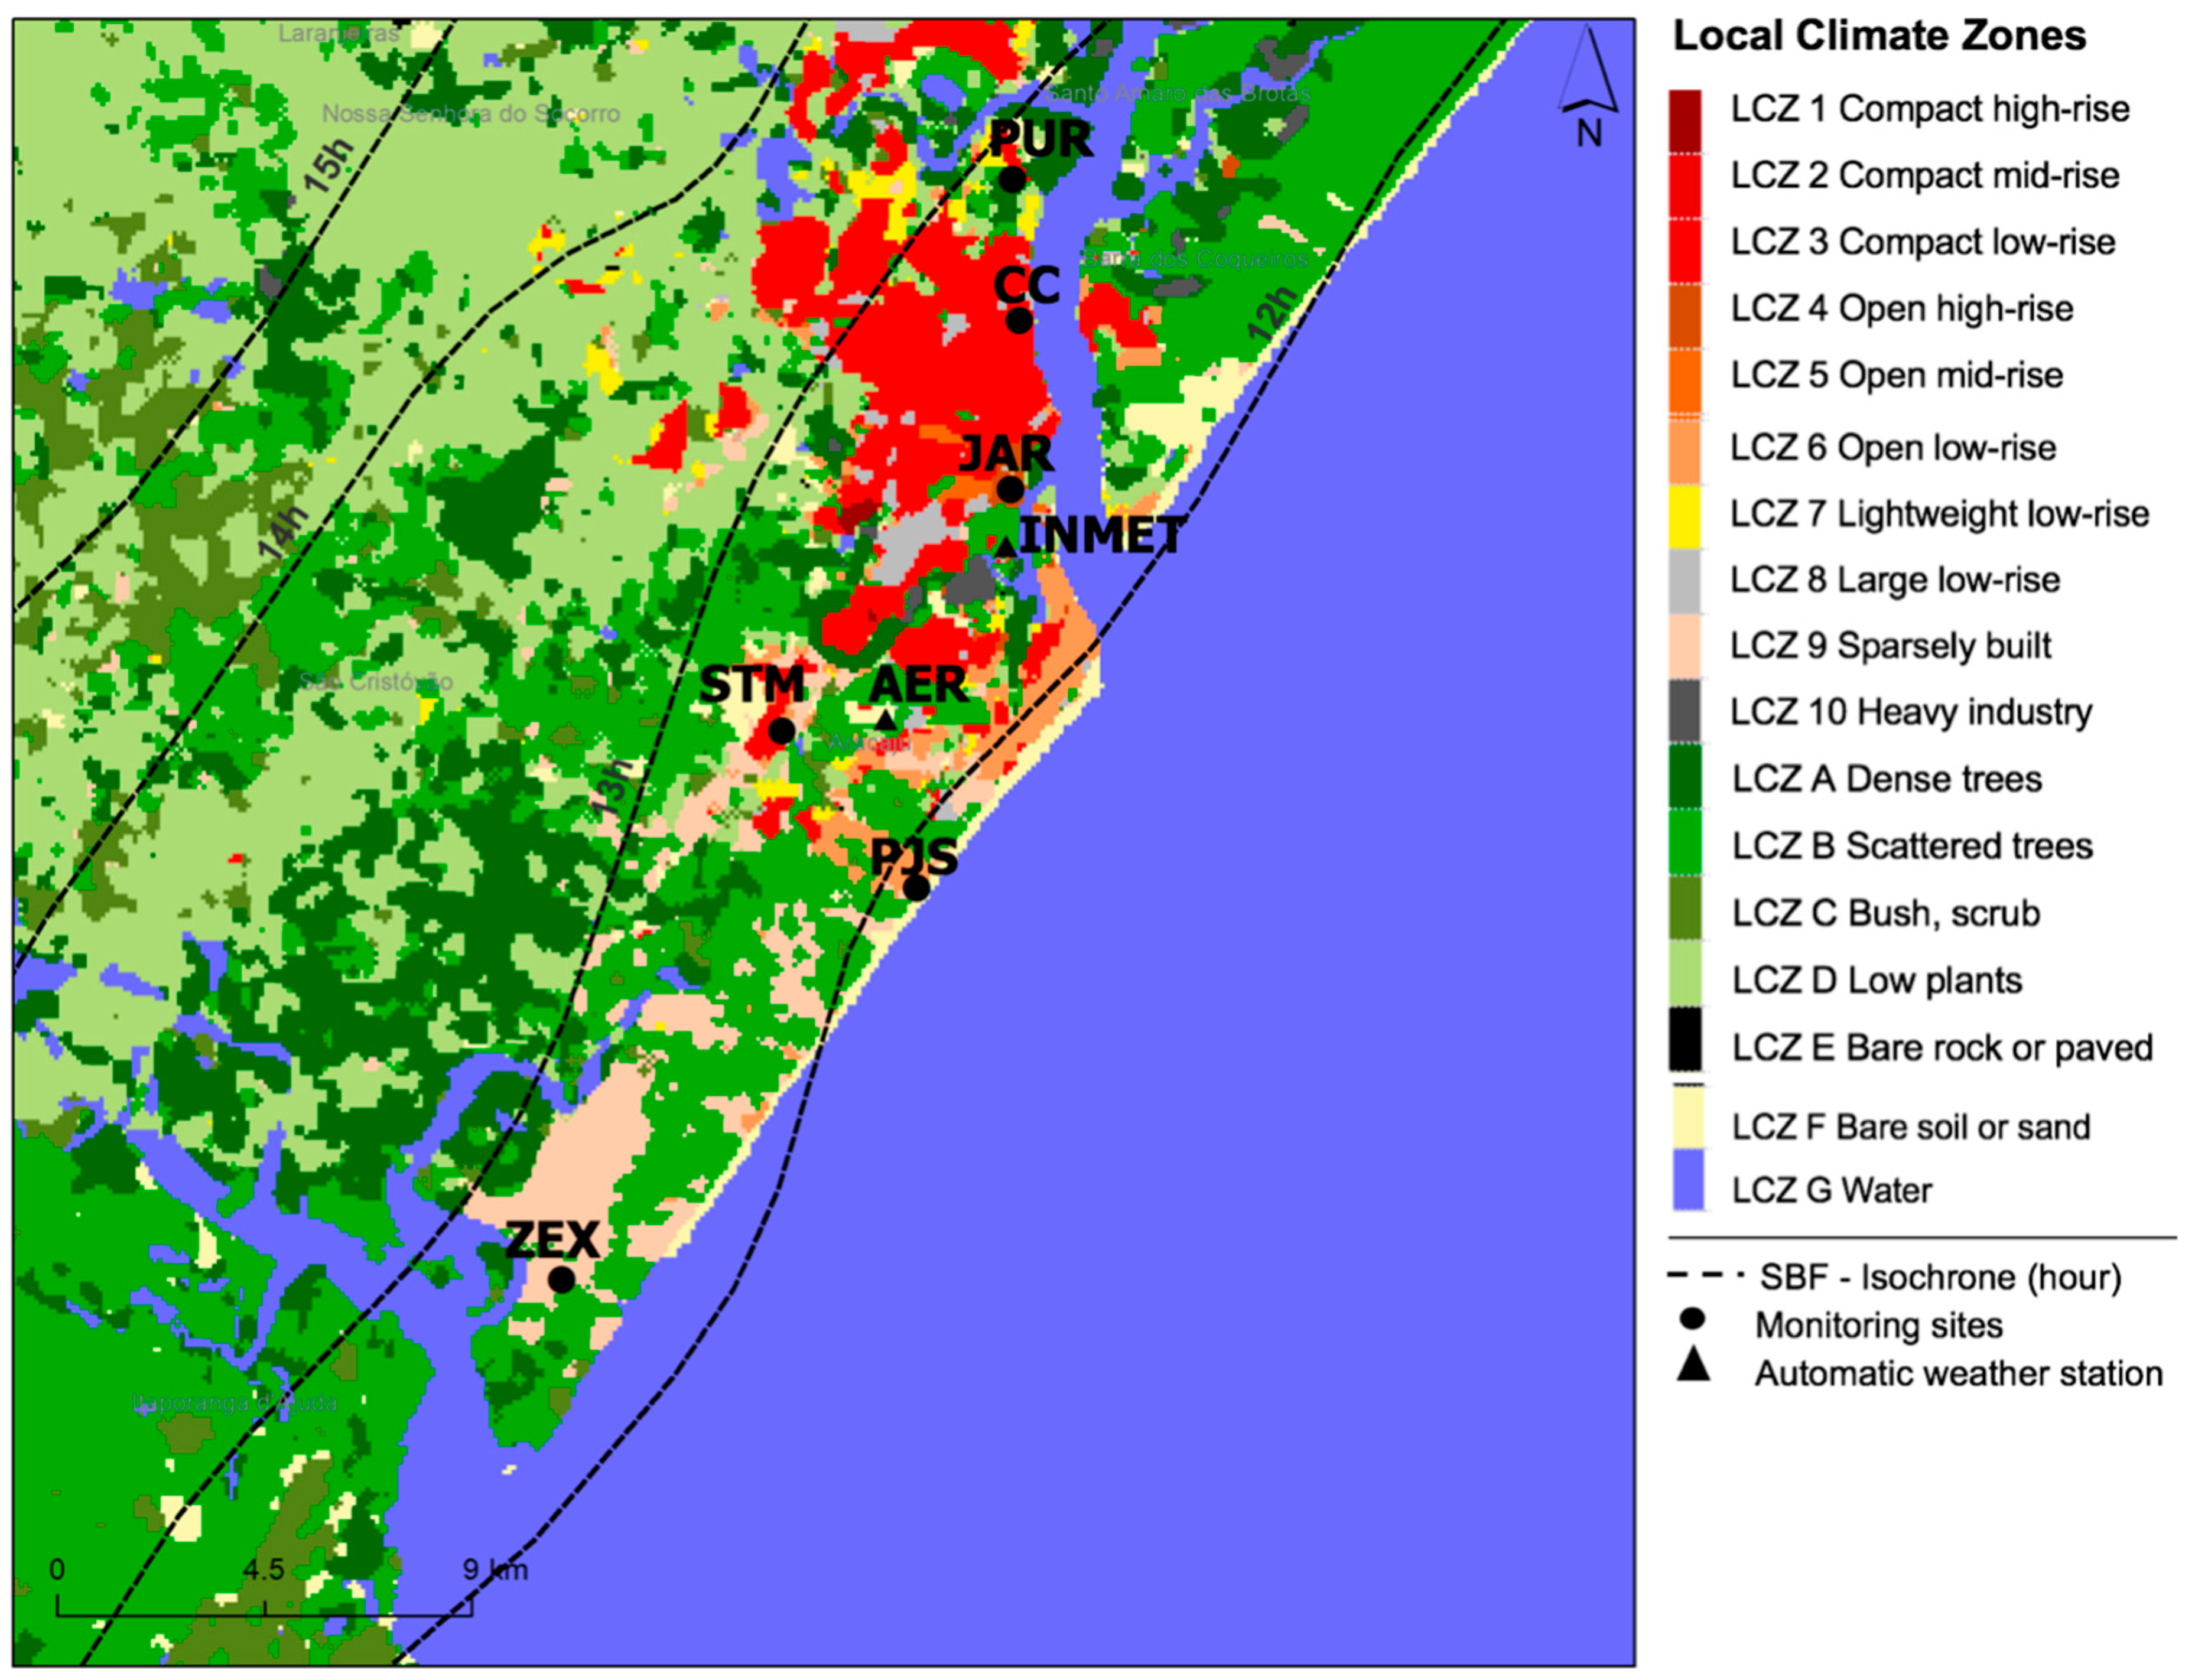
2.1. Study Area
2.2. Monitoring Air Temperature Data and Local Climate Zones
2.3. Thermal Comfort Index
2.4. Identification of SBF Days
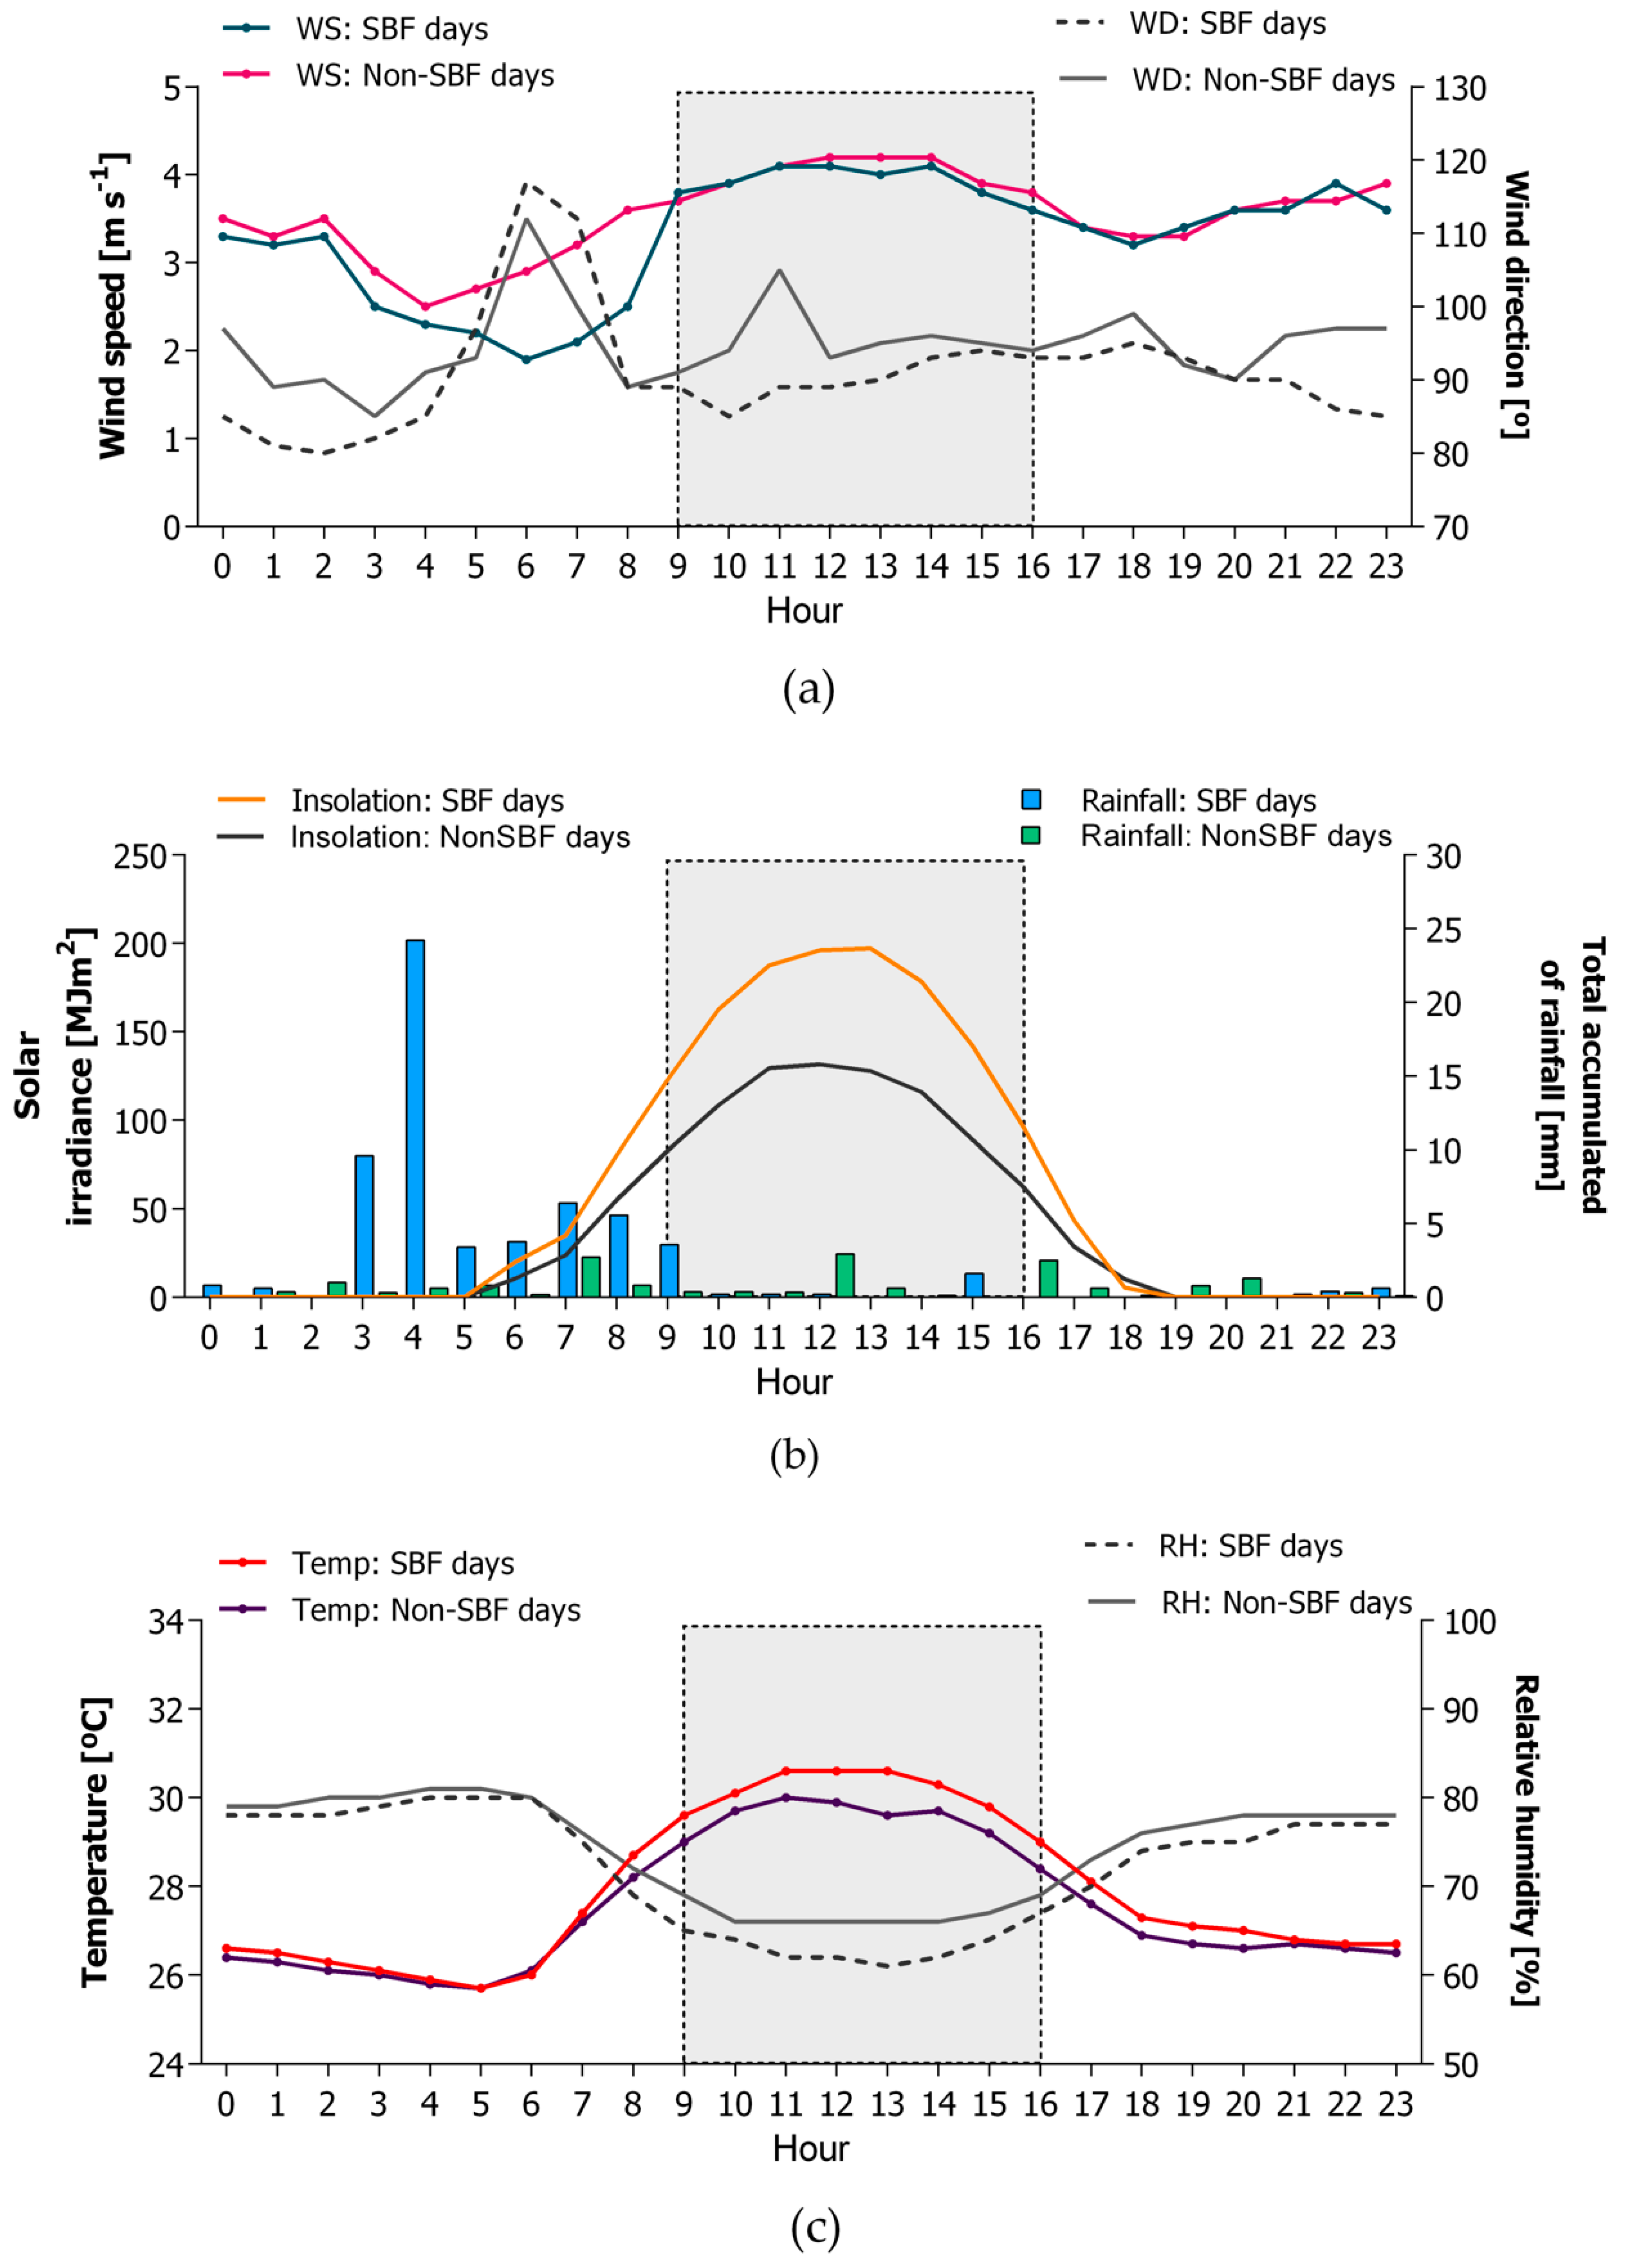
2.5. Characterization of Weather Conditions
- Troughs are regions of relatively low pressure that regularly act along UTCV in Northeastern Brazil.
- South Atlantic Subtropical Anticyclone (SASA) is a type of anticyclone, migratory or semi-permanent, associated with subsidence, low-level divergence, and rotational wind. It has a center characterized by a region of calm and more intense winds in their borders [64]. The SASA is often associated with Southeast and Northeast trade winds in Northeastern Brazil.
3. Results and Discussion
3.1. Weather Conditions of SBF Days and Non-SBF Days
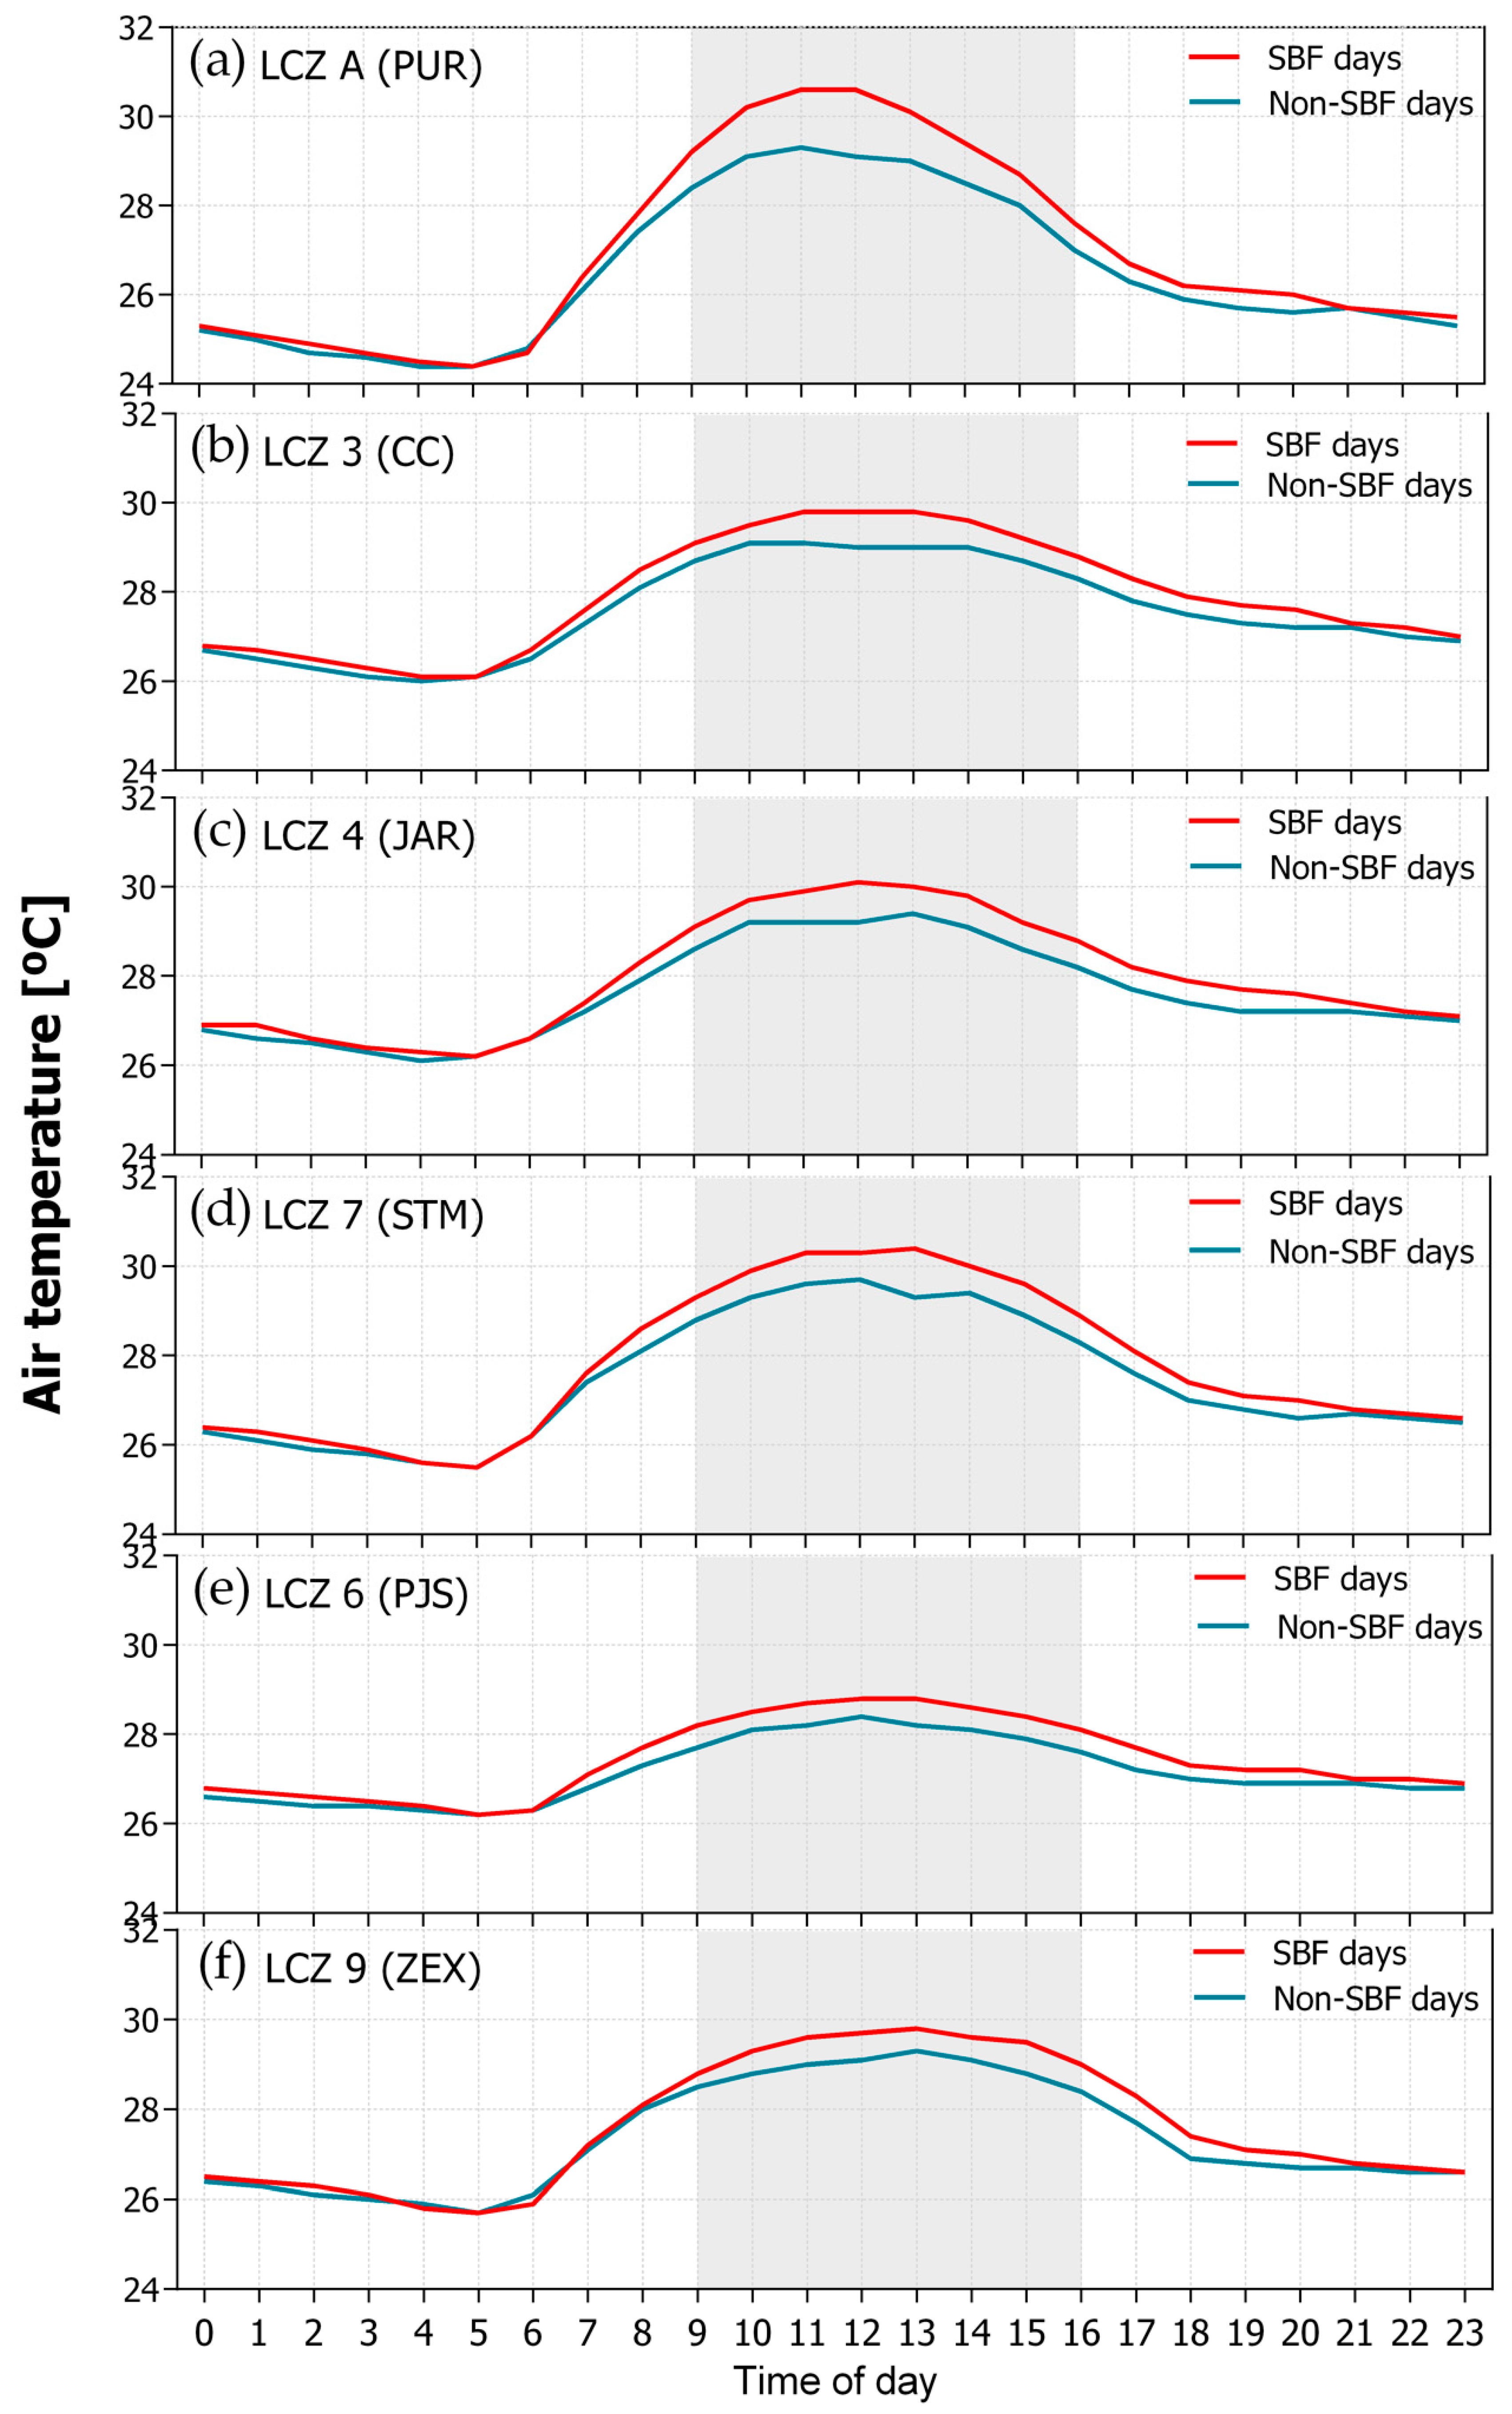
3.2. SBF and Local Climates
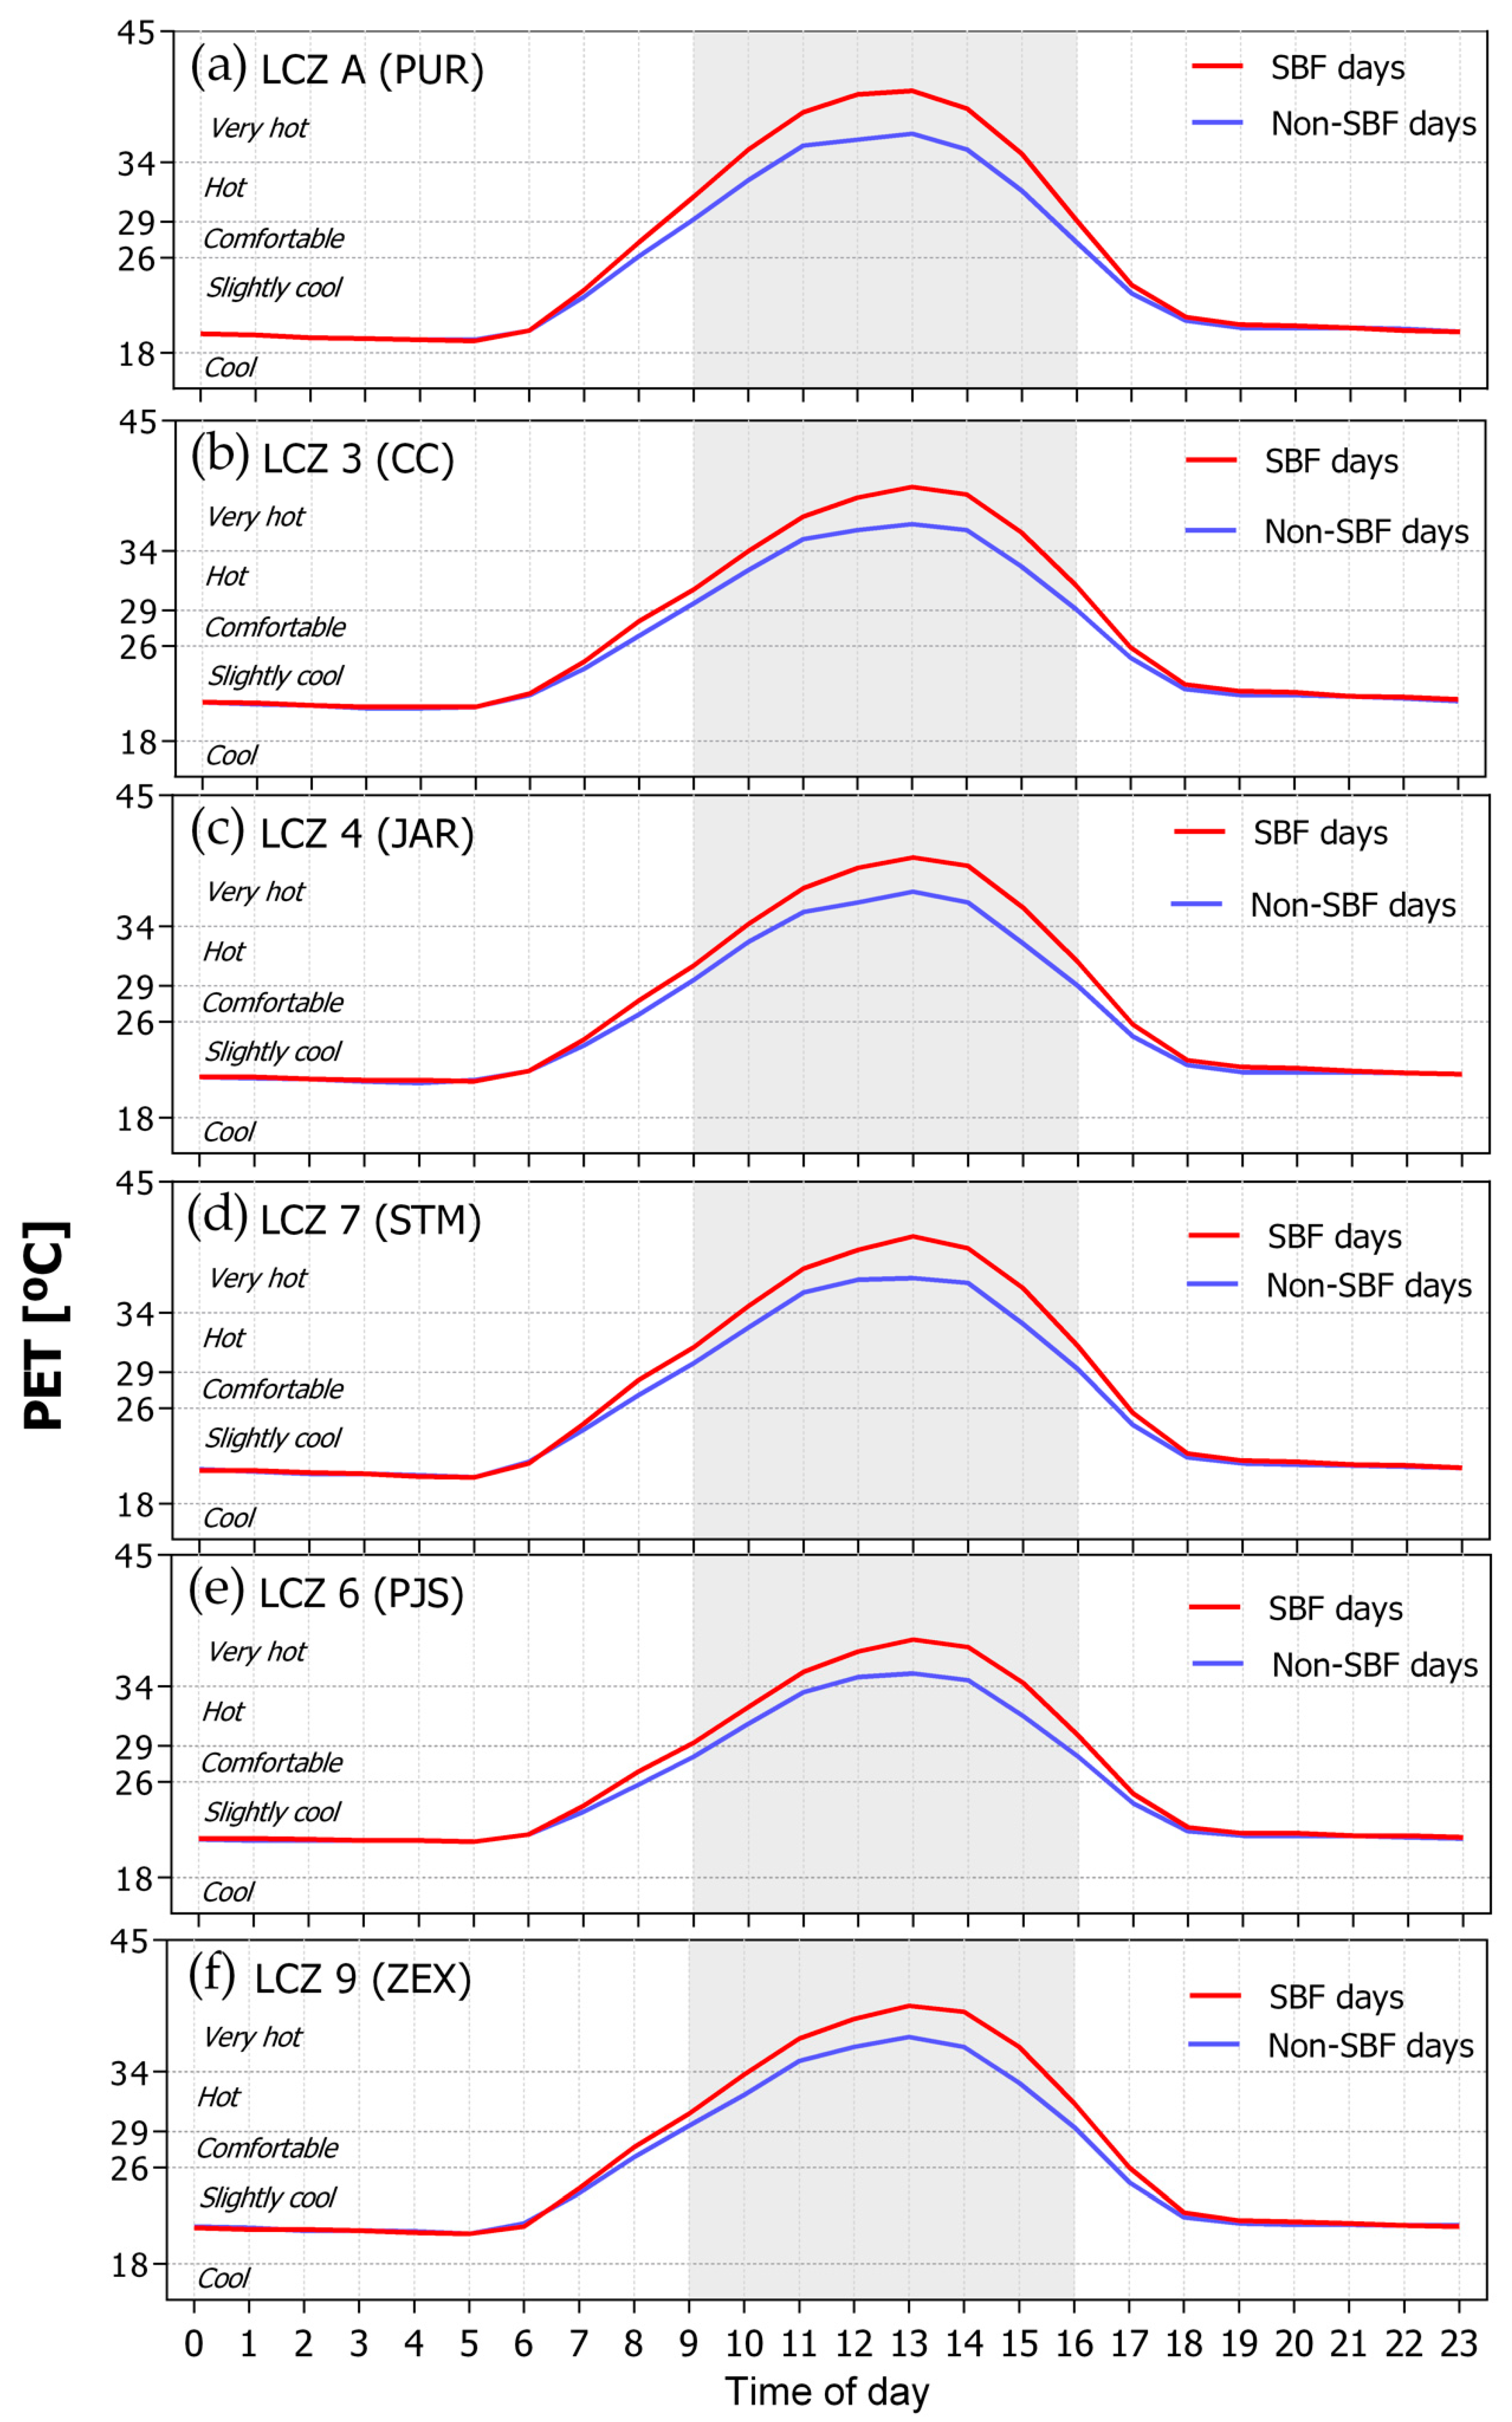
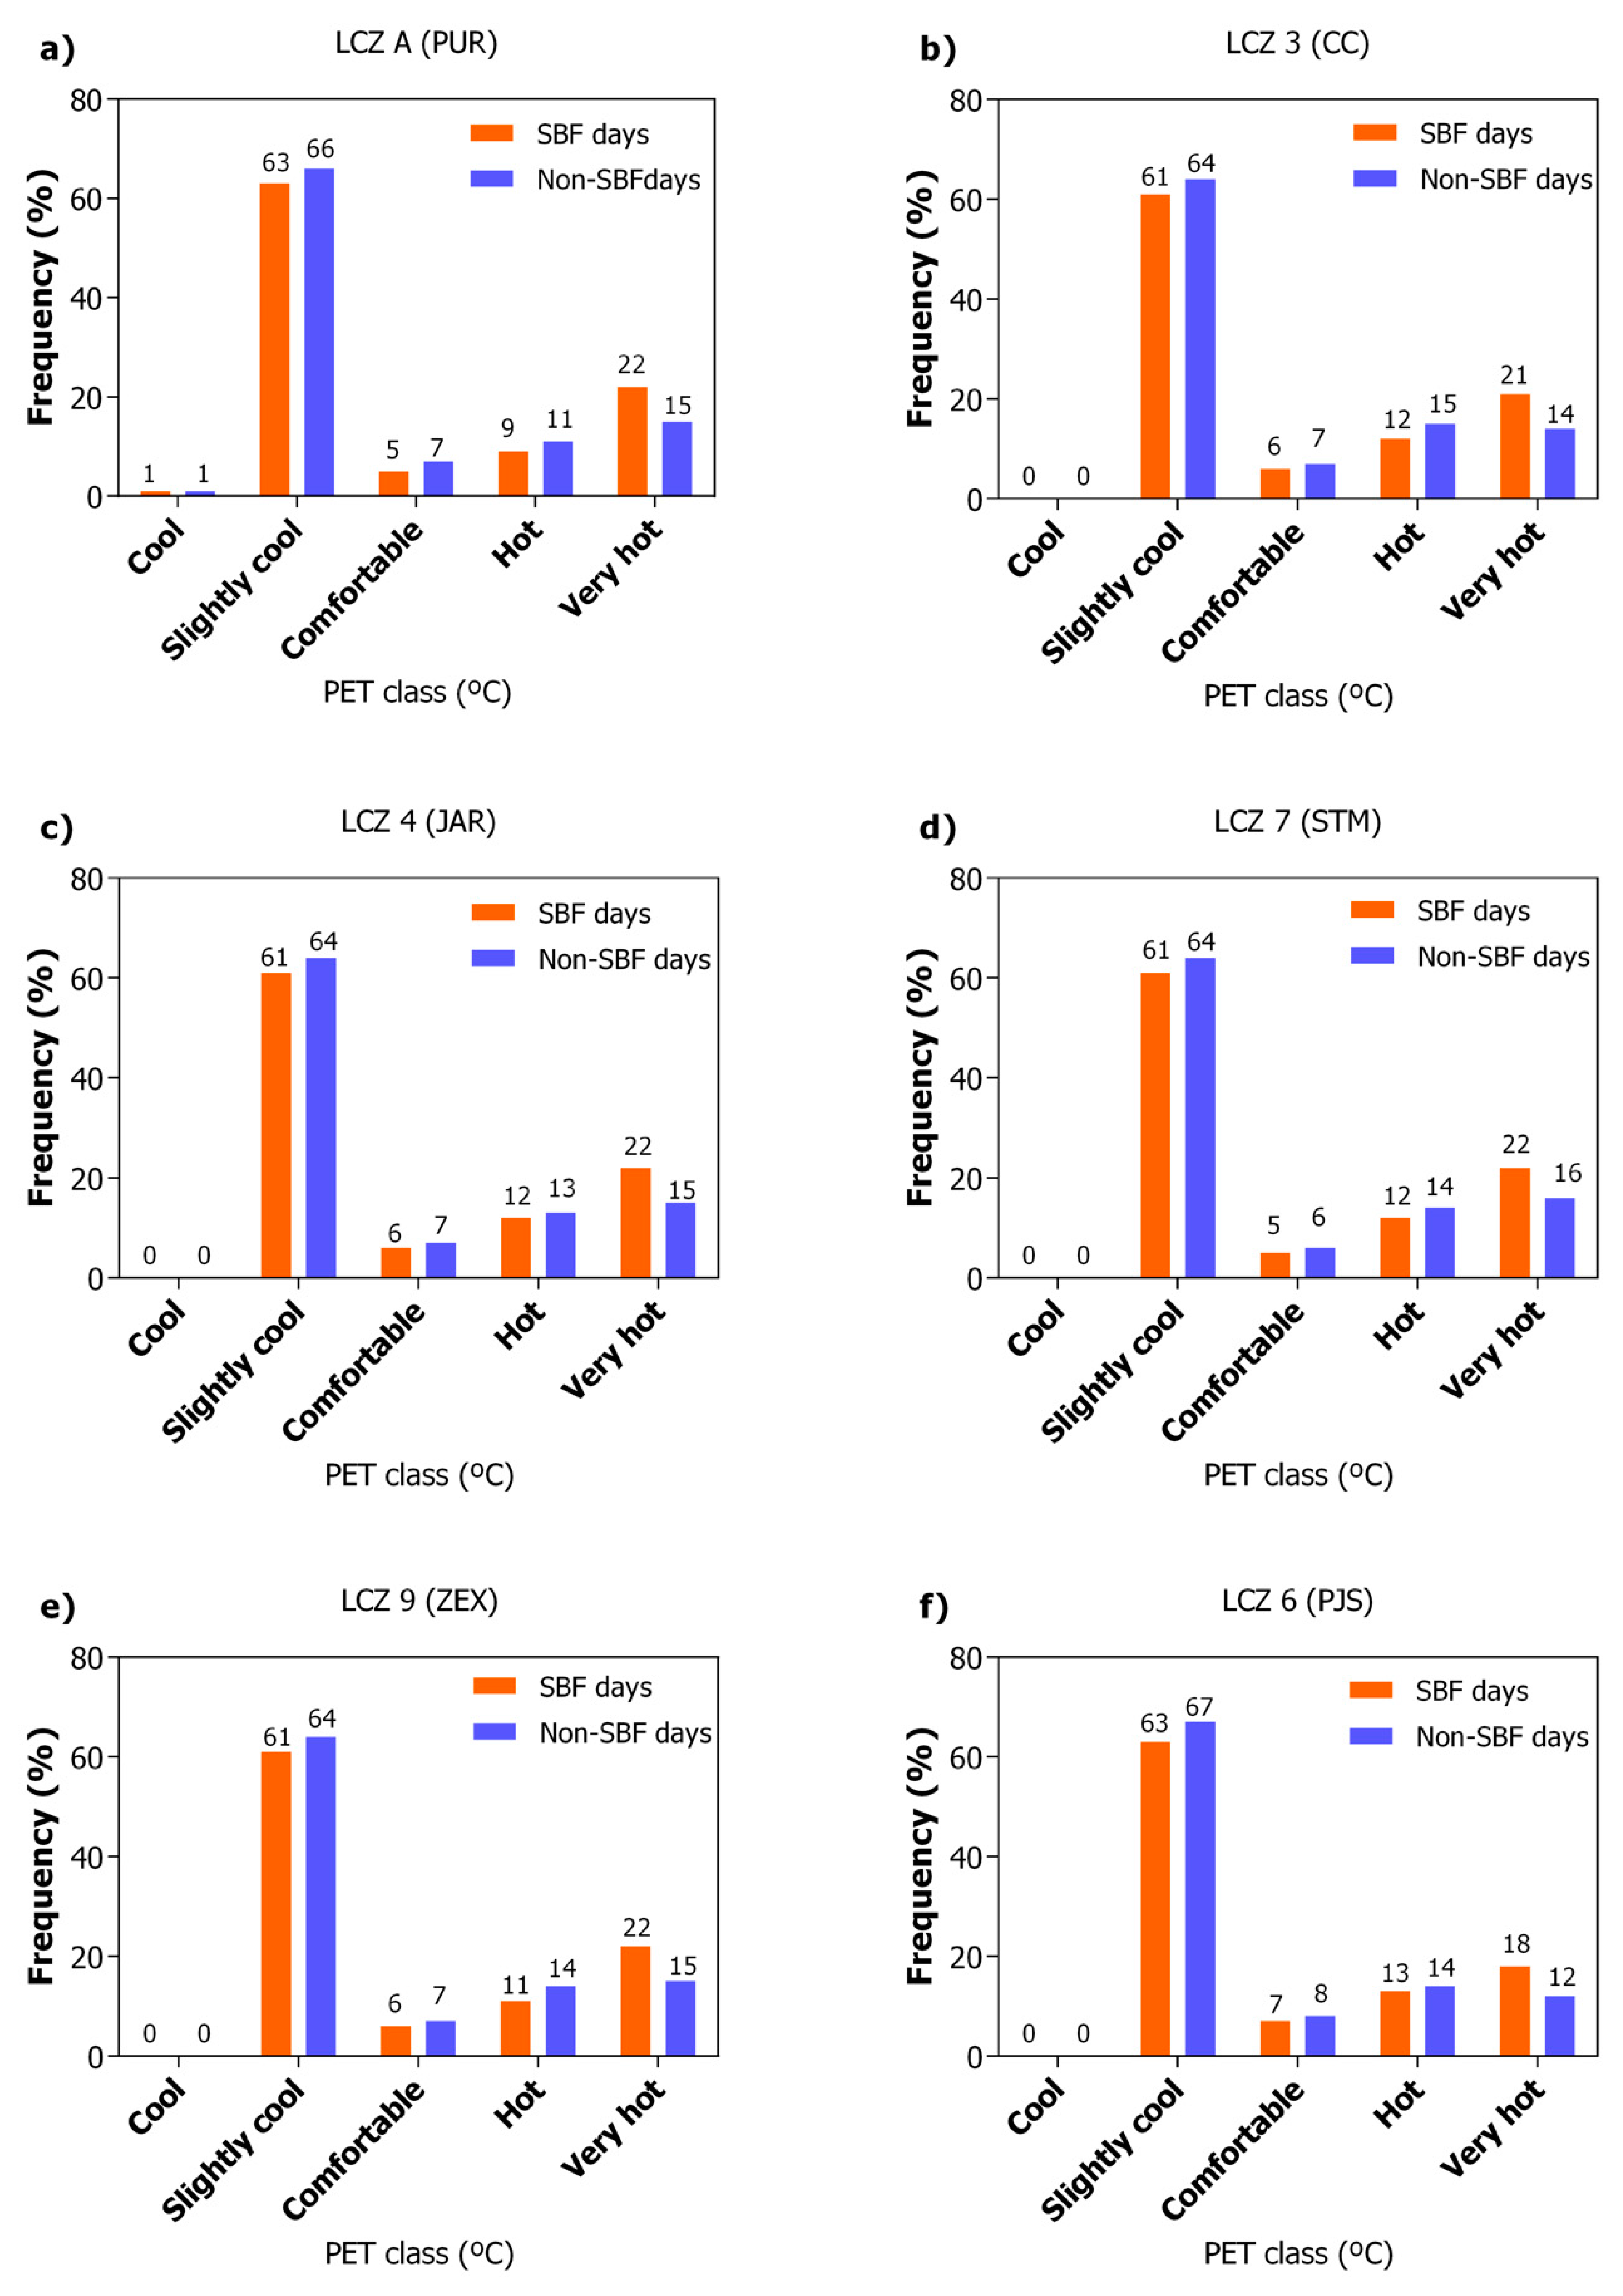
3.3. SBF and Thermal Biometeorological Conditions
4. Conclusions
Author Contributions
Funding
Acknowledgments
Conflicts of Interest
References
- Bandeira, M. Belo Belo, 1st ed.; Global: São Paulo, Brazil, 2014. [Google Scholar]
- Emmanuel, R.; Johansson, E. Influence of urban morphology and sea breeze on hot humid microclimate: The case of Colombo, Sri Lanka. Clim. Res. 2006, 30, 189–200. [Google Scholar] [CrossRef] [Green Version]
- Ng, E. Policies and technical guidelines for urban planning of high-density cities—Air ventilation assessment (AVA) of Hong Kong. Build. Environ. 2009, 44, 1478–1488. [Google Scholar] [CrossRef] [PubMed]
- Emmanuel, R. Achieving thermal pleasure in tropical urban outdoors. In Urban Climate Challenges in the Tropics; Imperial College Press: London, UK, 2016; pp. 31–47. [Google Scholar]
- Anjos, M.; Lopes, A. Sea breeze front identification on the northeastern coast of Brazil and its implications for meteorological conditions in the Sergipe region. Theor. Appl. Climatol. 2019, 137, 2151–2165. [Google Scholar] [CrossRef] [Green Version]
- ANSI/ASHRAE Standard 55. Thermal Environmental Conditions for Human Occupancy; ASHRAE Inc.: Atlanta, GA, USA, 2010. [Google Scholar]
- Rupp, R.F.; Vásquez, N.G.; Lamberts, R. A review of human thermal comfort in the built environment. Energy Build. 2015, 105, 178–205. [Google Scholar] [CrossRef]
- Nouri, A.S.; Charalampopoulos, I.; Matzarakis, A. Beyond Singular Climatic Variables—Identifying the Dynamics of Wholesome Thermo-Physiological Factors for Existing/Future Human Thermal Comfort during Hot Dry Mediterranean Summers. Int. J. Environ. Res. Public Health 2018, 15, 2362. [Google Scholar] [CrossRef] [Green Version]
- Santos Nouri, A.; Matzarakis, A. The Maturing Interdisciplinary Relationship between Human Biometeorological Aspects and Local Adaptation Processes: An Encompassing Overview. Climate 2019, 7, 134. [Google Scholar] [CrossRef] [Green Version]
- Chen, L.; Ng, E. Outdoor thermal comfort and outdoor activities: A review of research in the past decade. Cities 2012, 29, 118–125. [Google Scholar] [CrossRef]
- De Freitas, C.R.; Grigorieva, E.A. A comprehensive catalogue and classification of human thermal climate indices. Int. J. Biometeorol. 2015, 59, 109–120. [Google Scholar] [CrossRef]
- Matzarakis, A.; Mayer, H.; Iziomon, M.G. Applications of a universal thermal index: Physiological equivalent temperature. Int. J. Biometeorol. 1999, 43, 76–84. [Google Scholar] [CrossRef]
- Jendritzky, G.; De Dear, R.; Havenith, G. UTCI-Why another thermal index? Int. J. Biometeorol. 2012, 56, 421–428. [Google Scholar] [CrossRef] [Green Version]
- Makaremi, N.; Salleh, E.; Jaafar, M.Z.; GhaffarianHoseini, A. Thermal comfort conditions of shaded outdoor spaces in hot and humid climate of Malaysia. Build. Environ. 2012, 48, 7–14. [Google Scholar] [CrossRef]
- Fang, Z.; Lin, Z.; Mak, C.M.; Niu, J.; Tse, K.-T. Investigation into sensitivities of factors in outdoor thermal comfort indices. Build. Environ. 2018, 128, 129–142. [Google Scholar] [CrossRef]
- De Hirashima, S.Q.S.; De Assis, E.S.; Nikolopoulou, M. Daytime thermal comfort in urban spaces: A field study in Brazil. Build. Environ. 2016, 107, 245–253. [Google Scholar] [CrossRef] [Green Version]
- Atkinson, B. Meso-Scale Atmospheric Circulations; Academic Press: London, UK, 1981. [Google Scholar]
- Simpson, J. Sea Breeze and Local Winds; Cambridge University Press: Cambridge, UK, 1994. [Google Scholar]
- Miller, S.T.K. Sea breeze: Structure, forecasting, and impacts. Rev. Geophys. 2003, 41, 1011. [Google Scholar] [CrossRef] [Green Version]
- Gilliam, R.C.; Raman, S.; Niyogi, D.D.S. Observational and Numerical Study on the Influence of Large-Scale Flow Direction and Coastline Shape on Sea-Breeze Evolution. Bound. Layer Meteorol. 2004, 111, 275–300. [Google Scholar] [CrossRef]
- Qian, T.; Epifanio, C.C.; Zhang, F. Topographic Effects on the Tropical Land and Sea Breeze. J. Atmos. Sci. 2012, 69, 130–149. [Google Scholar] [CrossRef] [Green Version]
- He, B.J.; Ding, L.; Prasad, D. Outdoor thermal environment of an open space under sea breeze: A mobile experience in a coastal city of Sydney, Australia. Urban Clim. 2020, 31, 100567. [Google Scholar] [CrossRef]
- Vemado, F.; Pereira Filho, A.J. Severe weather caused by heat island and sea breeze effects in the metropolitan area of São paulo, Brazil. Adv. Meteorol. 2016, 2016. [Google Scholar] [CrossRef] [Green Version]
- Mavrakou, T.; Philippopoulos, K.; Deligiorgi, D. The impact of sea breeze under different synoptic patterns on air pollution within Athens basin. Sci. Total Environ. 2012, 433, 31–43. [Google Scholar] [CrossRef]
- Papanastasiou, D.K.; Melas, D. Climatology and impact on air quality of sea breeze in an urban coastal environment. Int. J. Climatol. 2009, 29, 305–315. [Google Scholar] [CrossRef]
- Shang, F.; Chen, D.; Guo, X.; Lang, J.; Zhou, Y.; Li, Y.; Fu, X. Impact of Sea Breeze Circulation on the Transport of Ship Emissions in Tangshan Port, China. Atmosphere (Basel) 2019, 10, 723. [Google Scholar] [CrossRef] [Green Version]
- Creel, L. Ripple Effects: Population and Coastal Regions; Population Reference Bureau: Washington, DC, USA, 2003. [Google Scholar]
- Zhao, L.; Oppenheimer, M.; Zhu, Q.; Baldwin, J.W.; Ebi, K.L.; Bou-Zeid, E.; Guan, K.; Liu, X. Interactions between urban heat islands and heat waves—Supplementary Information. Environ. Res. Lett. 2018, 13, 034003. [Google Scholar] [CrossRef]
- Zander, K.K.; Botzen, W.J.W.; Oppermann, E.; Kjellstrom, T.; Garnett, S.T. Heat stress causes substantial labour productivity loss in Australia. Nat. Clim. Chang. 2015, 5, 647–651. [Google Scholar] [CrossRef]
- Umezaki, A.S.; Ribeiro, F.N.D.; De Oliveira, A.P.; Soares, J.; De Miranda, R.M. Numerical characterization of spatial and temporal evolution of summer urban heat island intensity in São Paulo, Brazil. Urban Clim. 2020, 32, 100615. [Google Scholar] [CrossRef]
- Shen, L.; Sun, J.; Yuan, R. Idealized large-eddy simulation study of interaction between urban heat island and sea breeze circulations. Atmos. Res. 2018, 214, 338–347. [Google Scholar] [CrossRef]
- Ribeiro, F.N.D.; Oliveira, A.P.D.; Soares, J.; Miranda, R.M.D.; Barlage, M.; Chen, F. Effect of sea breeze propagation on the urban boundary layer of the metropolitan region of Sao Paulo, Brazil. Atmos. Res. 2018, 214, 174–188. [Google Scholar] [CrossRef]
- Yamato, H.; Mikami, T.; Takahashi, H. Impact of sea breeze penetration over urban areas on midsummer temperature distributions in the Tokyo Metropolitan area. Int. J. Climatol. 2017. [Google Scholar] [CrossRef]
- Freitas, E.D.; Rozoff, C.M.; Cotton, W.R.; Dias, P.L.S. Interactions of an urban heat island and sea-breeze circulations during winter over the metropolitan area of São Paulo, Brazil. Bound.Layer Meteorol. 2007, 122, 43–65. [Google Scholar] [CrossRef]
- Hu, X.-M.; Xue, M. Influence of Synoptic Sea-Breeze Fronts on the Urban Heat Island Intensity in Dallas–Fort Worth, Texas. Mon. Weather Rev. 2016, 144, 1487–1507. [Google Scholar] [CrossRef]
- Yamamoto, Y.; Ishikawa, H. Influence of urban spatial configuration and sea breeze on land surface temperature on summer clear-sky days. Urban Clim. 2020, 31, 100578. [Google Scholar] [CrossRef]
- Sasaki, Y.; Matsuo, K.; Yokoyama, M.; Sasaki, M.; Tanaka, T.; Sadohara, S. Sea breeze effect mapping for mitigating summer urban warming: For making urban environmental climate map of Yokohama and its surrounding area. Urban Clim. 2018, 24, 529–550. [Google Scholar] [CrossRef]
- Papanastasiou, D.K.; Melas, D.; Bartzanas, T.; Kittas, C. Temperature, comfort and pollution levels during heat waves and the role of sea breeze. Int. J. Biometeorol. 2010, 54, 307–317. [Google Scholar] [CrossRef] [PubMed]
- Lopes, A.; Lopes, S.; Matzarakis, A.; Alcoforado, M.J. The influence of the summer sea breeze on thermal comfort in Funchal (Madeira). A contribution to tourism and urban planning. Meteorol. Z. 2011, 20, 553–564. [Google Scholar] [CrossRef] [Green Version]
- Zhou, Y.; Guan, H.; Huang, C.; Fan, L.; Gharib, S.; Batelaan, O.; Simmons, C. Sea breeze cooling capacity and its influencing factors in a coastal city. Build. Environ. 2019, 166, 106408. [Google Scholar] [CrossRef]
- IBGE. Estimated Population; IBGE Brazilian Institute of Geography and Statistics: Brasília, Brazil, 2019.
- INMET Instituto Nacional de Meteorologia. Normais Climatológicas do Brasil 1981–2010. Available online: http://www.inmet.gov.br/portal/index.php?r=clima/normaisClimatologicas (accessed on 28 February 2020).
- Anjos, M.; Lopes, A. Urban heat island and Park cool island intensities in the coastal city of Aracaju, North-eastern Brazil. Sustainability 2017, 9, 1379. [Google Scholar] [CrossRef] [Green Version]
- Anjos, M.; Lopes, A.; Alves, E.D.L.; Lucena, A.J. de Rede climatológica de mesoescala aplicada ao estudo da Ilha de Calor Urbano: O caso de Aracaju-SE. Caminhos Geogr. 2017, 18, 203–216. [Google Scholar] [CrossRef] [Green Version]
- Stewart, I.D.; Oke, T.R. Local Climate Zones for Urban Temperature Studies. Bull. Am. Meteorol. Soc. 2012, 93, 1879–1900. [Google Scholar] [CrossRef]
- Anjos, M.; Targino, A.C.; Krecl, P.; Oukawa, G.Y.; Braga, R.F. Analysis of the urban heat island under different synoptic patterns using local climate zones. Build. Environ. 2020, 185, 107268. [Google Scholar] [CrossRef]
- Kotharkar, R.; Bagade, A. Evaluating urban heat island in the critical local climate zones of an Indian city. Landsc. Urban Plan. 2018, 169, 92–104. [Google Scholar] [CrossRef]
- Alexander, P.; Mills, G. Local Climate Classification and Dublin’s Urban Heat Island. Atmosphere (Basel) 2014, 5, 755–774. [Google Scholar] [CrossRef] [Green Version]
- Leconte, F.; Bouyer, J.; Claverie, R.; Pétrissans, M. Using Local Climate Zone scheme for UHI assessment: Evaluation of the method using mobile measurements. Build. Environ. 2015, 83, 39–49. [Google Scholar] [CrossRef]
- Höppe, P. The physiological equivalent temperature—A universal index for the biometeorological assessment of the thermal environment. Int. J. Biometeorol. 1999, 43, 71–75. [Google Scholar] [CrossRef] [PubMed]
- Matzarakis, A.; Rutz, F.; Mayer, H. Modelling radiation fluxes in simple and complex environments: Basics of the RayMan model. Int. J. Biometeorol. 2010, 54, 131–139. [Google Scholar] [CrossRef] [PubMed] [Green Version]
- Matzarakis, A.; Rutz, F.; Mayer, H. Modelling radiation fluxes in simple and complex environments—Application of the RayMan model. Int. J. Biometeorol. 2007, 51, 323–334. [Google Scholar] [CrossRef]
- Matzarakis, A.; De Rocco, M.; Najjar, G. Thermal bioclimate in Strasbourg—The 2003 heat wave. Theor. Appl. Climatol. 2009, 98, 209–220. [Google Scholar] [CrossRef]
- Nouri, A.S.; Lopes, A.; Costa, J.P.; Matzarakis, A. Confronting potential future augmentations of the physiologically equivalent temperature through public space design: The case of Rossio, Lisbon. Sustain. Cities Soc. 2018, 37, 7–25. [Google Scholar] [CrossRef]
- Oke, T.R.; Mills, G.; Christen, A.; Voogt, J.A. Urban Climates; Cambridge University Press: Cambridge, 2017; ISBN 9781139016476. [Google Scholar]
- Gulyás, Á.; Unger, J.; Matzarakis, A. Assessment of the microclimatic and human comfort conditions in a complex urban environment: Modelling and measurements. Build. Environ. 2006, 41, 1713–1722. [Google Scholar] [CrossRef]
- Anjos, M. Application of Climatic Guidelines to Urban Planning in the Northeastern Coast of Brazil: Aracaju City (In Portuguese); University of Lisbon: Lisbon, Portugal, 2017. [Google Scholar]
- Souza, S.H. Avaliação do Desempenho Térmico nos Microclimas das Praças: Piedade e Visconde de Cayrú, Salvador/BA (in Portuguese); Escola Politécnica da Universidade Federal da Bahia: Salvador, Brasil, 2010. [Google Scholar]
- Lee, H.; Mayer, H.; Chen, L. Contribution of trees and grasslands to the mitigation of human heat stress in a residential district of Freiburg, Southwest Germany. Landsc. Urban Plan. 2016, 148, 37–50. [Google Scholar] [CrossRef]
- Weather Underground. Available online: https://www.wunderground.com/weather/br/aracaju (accessed on 20 March 2014).
- CPETEC/INPE Brazilian Center for Weather Forecasting and Climate Studies. Technical bulletin. Available online: http://tempo.cptec.inpe.br/boletimtecnico/pt (accessed on 1 September 2020).
- Cavalcanti, I.F.A.; Justi, M.G.A.; Ferreira, N.J. Tempo e Clima no Brasil (in Portuguese); Oficina de Textos: São Paulo, Brasil, 2009. [Google Scholar]
- Kousky, V.E.; Gan, M.A. Upper tropospheric cyclonic vortices in the tropical South Atlantic. Tellus 1981, 33, 538–551. [Google Scholar] [CrossRef] [Green Version]
- Reboita, M.S.; Ambrizzi, T.; Silva, B.A.; Pinheiro, R.F.; Da Rocha, R.P. The South Atlantic Subtropical Anticyclone: Present and Future Climate. Front. Earth Sci. 2019, 7, 1–15. [Google Scholar] [CrossRef] [Green Version]
- Houze, R.A. Mesoscale convective systems. Rev. Geophys. 2004, 42, RG4003. [Google Scholar] [CrossRef] [Green Version]
- Lyra, M.J.A.; Da Silva, N.M.; Fedorova, N.; Levit, V. Mesoscale Convective Complexes and thunderstorm events in the Alagoas State, the Northeast Brazil. In 2015 International Symposium on Lightning Protection (XIII SIPDA); IEEE: Balneário Camboriú, Brazil, 2015; Volume 53, pp. 301–305. [Google Scholar]
- Andrade, T.; Nery, J.; Freire, T.; Katzschner, D.F.L. Thermal Comfort Conditions for a Tropical City, Salvador—Brazil. In The 21st Conference on Passive and Low Energy Architecture; Technische Universiteit Eindhoven: Eindhoven, The Netherlands, 2004. [Google Scholar]
- Abreu-Harbich, L.V.; Labaki, L.C.; Matzarakis, A. Thermal bioclimate as a factor in urban and architectural planning in tropical climates—The case of Campinas, Brazil. Urban Ecosyst. 2013, 16, 397–674. [Google Scholar] [CrossRef]
- Ketterer, C.; Matzarakis, A. Mapping the Physiologically Equivalent Temperature in urban areas using artificial neural network. Landsc. Urban Plan. 2016, 150, 1–9. [Google Scholar] [CrossRef]


| Urban Station (Sensor) | LCZ Types | Local Scale 1 | |||||||
|---|---|---|---|---|---|---|---|---|---|
| SVF 2 (0–1) | BSR3 (%) | ISR4 (%) | VR5 (%) | Z0 6 (m) | Zd 7 (m) | ZH 8 (m) | Aerial Photo of Urban Station | ||
| PUR | Dense trees (LCZ A) | 0.948 | 5.5 | 7.5 | 73 | 0.6 | 19.7 | 0.4 |  |
| CC | Compact low-rise (LCZ 3) | 0.708 | 69 | 93 | 2.3 | 1 | 9.8 | 10 |  |
| JAR | Open high-rise (LCZ 4) | 0.768 | 60 | 70 | 12 | 2 | 20 | 16 |  |
| STM | Lightweight low-rise (LCZ 7) | 0.953 | 25 | 50 | 9.5 | 0.3 | 9 | 5.8 |  |
| PJS | Open low-rise (LCZ 6) | 0.965 | 12 | 23 | 6 | 0.25 | 3.7 | 6.7 |  |
| ZEX | Sparsely built (LCZ 9) | 0.981 | 50 | 48 | 26 | 0.1 | 1.6 | 6.5 |  |
| PET | Thermal Perception | Grade of Physiological Stress |
|---|---|---|
| <18.0 °C | Cool | Strong cool stress |
| 18.0 °C a 26.0 °C | Slightly cool | Slight cool stress |
| 26.0 °C a 29.0 °C | Comfortable | No thermal stress |
| 29.0 °C a 34.0 °C | Hot | Moderate heat stress |
| >34.0 °C | Very hot | Strong heat stress |
| Variables | SBF Days | Non-SBF Days | |
|---|---|---|---|
| Frequency | Frequency | ||
| Sky conditions | Clear sky | 8% | 7% |
| Partly cloudy | 89% | 78% | |
| Very cloudy | 3% | 15% | |
| Overcast sky | 0% | 0% | |
| Meteorological systems | UTCV | 81% | 41% |
| Troughs | 9% | 13% | |
| SASA | 10% | 10% | |
| MCCs | 0% | 12% | |
| LCZ Class (Urban Station) | Air Temperature (°C) | |||||||
|---|---|---|---|---|---|---|---|---|
| SBF Days | Non-SBF Days | |||||||
| Mean | Min | Max | ±SD 1 | Mean | Min | Max | ±SD | |
| LCZ 3 (CC) | 27.8 | 23.7 | 31.2 | 1.401 | 27.5 | 23.8 | 30.8 | 1.365 |
| LCZ 4 (JAR) | 27.9 | 23.4 | 31.6 | 1.472 | 27.6 | 23.6 | 31.4 | 1.417 |
| LCZ 9 (ZEX) | 27.6 | 23.2 | 31.0 | 1.580 | 27.3 | 23.2 | 30.9 | 1.530 |
| LCZ 7 (STM) | 27.7 | 23.5 | 32.4 | 1.788 | 27.4 | 23.1 | 31.6 | 1.686 |
| LCZ 6 (PJS) | 27.4 | 23.7 | 30.2 | 1.104 | 27.1 | 23.3 | 29.9 | 1.108 |
| LCZ A (PUR) | 26.9 | 22.0 | 32.4 | 2.235 | 26.4 | 22.6 | 32.0 | 1.983 |
© 2020 by the authors. Licensee MDPI, Basel, Switzerland. This article is an open access article distributed under the terms and conditions of the Creative Commons Attribution (CC BY) license (http://creativecommons.org/licenses/by/4.0/).
Share and Cite
Anjos, M.; Lopes, A.; Lucena, A.J.d.; Mendonça, F. Sea Breeze Front and Outdoor Thermal Comfort during Summer in Northeastern Brazil. Atmosphere 2020, 11, 1013. https://doi.org/10.3390/atmos11091013
Anjos M, Lopes A, Lucena AJd, Mendonça F. Sea Breeze Front and Outdoor Thermal Comfort during Summer in Northeastern Brazil. Atmosphere. 2020; 11(9):1013. https://doi.org/10.3390/atmos11091013
Chicago/Turabian StyleAnjos, Max, António Lopes, Andrews José de Lucena, and Francisco Mendonça. 2020. "Sea Breeze Front and Outdoor Thermal Comfort during Summer in Northeastern Brazil" Atmosphere 11, no. 9: 1013. https://doi.org/10.3390/atmos11091013