Article

Evaluation of High-Resolution Crop Model Meteorological Forcing Datasets at Regional Scale: Air Temperature and Precipitation over Major Land Areas of China

1
National Climate Center, China Meteorological Administration, Beijing 100081, China
2
Laboratory for Climate Studies, National Climate Center, China Meteorological Administration, Beijing 100081, China
*
Author to whom correspondence should be addressed.
Atmosphere 2020, 11(9), 1011; https://doi.org/10.3390/atmos11091011
Submission received: 11 August 2020 / Revised: 13 September 2020 / Accepted: 16 September 2020 / Published: 21 September 2020
(This article belongs to the Special Issue Climate Change and Agrometeorological Time Series)

Abstract

:
Air temperature and precipitation are two important meteorological factors affecting the earth’s energy exchange and hydrological process. High quality temperature and precipitation forcing datasets are of great significance to agro-meteorology and disaster monitoring. In this study, the accuracy of air temperature and precipitation of the fifth generation of atmospheric reanalysis produced by the European Centre for Medium-Range Weather Forecasts (ERA5) and High-Resolution China Meteorological Administration Land Data Assimilation System (HRCLDAS) datasets are compared and evaluated from multiple spatial–temporal perspectives based on the ground meteorological station observations over major land areas of China in 2018. Concurrently, the applicability to the monitoring of high temperatures and rainstorms is also distinguished. The results show that (1) although both forcing datasets can capture the broad features of spatial distribution and seasonal variation in air temperature and precipitation, HRCLDAS shows more detailed features, especially in areas with complex underlying surfaces; (2) compared with the ground observations, it can be found that the air temperature and precipitation of HRCLDAS perform better than ERA5. The root-mean-square error (RMSE) of mean air temperature are 1.3 °C for HRCLDAS and 2.3 °C for ERA5, and the RMSE of precipitation are 2.4 mm for HRCLDAS and 5.4 mm for ERA5; (3) in the monitoring of important weather processes, the two forcing datasets can well reproduce the high temperature, rainstorm and heavy rainstorm events from June to August in 2018. HRCLDAS is more accurate in the area and magnitude of high temperature and rainstorm due to its high spatial and temporal resolution. The evaluation results can help researchers to understand the superiority and drawbacks of these two forcing datasets and select datasets reasonably in the study of climate change, agro-meteorological modeling, extreme weather research, hydrological processes and sustainable development.

1. Introduction

Climate change poses a substantial challenge to agriculture and food security, water availability and quality [1,2,3,4]. Many studies have shown that the global climate is undergoing significant changes that greatly influence extreme precipitation, drought and extreme high temperature events [5,6], which bring serious loss of human life, agricultural production, economic development and natural systems [7,8,9,10,11]. In recent years, an increase in the intensity and frequency of extreme weather events has been reported [12]. High-quality meteorological forcing datasets are the essential basis for understanding the characteristics and trends in extreme weather events and can effectively improve the accuracy of crop models [13,14].
Although the conventional station-based observations can provide measured variables with high accuracy and precision, these observations can only represent local scale information [15,16,17], which cannot fully describe the spatial changes due to the limitation of the number and locations of stations [18]. Remote sensing monitoring technology has developed rapidly but is limited by the satellite orbit and detection band; it is difficult to obtain real-time continuous high-resolution ground meteorological data [19]. Numerical model data can perform well in spatial–temporal simulation but is affected by the parameterization scheme; the simulation results are often uncertain [20]. In recent years, the development of data assimilation and fusion techniques provides an effective way to assimilate ground station observation data, remote sensing information and numerical weather forecast data [21,22]. Based on these techniques, different sources of meteorological data are fused to produce spatial–temporal and long time series of gridded fusion datasets, which can make up for the shortcomings of different sources of data [13]. Many gridded fusion forcing datasets are now available, including the Global Land Data Assimilation System (GLDAS) [23], the European Land Data Assimilation System (ELDAS) [24], the China Meteorological Administration (CMA) Land Data Assimilation System (CLDAS) [13,25,26], the fifth generation of atmospheric reanalysis (ERA5) produced by the European Centre for Medium-Range Weather Forecasts (ECMWF) [27] and other datasets. Through these datasets, high-quality meteorological factor fields such as temperature, humidity, wind, air pressure, precipitation, radiation and other data can be obtained. At the same time, the land surface data assimilation system with high spatial and temporal resolution is also gradually developing. On the basis of CLDAS, the National Meteorological Information Center (NMIC) has further developed a high-resolution land data assimilation system (HRCLDAS) [20] to meet the needs of business and scientific research.
Temperature and precipitation are two important input elements of agro-meteorological modeling. At present, most agro-meteorological modeling is driven by station meteorological data but affected by the spatial distribution of stations; there is great uncertainty in regional simulation. In order to accurately carry out regional quantitative simulation research, it is necessary to take the gridded forcing meteorological data as the input of the model. However, the assessment of gridded forcing temperature and precipitation data from multiple spatial and temporal perspectives over major land areas of China and especially the comparative study on their ability to monitor high temperature and rainstorm is still relatively insufficient. In this study, the accuracy and applicability of air temperature and precipitation of HRCLDAS and ERA5 over major land areas of China are evaluated from different temporal and spatial perspectives by using ground automatic weather station observation data, and the ability of HRCLDAS and ERA5 to monitor high temperature and rainstorm is further evaluated. Based on the evaluation results, it is helpful for researchers to understand meteorological forcing datasets and select appropriate datasets for climate change and extreme weather events research, water and energy interaction research and agro-meteorological modeling.

2. Data and Methods

2.1. Datasets Introduction

HRCLDAS is a set of high-resolution land forcing datasets which is produced by using the multi-grid variational analysis technique [21], discrete ordinates radiation transfer model [28], hybrid radiation estimation model [20] and terrain correction algorithm [29] to blend the observation data of automatic ground station, numerical prediction data and satellite data. HRCLDAS provides 2-m air temperature, 2-m humidity, 10-m U wind, 10-m V wind, surface air pressure, ground incident solar radiation, precipitation and other factors. The temporal resolution of HRCLDAS is 1 h and the spatial resolution is 1 km. The real-time datasets download lag time is 1 h. The datasets are in NetCDF format. The spatial extension of the datasets ranges from 15° N to 60° N (latitude) and from 70° E to 140° E (longitude) in the geographic coordinate system.
ERA5 is the fifth generation of atmospheric reanalysis produced by ECMWF, which is an important activity within the Copernicus Climate Change Service (C3S) as it provides a lot of improved and consistent records for the C3S Climate Data Store [27]. Activities on atmospheric reanalysis of ECMWF started in 1979 with the FGGE project, followed by the production of ERA-15 in the mid-1990s, ERA-40 from 2001 to 2003 and ERA-Interim from 2006 to 2019 [13]. ERA5 is produced using the version of ECMWF’s Integrated Forecast System (IFS), CY41r2, based on a hybrid incremental 4D-Var system [30]. ERA5 contains an ensemble component (EDA) [31] of one control and nine perturbed members which provide background-error estimates. The assimilation data of ERA5 mainly include conventional meteorological observation data of the surface and upper atmosphere from different regions and sources in the world, satellite remote sensing data and observation data of some international research programs including the First GARP Global Experiment (FGGE), the Pseudo Surface-Pressure Observations (PAOBS), the First GARP Global Experiment (FGGE), the Tropical Ocean Global Atmosphere (TOGA), the Coupled Ocean-Atmosphere Response Experiment (COARE), the Alpine Experiment (ALPEX), the GARP Atlantic Tropical Experiment (GATE) and so on. The number of meteorological factors provided by ERA5 is very large, including 2-m temperature, 2-m relative humidity, sea level pressure, 10-m wind and other surface factors, as well as high-altitude factors such as relative humidity, potential height and wind field. The temporal resolution of ERA5 is 1 h and the spatial resolution is 31 km. ERA5 is available within 5 days of real time.
The China daily ground observation datasets from NMIC are used to evaluate the air temperature and precipitation. The stations participating in the evaluation are more than 2400 national automatic weather stations (NAWS). Detailed information of datasets used in this study are listed in Table 1.

2.2. Evaluation Method

The observation data from more than 2400 national automatic weather stations (NAWS) are used to evaluate HRCLDAS and ERA5 for air temperature and precipitation over major land areas of China. The time range is from 1 December 2017 to 30 November 2018. Because the temporal resolutions of HRCLDAS and ERA5 products are both hourly, the maximum value of temperature in 24 h for each grid is regarded as the daily maximum temperature, the average value of temperature in 24 h for each grid is calculated as the daily mean temperature, and the accumulation of all precipitation values in 24 h for each grid is calculated as the daily precipitation. The ability of HRCLDAS and ERA5 to monitor high temperature and rainstorm is also compared.
The bilinear interpolation method is implemented to interpolate the gridded air temperature and precipitation data to the station, and the specific formula is as follows:
Z ( I 1 , J ) = J J 2 J 1 J 2 Z ( I 1 , J 1 ) + J J 1 J 2 J 1 Z ( I 1 , J 2 )
Z ( I 2 , J ) = J J 2 J 1 J 2 Z ( I 2 , J 1 ) + J J 1 J 2 J 1 Z ( I 2 , J 2 )
A linear interpolation is further conducted along the J-direction:
Z ( I , J ) = I I 2 I 1 I 2 Z ( I 1 , J ) + I I 1 I 2 I 1 Z ( I 2 , J )
where Z(I1,J1), Z (I1,J2), Z (I2,J1) and Z (I2,J2) are values of the variable on the corresponding grids; Z(I1,J) and Z(I2,J) are results at I1 latitude and I2 latitude after the linear interpolation; Z(I,J) is the value at a specific station after the interpolation.
The correlation coefficient (COR), root-mean-square error (RMSE) and bias are implemented to compare NAWS observations with HRCLDAS and ERA5 for air temperature and precipitation. These indices are defined as follows:
Bias = 1 N i = 1 N ( G i O i )
RMSE = 1 N i = 1 N ( G i O i ) 2
COR = i = 1 N ( G i G i ¯ ) ( O i O i ¯ ) i = 1 N ( G i G i ¯ ) 2 i = 1 N ( O i O i ¯ ) 2
where Oi represents the observations at weather station i, Gi is the value obtained by interpolating the gridded data to the corresponding station i, N is the number of stations participating the evaluation.

3. Results

3.1. Evaluation of Air Temperature

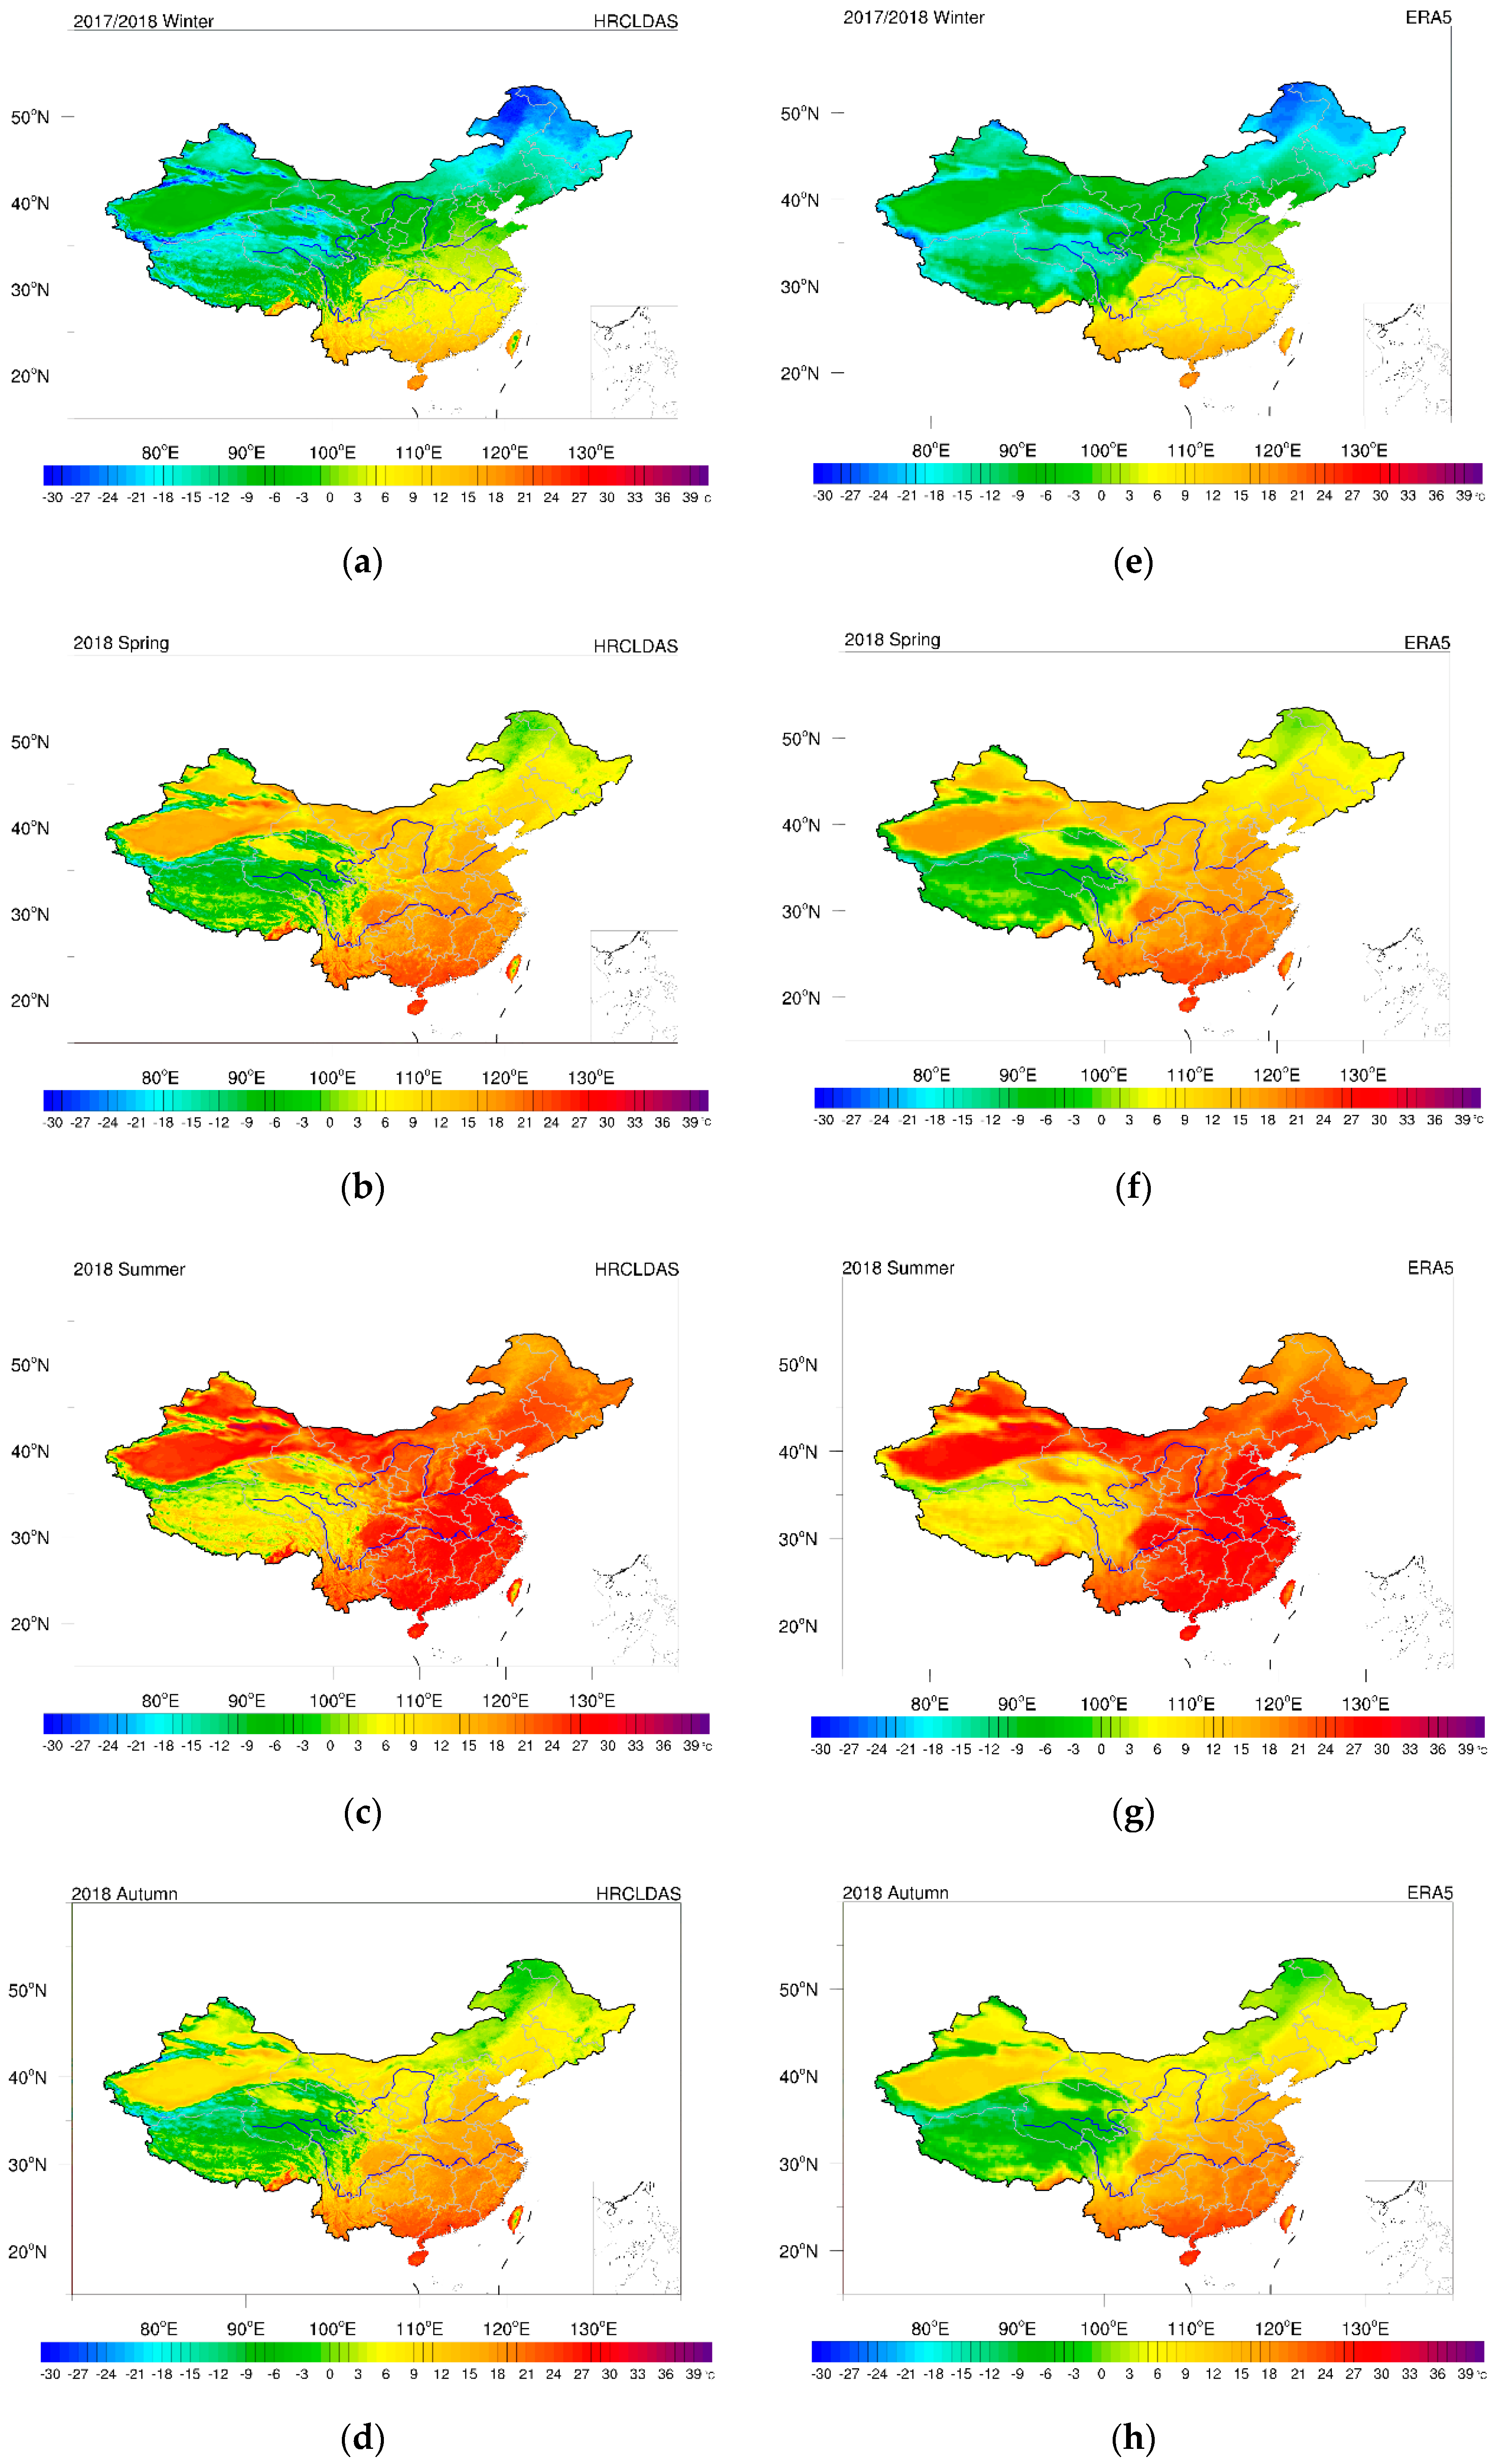
3.1.1. Spatial–Temporal Distribution of Air Temperature

The mean air temperatures in winter 2017/2018, spring 2018, summer 2018 and autumn 2018 are displayed in Figure 1. The mean air temperatures of HRCLDAS and ERA5 have the same seasonal variation characteristics. The seasonal variation shows that the mean air temperature is high in summer, with the temperature higher than 30 °C in Xinjiang (Figure 1i) and Southeast China, low in winter, with the temperature lower than minus 10 °C in the Tibetan Plateau and Northeast China, and is close in spring and autumn.
In the same season, the mean air temperatures of both HRCLDAS and ERA5 capture the broad features of spatial distribution. Except for the Tibetan Plateau, where the mean air temperature in each season is lower than that in other areas, the mean air temperature decreases with the increase in latitude elsewhere. The result shows that the spatial distribution of mean air temperature of HRCLDAS and ERA5 is consistent. However, the description of mean air temperature of HRCLDAS is more precise than that of ERA5, especially in the southwest of China, with high altitude and complex terrain.

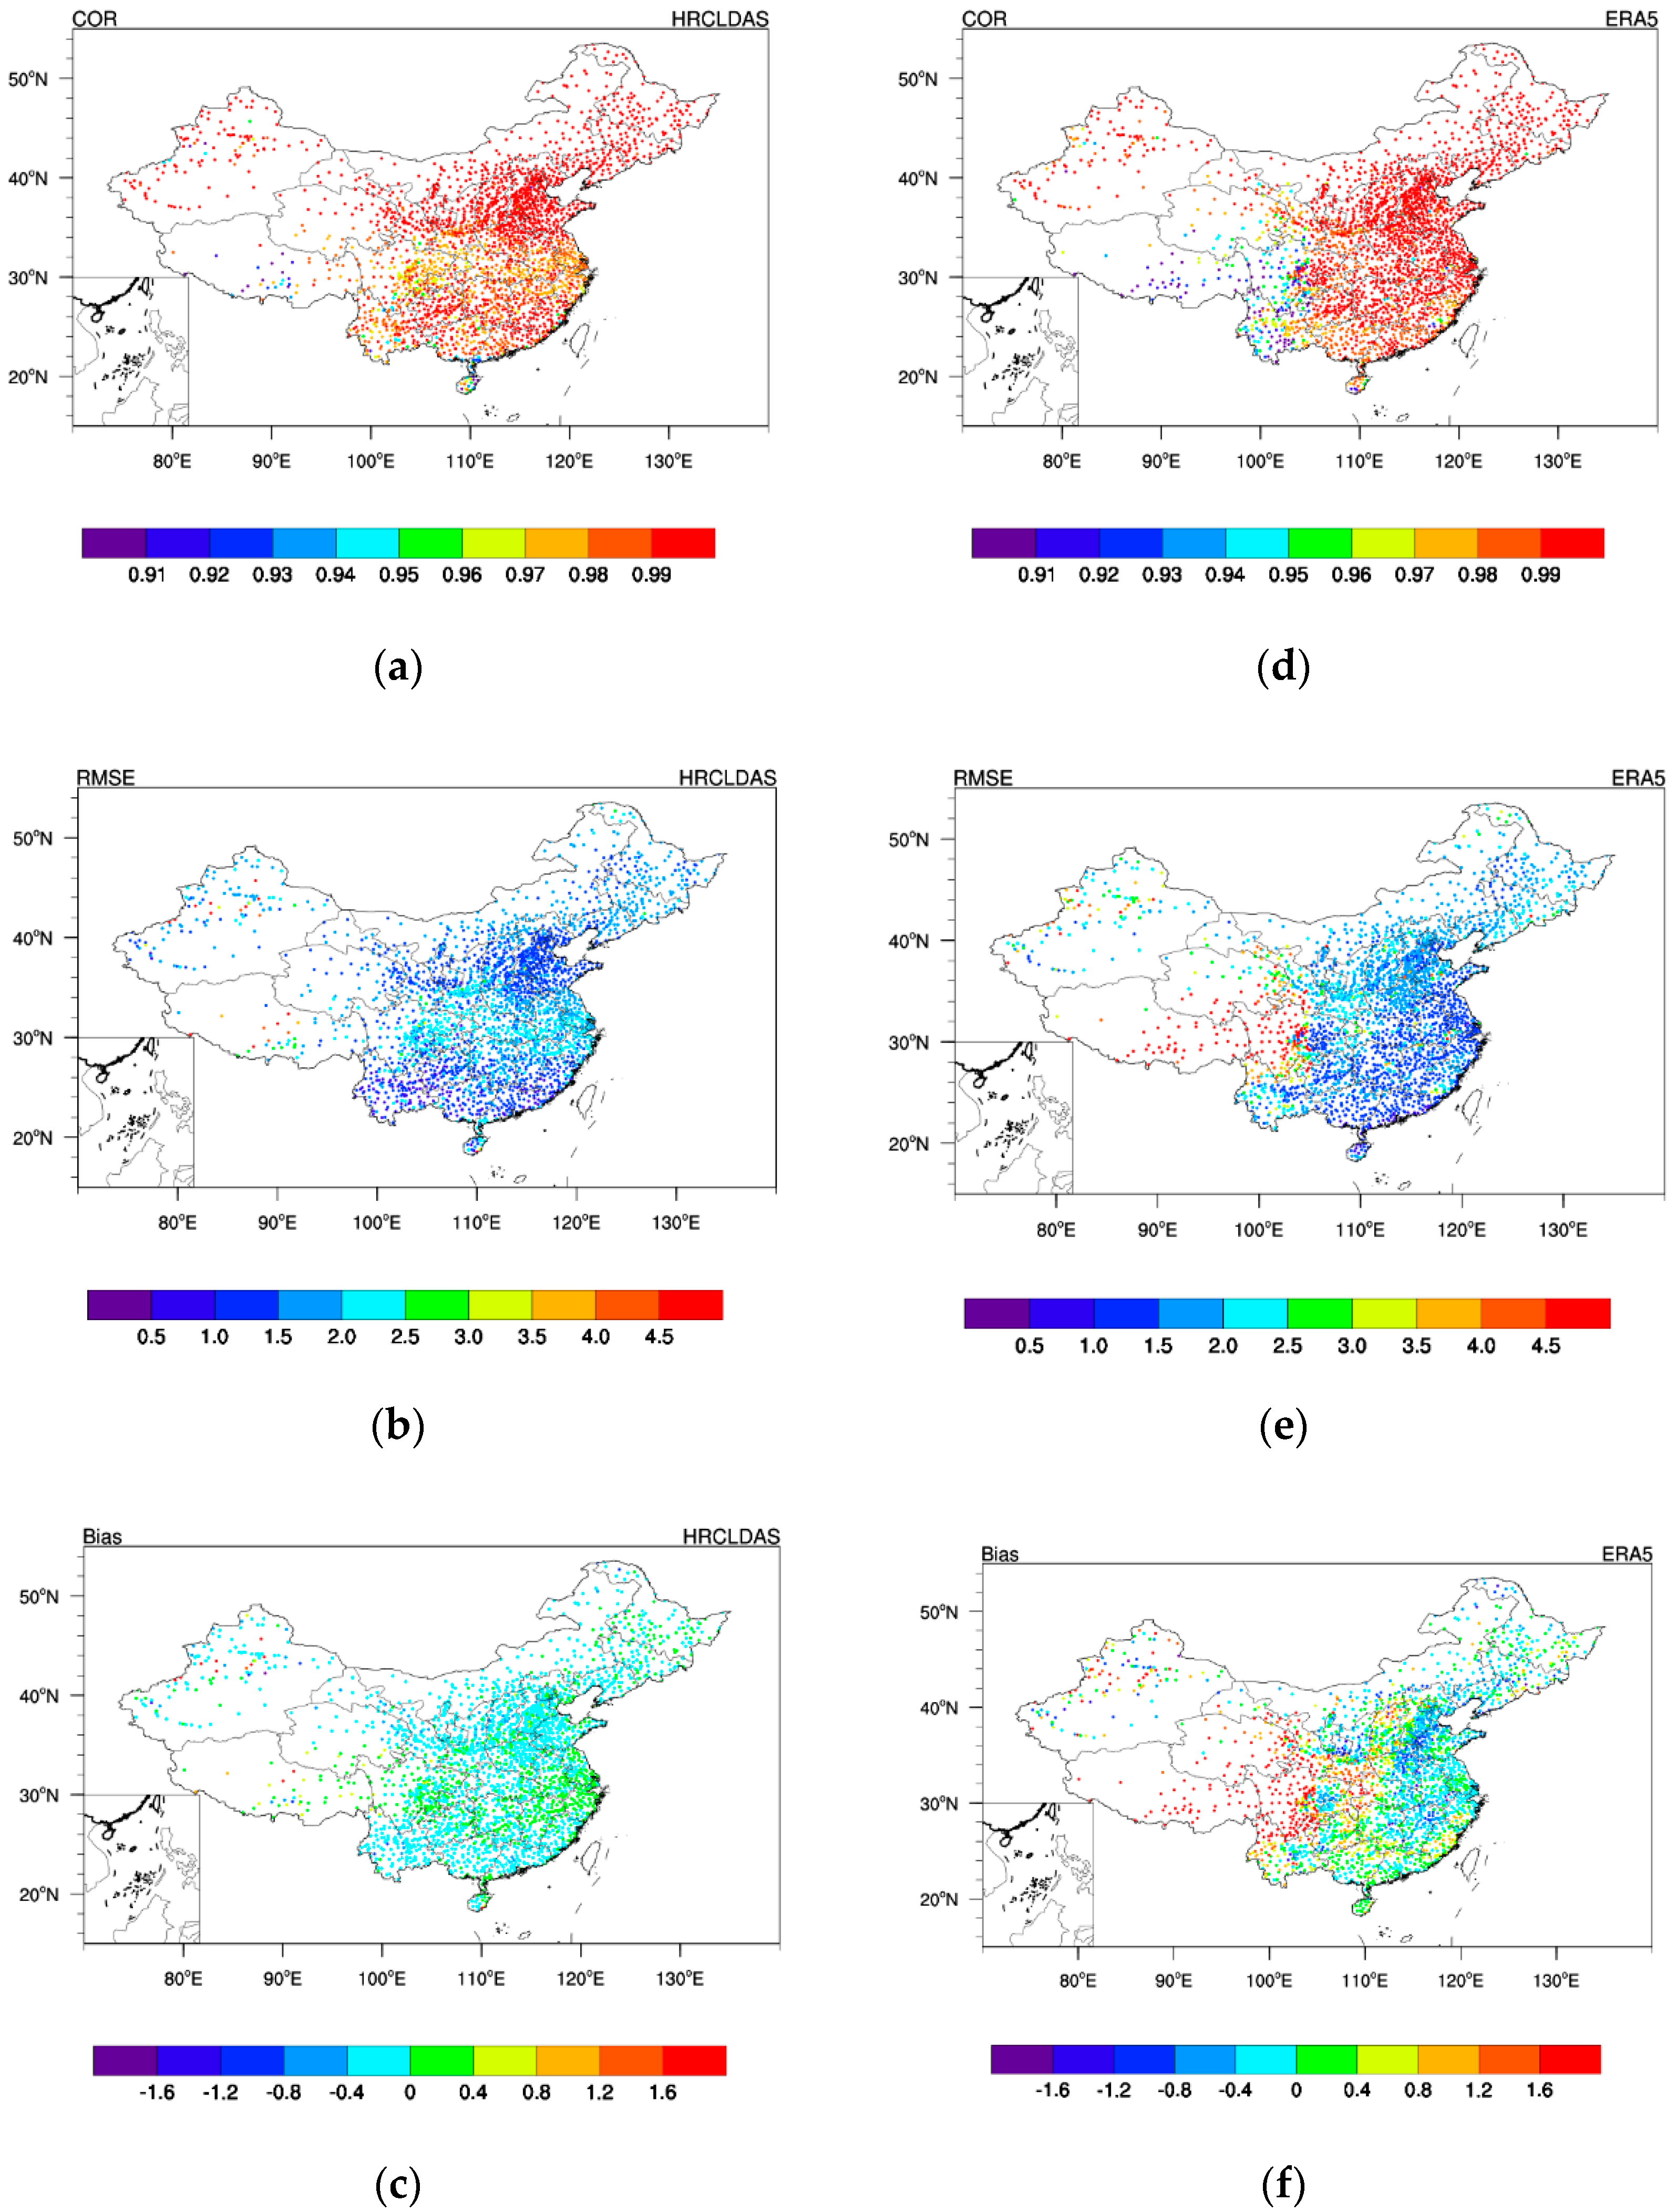
3.1.2. Evaluation of Air Temperature on Each Station

The spatial distribution of COR, RMSE and bias between the mean air temperature of HRCLDAS and ERA5 and the observed mean air temperature at local stations in China are displayed in Figure 2. From the comparison of Figure 2a,d, it is shown that the COR of HRCLDAS and ERA5 basically present a decreasing trend from east to west. There are 97.9% of cases between the HRCLDAS interpolated data and observations which have COR higher than 0.95, while the corresponding percentage between ERA5 interpolated data and observations is 94.4%. In the southwest of China, with high altitude and complex topography, the COR of HRCLDAS is significantly higher than that of ERA5, and the COR of ERA5 is generally lower than 0.95 in this region.
The RMSE for HRCLDAS and ERA5 on each station are shown in Figure 2b,e. Through comparison, it is found that there are 81.4% of cases between the HRCLDAS interpolated data and observations which have an RMSE lower than 2 °C, while the corresponding percentage between ERA5 interpolated data and observations is 78.8%. The RMSE of HRCLDAS is significantly lower than that of ERA5 in the west of China.
From the comparison of bias in Figure 2c,f, it is shown that there are 95.6% of cases between the HRCLDAS interpolated data and observations which have bias ranging from −0.4 to 0.4 °C, while the bias of ERA5 is generally within −0.8 to 0.8 °C in the east but higher than 1.6 °C in the west. The mean air temperature of ERA5 is lower than the observations in the west of China.
In general, HRCLDAS performs better than ERA5 at local station scale, especially in the southwest of China.

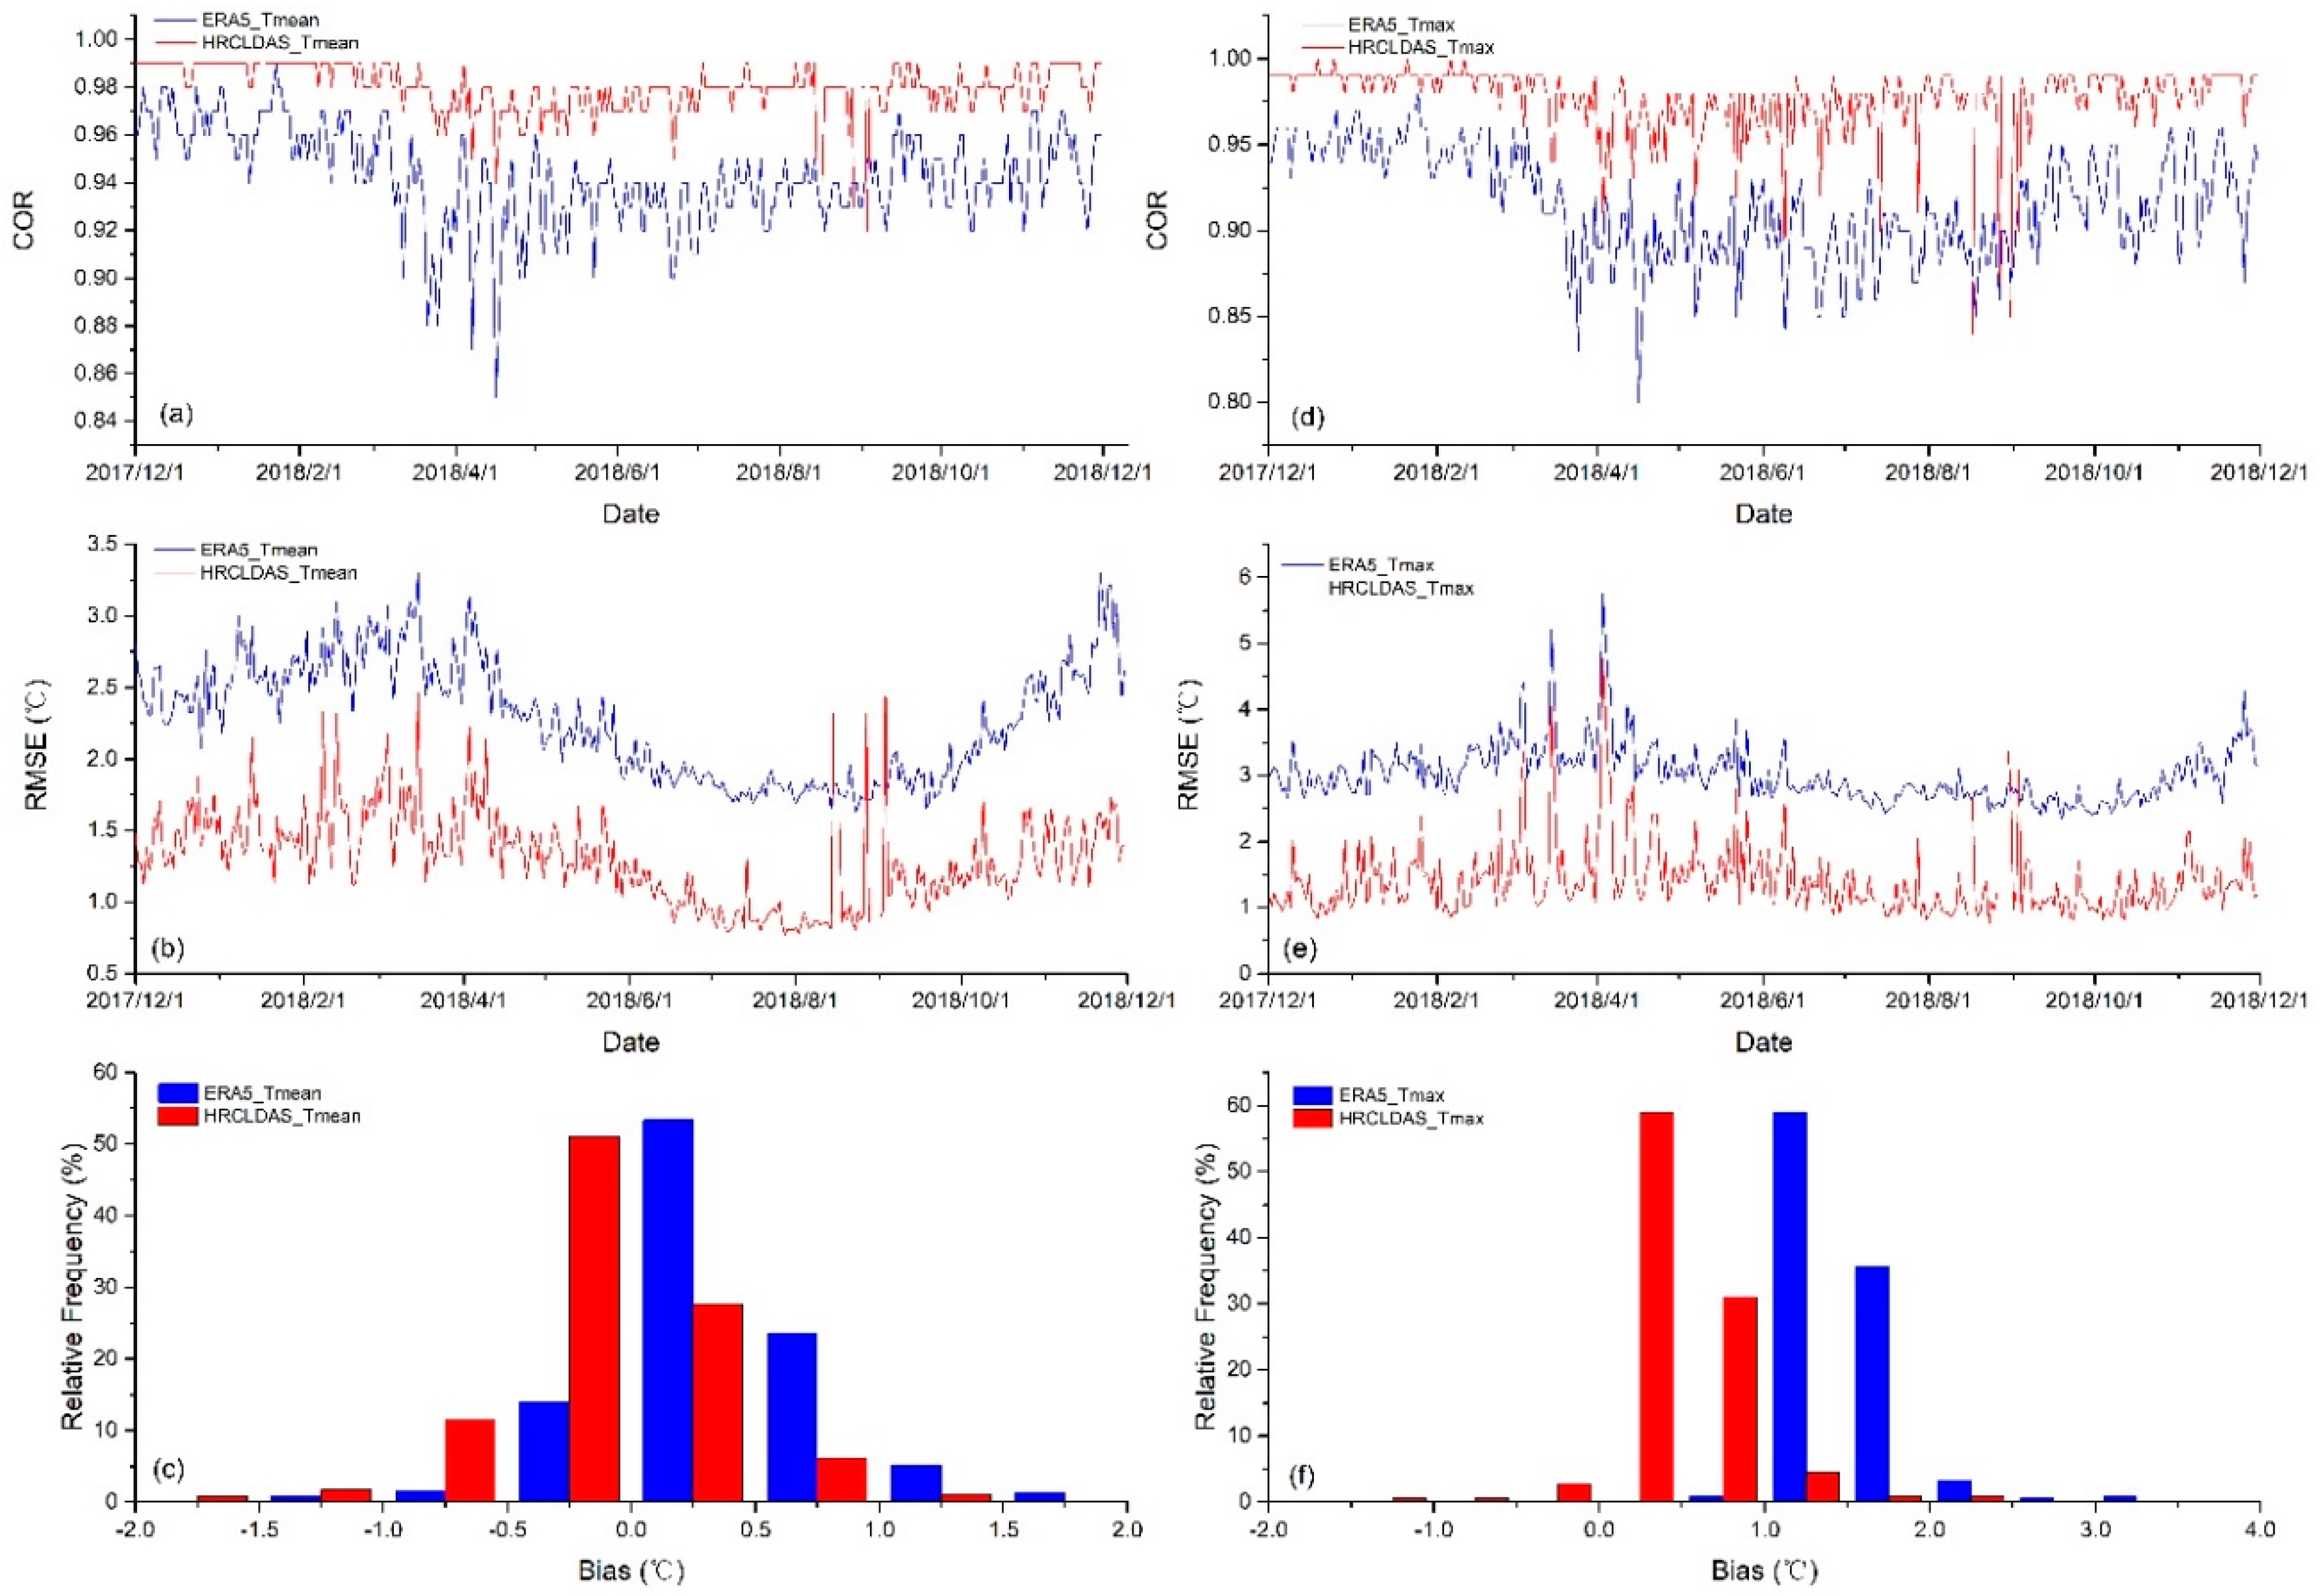
3.1.3. Evaluation of Air Temperature in Daily Time Series

The time series of COR for daily mean air temperature of HRCLDAS and ERA5 from 1 December 2017 to 30 November 2018 averaged over major land areas of China are shown in Figure 3a. The COR of HRCLDAS is largely within the range of 0.92 to 0.99 and the mean COR is 0.98, while the COR of ERA5 is mainly distributed from 0.85 to 0.98 and the mean COR is 0.94. The COR of HRCLDAS is higher than that of ERA5 throughout the year. Especially in summer, the COR of HRCLDAS is generally around 0.98, while the COR of ERA5 is around 0.94. The time series of RMSE for daily mean air temperature of HRCLDAS and ERA5 are shown in Figure 3b. The RMSE of HRCLDAS is basically lower than that of ERA5 throughout the year. The RMSE of HRCLDAS is mainly within the range of 0.8 to 2.0 °C and the mean RMSE is 1.3 °C, while the RMSE of ERA5 is mainly distributed from 1.6 to 3.0 °C and the mean RMSE is 2.3 °C. The frequency distribution of bias for daily mean air temperature of HRCLDAS and ERA5 is displayed in Figure 3c. It is shown that, among 365 days, there are 78.8% days of HRCLDAS with bias ranging from –0.5 to 0.5 °C, while there are only 67.4% days of ERA5 with bias ranging from –0.5 to 0.5 °C.
The time series of COR for daily maximum temperature of HRCLDAS and ERA5 are shown in Figure 3d. The COR of HRCLDAS is largely within the range of 0.84 to 0.99 and the mean COR is 0.98, while the COR of ERA5 is mainly distributed from 0.80 to 0.98 and the mean COR is 0.91. The COR of HRCLDAS is higher than that of ERA5 throughout the year. The time series of RMSE for daily maximum temperature of HRCLDAS and ERA5 are shown in Figure 3e. The RMSE of HRCLDAS is basically lower than that of ERA5 throughout the year. The RMSE of HRCLDAS is mainly within the range of 0.8 to 2.5 °C and the mean RMSE is 1.4 °C, while the RMSE of ERA5 is mainly distributed from 2.5 to 4.0 °C and the mean RMSE is 3.0 °C. The frequency distribution of bias for daily maximum temperature of HRCLDAS and ERA5 is displayed in Figure 3f. It showed that, among 365 days, there are 90.0% days of HRCLDAS on which bias ranged from 0 to 1 °C, while there are only 94.5% days of ERA5 on which the bias ranged from −1 to 2 °C. The maximum temperature of HRCLDAS is a little lower than the observations, while the maximum temperature of ERA5 is seriously lower than the observations.
In general, both the daily mean air temperature and daily maximum temperature of HRCLDAS are closer to observations than that of ERA5, as HRCLDAS has higher COR, lower RMSE and smaller bias.

3.1.4. Evaluation of Air Temperature at Different Altitudes

In order to investigate the relationship between the evaluation results and altitude, the mean air temperature and daily maximum temperature at different altitudes are also evaluated. Since the highest altitude of the stations participating in the evaluation is 4800 m, the altitude is divided into four levels, i.e., below 1000 m, 1000 to 2000 m, 2000 to 4000 m and above 4000 m, in this study. There are 1872 stations located below 1000 m, 430 stations located between 1000 and 2000 m, 146 stations located between 2000 and 4000 m and 25 stations located above 4000 m.
The COR, RMSE and bias of daily mean temperature and daily maximum temperature of HRCLDAS and ERA5 are displayed in Table 2. For the daily mean air temperature, with the increase in altitude, the COR of HRCLDAS and ERA5 both decrease, the RMSE of HRCLDAS and ERA5 both increase, the bias of ERA5 increases, while the change in Bias of HRCLDAS is not obvious. For stations below 1000 m, the COR, RMSE and bias of HRCLDAS and ERA5 are similar. For stations above 1000 m, the COR of HRCLDAS is greater than that of ERA5 at all altitudes, and the RMSE and bias of HRCLDAS are both smaller than those of ERA5 at all altitudes. Overall, the mean air temperature evaluation results of HRCLDAS and ERA5 become worse with the increase in altitude, but HRCLDAS performs better than ERA5 at high altitudes.
For the daily maximum temperature, with the increase of altitude, the COR of HRCLDAS and ERA5 decrease from 0.99 to 0.91 and from 0.98 to 0.90, respectively; the RMSE of HRCLDAS and ERA5 increase from 1.40 to 3.39 °C and from 2.19 to 6.10 °C, respectively; the bias of HRCLDAS and ERA5 increase from 0.48 to 1.46 °C and from 1.10 to 4.83 °C, respectively. For stations above 2000 m, the bias of ERA5 is higher than 4.8 °C, which indicates that ERA5 underestimates the daily maximum temperature seriously, reflecting that ERA5 cannot accurately describe the high temperature in high-altitude areas. Overall, the maximum temperature evaluation results of HRCLDAS and ERA5 become worse with the increase in altitude, but HRCLDAS performs better than ERA5 at each altitude.

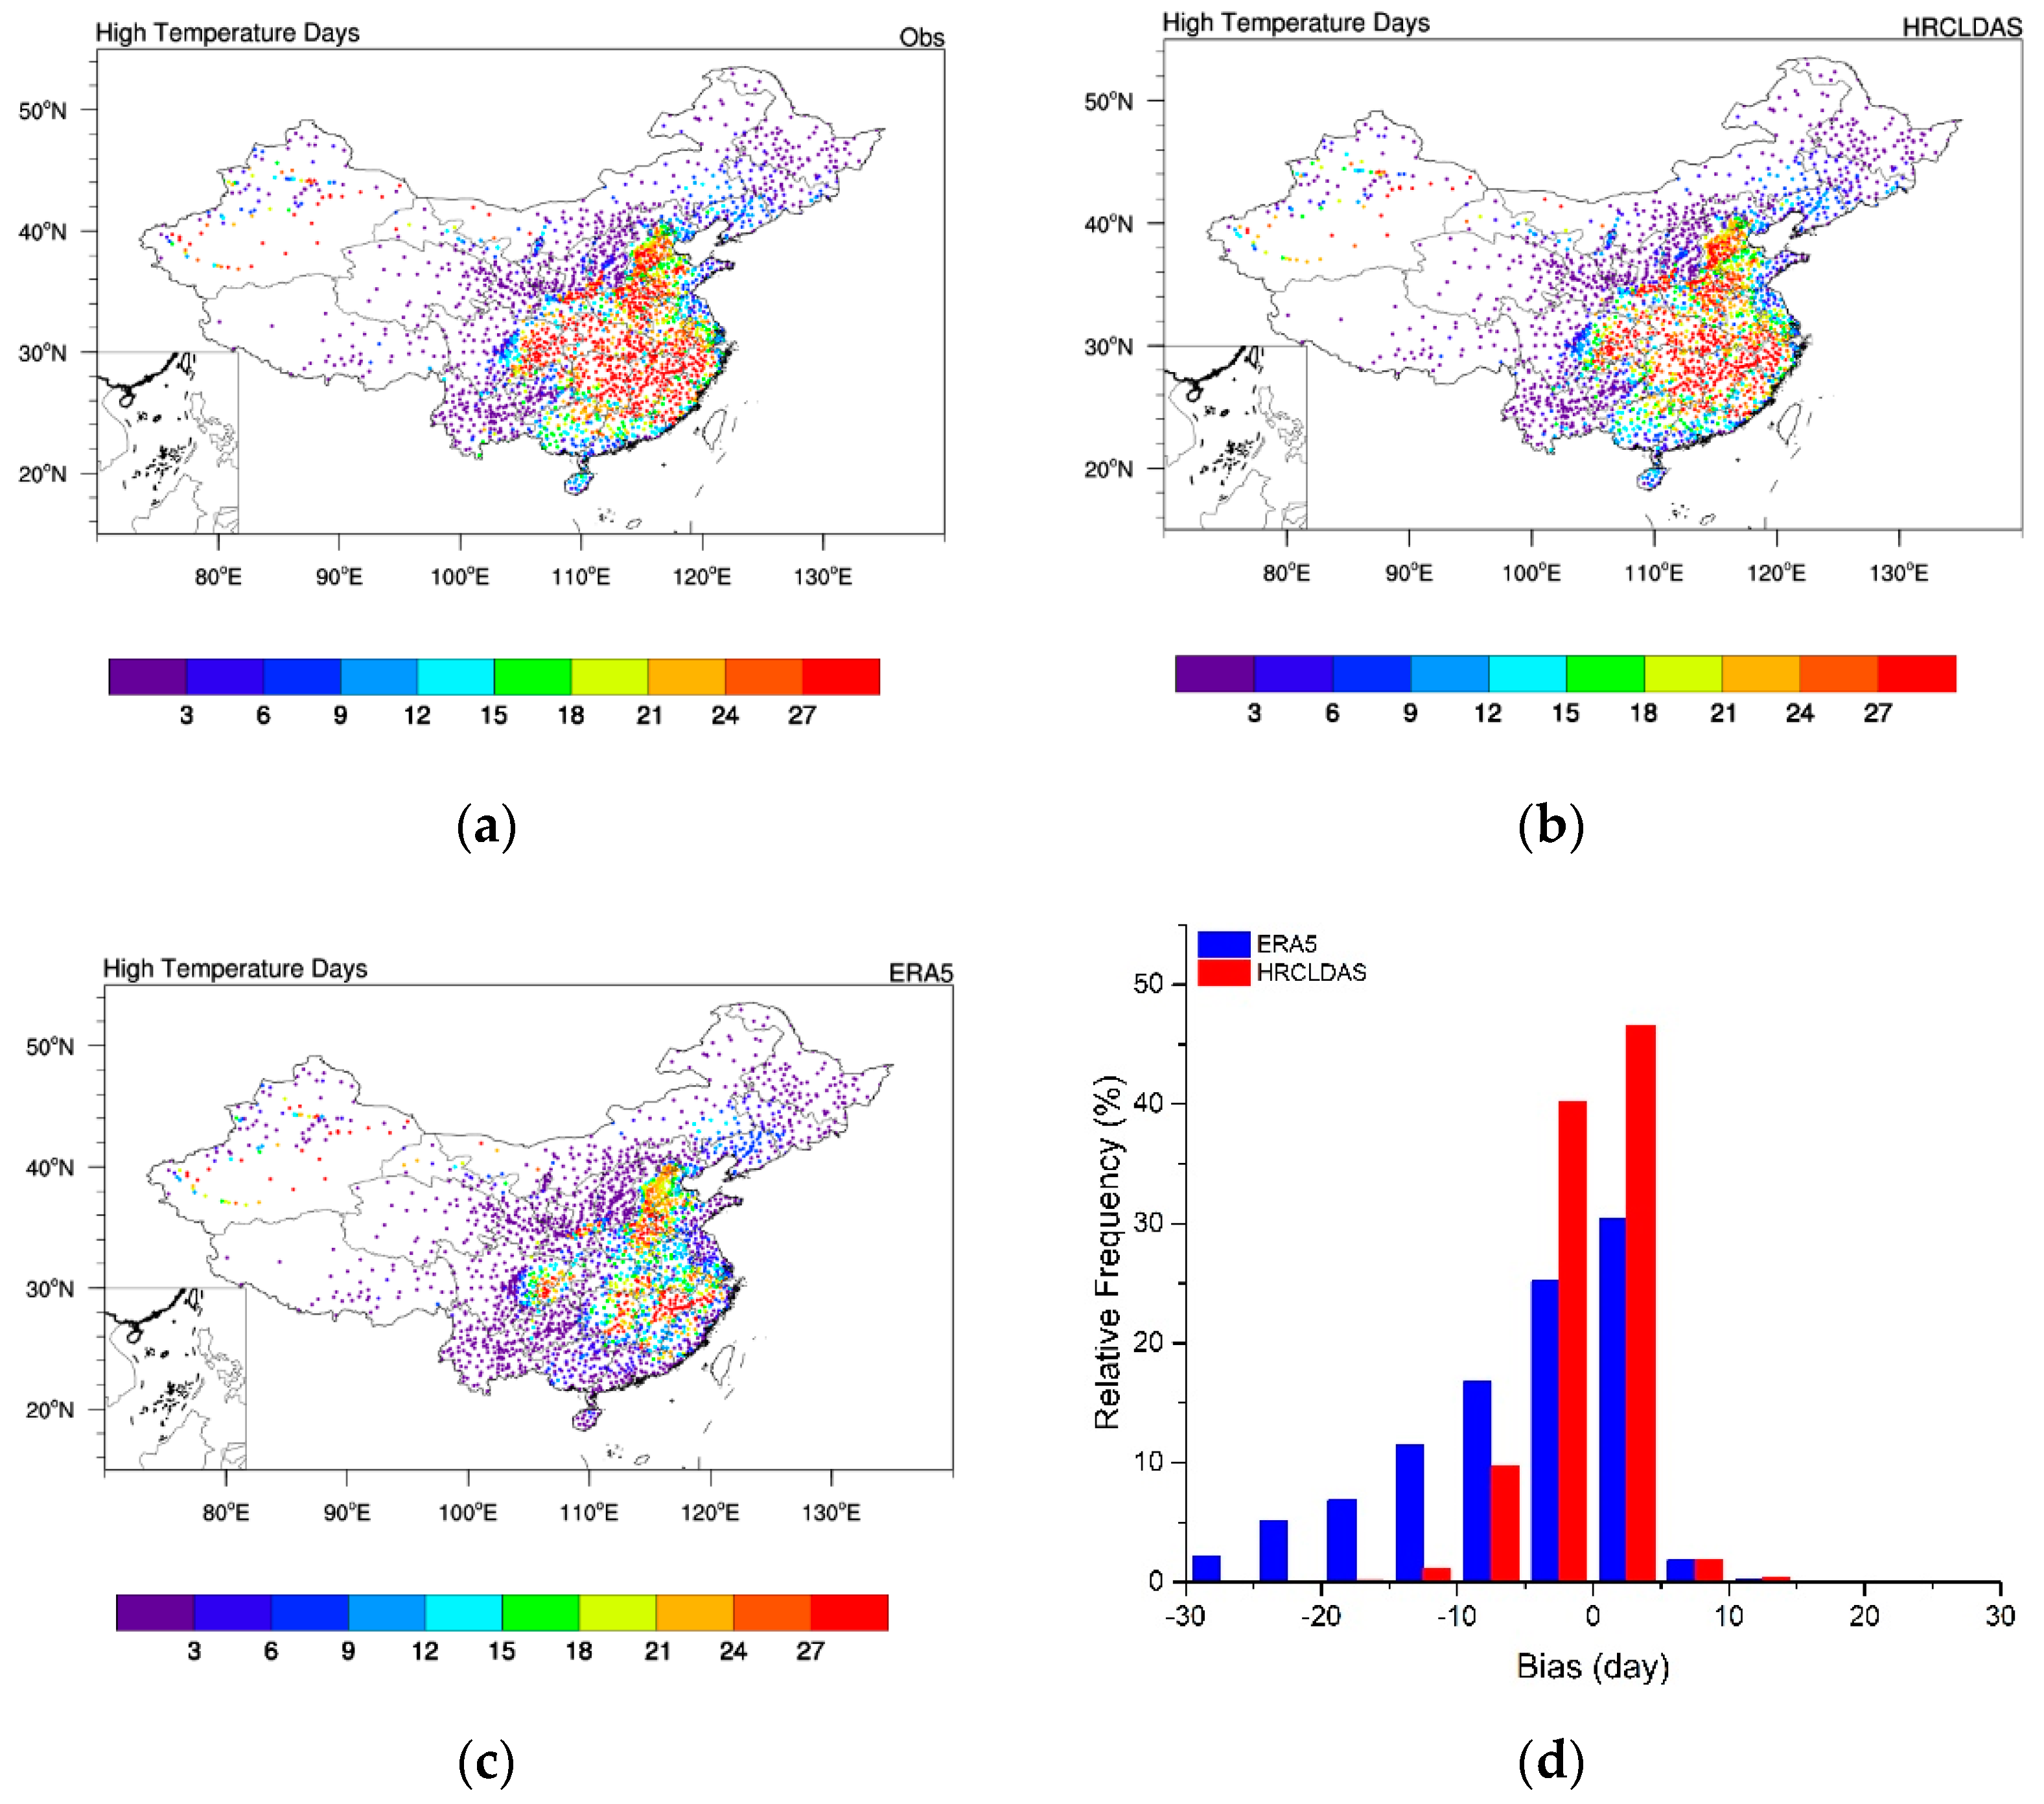
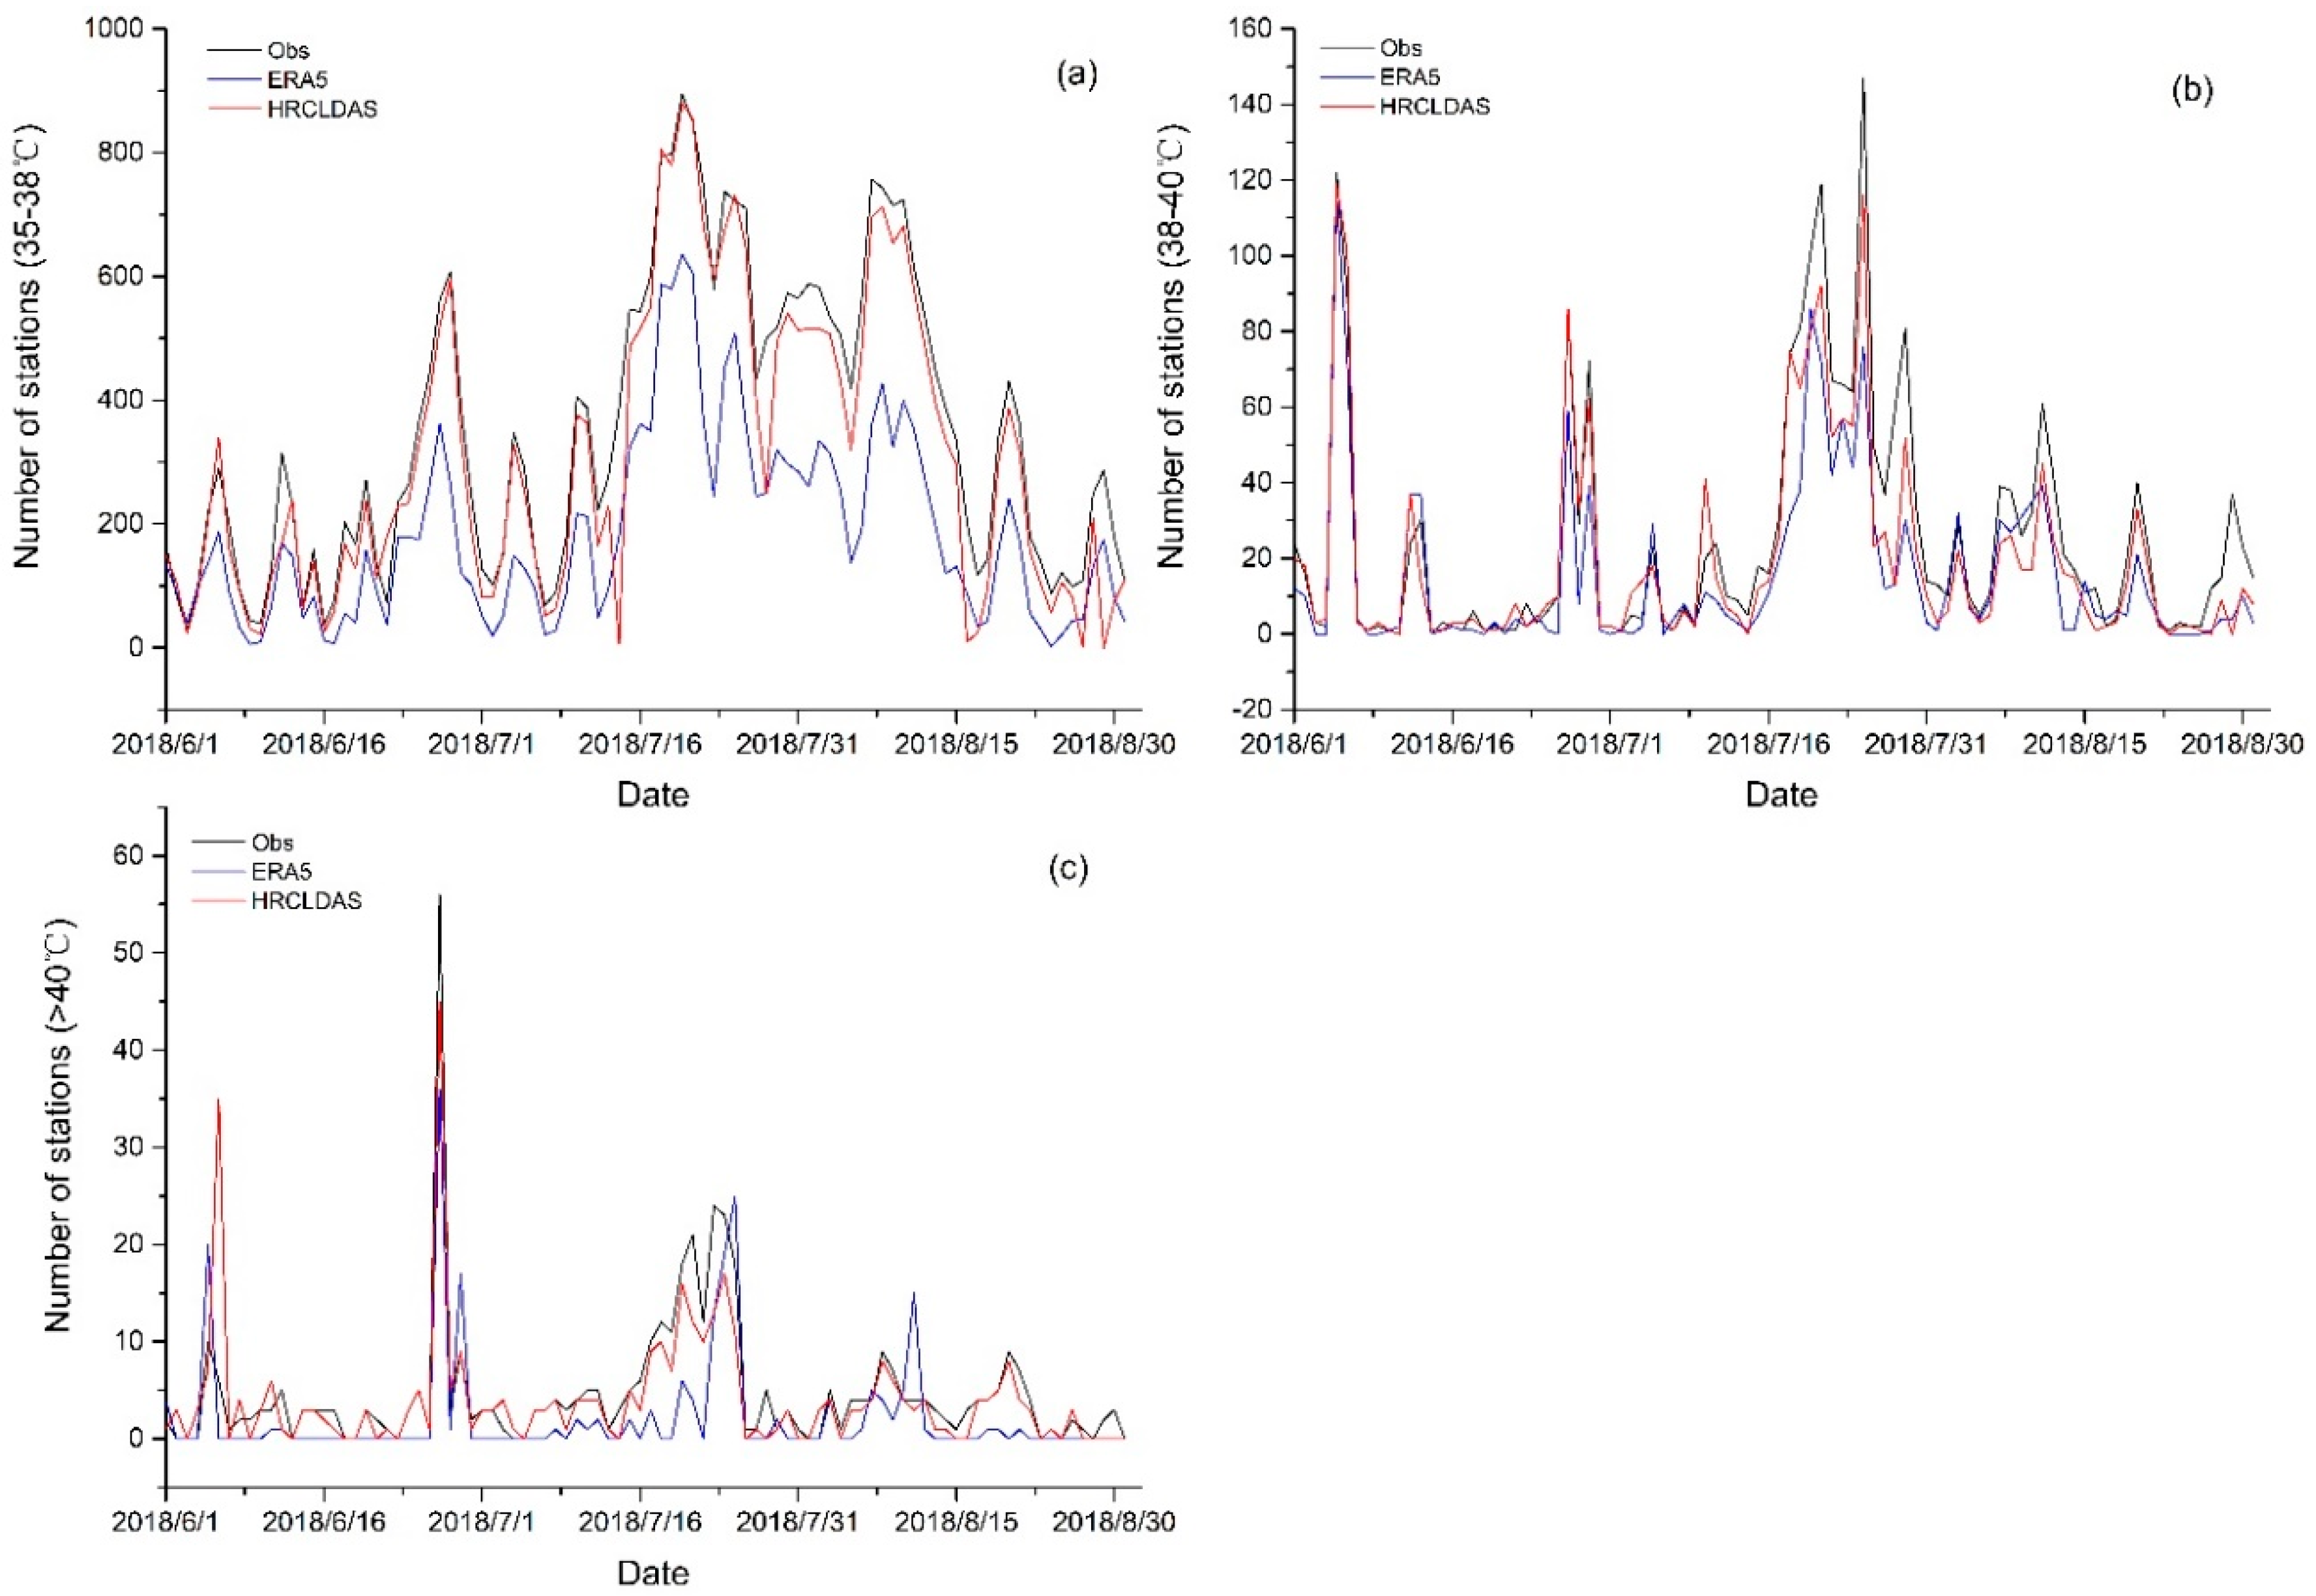
3.1.5. Evaluation of High Temperature

Against the background of climate change, extreme high temperature events occur frequently. The applicability of gridded datasets to extreme high temperatures is of great significance to the study of risk assessment. In order to further evaluate whether the two gridded datasets can monitor high temperature, the daily maximum temperatures from 1 June to 31 August in 2018 over major land areas of China are analyzed.
The distribution of high temperature days (daily maximum temperature above 35 °C) of station observations and two gridded datasets is shown in Figure 4. It can be seen from Figure 4a that the stations with more high temperature days are mainly distributed in the middle east and south of China, where the maximum number of high temperature days is more than 27 days. The distribution of high temperature days of HRCLDAS is close to that of the observations and HRCLDAS can generally describe areas where high temperature occurs frequently (Figure 4b). However, in the middle east and south of China, where high temperatures are frequent, only a few samples of ERA5 are close to the observations (Figure 4c). The frequency distribution of bias of high temperature days (Figure 4d) shows that there are 86.8% samples of HRCLDAS with bias ranging from −5 to 5 days, while there are only 55.6% samples of ERA5 with bias ranging from −5 to 5 days, and the bias of ERA5 is negative in most samples. As the gridded datasets are relatively smooth compared to the observations, the gridded datasets have a certain deviation in extreme high temperature, especially in areas with complex terrain.
The numbers of high temperature stations from 1 June to 31 August in 2018 are also compared between the two gridded datasets and observations. According to the statistics of samples with daily maximum temperatures in the range of 35–38 °C (Figure 5a), it is found that the number of samples of HRCLDAS is consistent with the observations in the whole period, while the number of samples of ERA5 is systematically low. For the samples with daily maximum temperatures above 38 °C (Figure 5b,c), it is found that the results of HRCLDAS and ERA5 are relatively close due to the relatively small number of samples. However, taking the results of samples with daily maximum temperatures above 40 °C as an example, for the high temperature process from 16 July to 26 July, HRCLDAS has more samples that can accurately reflect this high temperature process, while ERA5 has fewer samples, which suggests that HRCLDAS is well indicative of high temperature process.
In general, HRCLDAS can well illustrate the distribution and magnitude of high temperature and is able to monitor the high temperature weather, while ERA5 performs worse than HRCLDAS and the ability to monitor high temperature needs to be improved.

3.2. Evaluation of Precipitation

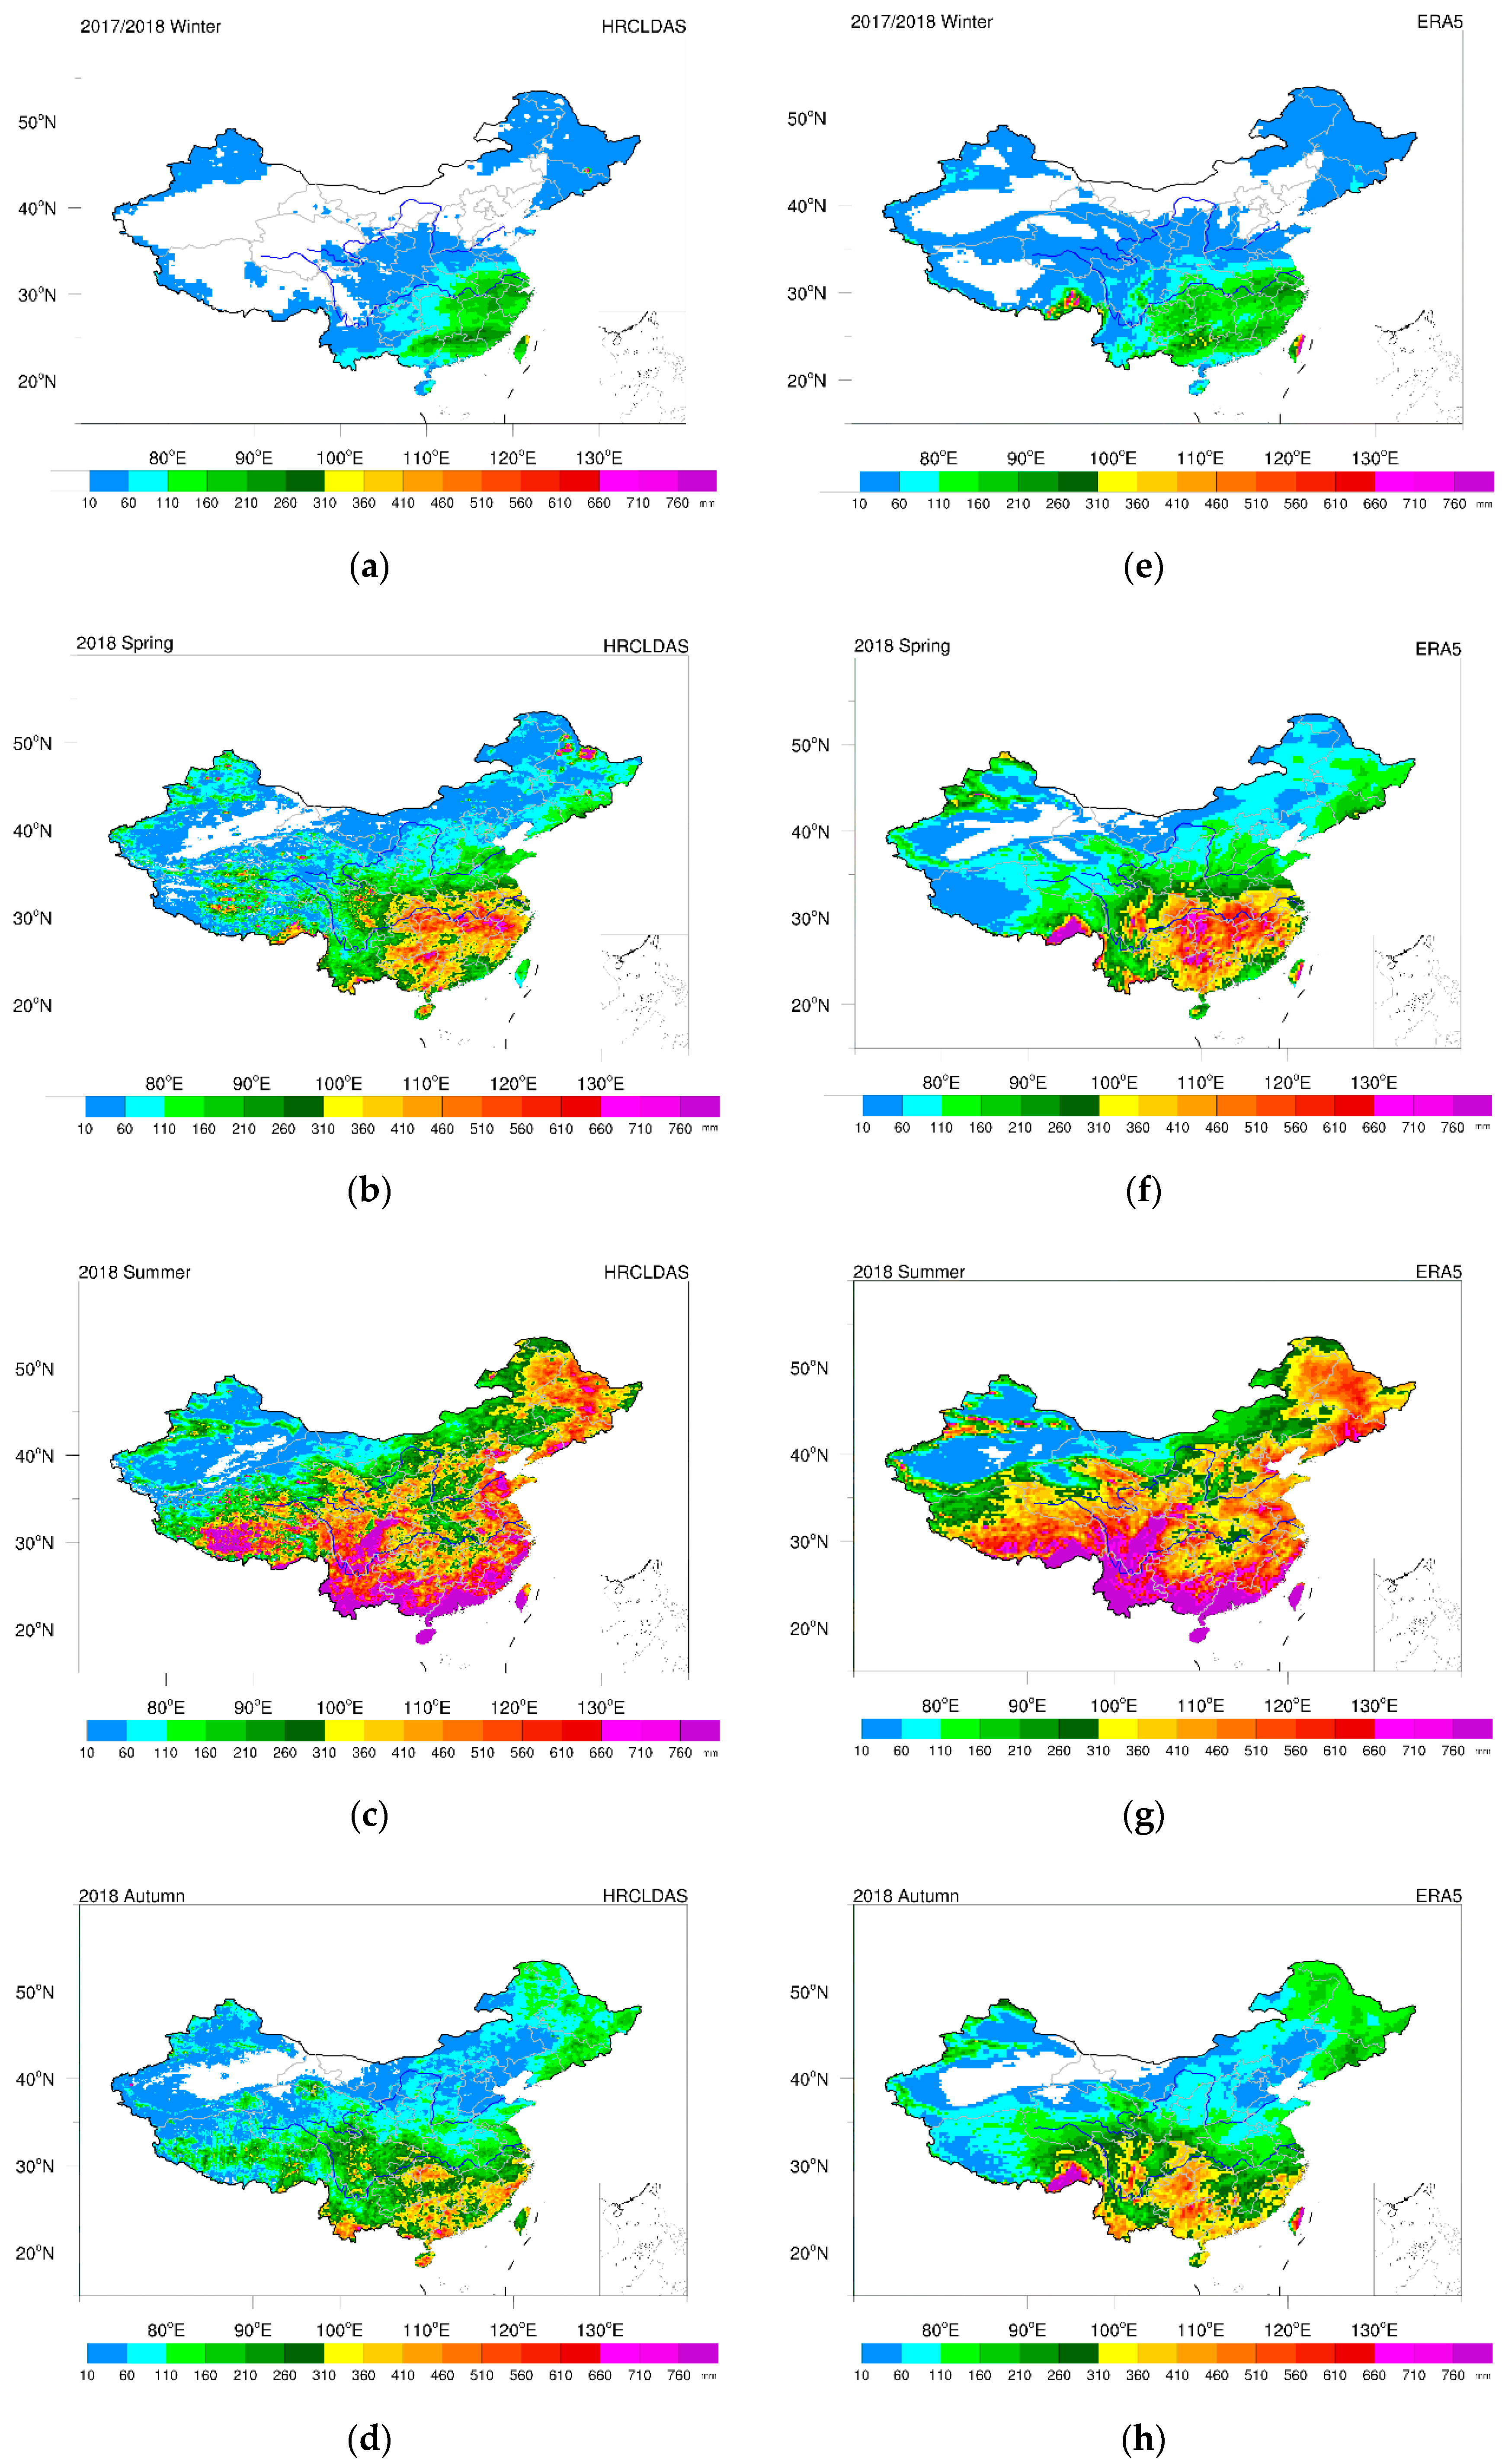
3.2.1. Spatial–Temporal Distribution of Precipitation

The accumulated precipitation in winter 2017/2018, spring 2018, summer 2018 and autumn 2018 is displayed in Figure 6. As shown in the figure, the accumulated precipitation of HRCLDAS and ERA5 reflects the same seasonal distribution of precipitation in China, with more precipitation in summer and less precipitation in winter. In the same season, the spatial distribution of precipitation of both HRCLDAS and ERA5 is reasonable, with more precipitation in the southeast and less precipitation in the northwest. The precipitation area is the same in general but different in some areas. In winter, the precipitation area of ERA5 is larger than that of HRCLDAS in the Tibetan Plateau. The description of precipitation of HRCLDAS is more precise than that of ERA5, especially in the Tibetan Plateau, with high altitude and complex topography.

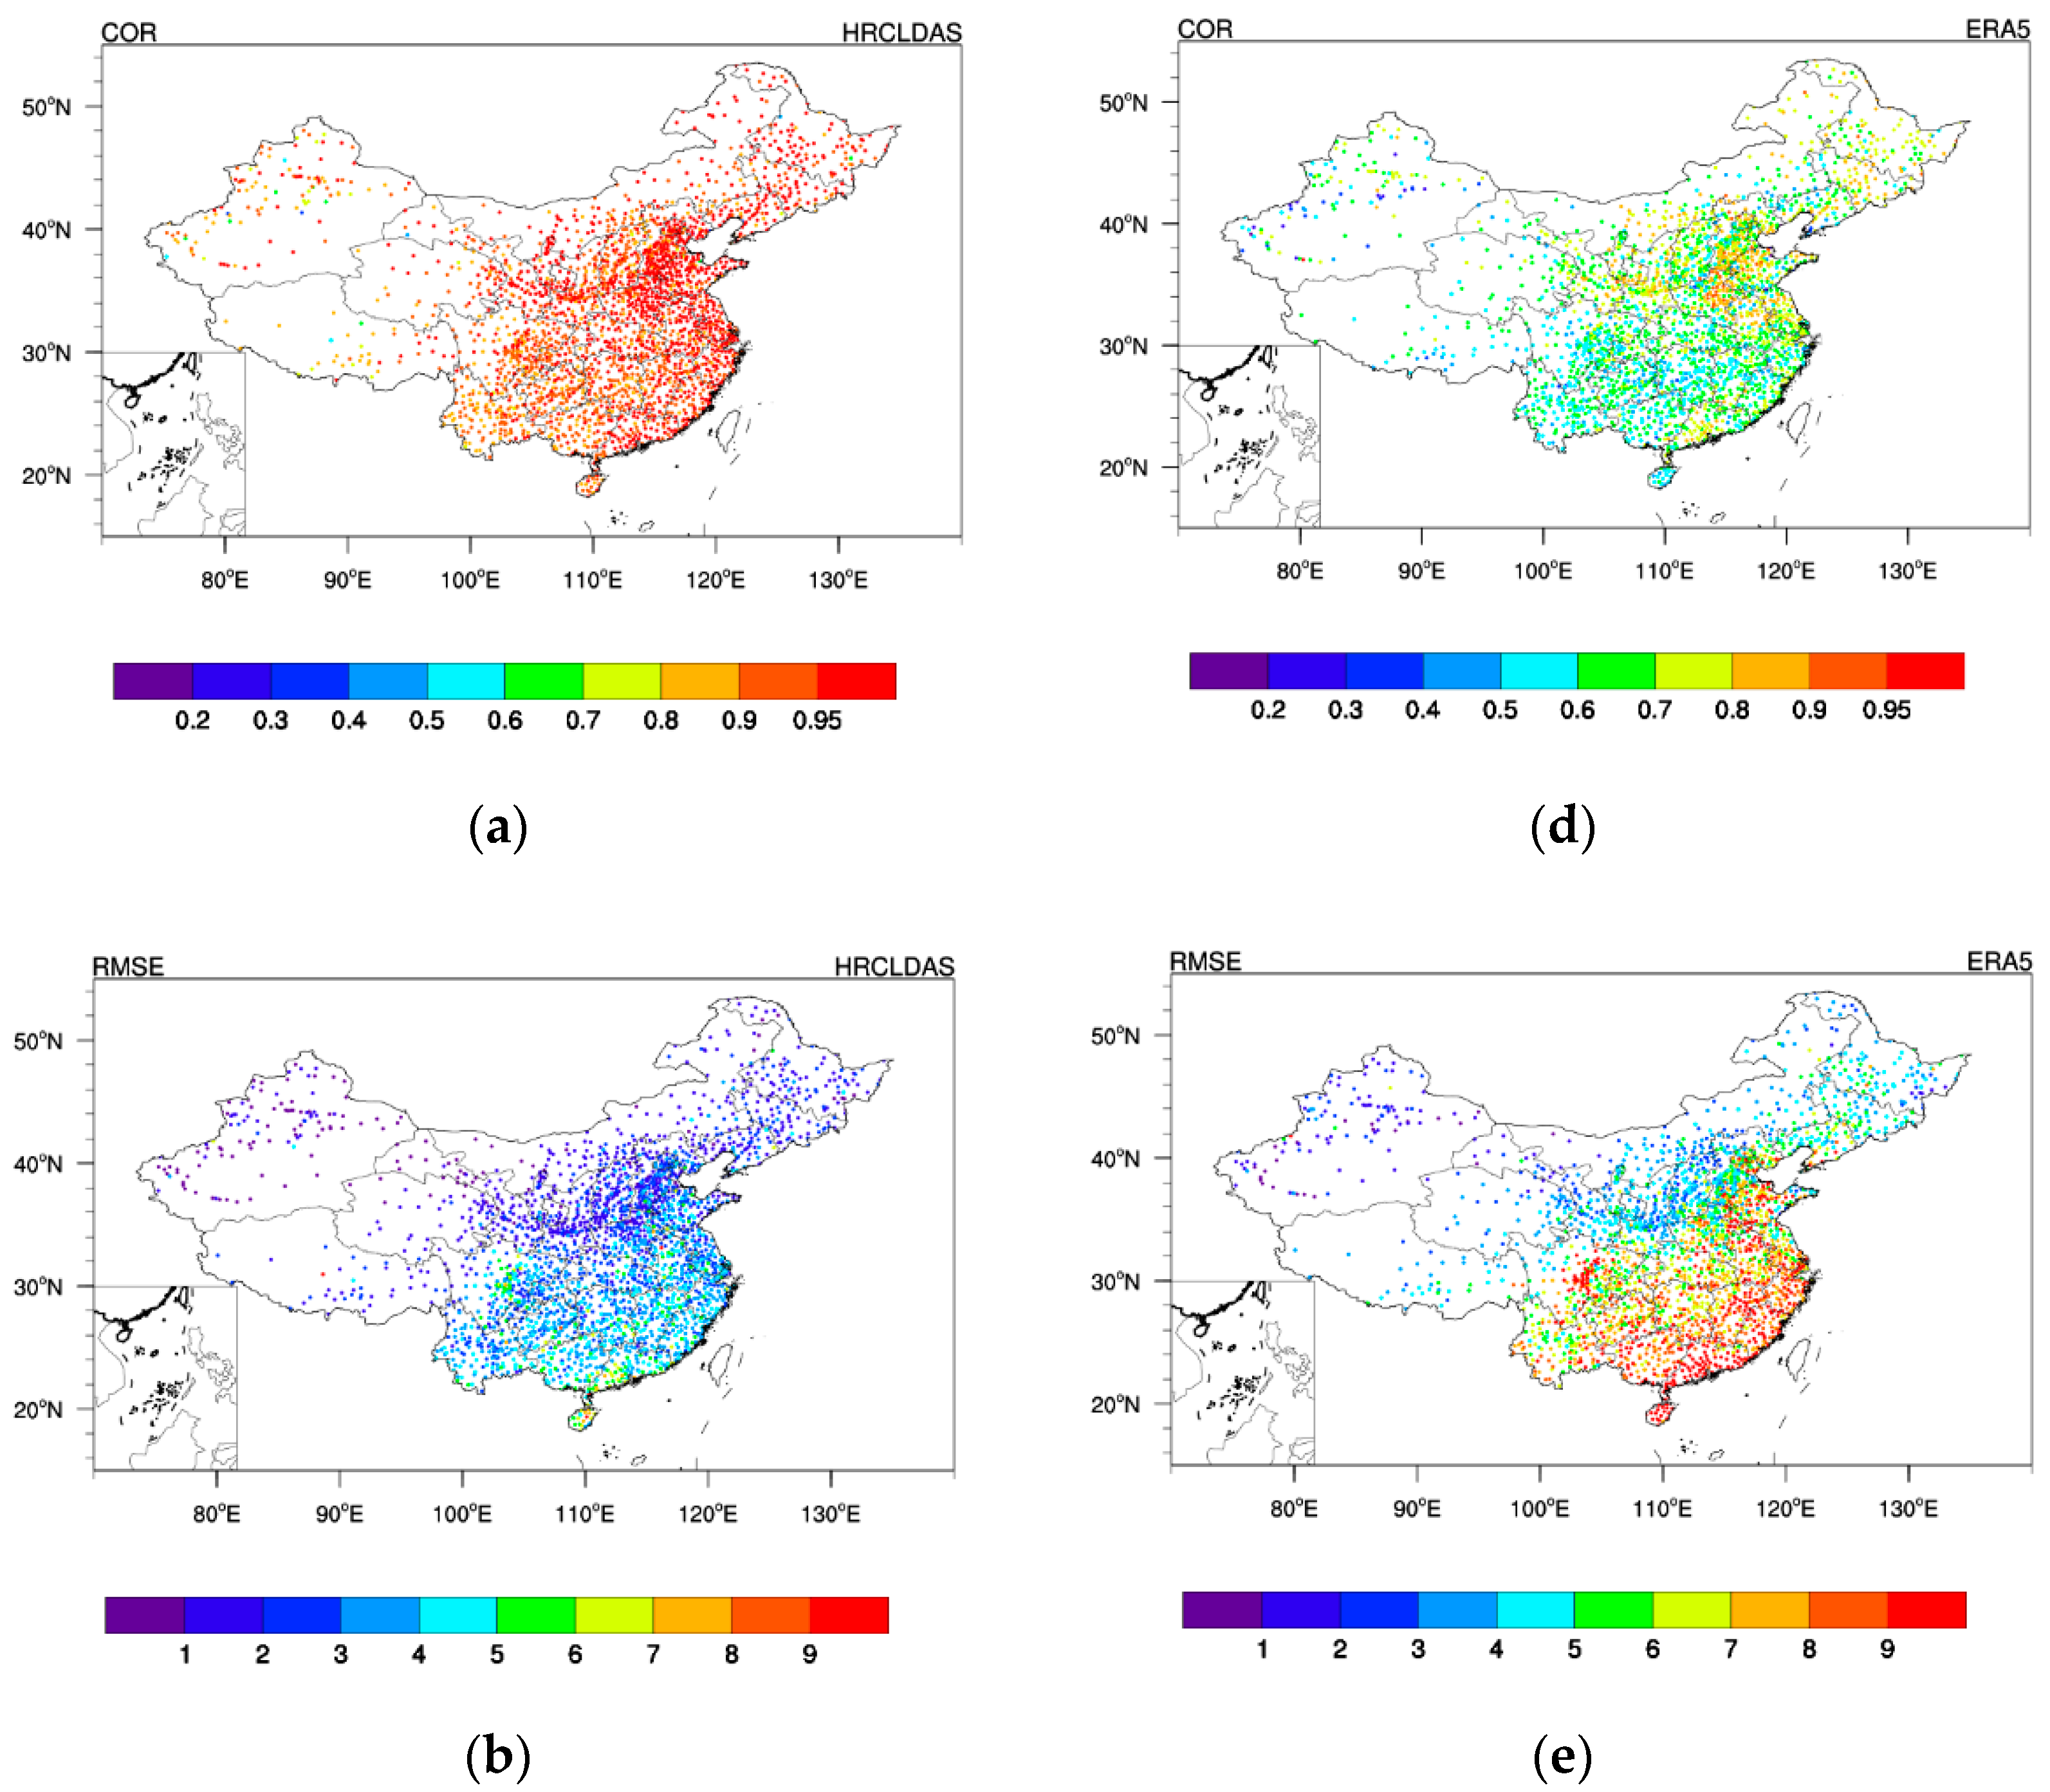
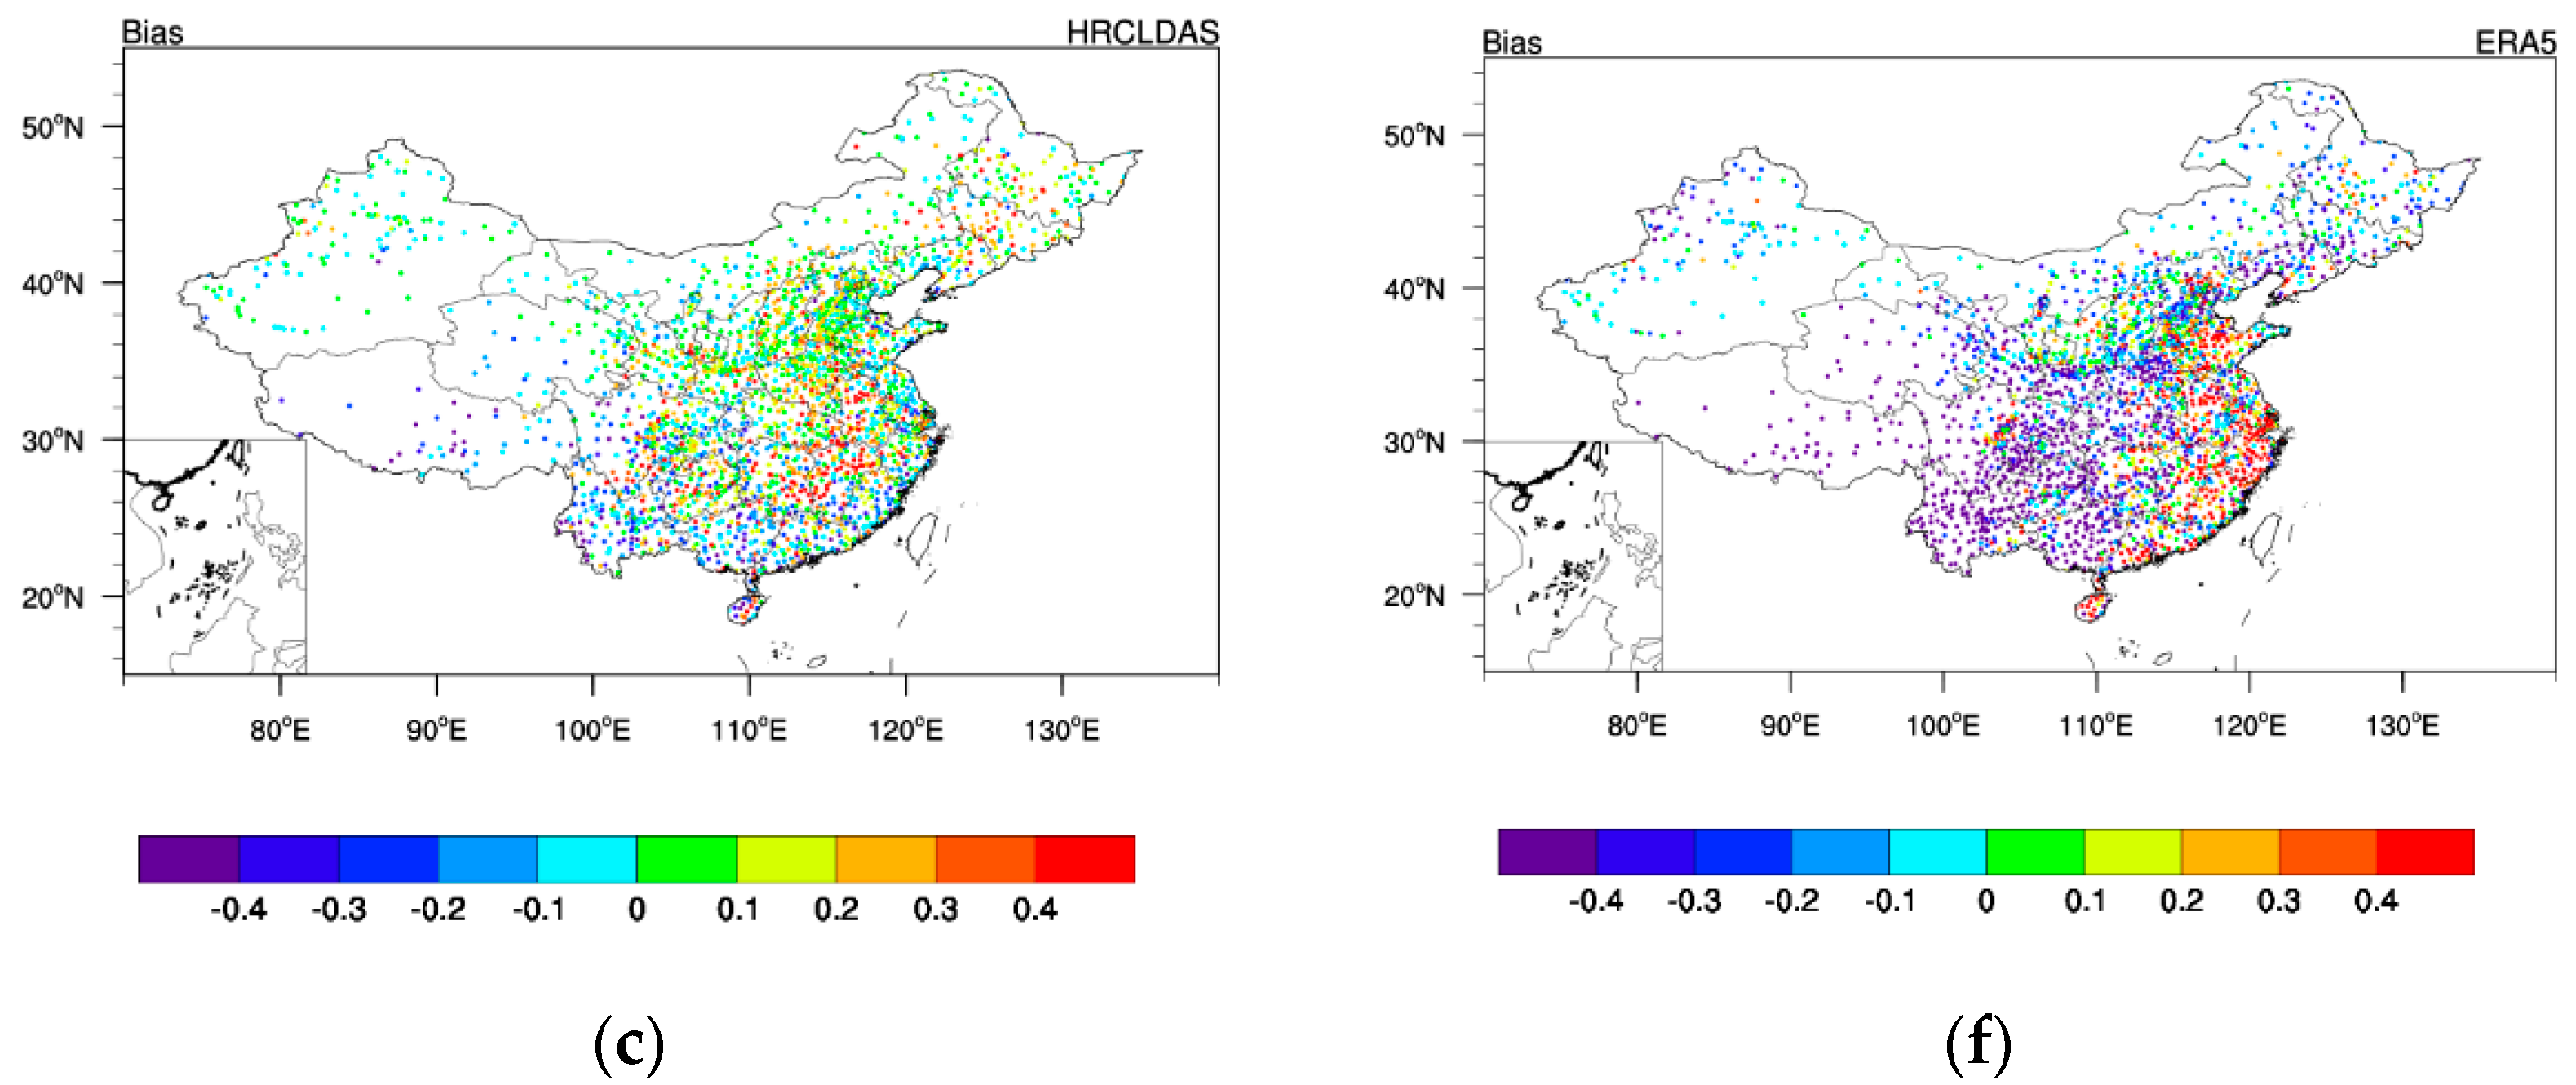
3.2.2. Evaluation of Precipitation on Each Station

The spatial distribution of COR, RMSE and bias between the precipitation of HRCLDAS and ERA5 and the observed precipitation at local station in China is displayed in Figure 7. From the comparison of Figure 7a,d, it is shown that the COR of HRCLDAS is significantly higher than that of ERA5 in the major land areas of China. There are 98.1% of cases between the HRCLDAS interpolated data and observations which have a COR higher than 0.80, while the corresponding percentage between ERA5 interpolated data and observations is 11.7%, and there are 80.4% of cases between the ERA5 interpolated data and observations which have a COR ranging from 0.50 to 0.80.
From the comparison of Figure 7b,e, it is found that the RMSE of HRCLDAS and ERA5 is higher in the south and lower in the north, and the RMSE of HRCLDAS is lower than that of ERA5 over major land areas of China. There are 81.3% of cases between the HRCLDAS interpolated data and observations which have an RMSE lower than 4 mm, while the corresponding percentage between ERA5 interpolated data and observations is 26.4%, and there are 67.7% of cases between the ERA5 interpolated data and observations which have an RMSE ranging from 5 to 9 mm. The RMSE of ERA5 is higher than 9 mm in the southeast coastal areas.
As shown in Figure 7c,f, the bias of HRCLDAS is lower than that of ERA5. There are 70.7% of cases between the HRCLDAS interpolated data and observations which have bias ranging from −0.2 to 0.2 mm, while the corresponding percentage between ERA5 interpolated data and observations is 51.7%. The bias of ERA5 is lower than −0.4 mm in the southwest of China, which indicates that the precipitation of ERA5 is greater than the observations and ERA5 could not accurately describe the precipitation in this region with high altitude and complex terrain.

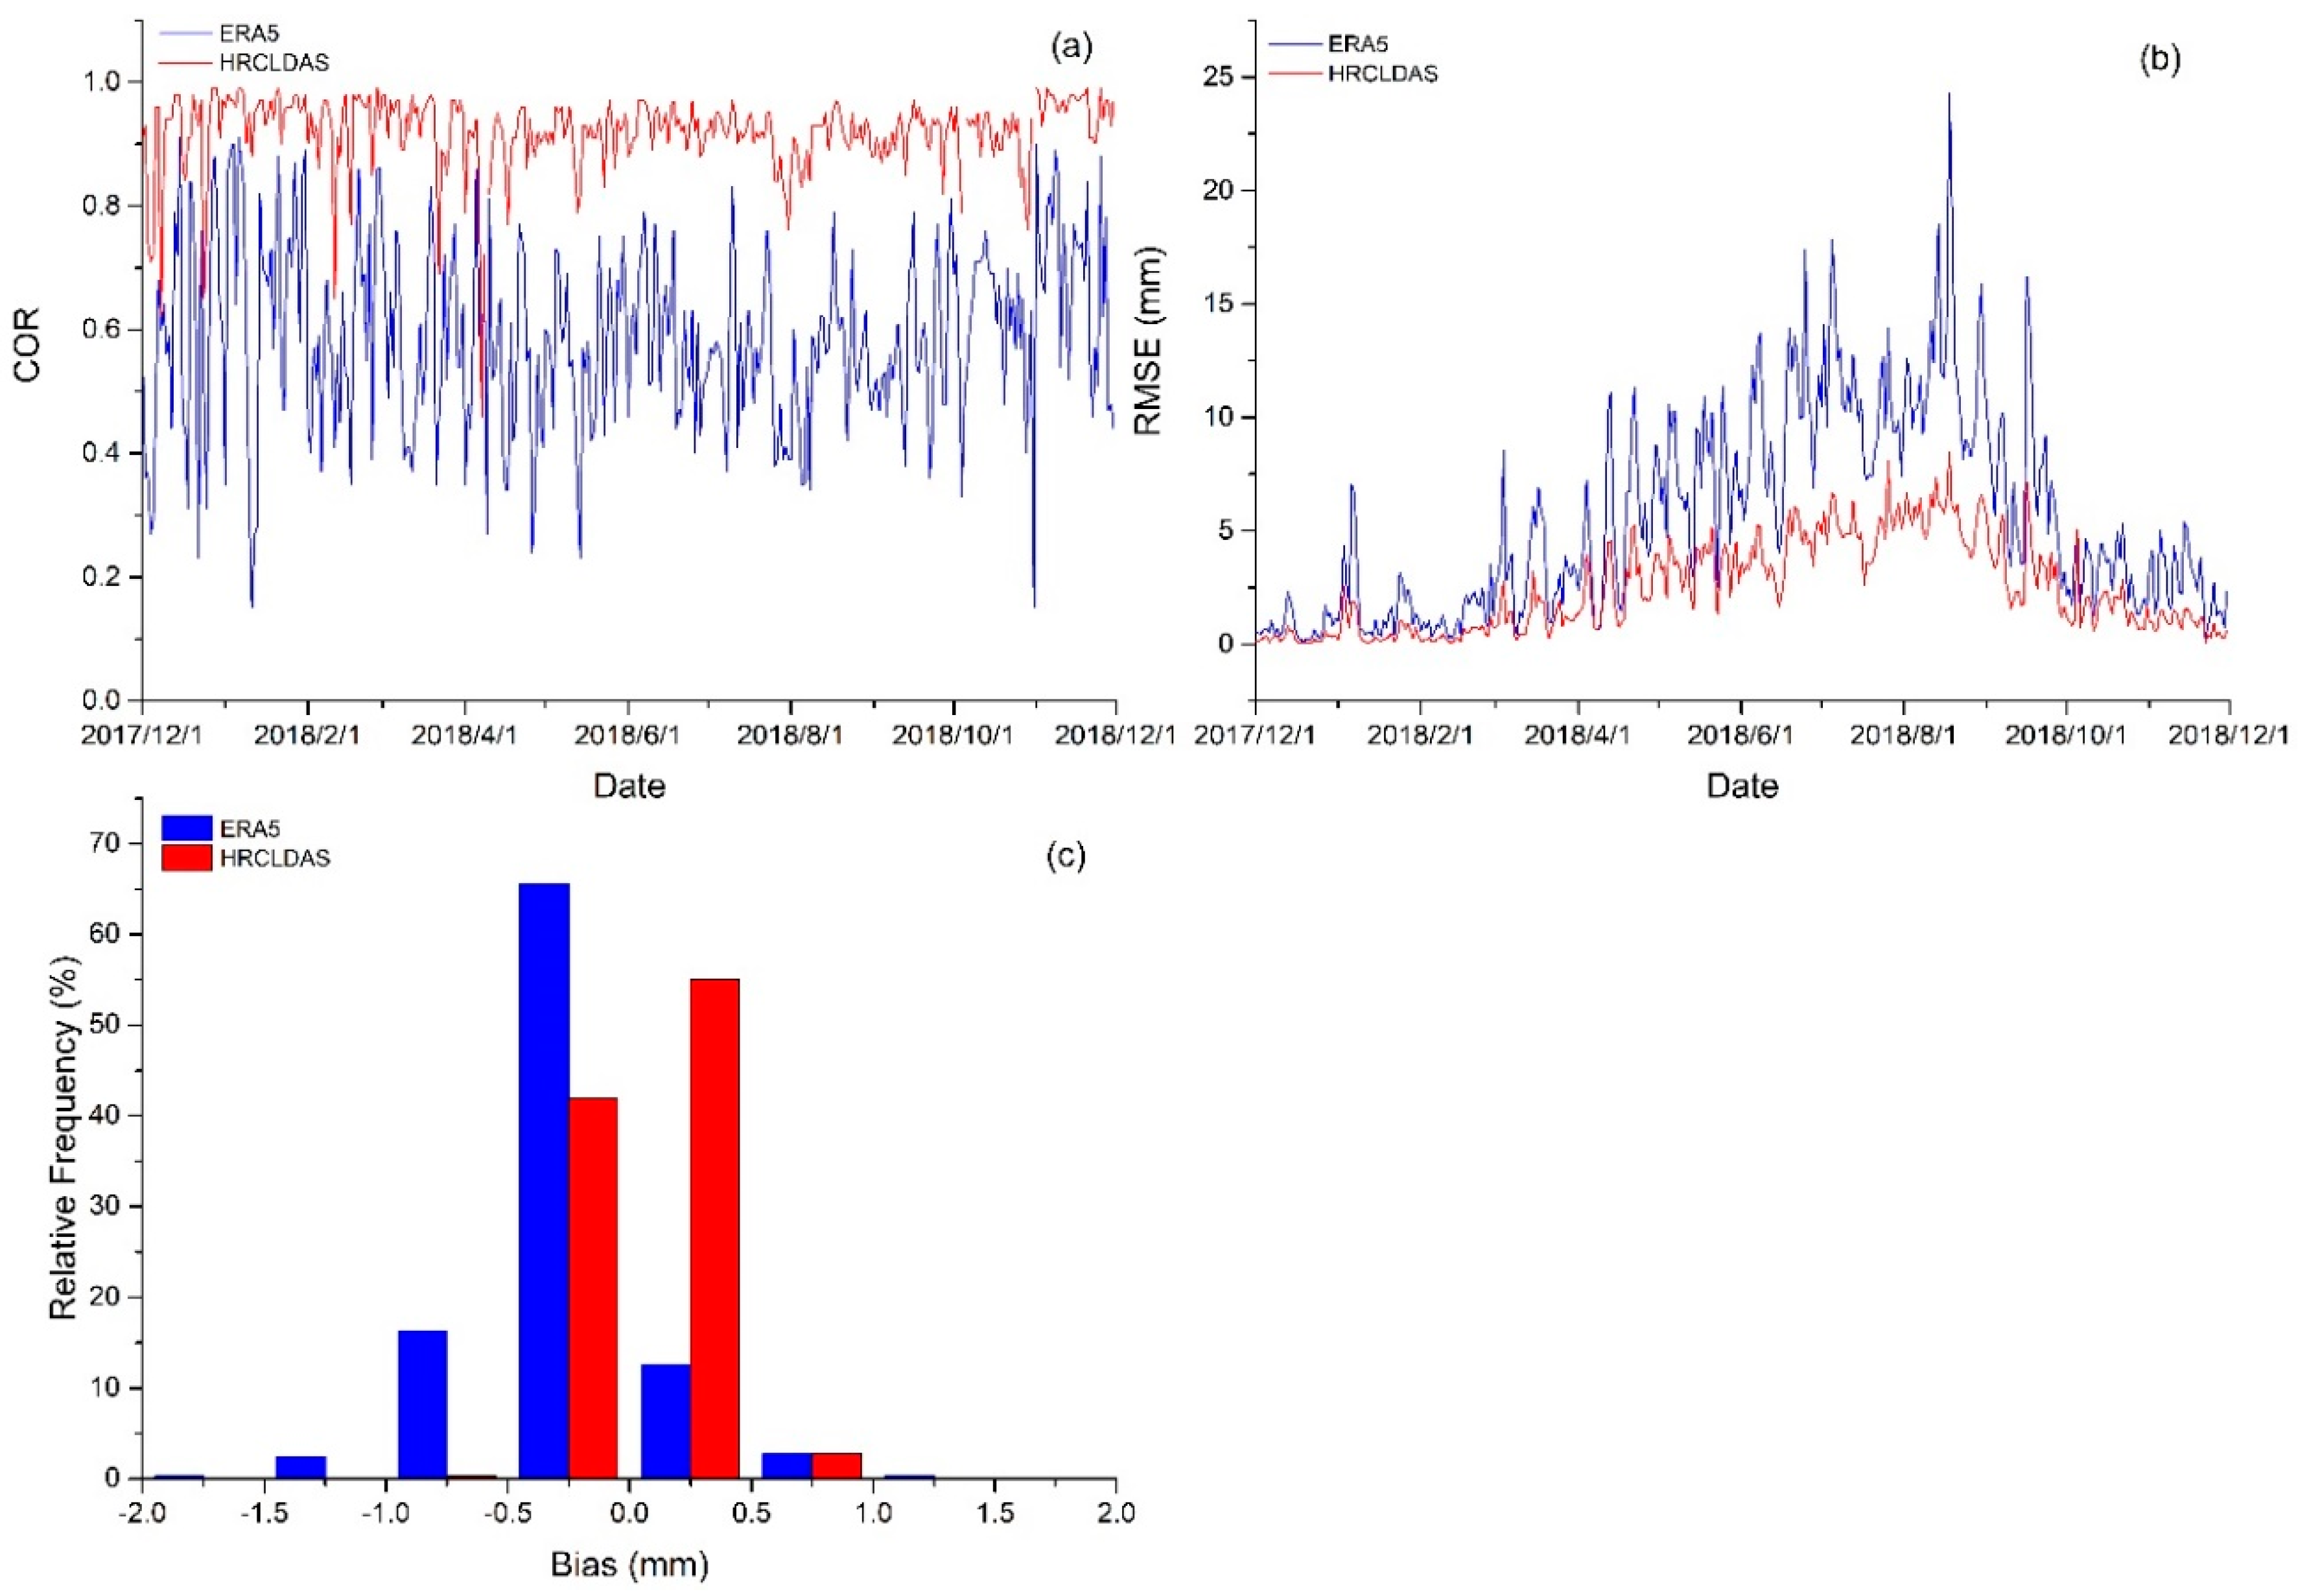
3.2.3. Evaluation of Precipitation in Time Series

The time series of daily COR of HRCLDAS and ERA5 from 1 December 2017 to 30 November 2018 averaged over major land areas of China are shown in Figure 8a. The COR of HRCLDAS is largely within the range of 0.70 to 0.99 and the mean COR is 0.92, while the COR of ERA5 is mainly distributed from 0.30 to 0.90 and the mean COR is 0.59. The COR of HRCLDAS is higher and more stable than that of ERA5 throughout the year.
The time series of daily RMSE of HRCLDAS and ERA5 are shown in Figure 8b. The RMSE of HRCLDAS is mainly within the range of 0.1 to 7.5 mm and the mean RMSE is 2.4 mm, while the RMSE of ERA5 is mainly distributed from 0.2 to 15.0 mm and the RMSE is 5.4 mm. The RMSE of HRCLDAS is basically lower than that of ERA5 throughout the year, especially in the summer, with heavy rainfall.
The frequency distribution of bias of HRCLDAS and ERA5 is displayed in Figure 8c. It is found that, among 365 days, there are 97.0% days of HRCLDAS with bias ranging from −0.5 to 0.5 mm, while there are only 78.1% days of ERA5 with bias ranging from −0.5 to 0.5 mm.

3.2.4. Evaluation of Precipitation at Different Altitudes

The COR, RMSE and bias of precipitation of HRCLDAS and ERA5 at different altitudes are displayed in Table 3. With the increase in altitude, the COR of HRCLDAS and ERA5 decrease from 0.94 to 0.85 and from 0.66 to 0.57, respectively. The COR of HRCLDAS is significantly higher than that of ERA5, and the RMSE of HRCLDAS is obviously lower than that of ERA5 at each altitude. The bias of ERA5 decreases from −0.16 to −0.90 mm with the increase in altitude, which indicates that the precipitation of ERA5 is larger than the observed precipitation, reflecting that ERA5 could not accurately describe the precipitation in high-altitude areas. Overall, the precipitation evaluation results of HRCLDAS and ERA5 become worse with the increase in altitude, but HRCLDAS performs better than ERA5 at each altitude.

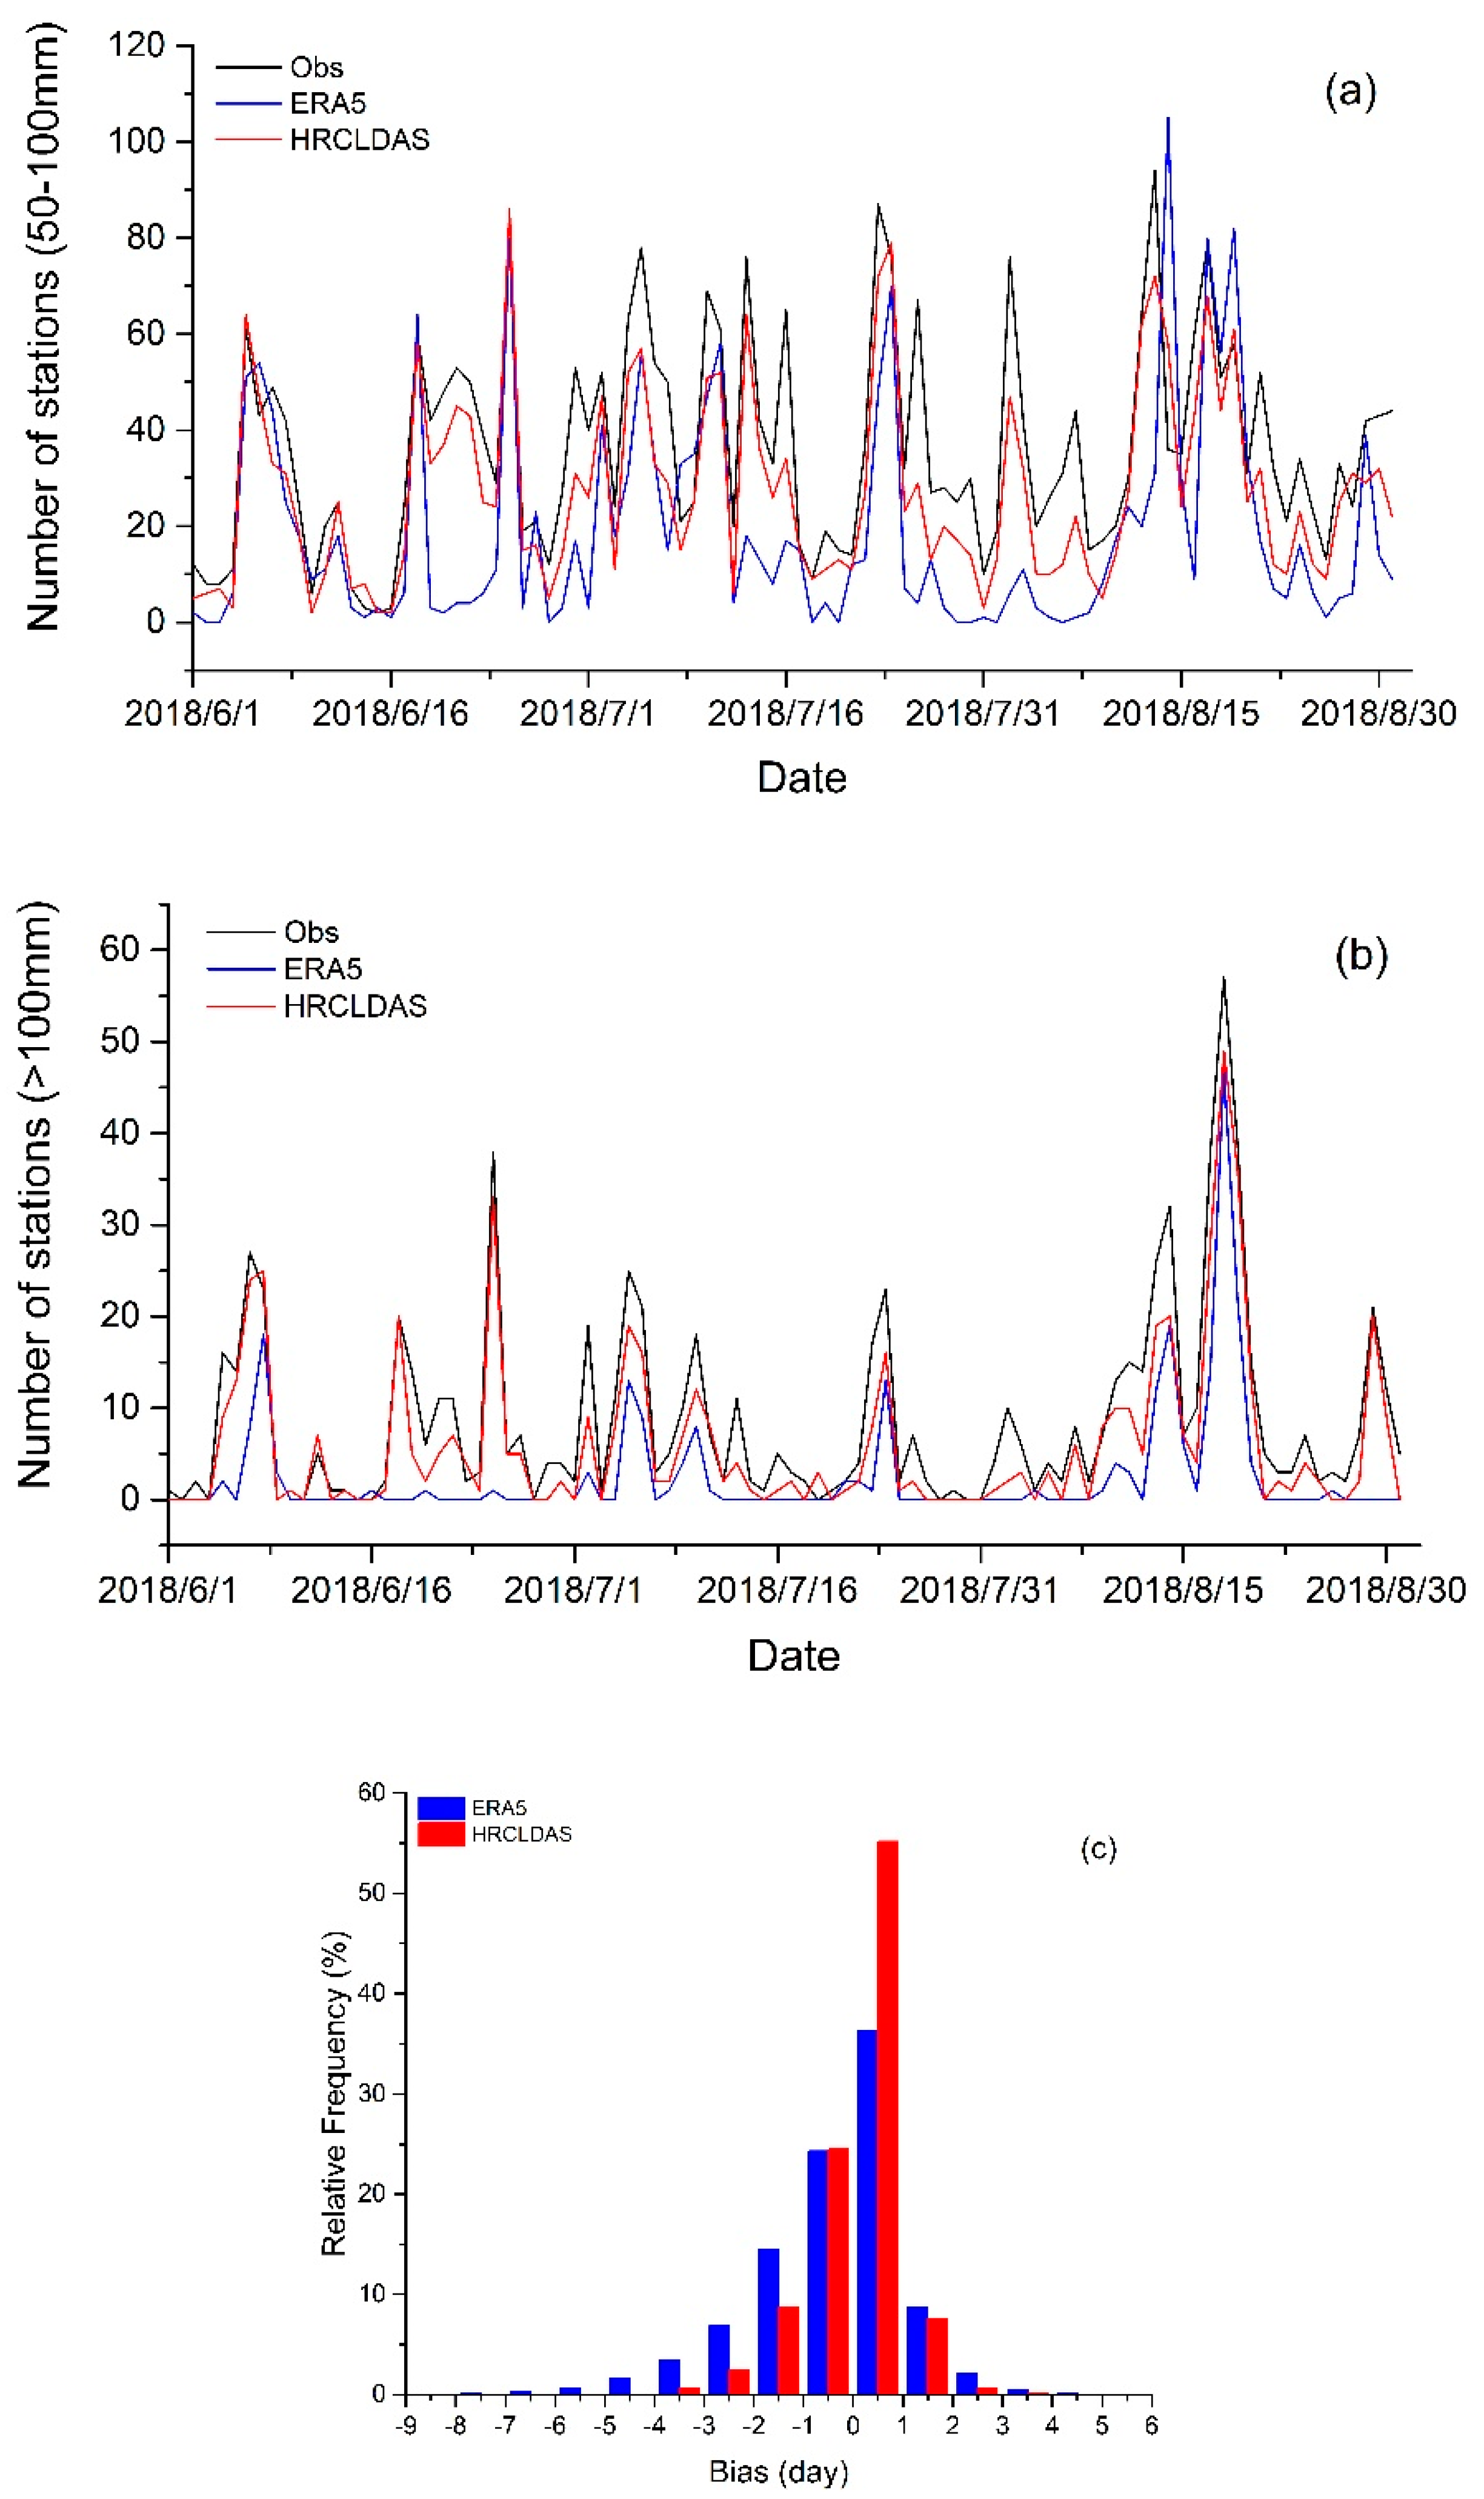
3.2.5. Evaluation of Rainstorm

In order to further evaluate whether the gridded datasets can monitor extreme precipitation, the number of rainstorm stations over major land areas of China from 1 June to 31 August in 2018 is also compared between the two gridded datasets and observations. Generally speaking, the two gridded precipitation datasets can capture the rainstorm (daily precipitation ranged from 50 to 100 mm) process in summer (Figure 9a). HRCLDAS and ERA5 can accurately capture the two rainstorm processes on 24 July and 15 August, and the magnitude and trend of number of rainstorm stations are consistent with the observations. However, the number of rainstorm samples of HRCLDAS is closer to observations than that of ERA5. Figure 9b shows the number of heavy rainstorm stations (daily precipitation greater than 100 mm) from June to August. The result indicates that the number of heavy rainstorm samples of HRCLDAS and ERA5 is lower than that of observations. HRCLDAS has better monitoring of several heavy rainstorm processes, and the number of heavy rainstorm stations is closer to the observations, while ERA5 has poor monitoring ability for heavy rainstorms, especially during the period from June 16 to July 1. The frequency distribution of bias of rainstorm days (Figure 9c) shows that there are 79.7% of cases between the HRCLDAS interpolated data and observations which have bias ranging from −1 to 1 days, while the corresponding percentage between ERA5 interpolated data and observations is only 60.6%, and the bias of ERA5 is negative in most stations.
In general, HRCLDAS and ERA5 can monitor rainstorms, but HRCLDAS is more accurate than ERA5 in monitoring rainstorms, especially heavy rainstorms, while ERA5 has poor ability to monitor heavy rainstorms.

4. Discussion

In order to accurately carry out regional quantitative agro-meteorological modeling research, it is necessary to evaluate the gridded forcing meteorological data of the model. In this study, air temperature and precipitation as two important input elements are evaluated from multiple spatial and temporal perspectives over major land areas of China. Based on the daily mean temperature, daily maximum temperature and precipitation data observed by more than 2400 national automatic weather stations, the quality of air temperature and precipitation of HRCLDAS and ERA5 from 1 December 2017 to 30 November 2018 is evaluated over major land areas of China. Spatial and temporal distributions of evaluation indices are comprehensively analyzed and the ability of HRCLDAS and ERA5 to monitor high temperatures and rainstorms is also evaluated.
In this study, the daily mean temperatures of HRCLDAS and ERA5 are basically consistent with the observations in spatial distribution and seasonal variation characteristics. HRCLDAS performs better than ERA5 at a local station scale, especially in the southwest of China, with complex terrain. Both the daily mean air temperature and daily maximum temperature of HRCLDAS are closer to observations than ERA5. The COR of mean air temperature is 0.98 for HRCLDAS and 0.94 for ERA5, and the RMSE of mean air temperature is 1.3 °C for HRCLDAS and 2.3 °C for ERA5. With the increase in altitude and the decrease in the number of stations participating in the evaluation, the accuracy of both HRCLDAS and ERA5 gradually decreases, but HRCLDAS performs better than ERA5 at high altitudes. It has been reported that the accuracy of other gridded meteorological forcing datasets, such as CLDAS and GLDAS, also decreases with the increase in altitude [13]. The possible reason is that in high-altitude areas, it becomes more difficult for gridded meteorological datasets to accurately reflect the true information due to various factors such as sparse station, high terrain, snow cover and complex underlying surface conditions.
Global warming is well known as a major factor that intensifies the hydrologic cycle [32]. Whether the gridded meteorological forcing datasets can accurately reflect high temperature is crucial to the study of global warming. In this study, the ability of HRCLDAS and ERA5 to monitor high temperature is also evaluated. The results show that HRCLDAS can well illustrate the distribution and magnitude of high temperature while ERA5 performs worse than HRCLDAS. HRCLDAS is able to monitor the high temperature weather, while the ability of ERA5 to monitor high temperature needs to be improved. Compared with the observations, the gridded forcing datasets are relatively smooth; thus, the gridded datasets have a certain deviation in extreme high temperature, especially in areas with complex terrain. In addition to the daily mean temperature and daily maximum temperature, the hourly air temperatures of HRCLDAS and ERA5 have also been evaluated in another study and the results show that the hourly air temperature of HRCLDAS is also more accurate than that of ERA5 over major land areas of China [20].
Accurate estimates of precipitation are essential for climate change research; meanwhile, precipitation is the key meteorological forcing input for studies using land process models, including crop simulation, hydrologic modeling and dryland expansion estimation [33,34]. In this study, the precipitation of HRCLDAS and ERA5 is basically consistent with the observations in spatial distribution, seasonal variation characteristics and time series. Meanwhile, the precipitation of HRCLDAS is more accurate than that of ERA5, as the COR of precipitation is 0.92 for HRCLDAS and 0.59 for ERA5, and the RMSE of precipitation is 2.4 mm for HRCLDAS and 5.4 mm for ERA5. With the increase in altitude, the accuracy of both HRCLDAS and ERA5 gradually decreases, but HRCLDAS performs better than ERA5 at each altitude. The ability of HRCLDAS and ERA5 to monitor rainstorms is also evaluated, and the results indicate that HRCLDAS and ERA5 can monitor rainstorms, but HRCLDAS is more accurate than ERA5 in monitoring rainstorms, especially heavy rainstorms, while ERA5 has poor ability to monitor heavy rainstorms. The study of precipitation assessment in the middle and lower reaches of the Yangtze River indicates that CLDAS provides the most realistic estimates of spatiotemporal variability in precipitation in this region among four forcing datasets [17].
HRCLDAS and ERA5 represent the latest development of data assimilation and atmospheric reanalysis. The comprehensive evaluation and analysis of HRCLDAS and ERA5 will be helpful to the application and improvement of gridded meteorological forcing datasets. Overall, the air temperature and precipitation of HRCLDAS and ERA5 are basically consistent with the observations in spatial distribution, seasonal variation characteristics and time series, but the quality of HRCLDAS is better than that of ERA5 over major land areas of China. In particular, the capability of HRCLDAS in monitoring high temperature and rainstorms is better than that of ERA5. HRCLDAS has much higher spatial–temporal resolution than ERA5, and many local orographic and vegetation effects have been considered. In addition, the high-resolution numerical forecast products from the European Center for Medium Range Weather Forecast and the data collected from more than 30,000 automatic observation stations deployed by the China Meteorological Administration are used to develop HRCDLAS. Thus, HRCLDAS has high quality over major land areas of China and has a broad prospect in fine meteorological service and local scale forecast. Although the resolution of ERA5 is lower than that of HRCLDAS, ERA5 can basically capture the rainstorms and high temperature areas. ERA5 has longer historical datasets than HRCLDAS and it is of great significance in climate time scale and regional and global analysis. Previous studies have shown that mountain regions with complex orography are a particular challenge for regional climate simulations [35]. Although the spatial and temporal ranges of HRCLDAS and ERA5 are different, the quality of the two gridded forcing datasets in high-altitude areas needs to be improved. In addition, this study only evaluated the gridded meteorological forcing datasets for one year, and the inter-annual variation of gridded forcing datasets and the application of climatic conditions will be further analyzed in the future.

5. Conclusions

Gridded forcing meteorological datasets play an important role in drought monitoring, agro-meteorological modeling and water resource management. In this study, the air temperature and precipitation of HRCLDAS and ERA5 are basically consistent with the observations in spatial distribution and seasonal variation characteristics. However, the daily mean temperature, the daily maximum temperature and the precipitation of HRCLDAS are more accurate than those of ERA5 over major land areas of China on different time and space scales. Especially, HRCLDAS is able to monitor the high temperature weather and rainstorms, while the ability of ERA5 in this respect needs to be improved. Therefore, HRCLDAS can play an important role in fine agro-meteorological modeling, and ERA5 can be used to study climate state and global scale research due to its long historical datasets. The results can help researchers to choose gridded forcing datasets reasonably according to the research needs.

Author Contributions

Q.W. evaluated the datasets and wrote the paper; W.L. and C.X. revised the manuscript; W.A. contributed materials. All authors have read and agreed to the published version of the manuscript.

Funding

This research was funded by the National Key Research and Development Project (No. 2017YFC1502402), the National Key Research and Development Project (No. 2018YFE0196000), the Consulting research project of Chinese Academy of Engineering (No. 2019-XZ-33), and the Laboratory of Climate Studies Open Funds for Young Scholars of China Meteorological Administration in 2020.

Conflicts of Interest

The authors declare no conflict of interest.

References

  1. Godfray, H.C.J.; Beddington, J.R.; Crute, I.R.; Haddad, L.; Lawrence, D.M.; Muir, J.F.; Pretty, J.; Robinson, S.; Thomas, S.M.; Toulmin, C. Food Security: The Challenge of Feeding 9 Billion People. Science 2010, 327, 812–818. [Google Scholar] [CrossRef] [Green Version]
  2. Ma, Y.; Feng, S.; Song, X. Evaluation of optimal irrigation scheduling and groundwater recharge at representative sites in the North China Plain with SWAP model and field experiments. Comput. Electron. Agric. 2015, 116, 125–136. [Google Scholar] [CrossRef]
  3. Vo, C.J.; Green, P. Global Water Resources: Vulnerability from Climate Change and Population Growth. Science 2000, 289, 284–289. [Google Scholar]
  4. Papadopoulou, M.P.; Charchousi, D.; Spanoudaki, K.; Karali, A.; Varotsos, K.V.; Giannakopoulos, C.; Markou, M.; Loizidou, M. Agricultural Water Vulnerability under Climate Change in Cyprus. Atmosphere 2020, 11, 648. [Google Scholar] [CrossRef]
  5. Alexander, L.V.; Zhang, X.; Peterson, T.C.; Caesar, J.; Gleason, B.; Tank, A.M.G.K.; Haylock, M.; Collins, D.; Trewin, B.; Rahimzadeh, F.; et al. Global Observed Changes in Daily Climate Extremes of Temperature and Precipitation. J. Geophys. Res. Atmos. 2006, 111, D05109. [Google Scholar] [CrossRef] [Green Version]
  6. Diffenbaugh, N.S.; Singh, D.N.; Mankin, J.S.; Horton, D.E.; Swain, D.L.; Touma, D.; Charland, A.; Liu, Y.J.; Haugen, M.; Tsiang, M.; et al. Quantifying The Influence of Global Warming on Unprecedented Extreme Climate Events. Proc. Natl. Acad. Sci. USA 2017, 114, 4881–4886. [Google Scholar] [CrossRef] [PubMed] [Green Version]
  7. Easterling, D.R.; Evans, J.L.; Groisman, P.Y.; Karl, T.R.; Kunkel, K.E.; Ambenje, P. Observed Variability and Trends in Extreme Climate Events: A Brief Review. Bull. Am. Meteorol. Soc. 2000, 81, 417–425. [Google Scholar] [CrossRef] [Green Version]
  8. Kevin, E.T.; John, T.F.; Thodore, G.S. Attribution of Climate Extreme Events. Nat. Clim. Change 2015, 5, 725–730. [Google Scholar]
  9. Lassa, J.; Teng, P.; Caballero, A.M.; Shrestha, M.R. Emergency Food Reserve Policy and Practice under Disaster and Extreme Climate Events. Int. J. Disaster Risk Sci. 2019, 10, 1–13. [Google Scholar] [CrossRef] [Green Version]
  10. Solow, A.R. On Detecting Ecological Impacts of Extreme Climate Events and Why It Matters. Philos. Trans. R. Soc. B 2017, 372, 1723. [Google Scholar] [CrossRef]
  11. Tesselaar, M.; Botzen, W.J.W.; Aerts, J.C.J.H. Impacts of Climate Change and Remote Natural Catastrophes on EU Flood Insurance Markets: An Analysis of Soft and Hard Reinsurance Markets for Flood Coverage. Atmosphere 2020, 11, 146. [Google Scholar] [CrossRef] [Green Version]
  12. Jentsch, A.; Kreyling, J.; Beierkuhnlein, C. A new generation of climate-change experiments: Events, not trends. Front. Ecol. Environ. 2007, 5, 365–374. [Google Scholar] [CrossRef]
  13. Han, S.; Liu, B.C.; Shi, C.X.; Liu, Y.; Qiu, M.J.; Sun, S. Evaluation of CLDAS and GLDAS datasets for Near-surface Air Temperature over major land areas of China. Sustainability 2020, 12, 4311. [Google Scholar] [CrossRef]
  14. Abbas, S.A.; Xuan, Y.Q. Impact of Precipitation Pre-Processing Methods on Hydrological Model Performance using High-Resolution Gridded Dataset. Water 2020, 12, 840. [Google Scholar] [CrossRef] [Green Version]
  15. Boegh, E.; Thorsen, M.; Butts, M.B.; Hansen, S.; Christiansen, J.S.; Abrahamsen, P.; Hasager, C.B.; Jensen, N.O.; van der Keur, P.; Refsgaard, J.C.; et al. Incorporating remote sensing data in physically based distributed agro-hydrological modelling. J. Hydrol. 2004, 287, 279–299. [Google Scholar] [CrossRef]
  16. Maurer, E.P.; Wood, A.W.; Adam, J.C.; Lettenmaier, D.P.; Nijssen, B. A long-term hydrologically-based data set of land surface fluxes and states for the conterminous united states. J. Clim. 2002, 15, 3237–3251. [Google Scholar] [CrossRef] [Green Version]
  17. Yang, F.; Lu, H.; Yang, K.; He, J.; Wang, W.; Wright, J.S.; Li, C.W.; Han, M.L.; Li, Y.S. Evaluation of multiple forcing data sets for precipitation and shortwave radiation over major land areas of China. Hydrol. Earth Syst. Sci. 2017, 21, 5805–5821. [Google Scholar] [CrossRef] [Green Version]
  18. Duan, Z.; Bastiaanssen, W.G.M.; Liu, J.Z. Monthly and annual validation of TRMM Mulitisatellite Precipitation Analysis (TMPA) products in the Caspian Sea Region for the period 1999–2003. In Proceedings of the International Geoscience and Remote Sensing Symposium (IGARSS), Munich, Germany, 22–27 July 2012; Volume 2, pp. 3696–3699. [Google Scholar] [CrossRef]
  19. Liu, Z. Comparison of versions 6 and 7 3-hourly TRMM multi-satellite precipitation analysis (TMPA) research products. Atmos. Res. 2015, 163, 91–101. [Google Scholar] [CrossRef] [Green Version]
  20. Han, S.; Shi, C.X.; Xu, B.; Sun, S.; Zhang, T.; Jiang, L.P.; Liang, X. Development and Evaluation of Hourly and Kilometer Resolution Retrospective and RealTime Surface Meteorological Blended Forcing Dataset (SMBFD) in China. J. Meteorol. Res. 2019, 33, 1168–1181. [Google Scholar] [CrossRef]
  21. Xie, X.; He, J.H.; Qi, L. A review on applicability evaluation of four reanalysis datasets in China. J. Meteorol. Environ. 2011, 27, 58–65. [Google Scholar]
  22. Zhao, T.B.; Fu, C.B.; Ke, Z.J.; Guo, W.D. Global atmosphere reanalysis datasets: Current status and recent advances. Adv. Earth Sci. 2010, 25, 242–254. [Google Scholar] [CrossRef]
  23. Rodell, M.; Houser, P.R.; Jambor, U.; Gottschalck, J.; Mitchell, K.; Meng, C.J.; Arsenault, K.; Cosgrove, B.; Radakovich, J.; Bosilovich, M. The global land data assimilation system. Bull. Am. Meteorol. Soc. 2004, 85, 381–394. [Google Scholar] [CrossRef] [Green Version]
  24. Albergel, C.; Dorigo, W.; Balsamo, G.; Munoz-Sabater, J.; Rosnay, P.; Isaksen, L.; Brocca, L.; Jeu, R.; Wagner, W. Monitoring multi-decadal satellite earth observation of soil moisture products through land surface reanalyses. Remote Sens. Environ. 2013, 138, 77–89. [Google Scholar] [CrossRef]
  25. Shi, C.X.; Pan, Y.; Gu, J.X.; Xu, B.; Han, S.; Zhu, Z.; Zhang, L.; Sun, S.; Jiang, Z.W. A review of multi-source meteorological data fusion products. Acta Meteorol. Sin. 2019, 77, 774–783. [Google Scholar]
  26. Xia, Y.L.; Hao, Z.C.; Shi, C.X.; Li, Y.H.; Meng, J. Regional and global land data assimilation systems: Innovations, challenges, and prospects. J. Meteorol. Res. 2019, 33, 159–189. [Google Scholar] [CrossRef]
  27. Thépaut, J.N.; Dee, D.P.; Engelen, R.; Pinty, B. The Copernicus programme and its climate change service. In Proceedings of the International Geoscience and Remote Sensing Symposium, Valencia, Spain, 22–27 July 2018; pp. 1591–1593. [Google Scholar]
  28. Stamnes, K.; Tsay, S.C.; Wiscombe, W.; Jayaweera, K. Numerically stable algorithm for discrete-ordinate-method radiative transfer in multiple scattering and emitting layered media. Appl. Opt. 1988, 27, 2502–2509. [Google Scholar] [CrossRef]
  29. Shi, C.X.; Xie, Z.H.; Qian, H.; Liang, M.L.; Yang, X.C. China land soil moisture EnKF data assimilation based on satellite remote sensing data. Sci. China Earth Sci. 2011, 54, 1430–1440. [Google Scholar] [CrossRef]
  30. Bonavita, M.; Hólm, E.V.; Isaksen, L.; Fisher, M. The evolution of the ECMWF hybrid data assimilation system. Q. J. R. Meteorol. Soc. 2016, 142, 287–303. [Google Scholar] [CrossRef]
  31. Isaksen, L.; Bonavita, M.; Buizza, R.; Fisher, M.; Haseler, J.; Leutbecher, M.; Raynaud, L. Ensemble of Data Assimilations at ECMWF. Available online: https://www.ecmwf.int/node/10125 (accessed on 16 September 2020).
  32. Kim, J.B.; So, J.M.; Bae, D.H. Global Warming Impacts on Severe Drought Characteristics in Asia Monsoon Region. Water 2020, 12, 1360. [Google Scholar] [CrossRef]
  33. Huang, J.P.; Yu, H.P.; Guan, X.D.; Wang, G.Y.; Guo, R.X. Accelerated dryland expansion under climate change. Nat. Clim. Change 2016, 6, 166–172. [Google Scholar] [CrossRef]
  34. Kang, L.T.; Huang, J.P.; Chen, S.Y.; Wang, X. Long-term trends of dust events over Tibetan Plateau during 1961–2010. Atmos. Environ. 2016, 125, 188–198. [Google Scholar] [CrossRef] [Green Version]
  35. Warscher, M.; Wagner, S.; Marke, T.; Laux, P.; Smiatek, G.; Strasser, U.; Kunstmann, H. A 5 km Resolution Regional Climate Simulation for Central Europe: Performance in High Mountain Areas and Seasonal, Regional and Elevation-Dependent Variations. Atmosphere 2019, 10, 682. [Google Scholar] [CrossRef] [Green Version]
Figure 1. Distribution of mean air temperature in four seasons. (ad) represent the spatial distribution of the mean air temperature of HRCLDAS in winter, spring, summer and autumn, respectively; (eh) represent the spatial distribution of the mean air temperature of ERA5 in winter, spring, summer and autumn, respectively; (i) geographical map.
Atmosphere 11 01011 g001aAtmosphere 11 01011 g001b
Figure 2. Spatial distribution of correlation coefficient (COR), root-mean-square error (RMSE) and bias between the daily mean air temperature of HRCLDAS and ERA5 and the observed daily mean air temperature. (ac) represent the spatial distribution of COR, RMSE and bias of HRCLDAS, respectively; (df) represent the spatial distribution of COR, RMSE and bias of ERA5, respectively.
Atmosphere 11 01011 g002
Figure 3. (a,d) Time series of COR for daily mean air temperature and daily maximum temperature, respectively; (b,e) time series of RMSE for daily mean air temperature and daily maximum temperature, respectively; (c,f) frequency distribution of bias for daily mean air temperature and daily maximum temperature, respectively.
Atmosphere 11 01011 g003
Figure 4. (a) Spatial distribution of high temperature (>35 °C) days from 1 June to 31 August in 2018 for observations; (b) spatial distribution of high temperature (>35 °C) days from 1 June to 31 August in 2018 for HRCLDAS; (c) spatial distribution of high temperature (>35 °C) days from 1 June to 31 August in 2018 for ERA5; (d) frequency distribution of bias of high temperature (>35 °C) days from 1 June to 31 August in 2018 for ERA5 and HRCLDAS.
Atmosphere 11 01011 g004
Figure 5. (a) Number of high temperature (35–38 °C) samples in summer 2018 for observations, ERA5 and HRCLDAS; (b) number of high temperature (38–40 °C) samples in summer 2018 for observations, ERA5 and HRCLDAS; (c) number of high temperature (>40 °C) samples in summer 2018 for observations, ERA5 and HRCLDAS.
Atmosphere 11 01011 g005
Figure 6. Distribution of accumulated precipitation in four seasons. (ad) represent the spatial distribution of the accumulated precipitation of HRCLDAS in winter, spring, summer and autumn, respectively; (eh) represent the spatial distribution of the accumulated precipitation of ERA5 in winter, spring, summer and autumn, respectively.
Atmosphere 11 01011 g006
Figure 7. Spatial distribution of COR, RMSE and bias between the precipitation of HRCLDAS and ERA5 and the observed precipitation. (ac) represent the spatial distribution of COR, RMSE and bias of HRCLDAS, respectively; (df) represent the spatial distribution of COR, RMSE and bias of ERA5, respectively.
Atmosphere 11 01011 g007aAtmosphere 11 01011 g007b
Figure 8. (a) Time series of COR; (b) time series of RMSE; (c) frequency distribution of bias.
Atmosphere 11 01011 g008
Figure 9. (a) Number of rainstorm (50–100 mm) stations in summer 2018 for observations, ERA5 and HRCLDAS; (b) number of heavy rainstorm (>100 mm) stations in summer 2018 for observations, ERA5 and HRCLDAS; (c) frequency distribution of bias of rainstorm days in summer 2018 for ERA5 and HRCLDAS.
Atmosphere 11 01011 g009
Table 1. Datasets information.
DatasetsNAWS 1 ObservationsHRCLDAS 2ERA5 3
Data typepointgridgrid
Spatial coverageover major land areas of China70–140° E; 15–60° Nglobal
Spatial resolutionmore than 2400 stations1 km31 km
Temporal coveragefrom 2008 to presentfrom 2015 to presentfrom 1979 to present
Temporal resolutiondailyhourlyhourly
Download lag1 day1 h5 days
1 NAWS: national automatic weather stations; 2 HRCLDAS, High-Resolution China Meteorological Administration Land Data Assimilation System; 3 ERA5, the fifth generation of atmospheric reanalysis produced by the European Centre for Medium-Range Weather Forecasts.
Table 2. The COR, RMSE and bias of daily mean temperature (Tmean) and daily maximum temperature (Tmax) of HRCLDAS and ERA5 at different altitudes.
Altitude (m)CORRMSE (°C)Bias (°C)
HRCLDASERA5HRCLDASERA5HRCLDASERA5
TmeanAlt ≤ 10000.980.981.611.66−0.060.05
1000 < Alt ≤ 20000.980.971.492.19−0.150.50
2000 < Alt ≤ 40000.980.951.794.630.033.15
Alt < 40000.930.922.794.910.613.43
TmaxAlt ≤ 10000.990.981.402.190.481.10
1000 < Alt ≤ 20000.990.961.532.880.581.83
2000 < Alt ≤ 40000.970.922.116.020.944.85
Alt < 40000.910.903.396.101.464.83
Table 3. The COR, RMSE and bias of precipitation of HRCLDAS and ERA5 at different altitudes.
Altitude (m)CORRMSE (mm)Bias (mm)
HRCLDASERA5HRCLDASERA5HRCLDASERA5
Alt ≤ 10000.940.663.036.940.06−0.16
1000 < Alt ≤ 20000.920.642.274.750.01−0.44
2000 < Alt ≤ 40000.910.610.074.39−0.06−0.75
Alt > 40000.850.572.293.76−0.3−0.9

