Article

Sensitivity of Simulated PM2.5 Concentrations over Northeast Asia to Different Secondary Organic Aerosol Modules during the KORUS-AQ Campaign

1
Institute of Environmental Studies, Pusan National University, Busan 46241, Korea
2
School of Urban and Environmental Engineering, Ulsan National Institute of Science and Technology, Ulsan 44919, Korea
3
Department of Atmospheric Sciences, Pusan National University, Busan 46241, Korea
*
Authors to whom correspondence should be addressed.
Atmosphere 2020, 11(9), 1004; https://doi.org/10.3390/atmos11091004
Submission received: 31 July 2020 / Revised: 13 September 2020 / Accepted: 17 September 2020 / Published: 20 September 2020
(This article belongs to the Special Issue Regional Air Quality Modeling)

Abstract

:
A numerical sensitivity study on secondary organic aerosol formation has been carried out by employing the WRF-Chem (Weather Research and Forecasting model coupled with Chemistry). Two secondary organic aerosol formation modules, the Modal Aerosol Dynamics model for Europe/Volatility Basis Set (MADE/VBS) and the Modal Aerosol Dynamics model for Europe/Secondary Organic Aerosol Model (MADE/SORGAM) were employed in the WRF-Chem model, and surface PM2.5 (particulate matter less than 2.5 μm in size) mass concentration and the composition of its relevant chemical sources, i.e., SO42−, NO3, NH4+, and organic carbon (OC) were simulated during the Korea-United States Air Quality (KORUS-AQ) campaign period (1 May to 12 June 2016). We classified the KORUS-AQ period into two cases, the stagnant period (16–21 May) which was dominated by local emission and the long-range transport period (25–31 May) which was affected by transport from the leeward direction, and focused on the differences in OC secondary aerosol formation between two modules over Northeast Asia. The simulated surface PM2.5 chemical components via the two modules showed the largest systematic biases in surface OC, with a mean bias of 4.5 μg m−3, and the second largest in SO42− abundance of 2.2 μg m−3 over Seoul. Compared with surface observations at two ground sites located near the western coastal Korean Peninsula, MADE/VBS exhibited the overpredictions in OC by 170–180%, whereas MADE/SORGAM showed underpredictions by 49–65%. OC and sulfate via MADE/VBS were simulated to be much higher than that simulated by MADE/SORGAM by a factor of 2.8–3.5 and 1.5–1.9, respectively. Model verification against KORUS-AQ aircraft measurements also showed large discrepancies in simulated non-surface OC between the two modules by a factor of five, with higher OC by MADE/VBS and lower IC by MADE/SORGAM, whereas much closer MADE/VBS simulations to the KORUS-AQ aircraft measurements were found. On the basis of the aircraft measurements, the aggregated bias (sum of four components) for PM2.5 mass concentrations from the MADE/VBS module indicated that the simulation was much closer to the measurements, nevertheless more elaborate analysis on the surface OC simulation performance would be needed to improve the ground results. Our findings show that significant inconsistencies are present in the secondary organic aerosol formation simulations, suggesting that PM2.5 forecasts should be considered with great caution, as well as in the context of policymaking in the Northeast Asia region.

1. Introduction

The presence of high levels of atmospheric PM2.5 (particulate matter less than 2.5 µm in size) concentrations is one of the most urgent societal issues affecting Northeast Asia, which includes South Korea and China, owing to the phenomenon of frequent haze. Air quality models are tools useful for characterizing the features of PM2.5 and its relevant chemical composition over the area of interest, and they have been used for air quality forecasting, health and environmental impact assessments, and policy support [1,2]. However, a highly complicated bias is evident in PM2.5 simulation, as the air quality is affected by many factors, such as local emissions, long-range transport of anthropogenic emissions from neighboring countries, meteorological interactions, chemical reactions, and sources of key precursors and processes, and others that are yet to be considered [3,4,5,6]. In addition, PM2.5 is influenced by both secondary inorganic aerosol (SIA) and secondary organic aerosol (SOA) production. In particular, SOA is one of the highly uncertain factors involved in PM2.5 concentration simulation [7,8].
Previous atmospheric chemistry modeling studies have traditionally underestimated organic aerosol (OA) as compared with observations [7,8,9,10,11], leading to an underestimation of PM2.5 mass concentrations. This PM mass underestimation has been highlighted, and many studies have indicated the uncertain and complicated SOA aerosol generation mechanisms used in regional-scale air quality models. This is also evident in the Northeast Asia area. Qin et al. [12] studied the characteristics of the PM2.5 chemical composition in the Pearl River Delta region in China and demonstrated that the model tended to underestimate total PM2.5 concentrations by 21–28% as compared with measurements that included organic carbon (OC). Zhou et al. [13] evaluated the performance of the Weather Research and Forecast/Chemistry (WRF-Chem) model in PM2.5 forecasts over Eastern China and found that the daily average PM2.5 concentrations were underestimated by approximately 13%, presumably due mainly to the OC underestimation. Han et al. [14] employed a VBS approach in a regional air quality model system and suggested that VBS-based OC modeling was a more realistic and precise representation of SOA formation in eastern China. These previous studies have demonstrated that the concentration of OA was both uncertain and primarily underestimated in most air quality studies.
The underestimation of simulated OC is also generally evident in regions outside Northeast Asia. Heald et al. [15] showed that global atmospheric chemistry models systematically underpredicted OA concentrations in the free troposphere. Some studies have compared the performance of OA among models and against measurements [16,17,18,19]. The systematic low biases found in these OA model predictions have led the aerosol research community to conduct an intensive search for additional SOA precursors and formation mechanisms. Consequently, the use of different SOA generation modules, which involve differences in the treatment of complicated gas-phase VOCs, can affect the subsequent changes evident in the OC aerosol mass distribution resulting from thermal equilibrium processes in numerical air quality modeling [3]. From this viewpoint, some research progress has been made in recent years with respect to understanding and modeling the mechanisms responsible for producing SOA. The volatility basis set (VBS) approach was proposed [20] to provide a more realistic representation of the wide volatility range of organic compounds and further oxidation processes and to reduce the gap between observation and model predictions. More recently, Ahmadov et al. [21] developed a VBS scheme in the WRF-Chem model and demonstrated that the formulation of VBS in treating the gas-phase VOC volatility led to significant improvement in SOA simulations over the eastern United States in 2006.
In South Korea, the Korea-United States Air Quality (KORUS-AQ) campaign has been conducted as an international, multi-organizational mission created by the National Institute of Environmental Research (NIER) of South Korea and the National Aeronautics and Space Administration (NASA) of the USA to observe air quality across the Korean Peninsula and its surroundings [22,23]. The immediate goal of the KORUS-AQ campaign was to understand the factors contributing to air quality problems over the Korean Peninsula. The KORUS-AQ campaign collected comprehensive and detailed measurements of pollutants (both trace gases and aerosol particle properties) from aircraft, ground sites, and ships, with extensive spatial and vertical coverage from 1 May to 12 June 2016. However, no such SOA analysis was undertaken, thus, it would be worthwhile to assess the VBS secondary organic aerosol formation module, which was recently introduced to the VOC scheme, based on improvements in OC volatilities in the WRF-Chem model [21] against both traditional OC module and KORUS-AQ measurements.
This study is aimed at observationally and numerically investigating and diagnosing the OA simulation bias from two secondary aerosol formation mechanisms, Modal Aerosol Dynamics model for Europe/Volatility Basis Set (MADE/VBS) and Modal Aerosol Dynamics model for Europe/ Secondary Organic Aerosol Model (MADE/SORGAM). In this study, MADE/VBS and MADE/SORGAM are referred to as “M/V” and “M/S”, respectively. Here, WRF-Chem has been employed as a model to investigate air quality, and the resulting simulations of PM and OA are compared between the two modules, MADE/VBS and MADE/SORGAM, as well as between model results and aircraft measurements obtained during the KORUS-AQ campaign period. Under strict identical conditions, with only the two aerosol modules providing the difference, the simulated bias originating from secondary aerosol formation is assessed. The simulation capabilities of the regional model are then assessed regarding the simulation of PM2.5 in terms of the aerosol concentrations of sulfate, nitrate, and ammonium, and the optimal factors for aerosol are also discussed in association with OA variabilities over South Korea and Northeast Asia.

2. Methods

2.1. Model Domain, Configurations, and In Situ Ground Measurements

As an “on-line” model, the community model WRF-Chem [24] was employed in this study. WRF-Chem has been widely used to study local and regional scale air quality and has been employed to diagnose and forecast surface PM2.5 chemical components over Northeast Asia [4,6,13,23,25]. The meteorological model, WRF, is a three-dimensional Eulerian model that solves a set of prognostic conservation equations for mass, momentum, energy, and moisture, as well as associated atmospheric physical processes. The “on-line” WRF-Chem model calculates anthropogenic and biogenic emissions processes, chemical transport, and transformation processes; secondary generation aerosol mechanisms; and removal processes, such as the dry and wet depositions of gaseous and aerosol species [26].
In this study, two aerosol formation mechanisms, MADE/VBS and MADE/SORGAM, were employed for WRF-Chem (ver. 3.8.1) simulation during the KORUS-AQ campaign. The WRF-Chem model configurations for meteorology and gas and aerosol characteristics are listed in Table 1. We configured the meteorological physics options identically for the two sensitivity tests of aerosol formation mechanisms. Anthropogenic/biogenic emissions, gas-phase chemical processes, and dry and wet depositions were also identically employed, except with regard to the two aerosol modules. These model configurations made it possible to identify the inconsistency between the two options arising from only aerosol module differences.
Figure 1 provides the WRF-Chem model domain, displaying the three nested domains used in the WRF-Chem model, i.e., D01 (27 km grid spacing), D02 (9 km grid spacing), and D03 (3 km grid spacing). All grids in WRF-Chem are defined on a Lambert conformal conic projection centered at 38° N, 126° E, with true latitudes at 30° N and 60° N, as shown in Figure 1a–c. Figure 1c denotes the employed locations of two in situ ground measurement sites, (urban) Seoul-Bulgwang and (background) Baengnyeongdo, for the observation measurements of the four chemical components considered in this study, i.e., SO42−, NO3, NH4+, and OC.

2.2. Gas-Phase Scheme and Two Organic Aerosol Formation Modules: MADE/VBS and MADE/SORGAM

For the gas-phase chemical scheme, we used the Regional Atmospheric Chemistry (RACM) Earth System Research Laboratory (ESRL) scheme [27]. RACM-ESRL includes 93 gas-phase chemical species and 213 reactions. RACM-ESRL is an updated version of the Regional Acid Deposition Model (RADM), developed based on the chemical mechanisms of RADM2 and RADM-Mainz Isoprene Mechanism (MIM). The RADM2 photochemical mechanism was originally developed by Stockwell et al. [28], with wide usage in previous WRF-Chem studies, and the RACM-MIM mechanism was updated with rate coefficients following the JPL 2006 report [29] and multiple references [30,31].
As the organic aerosol scheme, traditionally, the WRF-Chem model [24] uses the SORGAM parameterization [32], which is based on a two-product approach [33] toward VOC oxidation, with older SOA yield estimates. The M/S traditionally calculates the inorganic chemistry system based on MARS [34] and its modifications by Binkowski and Shankar [35], which calculates the chemical composition of a sulfate/nitrate/ammonium/water aerosol in equilibrium thermodynamics. The aerosol modules represent sizable aerosols by three functional distributions of Aitken (smaller than 0.1 μm), accumulation (0.1–2 μm), and coarse (2 μm or larger) modes. The aerosol dynamics of nucleation, condensational growth, and coagulation are considered with the gas-phase and heterogeneous aqueous chemistry. The gaseous and heterogeneous chemistry mechanisms used in both models considered elemental carbon (EC); primary organic aerosol (POA), SOA, and SIA; and coarse particulates of soil dust and sea salt, along with other non-reactive anthropogenic particulate matter. SOA is primarily formed by a homogeneous reaction between ozone (O3), hydroxyl radicals (OH), oxygenated NOx (NO3), and organic compounds; meanwhile, POA is assumed to be non-volatile, containing primary emission components, such as EC [36]. This parameterization has been known to predict very little SOA formation.
The M/V module introduces a four-bin volatility basis set with updated SOA yields based on recent smog chamber studies [37]. The M/V treats the gas/aerosol system within a spectrum of volatilities using the saturation vapor concentration as the surrogate for volatility [20]. This approach allows the lumping of organic mass in various volatility bins to circumvent the detailed kinetics that leads to SOA formation from various precursors, and to facilitate the characterization of the effects of the oxidation (aging) processes in complex mixtures on gas/aerosol partitioning within atmospheric models. Detailed information regarding M/V is presented by Ahmadov et al. [21].
We conducted a comparison study of model simulations based on RACM-ESRL, coupled with two aerosol chemical mechanisms, M/S (chem_opt = 107) and M/V (chem_opt = 108), denoted as MADE/SOA_VBS in WRF-Chem (ver 3.8.1). It was still expected that large uncertainties would be present under all sensitivity tests for predictions of both SIA and SOA. In addition, uncertainties in the numerical prediction of long-range transported aerosols could impact increasing/decreasing PM concentrations over leeward regions. Therefore, the differences between the two aerosol modules, as a result of the two aerosol chemical mechanisms, were explored further for the reasonable application of WRF-Chem to Northeast Asia air quality studies.

2.3. KORUS-AQ Aircraft Measurements

The KORUS-AQ campaign was an international, multi-organizational mission aimed at observing the air quality across the Korean Peninsula and its surrounding areas. The mission was initiated by NIER and NASA [22,23]. The KORUS-AQ campaign collected comprehensive and detailed measurements of pollutants, including trace gases and aerosol particles, using aircraft, ground sites, and ships, with extensive spatial and vertical coverage from 1 May to 12 June 2016. The employed aircraft measurements during the KORUS-AQ campaign were PM2.5 mass concentrations and its chemical components observed during the DC-8 flights. Details of aircraft measurement instruments during the KORUS-AQ campaign period have been described in detail in numerous previous studies [6,38,39,40,41,42].

2.4. Emission

The employed emission data for our WRF-Chem simulations were the latest version of the anthropogenic KORUS-AQ model, KORUS v.2, which was updated in the KORUS-AQ campaign in 2016. We focused on varying the chemistry based on anthropogenic emissions, KORUS v.2, with fixed biogenic emissions, Model of Emissions of Gases and Aerosols from Nature (MEGAN) v2.04 emission and module with biomass burning emissions, Fire INventory from NCAR (FINN) v.1.5. The study period was the KORUS-AQ campaign, i.e., 1–31 May 2016. The model spin-up time was 7 days, 24–30 April 2016.
Anthropogenic emission KORUS v.2 was originally developed based on the Comprehensive Regional Emissions for Atmospheric Transport Experiment (CREATE) emissions dataset. CREATE was developed based on a combined inventory from 29 Asian countries, primarily including the Regional Emission Inventory in Asia (REAS) [43], Multi-resolution Emission Inventory China (MEIC) (http://www.meicmodel.org), Japan Auto-Oil Program emission inventory (JATOP), and Korean Clear Air Policy Support System (CAPSS) [44]. This CREATE-2015 anthropogenic emission dataset was also used for the KORUS-AQ campaign period to predict aircraft DC-8 pathways. Detailed explanations were found in previous studies [3,45,46,47]. It is worthwhile to note that the WRF-Chem model can calculate the biogenic emissions at each time step during the model integration (“on-line”). Here, precalculated biogenic emissions were applied identically in both models to force matching conditions.
To characterize and validate the simulated PM2.5 concentrations and its chemical components, 25 urban sites located in the SMA and Baengnyeongdo, located over the Yellow Sea, were considered. Baengnyeongdo is recognized as one of the typical measurement background sites in South Korea [4]. All the site locations are indicated in Figure 1 and Figure 2.

2.5. Experiment Setup

To carry out and explore the differences in the two aerosol modules, two sensitivity tests were performed for the entire period of the KORUS-AQ campaign, 1–31 May 2016, applying the same emission and meteorological components with identical transport and physics schemes for both grid-scale and sub-grid scale. The meteorological initial and boundary conditions were obtained from the UK Met Office Unified Model global forecasts operated by the Korean Meteorological Administration (KMA) with a spatial resolution of ~25 km and a temporal resolution of 3 h. As the chemical initial and boundary conditions, fixed climatology data based upon results from a NOAA-Aeronomy Laboratory Regional Oxidation Model (NALROM) were used in our study. A week-long (seven-day) period was applied for spin-up, and the differences between the two classified periods, i.e., the persistent synoptic anticyclone (referred to as “STG”, May 16–21) and long-range transport (referred to as “LRT”, 25–31 May) periods, during the KORUS-AQ campaign were analyzed to diagnose the potential contribution of the updated VBS and traditional SORGAM to OC and PM2.5 concentrations over Northeast Asia.
The meteorological conditions during the KORUS-AQ campaign showed various air pollution characteristics [22,48]. During the entire campaign period, four distinct synoptic patterns were classified by Peterson et al. [49] as follows: (1) dynamic meteorology and complex aerosol vertical profiles (1–16 May); (2) stagnation under a persistent anticyclone (17–22 May); (3) dynamic meteorology, low-level transport, and haze development (25–31 May); and (4) blocking patterns (1–7 June). In this study, we present the characterization for the two comparative periods (cases), STG, and LRT. Detailed synoptic descriptions in this regard are provided in Peterson et al. [49]. In the current study, we carried out WRF-Chem for the two different periods (cases) with two aerosol formations modules, M/V and M/S, and comparatively analyzed the differences in PM2.5 mass concentrations and contrasted two secondary aerosol formations simulated over Northeast Asia.

3. Results

3.1. Statistical Model Evaluation

Statistical evaluations were performed to compare the observed and simulated meteorological and chemical fields. The surface meteorological variables were also evaluated against the measurements by employing statistical evaluation metrics, including the normalized mean bias (MMB) and index of agreement (IOA), showing an NMB of −0.22–0.32 and IOA of 0.71–0.92 for 2 m temperature, 10 m windspeed, and relative humidity, as indicated in Table S1. The detailed meteorological results are also displayed in Table S1.
For the chemical components, we used the fractional bias and Pearson’s correlation coefficient (R) to compare model performances and identify model prediction consistencies in the simulations of the PM2.5 mass and its chemical components. Table 2 provides a statistical summary of model performance for PM2.5 mass, sulfate, nitrate, ammonium, and OC, simulated for Seoul-Bulgwang and Baengnyeongdo during the KORUS-AQ campaign period. The results from M/V show that PM2.5 had the highest R (0.65) and IOA (0.81) at Seoul-Bulgwang, as sulfate exhibited the highest R (0.40 for M/V and 0.51 for M/S) and IOA (0.53 for M/S and 0.61 for M/V), respectively. Between the two aerosol modules, M/V showed better simulation capabilities for PM2.5 mass concentrations.
In terms of the root mean square error, NMB, and MBE, M/V was found to be a more appropriate PM2.5 simulation than M/S, with a lower NMB within ±10%, whereas M/S exhibited an NMB within ±31%. Other criteria suggested by Emery et al. [50] and Choi et al. [51] are listed in detail in Table 2.

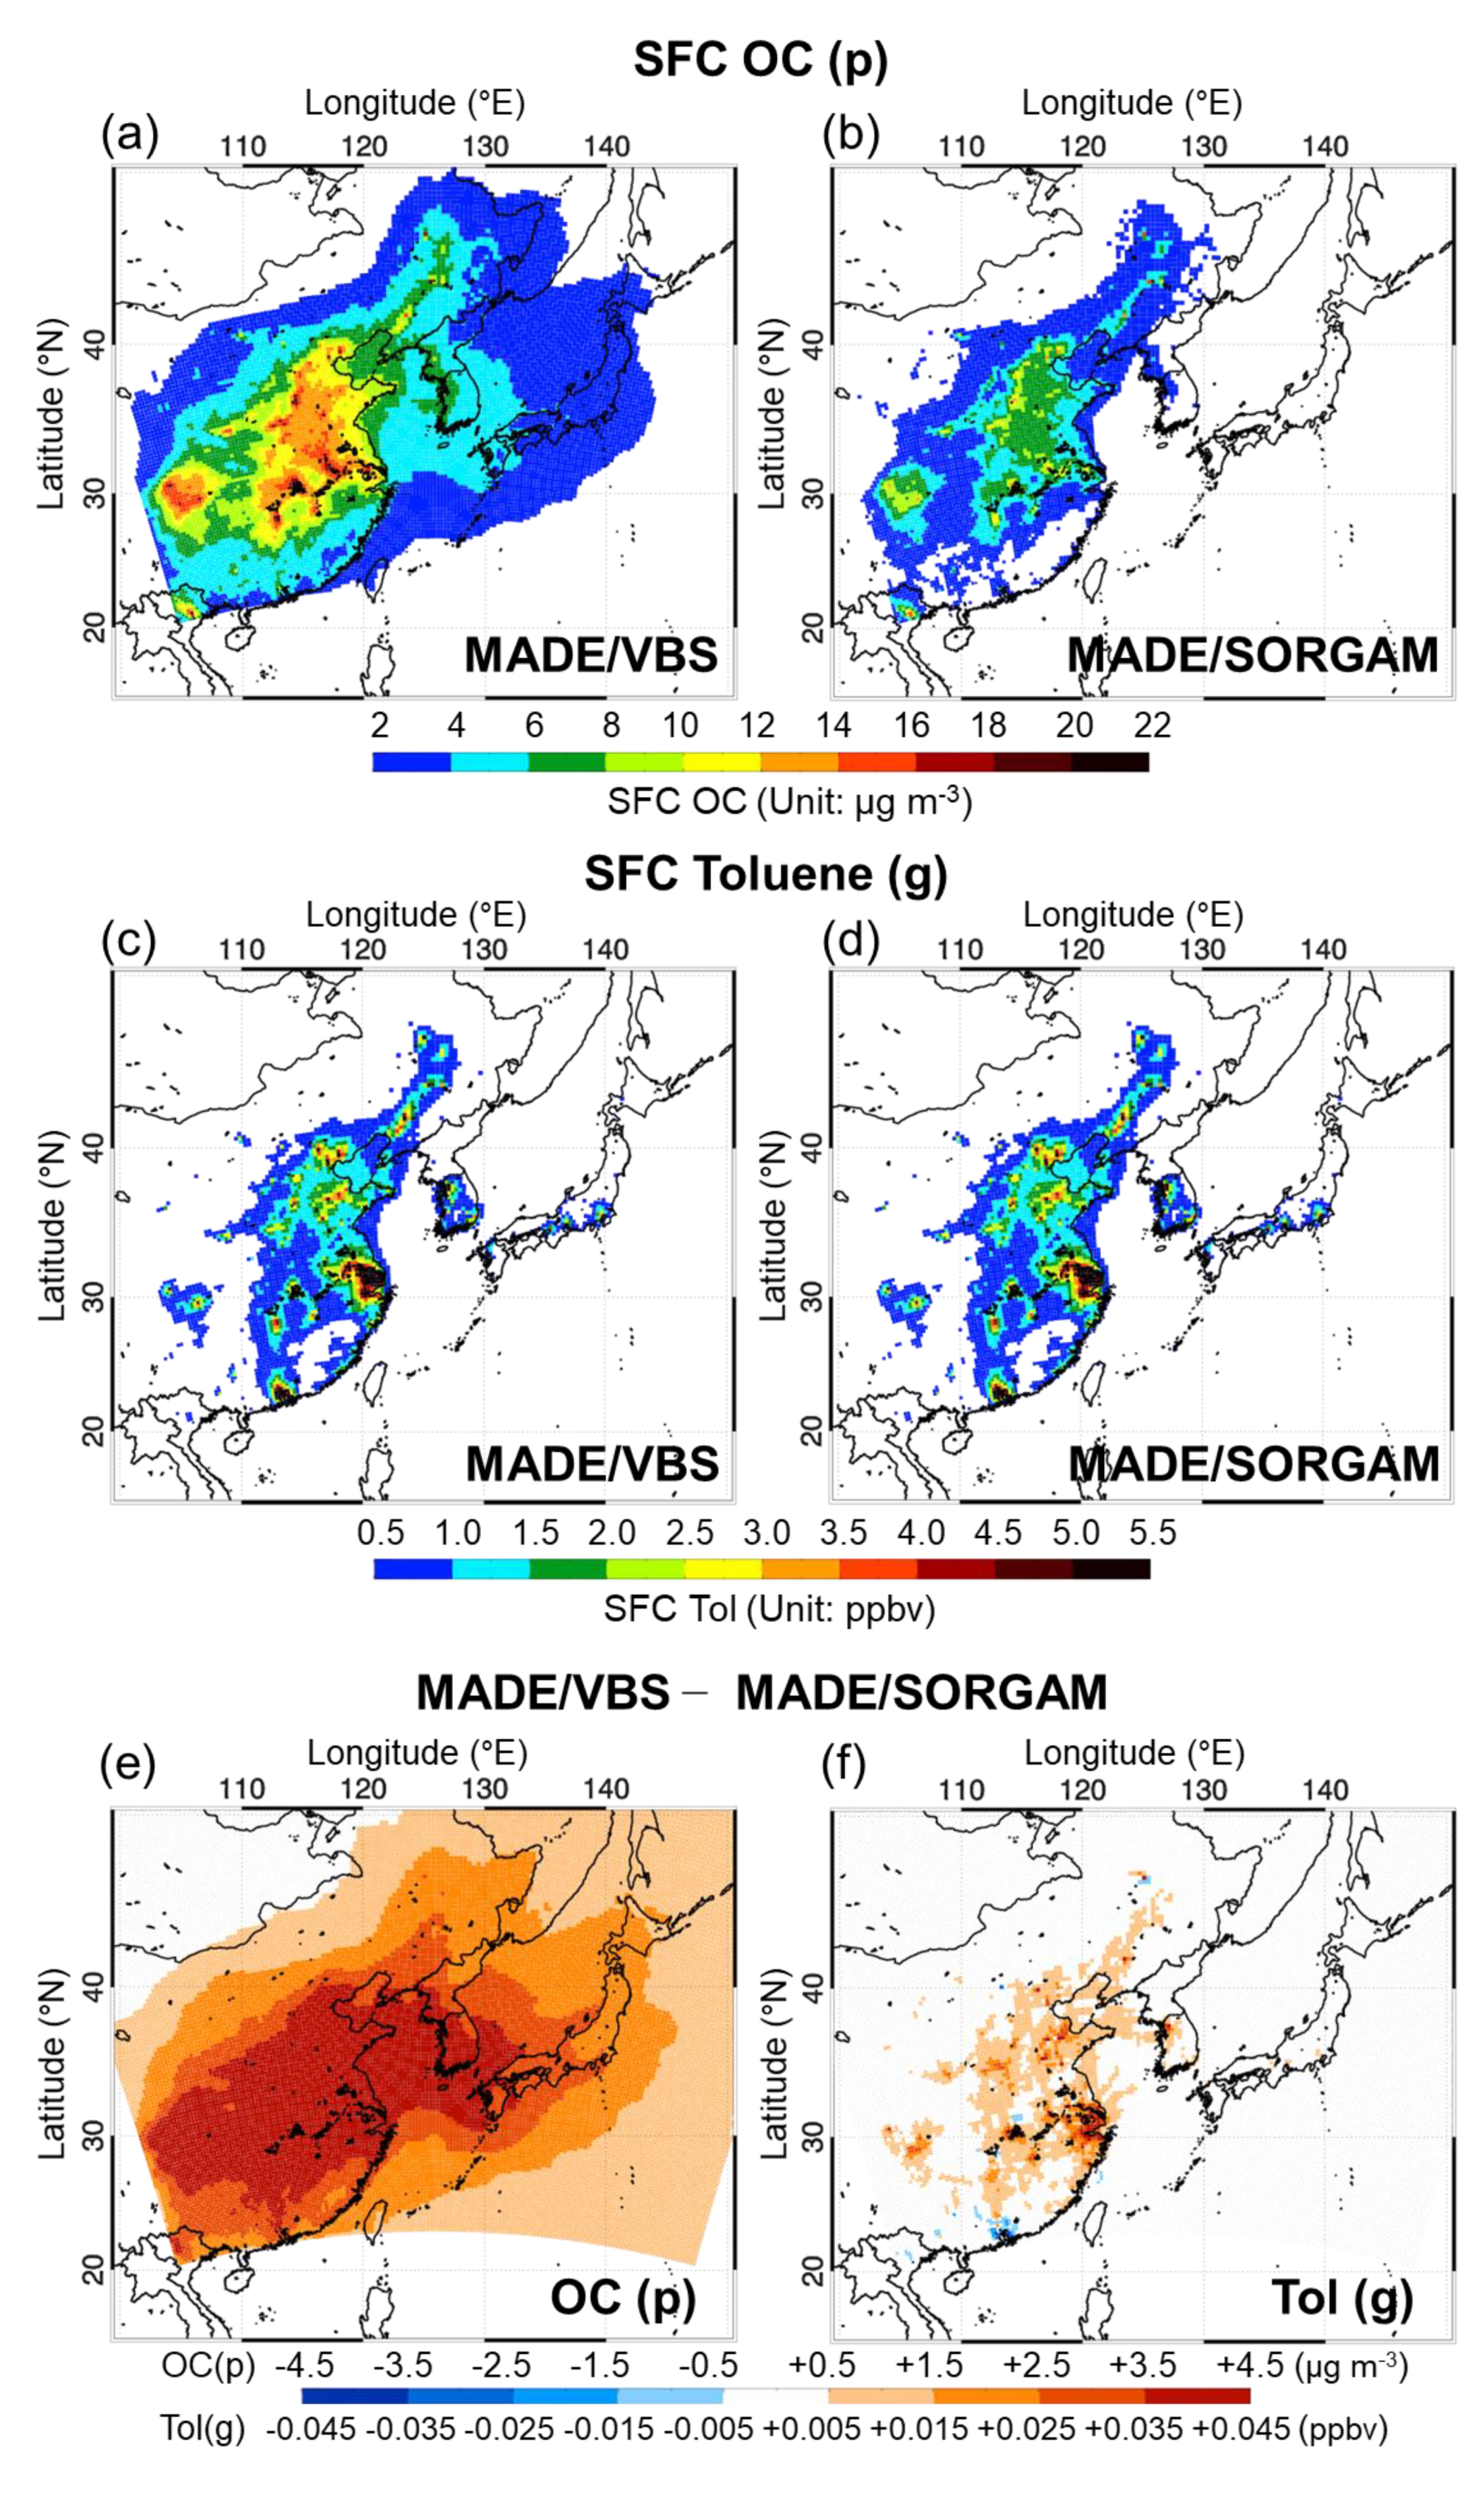
3.2. Spatial and Temporal Distributions

Figure 2a,b showed the observed and simulated hourly variations of PM2.5 mass concentrations observed from 25 sites located over the SMA and Baengnyeongdo ground site during 1–31 May 2016. The locations of these 25 sites are denoted in Figure 2c. The results showed that both modules captured the overall diurnal and weekly variations of surface PM2.5 during both the STG (16–21 May) and LRT (25–31 May) periods, with relatively higher levels of PM2.5 concentrations in the LRT period (25–31 May) during the KORUS-AQ campaign. Biases of underpredictions from both simulations were found only during the transient period from the end of STG to the beginning of LRT (22–25 around May). M/V simulated higher PM2.5 than M/S by a factor of 1.4, whereas both modules underestimated with respect to measurements, M/V by 15% and M/S by 56%. Overall, compared with observations, simulated PM2.5 mass concentrations by M/V was higher than that provided by M/S, showing results much closer to ground in situ measurements of PM2.5 mass concentrations. This also agrees with the results of previous studies [14,21].
In addition, M/V tends to simulate much higher peak PM2.5 mass concentrations that are closer to observations than M/S, such as PM2.5 on 24–27 May 2016. This was believed to be due to the reflection of realistic VOC sets of volatilities incorporated in the WRF-Chem model for secondary PM2.5 simulations. However, it was also found that observed higher PM2.5 concentrations were severely underestimated by the two modules for 21–25 May, which was likely due to other factors such as turbulent vertical mixing and other meteorological variables. Therefore, disaggregated analysis for each of the chemical components such as SO42−, NO3, NH4+, and OC would be further needed for the robust assessment of PM2.5 mass concentrations.
Figure 3 shows the hourly variations of observed and simulated PM2.5 mass concentrations and its chemical components of SO42−, NO3, NH4+, and OC against two observation sites, Seoul-Bulgwang and Baengnyeongdo, for May 2016 during the KORUS-AQ campaign. In the same manner exhibited in Figure 2, the M/V simulation of PM2.5 exhibited slightly higher values than M/S at both sites for almost the entire period including both STG (May 16–21) and LRT cases (May 25–31) (Figure 3). Compared with observations, overall reasonable simulations against observations were found, however, relatively higher PM2.5 concentrations for LRT period were sometimes exhibited in Seoul-Bulgwang and Baengnyeongdo, by maximum 36% and 50%, respectively. This intermittent higher peaks of PM2.5 concentrations than observations in LRT were found to be primarily due to the higher SO42− and OC concentrations for LRT, whereas NO3 and NH4+ exhibited similar levels between the STG and LRT cases (Figure 3). It is also notable that sulfate in M/V exhibited rather higher levels in both periods than that in M/S for both areas, suggesting that VBS module together with the inorganic mechanisms significantly differs from that in M/S.
However, simulated surface OC showed significant discrepancies between the two modules (Figure 3) for both periods. Relatively higher OC simulations by M/V were found as compared with those by M/S-OC, by a factor of 2.3–2.9 (for the STG period) and 3.3–4.4 (for the LRT period), respectively. Again, this is because OC secondary formation in the M/V scheme based on VOC VBS clearly differs from that of M/S in the photochemical reactions, resulting in twice the OC concentration of M/S, in greater agreement with the measurements of PM2.5. However, as compared with observations, M/V clearly exhibited an overprediction in OC by 170–180%, whereas M/S underpredicted by 49–65% over the entire KORUS-AQ period. The disparities are particularly higher in the LRT case than in the STG case; partly due to the fact that models calculate the concentrations relative to a horizontal grid, whereas a measurement site obtains values at a fixed point, and thus how to take into account this sub-grid scale variability in model analysis is also believed to contribute to this discrepancy between observation and simulation. Therefore, more elaborate analysis on the surface OC simulation performance would be needed to improve the ground results.
Figure 4a shows both the observed and simulated spatial distributions of the PM2.5 mass concentrations over South Korea, demonstrating an observed PM2.5 of 35 μg m−3 or greater over the SMA and relatively lower values over the non-SMA areas, except for southeastern areas where some spikes with the PM2.5 of greater than 30 μg m−3 were found (leftmost panel in Figure 4a), and similar levels of PM2.5 have been simulated by M/V near the SMA (middle panel in Figure 4a). However, most areas were simulated as having PM2.5 levels below 20 μg m−3 in M/S (rightmost panel in Figure 4a), except for the SMA. Therefore, as shown in Figure 4a, M/V simulated PM2.5 values much closer to measurements, with reasonable simulations of high PM2.5 over the southeasternmost area.
The simulated surface PM2.5 chemical components via the two modules are shown in Figure 4b. Between the two modules, the largest systematic biases were found in OC and the second largest in SO42−. Between the two modules, M/V exhibited an overprediction of OC by 170–180% against observations, whereas M/S presented an underprediction by 49–65% (see the rightmost panel in Figure 4b). Sulfate was simulated to be much higher by M/V than by M/S, by a factor of 1.5–1.9, but relatively closer to surface PM2.5 mass observations (second panel from left in Figure 4b). As a result, OC inconsistencies between two modules are significant with overestimation by M/V and underestimation by M/S (Figure 4b), while relatively low biases were found in NO3 and NH4+.
To characterize the LRT influences and to examine the differences between the two aerosol options, we investigated the spatial distribution of simulations over the whole domain of Northeast Asia. Despite the unavailability of measurements in inland China, the qualitative analysis on the simulation differences between modules in two sites, Seoul-Bulgwang and Baengnyeongdo, can also be inferred over Northeast Asia. Figure 5a,b shows the surface PM2.5 horizontal distributions, and Figure 5c,d shows column-integrated PM2.5 concentration simulated from the two aerosol modules. The reason that the column-integrated values are employed here is to check and rule out the possibility of vertical turbulent mixing influences and confirm that the biases are solely caused by the differences in the two aerosol modules. In Figure 5a,b, the M/V simulation of domain-averaged PM2.5 concentrations of 11.9 μg m−3 showed significantly higher levels of surface PM2.5 than that of M/S with a domain average of 6.8 μg m−3. Column-integrated PM2.5 concentrations also exhibited a similar fraction of overprediction by M/V as compared with that from M/S (Figure 5c,d). According to Figure 4, along with Figure 5, M/V is likely to produce PM2.5 mass concentrations closer to measured levels over Northeast Asia. Further verification would be possible by employing the column-integrated concentrations from long-term satellite data.
We also examined the simulated results of four chemical components and their discrepancies between the two modules. Figure 6, Figure 7, Figure 8 and Figure 9 show the comparison of the four aerosol components, SO42−, NO3, NH4+, and OC, between the two modules. In Figure 6a,b, surface sulfate is shown to be simulated by M/V at considerably higher levels, with a domain average of 3.5 μg m−3 (max. 23.1 μg m−3), whereas M/S simulated lower PM2.5, with a domain average of 1.5 μg m−3 (max. 7.8 μg m−3). However, no discrepancies (or slightly higher SO2 by M/S) can be seen in the gas-phase SO2 concentrations between the two modules (Figure 6c,d). Sulfate differences exhibited positive (+) values over the entire domain with a maximum of +17.5 μg m−3 in central China, in which emissions of particulate matter were high in Northeast Asia. Meanwhile, SO2 gas concentrations showed slightly higher values for the M/S module as compared with those by M/V over the entire domain.
In the same manner, the NO3 distribution is also shown in Figure 7. Unlike sulfate and SO2, small discrepancies (<10%) in both nitrate and gas NO2 distributions can be seen between the two modules (see Figure 7a–d). It was confirmed that small fractions of discrepancies were found for both nitrate and gas-phase NO2 (Figure 6e,f). However, in the case of ammonium, as seen in Figure 8, a distribution pattern similar to sulfur (Figure 6) is demonstrated, characterized by a higher aerosol phase and lower gas concentration via M/V. Ammonia (NH3), a gaseous species, appeared to be almost the same (the discrepancies <10%) in both modules (Figure 8c,d), whereas particulate-phase ammonium simulated by M/S was slightly higher by less than 40% than that from M/V (Figure 8e). This implies that M/V has more positive particle generation, and therefore negative gas concentrations are lower than that from M/S, which means that in M/V the conversion of gas-phase to particle-phase occurs more frequently than in M/S; this phenomenon appears most evidently in central China.
As indicated in Figure 9, the greatest discrepancies between the two modules are found for OC and VOC. In the current analysis, we selected toluene as a producer of the precursor of OC because toluene is one of the volatile aromatics in VOC. WRF-Chem did show significantly higher particulate OCs by M/V than those by M/S, by a factor of 2.0–2.6 (Figure 9a,b), whereas little difference or slightly higher values were shown for M/V in toluene between the two modules (Figure 9c,d). Over the entire WRF-Chem simulation domain, the relative differences (M/V minus M/S) showed positive (+) values in OC concentrations (Figure 9e), with the largest values prevalent for central China (Figure 9a). Meanwhile, negative values (−) with small differences appeared or almost zero differences for gas-phase VOC (Figure 9f). Therefore, for the four components, SO42−, NO3, NH4+, and OC, the largest differences between M/V and M/S were found for OC and the second largest for SO42−, implying a significant enhancement of organic aerosols induced by VBS-based photochemical reactions in the generation of secondary PM2.5 over Northeast Asia. As no further measurements of chemical components were available outside of South Korea, such as in China, the model results could not be directly compared with observations over Northeast Asia during the KORUS-AQ period. Therefore, further monitoring and modeling studies are needed under strict atmospheric conditions for the diagnosis of PM2.5 over Northeast Asia.
Column-integrated distributions of four chemical components, SO42−, NO3, NH4+, and OC, simulated in two modules, and the discrepancies between them are shown in Figure 10. The results show that, again, the largest discrepancy between M/V and M/S is found for OC, with the domain-averaged OC by M/V simulated to be 370% higher, and the second largest discrepancy is found for SO42−, by 113%. However, NH4+ and NO3 showed small discrepancies, and NO3 showed a discrepancy with the opposite sign, i.e., M/S simulated values higher than M/V by a small amount (+19%), which is the only result that differs among the five integrated concentrations. The “column-integrated” values are found to exhibit similar behavior to that of the four “surface” chemical components between the two modules, as indicated in Figure 6, Figure 7, Figure 8 and Figure 9. Therefore, it can be concluded that the role of VBS module seems to be more significant for both surface- and column-integrated secondary aerosol concentrations and their biases caused by the different aerosol modules are greater than 79% in the mass fractions of PM2.5 mass concentrations and 370% in the second generation of OC, among the total SIA and SOA chemical components. This is mainly due to the M/V realistic treatment of the gas/aerosol system within a spectrum of VOC volatilities, using saturation vapor concentration, indicating again that M/V simulated clearly higher secondary PM2.5 concentrations via the photochemical process, relevant to SOA.

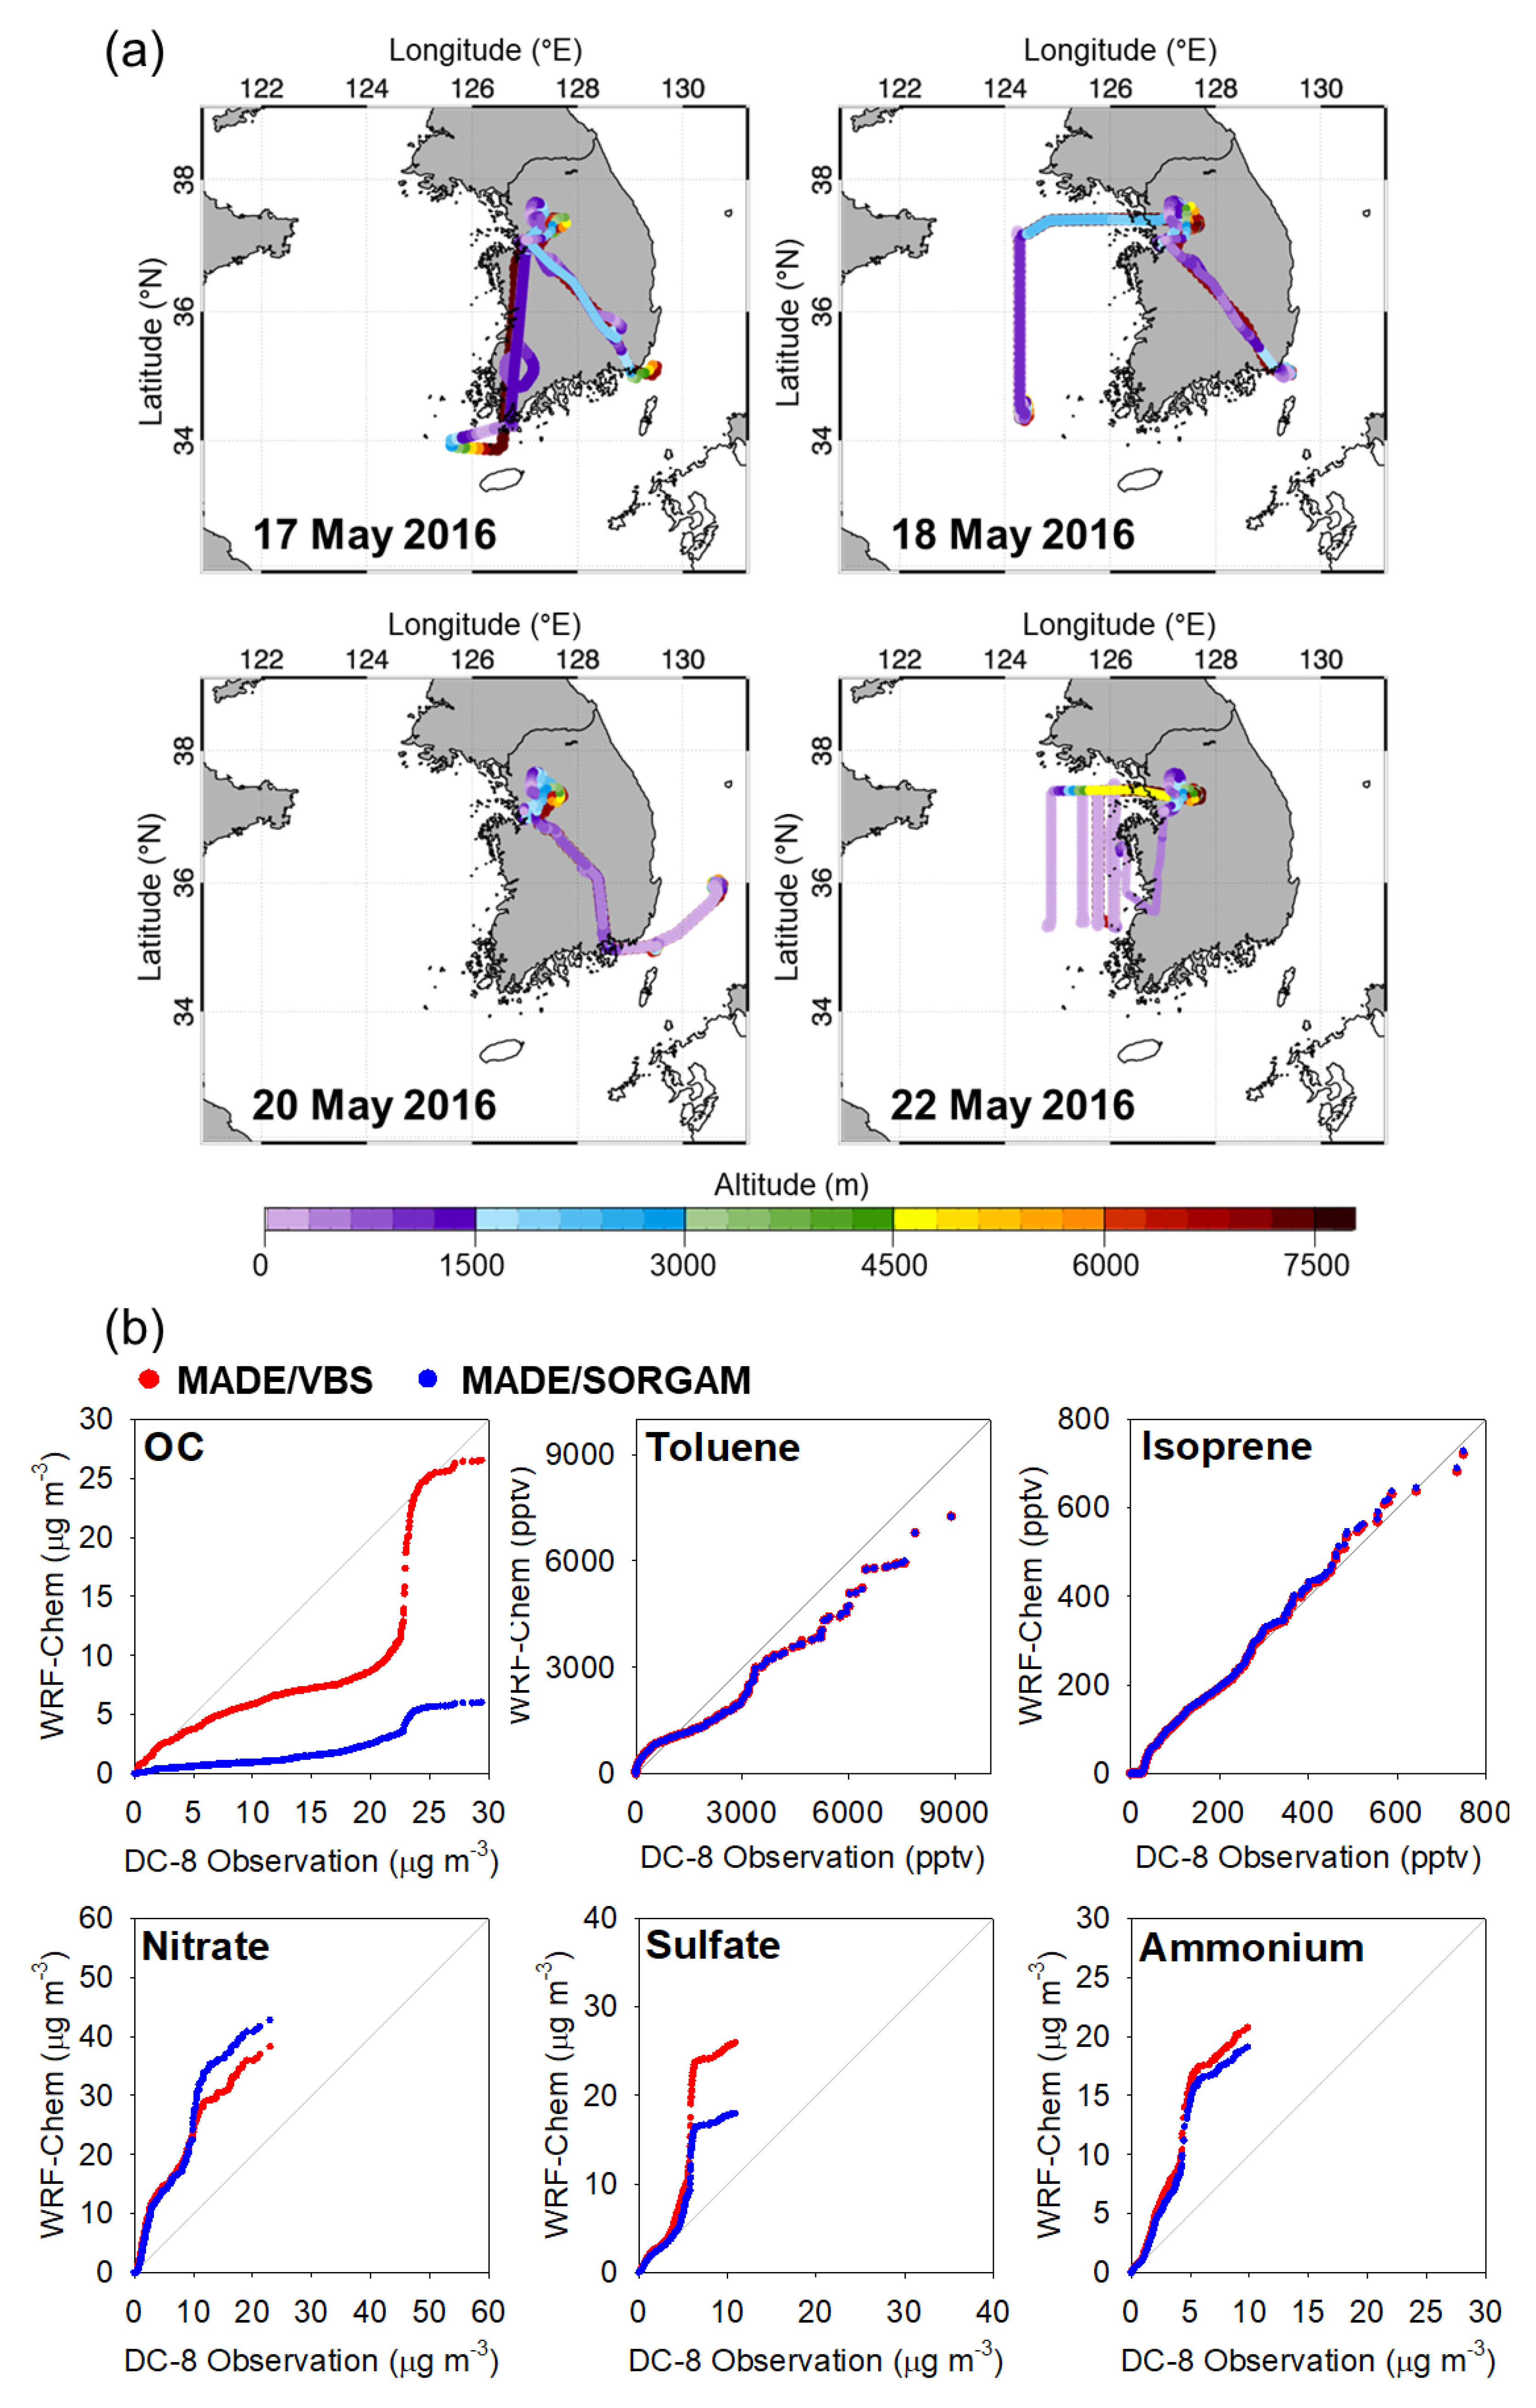
3.3. Model Assessment against KORUS-AQ Measurements

In this section, we evaluate the SOA and SIA simulation capabilities over the non-surface atmosphere for the two module simulations by comparing their results against KORUS-AQ flight measurements. Measurements of speciated PM2.5 are used for two periods, STG and LRT (see Section 2.4), and sulfate, nitrate, ammonium, and OC abundances are compared against aircraft measurements.
Figure 11 and Figure 12 present four typical KORUS-AQ DC-8 aircraft PM2.5 pathways (top), and a quantile-quantile (Q-Q) plot (bottom) of the WRF-Chem simulated PM2.5 speciated four components (OC, NO3, SO4 2−, and NH4+), and two VOC gas components (toluene and isoprene) for the two indicated periods, STG (May 16–21) and LRT (May 25–31). A Q-Q plot is a type of scatter plot in which the flight measurements and WRF-Chem simulated concentrations are independently sorted; thus, it helps us evaluate whether the measurements and WRF-Chem have similar distributions of concentration, for example, whether WRF-Chem captures the extremes of the flight measurements.
In Figure 11, the Q-Q plots illustrate that except for OC, both M/V and M/S simulations for the three components, sulfate, nitrate, and ammonium, exhibit some overprediction but mainly by a factor of less than three (except for higher sulfate range) against aircraft measurements during the STG case; furthermore, the discrepancies between M/V and M/S show a fluctuation of narrow range for the three inorganic chemical components. Between the two modules, only higher simulated values of sulfate (i.e., ranges for measured sulfate >5 μg m−3) were found by M/V, showing rather different trends in non-surface measurements as compared with ground measurements, as seen in Figure 4. It was also notable that VOC concentrations remain unchanged for both modules as indicated in Figure 11b, implying that the differences in treating the VOC volatilities based on VBS module yielded only the significant enhancement of OC mass generation with little changes in VOCs volatilities. More detailed descriptions on VBS are found in Ahmadov et al. [21].
However, OC simulations showed considerable differences between the two modules and against DC-8 measurements. As seen in Figure 11, M/V simulated almost a linear increase in the magnitude of the OC observation up to DC-8 measurement of OC ≈25 μg m−3; both two modules tended to underestimate against observations with M/V relatively closer to DC-8 measurement. However, the model tended to predict reasonable levels over areas of high levels of OC (i.e., OC > 25 μg m−3) (Figure 11). This is likely due to the treatment of sets of volatility in M/V and its impact on high VOC values. On the contrary, however, M/S showed predominant underestimation against DC-8 OC measurements for the entire range of OC concentrations.
Under little changes in concentrations of VOC precursors (Figure 12), the model results for the LRT period indicated that the discrepancies of OC simulation were more pronounced between the two modules. As can be seen in Figure 12, M/V provided reasonable simulations of OC against DC-8 measurements (mean bias +2.9 μg m−3), whereas M/S showed significantly lower values, by a factor of 1/5 (mean bias −3.5 μg m−3). Maximum OC was also simulated well by M/V, at a level of 28.6 μg m−3 (as compared with the DC-8 measurement of 39.3 μg m−3), whereas a significantly lower value for maximum OC was simulated by M/S (7.6 μg m−3), which underestimated by a factor of approximately five as compared with DC measurements (Figure 11). Sulfate also showed some ranges of discrepancies between the modules (Figure 12) and exhibited marginal overpredictions, marginal overprediction from M/V and small underestimation from M/S. Other chemical compounds such as nitrate showed rather high simulated values against DC-8 measurements; however, no particular discrepancies between the two modules were found, as previously featured in the in situ ground measurements (Figure 7, Figure 8, and Figure 10).

4. Discussion

In this study, we employed the concept of volatile basis set, which was introduced by Ahmadov et al. [21], Donahue et al., [20] and others. Conceptually, OC formations are best explained by treating the gas/aerosol system within a spectrum of volatilities using saturation vapor concentration as the surrogate for volatility [20]. For modeling applications, VBS divided this complicated volatility spectrum into a manageable number of bins, or basis sets, rather than treating detailed kinetics leading to SOA from various precursors. Ahmadov et al. [21] updated the SOA module within WRF-CHEM by introducing a four-bin volatility basis set based on the smog chamber studies [37]. Therefore, due to the difference in treating the VOC volatilities between VBS vs. non-VBS modules, the differences in OC mass generations between M/V and M/S would be of importance over the given region.
In the current numerical comparative study, we confirmed earlier that M/V increased both surface and non-surface OC concentrations, by enhancing the SOA formation process. In addition, the maximum sulfate was also enhanced simultaneously in our study. This is probably due to the fact that some intermediate chemical reactions with the VOC-related atmospheric radicals such as hydroxyl radical (OH) or organic peroxy radical (RO2) involved in the intermediate secondary organic aerosol formation pathways (i.e., VOCs + OH → RO2 → SOA), as well as in the inorganic aerosol intermediate processes (i.e., SO2 + OH + H2O → H2SO4 → (NH4)2SO4, or NO2 + OH → HNO3 → NH4NO3). In addition, in the aqueous phase chemistry, there exists aqueous phase chemical reactions with OC and/or inorganic aerosol-related species. Due to the complexities, more detailed analysis would be needed to quantify each of the pathways leading the inorganic enhancement. Nevertheless, the simulated sulfate discrepancies in our study are clearly lower than OC, as illustrated in Figure 11 and Figure 12.
Our numerical study also explored that there were no changes in the concentrations of VOC precursors, such as toluene and isoprene, between M/V and M/S. This is also obvious in Figure S1, where spatial distributions of DC-8 observation and WRF-Chem results for OC and toluene concentrations are exhibited along the DC-8 flight paths for each of the STG dominant cases, i.e., 17, 18, 20 and 22 May 2016, as well as LRT dominant cases, i.e., 25, 26, 30 and 31 May 2016, respectively. As shown in Figure S1, there were clearly no differences between the two modules, M/V and M/S, thereby indicating that VOC volatility was updated, only allowing lumping organic mass to different volatility bins, circumvents the detailed kinetics leading to SOA from various precursors [21].
However, looking at each STG case more closely, as illustrated in Figure S1, two concentrations of VOCs (toluene and isoprene) were underestimated over the inland area of Korean Peninsula (including the SMA) and overestimated over the ocean area, respectively, while OC was overestimated over the ocean area and underestimated over the inland areas, respectively. As a result of lower VOCs, in turn, it could contribute to the lower OC over the inland area, as indicated in Figure S1. On the contrary, overestimation of both VOCs and OCs in the ocean area is likely due to the excessive secondary aerosol generation processes including aqueous phase chemistry over the ocean area, and also partly due to other combined effect with meteorological factors in the marine atmosphere. On the other hand, the LRT case showed rather reasonable simulation for toluene and isoprene, whereas overestimation (in the ocean area) and underestimation (in the inland areas) for OC were found, respectively (see Figure S1). Unlike the STG cases, over the ocean area, higher OC concentrations were simulated in both upper and lower atmospheres (Figure S1). This overprediction is presumably due to the higher estimation of OC formations during the transport from the upwind area (China). In addition, in both STG and LRT cases, the overestimation of OC over the ocean area might be associated with aerosol-cloud interaction processes including the hygroscopic growth of aerosols and the deposition processes of aerosols related to the microscopic process of cloud physics [52,53], leading to the overestimation of WRF-Chem simulations.
Regarding the model consistencies in SOA formation between two modules against ground measurement, we found significant discrepancy between the two modules. The M/V (M/S) simulated overestimation (underestimation) against ground measurements by around ~5 factor. However, compared with non-surface (DC-8 aircraft) measurements, M/V still underestimated OC against DC-8 measurements to some degree, whereas M/S significantly underestimated OC against DC-8 measurements by approximately five times for both LRT and STG cases. However, our analysis overall showed that M/V significantly improved the vertical profiles of OC over the regions around the Korean Peninsula (not shown), and the Q-Q plot for OC showed that the maximum DC-8 measurement of OC was reasonably simulated by approximately 90% by M/V module for both the STG and LRT cases, leading to much better agreement with the non-surface OC (DC-8 aircraft) measurements, during the KORUS-AQ campaign period.
In summary, our results from both surface (ground) and non-surface OC evaluations imply that the secondary aerosol formation process simulated by M/V module updated by Ahmadov et al. [21] is also applicable, overall with no particular biases, in the atmosphere (in the non-surface atmosphere in particular) over Northeast Asia. Nevertheless, compared with ground observations, M/V exhibited an overprediction of OC (by up to 170–180%), and M/S underpredicted (by up to 49–65%) against surface measurements, as seen in Figure 3 and 4. Therefore, more robust M/V assessment against ground measurements, particularly based on more detailed in situ ground measurements in various areas over the Northeast Asia, would be required.

5. Summary and Conclusions

Atmospheric chemistry models have traditionally underpredicted observed OA concentrations, possibly due to the lack of key precursors and processes involved in SOA production. We conducted model simulations with two different organic aerosol modules to evaluate the PM2.5 mass concentrations for overall verification in Seoul, South Korea. In this study, organic aerosol module-driven inconsistencies between MADE/VBS and MADE/SORGAM in the WRF-Chem simulation of PM2.5 mass concentrations and its chemical components were analyzed over Northeast Asia; in addition, the causes of the discrepancies between the modules were investigated, with a focus on the secondary OC aerosol formation process by the two modules during the KORUS-AQ period. By comparing the difference between the two models, together with a comparison of the ground measurement data from Seoul and KORUS-AQ DC-8 aircraft measurements, we assessed the capabilities of the aerosol module to simulate secondary aerosol concentrations.
The results showed that both surface and non-surface PM2.5 mass and OC components simulated by the two modules had significant inconsistencies. The disparity in gas concentrations between the two simulations was found to have no particular biases, whereas the PM2.5 mass concentrations showed large discrepancies. From the comparison of model results against in situ ground measurements, MADE/VBS simulated relatively higher PM2.5 mass concentrations than MADE/SORGAM by a factor of 1.35–1.4. Of the four speciated chemical compounds, SO42−, NO3, NH4+, and OC, the largest bias was found in OC. Compared with surface observations at two ground sites located near the western coastal Korean Peninsula, MADE/VBS exhibited an overprediction in OC by 170–180%, whereas MADE/SORGAM underpredicted by 49–65%. However, for the assessment against non-surface (DC-8 aircraft) measurements, MADE/VBS again simulated values higher than MADE/SORGAM for both periods dominated by local and long-range transport processes, by a factor of approximately five, leading to much better agreement with the non-surface OC (DC-8 aircraft) measurements during the KORUS-AQ campaign period. Nevertheless, more elaborate assessment on the surface OC simulation performance would be needed to improve the ground results.
Our results suggest that the air quality simulation over South Korea, in particular, SOA, can be expected to be simulated by MADE/VBS with good agreement with the measurements particularly in the non-surface atmosphere. However, our study is a sensitivity test for a limited period, requiring long-term analysis. Furthermore, several key uncertainties remain in SOA formation and in meteorological and loss mechanisms, which are characterized through both the atmospheric SOA budget analysis and further meteorological perturbation simulations, including dry and wet deposition during the VOC oxidation processes. In addition, an aggregated analysis study on biogenic VOC emissions updated SOA yields, and aging mechanism results for biogenic SOA would be needed for improved simulation of aerosol over Northeast Asia. Observations, especially long-term ones, are also indispensable in the model evaluation. Therefore, OC measurements that are at least hourly averaged from different regions would be most beneficial for model evaluation and analysis of data. In addition, the model discrepancies are interrelated between meteorology and chemistry, including VOC volatility treatment; therefore, a well-designed field experiment under strict conditions would be highly beneficial for revealing the complexity of OC components to understand the key controlling processes; these results are expected to play a key role in the forecasting of regional air quality and policymaking over Northeast Asia.

Supplementary Materials

The following are available online at https://www.mdpi.com/2073-4433/11/9/1004/s1, Table S1: Performance statistics of the WRF-Chem simulation for 2 m temperatures, 10 m wind speeds and relative humidity at Seoul and Baengnyeongdo, Figure S1: Spatial distributions of DC-8 observation and WRF-Chem results for OC and toluene concentrations along the DC-8 flight paths during STG cases (4 stagnant–dominant cases: 17, 18, 20 and 22 May 2016) and LRT cases (4 long–range transport dominant cases: 25, 26, 30 and 31 May 2016).

Author Contributions

Conceptualization, H.-J.L. and C.-H.K.; Data curation, H.-Y.J., S.-Y.P., and Y.-J.J.; Formal analysis, H.-Y.J., and Y.-J.J.; Investigation, C.-K.S.; Methodology, C.-K.S.; Visualization, S.-Y.P.; Writing—Original draft, H.-J.L.; Writing—Review and editing, C.-H.K. All authors have read and agreed to the published version of the manuscript.

Funding

This research was supported by the Basic Science Research Program through the National Research Foundation of Korea (NRF) funded by the Ministry of Education (2020R1A6A1A03044834 and 2019R1I1A1A01060445).

Acknowledgments

The authors wish to thank to Ravan Ahmadov at the National Oceanic and Atmospheric Administration for assistance in the interpretation of the volatility basis set (VBS) and its codes in WRF-Chem model. The authors are grateful to three reviewers for their thoughtful and constructive comments.

Conflicts of Interest

The authors declare no conflict of interest.

References

  1. Park, R.J.; Kim, S.-W. Air quality modeling in East Asia: Present issues and future directions. Asia-Pac. J. Atmos. Sci 2014, 50, 105–120. [Google Scholar] [CrossRef]
  2. Binkowski, F.S.; Roselle, J. Models-3 Community Multiscale Air Quality (CMAQ) model aerosol component: 1. Model description. J. Geophys. Res. 2003, 108, 4183. [Google Scholar] [CrossRef]
  3. Yang, G.-H.; Jo, Y.-J.; Lee, H.-J.; Song, C.-K.; Kim, C.-H. Numerical Sensitivity Tests of Volatile Organic Compounds Emission to PM2.5 Formation during Heat Wave Period in 2018 in Two Southeast Korean Cities. Atmosphere 2020, 11, 331. [Google Scholar] [CrossRef] [Green Version]
  4. Jo, Y.-J.; Lee, H.-J.; Jo, H.-Y.; Woo, J.-H.; Kim, Y.; Lee, T.; Heo, G.; Park, S.-M.; Jung, D.; Park, J.; et al. Changes in inorganic aerosol compositions over the Yellow Sea area from impact of Chinese emissions mitigation. Atmos. Res. 2020, 240, 104948. [Google Scholar] [CrossRef]
  5. Jo, H.-Y.; Lee, H.-J.; Jo, Y.-J.; Lee, J.-J.; Ban, J.-L.; Chang, L.-S.; Heo, G.; Kim, C.-H. Nocturnal fine particulate nitrate formation by N2O5 heterogeneous chemistry in Seoul Metropolitan Area, Korea. Atmos. Res. 2019, 225, 58–69. [Google Scholar] [CrossRef]
  6. Lee, H.-J.; Jo, H.-Y.; Park, S.-Y.; Jo, Y.-J.; Jeon, W.; Ahn, J.-Y.; Kim, C.-H. A case study of the transport/transformation of air pollutants over the Yellow Sea during the MAPS 2015 campaign. J. Geophys. Res. Atmos. 2019, 124, 6532–6553. [Google Scholar] [CrossRef]
  7. Bhave, P.V.; Pouliot, G.A.; Zheng, M. Diagnostic Model Evaluation for Carbonaceous PM2.5 Using Organic Markers Measured in the Southeastern U.S. Environ. Sci. Technol. 2007, 41, 1577–1583. [Google Scholar] [CrossRef]
  8. Carlton, A.G.; Bhave, P.V.; Napelenok, S.L.; Edney, E.O.; Sarwar, G.; Pinder, R.W.; Houyoux, M. Model Representation of Secondary Organic Aerosol in CMAQv4.7. Environ. Sci. Technol. 2010, 44, 8553–8560. [Google Scholar] [CrossRef]
  9. Henze, D.K.; Seinfeld, J.H. Global secondary organic aerosol from isoprene oxidation. Geophys. Res. Lett. 2006, 33, L09812. [Google Scholar] [CrossRef] [Green Version]
  10. Zhang, Q.; Jimenez, J.L.; Canagaratna, M.R.; Allan, J.D.; Coe, H.; Ulbrich, I.; Alfarra, M.R.; Takami, A.; Middlebrook, A.M.; Suni, Y.L.; et al. Ubiquity and dominance of oxygenated species in organic aerosols in anthropogenically-influenced Northern Hemisphere midlatitudes. Geophys. Res. Lett. 2007, 34, L13801. [Google Scholar] [CrossRef] [Green Version]
  11. Yu, S.; Bhave, P.V.; Dennis, R.L.; Mathur, R. Seasonal and Regional Variations of Primary and Secondary Organic Aerosols over the Continental United States:  Semi-Empirical Estimates and Model Evaluation. Environ. Sci. Technol. 2007, 41, 4690–4697. [Google Scholar] [CrossRef] [PubMed]
  12. Qin, M.; Wang, X.; Hu, Y.; Huang, X.; He, L.; Zhong, L.; Song, Y.; Hu, M.; Zhang, Y. Formation of particulate sulfate and nitrate over the pearl river delta in the fall: Diagnostic analysis using the community multiscale air quality model. Atmos. Environ. 2015, 112, 81–89. [Google Scholar] [CrossRef]
  13. Zhou, G.; Xu, J.; Xie, Y.; Chang, L.; Gao, W.; Gu, Y.; Zhou, J. Numerical air quality forecasting over eastern China: An operational application of WRF-Chem. Atmos. Environ. 2017, 153, 94–108. [Google Scholar] [CrossRef]
  14. Han, Z.; Xie, Z.; Wang, G.; Zhang, R.; Tao, J. Modeling organic aerosols over east China using a volatility basis-set approach with aging mechanism in a regional air quality model. Atmos. Environ. 2016, 124, 186–198. [Google Scholar] [CrossRef]
  15. Heald, P.C.; Schladow, S.G.; Allen, B.C.; Reuter, J.E. VOC Loading from Marine Engines to a Multiple–use Lake. Lake Reserv. Manag. 2005, 21, 30–38. [Google Scholar] [CrossRef]
  16. Volkamer, R.; Jimenez, J.L.; Martini, F.S.; Dzepina, K.; Zhang, Q.; Salcedo, D.; Molina, L.T.; Worsnop, D.R.; Molina, M.J. Secondary organic aerosol formation from anthropogenic air pollution: Rapid and higher than expected. Geophys. Res. Lett. 2006, 33, L17811. [Google Scholar] [CrossRef] [Green Version]
  17. Pun, B.K.; Seigneur, C. Investigative modeling of new pathways for secondary organic aerosol formation. Atmos. Chem. Phys. 2007, 7, 2199–2216. [Google Scholar] [CrossRef] [Green Version]
  18. Hodzic, A.; Jimenez, J.L.; Madronich, S.; Canagaratna, M.R.; DeCarlo, P.F.; Kleinman, L.; Fast, J. Modeling organic aerosols in a megacity: Potential contribution of semi-volatile and intermediate volatility primary organic compounds to secondary organic aerosol formation. Atmos. Chem. Phys. 2010, 10, 5491–5514. [Google Scholar] [CrossRef] [Green Version]
  19. Tsimpidi, A.P.; Karydis, V.A.; Zavala, M.; Lei, W.; Molina, L.; Ulbrich, I.M.; Jimenez, J.L.; Pandis, S.N. Evaluation of the volatility basis-set approach for the simulation of organic aerosol formation in the Mexico City metropolitan area. Atmos. Chem. Phys. 2010, 10, 525–546. [Google Scholar] [CrossRef] [Green Version]
  20. Donahue, N.M.; Robinson, A.L.; Stanier, C.O.; Pandis, S.N. Coupled partitioning, dilution, and chemical aging of semivolatile organics. Environ. Sci. Technol. 2006, 40, 2635–2643. [Google Scholar] [CrossRef]
  21. Ahmadov, R.; McKeen, S.A.; Robinson, A.L.; Bahreini, R.; Middlebrook, A.M.; De Gouw, J.A.; Trainer, M. A volatility basis set model for summertime secondary organic aerosols over the eastern United States in 2006. J. Geophys. Res. 2012, 117, D06301. [Google Scholar] [CrossRef]
  22. Kim, C.-H.; Lee, H.-J.; Kang, J.-E.; Jo, H.-Y.; Park, S.-Y.; Jo, Y.-J.; Lee, J.-J.; Yang, G.-H.; Park, T.; Lee, T. Meteorological overview and signatures of long-range transport processes during the MAPS-Seoul 2015 campaign. Aerosol Air Qual. Res. 2018, 18, 2173–2184. [Google Scholar] [CrossRef] [Green Version]
  23. Park, S.-Y.; Lee, H.-J.; Kang, J.-E.; Lee, T.; Kim, C.-H. Aerosol radiative effects on mesoscale cloud–precipitation variables over Northeast Asia during the MAPS-Seoul 2015 campaign. Atmos. Environ. 2018, 172, 109–123. [Google Scholar] [CrossRef]
  24. Grell, G.A.; Peckham, S.E.; McKeen, S.; Schmitz, R.; Frost, G.; Skamarock, W.C.; Eder, B. Fully coupled “online” chemistry within the WRF model. Atmos. Environ. 2005, 39, 6957–6975. [Google Scholar] [CrossRef]
  25. Wang, T.; Jiang, F.; Deng, J.; Shen, Y.; Fu, Q.; Wang, Q.; Fu, Y.; Xu, J.; Zhang, D. Urban air quality and regional haze weather forecast for Yangtze River Delta region. Atmos. Environ. 2012, 58, 70–83. [Google Scholar] [CrossRef]
  26. Skamarock, W.C.; Klemp, J.B. A time-split nonhydrostatic atmospheric model for weather research and forecasting applications. J. Comput. Phys. 2008, 227, 3465–3485. [Google Scholar] [CrossRef]
  27. Kim, S.-W.; Heckel, A.; Frost, G.J.; Richter, A.; Gleason, J.; Burrows, J.P.; McKeen, S.; Hsie, E.-Y.; Granier, C.; Trainer, M. NO2 columns in the western United States observed from space and simulated by a regional chemistry model and their implications for NOx emissions. J. Geophys. Res. 2009, 114, D11301. [Google Scholar] [CrossRef] [Green Version]
  28. Stockwell, W.R.; Kirchner, F.; Kuhn, M.; Seefeld, S. A new mechanism for regional atmospheric chemistry modeling. J. Geophys. Res. 1997, 102, 25847–25879. [Google Scholar] [CrossRef] [Green Version]
  29. Sander, S.P.; Golden, D.M.; Kurylo, M.J.; Moortgat, G.K.; Wine, P.H.; Ravishankara, A.R.; Kolb, C.E.; Molina, M.J.; Finlayson-Pitts, B.J.; Huie, R.E.; et al. Chemical Kinetics and Photochemical Data for Use in Atmospheric Studies: Evaluation Number 15; Jet Propulsion Laboratory: Pasadena, CA, USA, 2006.
  30. Tyndall, G.S.; Cox, R.A.; Granier, C.; Lesclaux, R.; Moortgat, G.K.; Pilling, M.J.; Ravishankara, A.R.; Wallington, T.J. The atmospheric chemistry of small organic peroxy radicals. J. Geophys. Res. 2001, 106D, 12157–12182. [Google Scholar] [CrossRef]
  31. Orlando, J.J.; Tyndall, G.S.; Bertman, S.B.; Chen, W.; Burkholder, J.B. Rate coefficient for the reaction of OH with CH2=C(CH3)C(O)OONO2 (MPAN). Atmos. Environ. 2002, 36, 1895–1900. [Google Scholar] [CrossRef]
  32. Schell, B.; Ackermann, I.J.; Hass, H.; Binkowski, F.S.; Ebel, A. Modeling the formation of secondary organic aerosol within a comprehensive air quality modeling system. J. Geophys. Res. 2001, 106, 28275–28293. [Google Scholar] [CrossRef]
  33. Odum, J.R.; Hoffmann, T.; Bowman, F.; Collins, D.; Flagan, R.C.; Seinfeld, J.H. Gas/particle partitioning and secondary organic aerosol yields. Environ. Sci. Technol. 1996, 30, 2580–2585. [Google Scholar] [CrossRef]
  34. Saxena, P.; Hudischewskyj, A.B.; Seigneur, C.; Seinfeld, J.H. A comparative study of equilibrium approaches to the chemical characterization of secondary aerosols. Atmos. Environ. 1986, 20, 1471–1483. [Google Scholar] [CrossRef]
  35. Binkowski, F.S.; Shankar, U. The regional particulate matter model: 1. mode description and preliminary results. J. Geophys. Res. 1995, 100, 26191–26209. [Google Scholar] [CrossRef]
  36. Hutzell, W.T.; Luecken, D.J.; Appel, K.W.; Carter, W.P.L. Interpreting predictions from the SAPRC07 mechanism based on regional and continental simulations. Atmos. Environ. 2012, 46, 417–429. [Google Scholar] [CrossRef]
  37. Murphy, B.N.; Pandis, S.N. Simulating the formation of semivolatile primary and secondary organic aerosol in a regional chemical transport model. Environ. Sci. Technol. 2009, 43, 4722–4728. [Google Scholar] [CrossRef]
  38. Jayne, J.T.; Leard, D.C.; Zhang, X.; Davidovits, P.; Smith, K.A.; Kolb, C.E.; Worsnop, D.R. Development of an Aerosol Mass Spectrometer for Size and Composition Analysis of Submicron Particles. J. Aerosol Sci. 2000, 33, 49–70. [Google Scholar] [CrossRef] [Green Version]
  39. Jimenez, J.L.; Jayne, J.T.; Shi, Q.; Kolb, C.E.; Worsnop, D.R.; Yourshaw, I.; Seinfeld, J.H.; Flagan, R.C.; Zhang, X.; Smith, K.A.; et al. Ambient aerosol sampling using the Aerodyne Aerosol Mass Spectrometer. J. Geophys. Res. 2003, 108, 8425. [Google Scholar] [CrossRef] [Green Version]
  40. Drewnick, F.; Hings, S.S.; DeCarlo, P.; Jayne, J.T.; Gonin, M.; Fuhrer, K.; Weimer, S.; Jimenez, J.L.; Demerjian, K.L.; Borrmann, S.; et al. A New Time-of-Flight Aerosol Mass Spectrometer (TOF-AMS)—Instrument Description and First Field Deployment. J. Aerosol Sci. 2005, 39, 637–658. [Google Scholar] [CrossRef]
  41. DeCarlo, P.F.; Kimmel, J.R.; Trimborn, A.; Northway, M.J.; Jayne, J.T.; Aiken, A.C.; Gonin, M.; Fuhrer, K.; Horvath, T.; Docherty, K.S.; et al. Field-Deployable, High-Resolution, Time-of-Flight Aerosol Mass Spectrometer. Anal. Chem. 2006, 78, 8281–8289. [Google Scholar] [CrossRef]
  42. Canagaratna, M.R.; Jayne, J.T.; Jimenez, J.L.; Allan, J.D.; Alfarra, M.R.; Zhang, Q.; Onasch, T.B.; Drewnick, F.; Coe, H.; Middlebrook, A.; et al. Chemical and microphysical characterization of ambiente aerosols with the Aerodyne aerosol mass spectrometer. Mass Spectrom. Rev. 2007, 26, 185–222. [Google Scholar] [CrossRef] [PubMed]
  43. Kurokawa, J.; Ohara, T.; Morikawa, T.; Hanayama, S.; Janssens Maenhout, G.; Fukui, T.; Kawashima, K.; Akimoto, H. Emissions of air pollutants and greenhouse gases over Asian regions during 2000–2008: Regional Emission inventory in ASia(REAS) version 2. Atmos. Chem. Phys. 2013, 13, 11019–11058. [Google Scholar] [CrossRef] [Green Version]
  44. Lee, D.G.; Lee, Y.M.; Jang, K.W.; Yoo, C.; Kang, K.H.; Lee, J.H.; Hong, J.H. Korean national emissions inventory system and 2007 air pollutant emissions. Asian J. Atmos. Environ. 2011, 5, 278–291. [Google Scholar] [CrossRef] [Green Version]
  45. Woo, J.-H.; Choi, K.-C.; Kim, H.K.; Baek, B.H.; Jang, M.; Eum, J.-H.; Song, C.H.; Ma, Y.-L.; Sunwoo, Y.; Chang, L.-S.; et al. Development of an anthropogenic emissions processing system for Asia using SMOKE. Atmos. Environ. 2012, 58, 5–13. [Google Scholar] [CrossRef]
  46. Jang, Y.; Lee, Y.; Kim, J.; Kim, Y.; Woo, J.-H. Improvement China Point Source for Improving Bottom-Up Emission Inventory. Asia-Pac. J. Atmos. Sci. 2019. [Google Scholar] [CrossRef]
  47. Oak, Y.J.; Park, R.J.; Schroeder, J.R.; Crawford, J.H.; Blake, D.R.; Weinheimer, A.J.; Woo, J.H.; Kim, S.W.; Yeo, H.; Fried, A.; et al. Evaluation of simulated O3 production efficiency during the KORUS-AQ campaign: Implications for anthropogenic NOx emissions in Korea. Elem. Sci. Anth. 2019. [Google Scholar] [CrossRef]
  48. Choi, J.; Park, R.J.; Lee, H.-M.; Lee, S.; Jo, D.S.; Jeong, J.I.; Henze, D.K.; Woo, J.-H.; Ban, S.-J.; Lee, M.-D.; et al. Impacts of local vs. Trans-boundary emissions from different sectors on PM2.5 exposure in South Korea during the KORUS-AQ campaign. Atmos. Environ. 2019, 203, 196–205. [Google Scholar] [CrossRef]
  49. Peterson, D.A.; Hyer, E.J.; Han, S.-O.; Crawford, J.H.; Park, R.J.; Holz, R.; Kuehn, R.E.; Eloranta, E.; Knote, C.; Jordan, C.E.; et al. Meteorology influencing springtime air quality, pollution transport, and visibility in Korea. Elem. Sci. Anth. 2019, 7, 57. [Google Scholar] [CrossRef]
  50. Emery, C.; Liu, Z.; Russell, A.G.; Odman, M.T.; Yarwood, G.; Kumar, N. Recommendations on statistics and benchmarks to assess photochemical model performance. J. Air Waste Manag. Assoc. 2017, 67, 582–598. [Google Scholar] [CrossRef] [Green Version]
  51. Choi, M.W.; Lee, J.H.; Woo, J.W.; Kim, C.H.; Lee, S.H. Comparison of PM2.5 Chemical Components over East Asia Simulated by the WRF-Chem and WRF/CMAQ Models: On the Models’ Prediction Inconsistency. Atmosphere 2019, 10, 618. [Google Scholar] [CrossRef] [Green Version]
  52. Lim, K.S.; Hong, S.-Y. Development of an Effective Double Moment Cloud Microphysics Scheme with Prognostic Cloud Condensation Nuclei (CCN) for Weather and Climate Models. Mon. Weather Rev. 2010, 138, 1587–1612. [Google Scholar] [CrossRef] [Green Version]
  53. Lim, K.S.S.; Fan, J.W.; Leung, R.; Ma, P.L.; Singh, B.; Zhao, C.; Zhang, Y.; Zhang, G.; Song, X.L. Investigation of aerosol indirect effects using a cumulus microphysics parameterization in a regional climate model. J. Geophys. Res. Atmos. 2014, 119, 906–926. [Google Scholar] [CrossRef]
Figure 1. Primary PM2.5 emissions averaged for May 2016 and three nested domains used in WRF-Chem simulations, i.e., (a) D01 (27-km grid spacing for Northeast Asia), (b) D02 (9-km grid spacing for Korean Peninsula), and (c) D03 (3-km grid spacing for South Korea), and the locations of two monitoring sites, i.e., Seoul-Bulgwang (urban) and Baengnyeongdo (background) sites used for 4 chemical components, i.e., SO42−, NO3, NH4+, and OC in this study. The green and blue circles in D03 domain, respectively, indicate the locations at which the meteorological observation data and aerosol concentration data were measured to verify the model simulations.
Atmosphere 11 01004 g001
Figure 2. Time series of hourly mean PM2.5 concentrations observed in (a) 25 urban sites located within Seoul metropolitan area (SMA) and (b) Baengnyeongdo (background) site in South Korea. The locations of these 25 sites over SMA are shown in (c). The 25 and 75 percentiles are denoted as grey in SMA. Modeling results in (a,b) from two modules, Modal Aerosol Dynamics model for Europe/Volatility Basis Set (MADE/VBS) and Modal Aerosol Dynamics model for Europe/Secondary Organic Aerosol Model (MADE/SORGAM), were also denoted in red and blue, respectively.
Atmosphere 11 01004 g002
Figure 3. Time series of daily mean PM2.5 mass, and its chemical components, SO42−, NO3, NH4+, and OC concentrations observed in (a) Seoul-Bulgwang and (b) Baengnyeongdo sites for May 2016 including two periods, stagnant (STG) and long-range transport (LRT) periods. Modeling results from two modules: MADE/VBS (red) and MADE/SORGAM (blue) were also denoted.
Atmosphere 11 01004 g003
Figure 4. (a) Horizontal distributions of PM2.5 mass concentrations observed from 261 national sites, and two simulation results; (b) PM2.5 mass and 4 chemical components concentrations, SO4+, NO3, NH4+, and OC, simulated from two modules, MADE/VBS and MADE/SORGAM, in South Korea.
Atmosphere 11 01004 g004
Figure 5. Comparisons of horizontal PM2.5 distributions of surface concentrations (a,b), and column-integrated concentrations (c,d) from two modules, MADE/VBS and MADE/SORGAM, respectively.
Atmosphere 11 01004 g005
Figure 6. Comparisons of horizontal distributions for sulfate (a,b), SO2 gas concentrations (c,d), and differences (e,f) between two modules, MADE/VBS (left panel) and MADE/SORGAM (right panel), for sulfate (SO42−) and SO2, respectively.
Atmosphere 11 01004 g006
Figure 7. Comparisons of horizontal distributions for nitrate (a,b), NO2 gas concentrations (c,d), and differences (e,f) between two modules, MADE/VBS and MADE/SORGAM, for nitrate (NO3) and NO2, respectively.
Atmosphere 11 01004 g007
Figure 8. Comparisons of horizontal distributions for ammonium (a,b), NH3 gas concentrations (c,d), and differences (e,f) between two modules, MADE/VBS and MADE/SORGAM, for ammonium (NH4+) and NH3, respectively.
Atmosphere 11 01004 g008
Figure 9. Comparisons of horizontal distributions for organic carbon (a,b), toluene gas concentrations (c,d), and differences (e,f) between two modules, MADE/VBS and MADE/SORGAM, for organic carbon (OC) and toluene, respectively.
Atmosphere 11 01004 g009
Figure 10. Comparisons of horizontal distributions for column-integrated species from two different aerosol modules. (a) SO42−; (b) NO3; (c) NH4+; (d) OC; and differences between two modules, MADE/VBS and MADE/SORGAM. Shown are results from MADE/VBS (left panel), MADE/SORGAM (middle panel), and differences between two modules (right panel).
Atmosphere 11 01004 g010
Figure 11. (a) NASA DC-8 flight pathways of 4 stagnant-dominant cases (17, 18, 20, and 22 May 2016) during the Korea-United States Air Quality (KORUS-AQ) campaign; (b) Quantile-Quantile plots for KORUS-AQ DC-8 aircraft PM1 measurements vs. WRF-Chem results for SO42−, NO3, NH4+, and OC, simulated from two aerosol modules, MADE/VBS and MADE/SORGAM, respectively, over the stagnant-dominant period (16 May–21 May) during the KORUS-AQ campaign.
Atmosphere 11 01004 g011
Figure 12. (a) NASA DC-8 flight pathways of 4 long-range transport dominant cases (25, 26, 30, and 31 May 2016) during the KORUS-AQ campaign; (b) Quantile-Quantile plots for KORUS-AQ DC-8 aircraft PM1 measurements vs. WRF-Chem results for SO42−, NO3, NH4+, and OC, simulated from two aerosol modules, MADE/VBS and MADE/SORGAM, respectively, over the long-range transport dominant period (25–31 May) during the KORUS-AQ campaign.
Atmosphere 11 01004 g012
Table 1. Weather Research and Forecasting model coupled with Chemistry (WRF-Chem) configuration.
WRF-Chem Version3.8.1
Horizontal resolution27 km, 9 km, 3 km
Vertical layer29
IC/BC conditionUM global forecasting data (25 km)
MicrophysicsLin et al. scheme
Longwave radiationRapid radiative transfer mode (RRTM) scheme
Shortwave radiationGoddard shortwave scheme
Cumulus parameterizationGrell 3D ensemble scheme
Planetary boundary layerYSU scheme
Gas chemistryNOAA/ESRL RACM chemistry
Aerosol chemistry(1) MADE/VBS aerosols using KPP library
(2) MADE/SORGAM aerosol using KPP library
Table 2. Summary statistics for comparison between WRF-Chem simulations and observed PM2.5, OC, SO42−, NO3, and NH4+ concentrations at Seoul-Bulgwang and Baengnyeongdo for 1–31 May 2016.
SpeciesStatistical
Parameters
Seoul-BulgwangBaengnyeongdo
MADE/VBSMADE/SORGAMMADE/VBSMADE/SORGAM
PM2.5Mean28.8521.3325.6617.80
R0.650.620.560.55
IOA0.810.740.740.67
FB−8.67−38.34−0.98−35.88
RMSE17.3218.7216.4317.17
MB−1.22−8.740.04-7.82
NMB−0.04−0.290.00-0.31
NME0.440.470.460.48
SO42−Mean6.724.457.593.93
R0.760.740.400.51
IOA0.860.740.610.53
FB16.97−18.0431.25−15.72
RMSE 3.954.716.816.06
MB0.34−1.931.22−2.44
NMB0.05−0.300.19−0.38
NME0.480.480.760.61
NO3Mean8.118.185.906.96
R0.560.580.490.53
IOA0.730.730.640.63
FB3.99−4.0761.3759.08
RMSE7.407.535.596.35
MB2.42.52.603.66
NMB0.420.440.791.11
NME0.930.951.191.41
NH4+Mean4.884.064.543.49
R0.710.700.560.58
IOA0.830.830.720.74
FB23.421.3943.2317.48
RMSE3.012.773.242.76
MB0.950.121.200.14
NMB0.240.030.360.04
NME0.570.530.720.59
OCMean7.032.525.741.62
R0.300.140.400.25
IOA0.460.420.520.48
FB56.76−26.6444.03−61.66
RMSE5.303.384.082.73
MB3.13−1.382.40−1.72
NMB0.80−0.350.72−0.51
NME1.040.520.910.57

