Droplet Fate in a Cough Puff


Istituto di Scienze dell’Atmosfera e del Clima, Consiglio Nazionale delle Ricerche, 73100 Lecce, Italy
Atmosphere 2020, 11(8), 841; https://doi.org/10.3390/atmos11080841
Submission received: 9 July 2020
/
Revised: 5 August 2020
/
Accepted: 6 August 2020
/
Published: 9 August 2020
(This article belongs to the Special Issue Advances in Chemical Contaminants and Biological Droplets Dispersion into Indoor Environment)
Abstract
:The dynamic and thermodynamic evolution of droplets, in a size range characterizing a cough, has been analysed using basic equations of motion and coupled to the evolution of a spherical cloud puff in which they are supposed to be expired. It has been found that the maximum contamination range of the emitted droplets is controlled by two different mechanisms: surface evaporation and inertia-gravitational settling—with a switching threshold between them for a radius around a few tens of microns. For the smallest droplets, the environmental conditions (the temperature and humidity) are found to be very effective in determining the contamination range, even for weak entrainment in the cloud puff. This last fact could be of some relevance in the seasonal behaviour of air-borne epidemics.
1. Introduction
The recent COVID-19 pandemic, which has an air-borne transmission through expired contaminated droplets, has stimulated new attention for the travel range of expiration acts and coughs, in order to estimate the potential contamination ranges and promote safe distances among people [1,2]. In 1934, W.F. Wells showed that air-borne infections can be achieved by two different routes that depend on the droplet’s size; while larger droplets, with a consistent inertia, can be expelled with a consistent speed in coughing or sneezing (but are subjected to a quick gravitational settling), smaller droplets tend to keep fluctuating in the expired puff due to their small inertia and negligible fallout [3]. This pointed out the importance of the smallest droplets and residual droplet nuclei in air-borne disease transmission, and several authors now restrict the meaning of “air-borne” just to transmission by aerosol nuclei and/or smallest fluctuating droplets. Indeed, influenza viruses have typical dimensions of 100–1000 nm, thus are possibly transported by small drops down to about a 1 μm radius, and even smaller aerosol nuclei, which are residuals of the droplets’ evaporation. Therefore, the dynamics of droplets of different sizes in an expiratory cloud are of importance in understanding the capability of the transmission of infections. Bourouiba et al. [4] used a multiphase model to study the dynamics of medium–large droplets (50–700 μm diameter) ejected in violent coughing/sneezing events. Their theoretical model is based on a multiphase cloud, including entrainment and buoyancy effects, and found a monotonic decrease in the fallout distance with the droplet size, while the maximum horizontal contamination length had a non-monotonic behaviour with a minimum around a diameter (between 100 and 200 μm), due to the competing effects of increased inertia, which enhanced the horizontal path length for larger droplets, and decreased gravitational settling, for smaller droplets. However, the actual behaviour of a gas-droplet’s cloud still deserves attention because of thermodynamic aspects that mainly affect the smallest droplets [5]. They are embedded in a moist-warm gas cloud that undergoes a mixing with the ambient air, thus affecting the evaporation of the droplets and, consequently, their mass reduction during motion. It is commonly, but somehow arbitrarily, assumed in medical literature that a cutoff droplet radius of about 10–20 μm marks the transition from a liquid-droplet to an aerosol-nuclei transmission of epidemics [5]. This thermodynamic aspect also has implications for the epidemic seasonality characteristics. Several studies try to establish statistical correlations between the COVID-19 epidemic spreading and the environmental temperature and specific (absolute) humidity—yet without a definitive answer, despite the seasonal cycle of the influenza epidemic being well known [6,7]. Without entering into the biological and medical aspects of the virus’ survival in droplets and/or aerosol nuclei, which also has implications for air pollution and the epidemic spreading [8,9], the relationship between the ambient temperature, humidity, and life-time and contamination range of the droplets is still an interesting question.
The fate of the droplets expelled in a cough puff is estimated here using a simple model, based on the basic equations of motion. A droplet and spherical puff of air with water vapour close to saturation are supposed to be emitted together, with an initial speed that is representative of a cough. The aim is to estimate the droplet fate in relation to the contamination ranges of different drop sizes and their transition to aerosol nuclei by evaporation in temperature and humidity conditions that are representative of seasonal changes in the temperate regions of the planet.
2. Methodology
The main tools of the study are the dynamical equations of motion for a puff and a droplet emitted in a cough. The ingredients of the dynamical equations are the viscous–turbulent stress and the gravity–buoyancy forces. In addition, both the elements are variable mass systems—one depending on evaporation caused by the water vapour diffusion and the other depending on the turbulent entrainment of ambient air from the surrounding environment.
The dynamical equation for the velocity (v) of a system of variable mass (m) at time (t) is:
where vm is the speed of the matter exchanged by the system and F is the total external force.
m dv/dt = F + (vm − v) dm/dt
For the droplet, F is composed of the drag force Fv and the gravity mg. Evaporating particles are supposed to uniformly leave the whole spherical surface of the droplet, so that their resulting speed, with respect to the droplet, vanishes by symmetry, vm − v = 0, and the last term vanishes in Equation (1). The expression for Fv = 0.5Cd ρa v2π r2 with Cd = (24/Re) (1 + 0.17 Re0.66) and the Reynolds number Re = 2(vr/μ) has been used. It has a range of validity that fits the droplets’ speeds and sizes in this study ([10], p. 111). With m = (4/3) π ρw r3 and after straightforward algebra, Equation (1) becomes:
with the correction term G(Re) = (1 + 0.17 Re0.66); μ, the kinematic viscosity of air; and ρ, the density, with the subscripts w, a, v, and p indicating, respectively, liquid water, ambient air, water vapour, and the puff for all variables. Equation (2) can be used for both the vertical and horizontal directions (with g = 0). Note that for the Equation (2) to be formally correct, the droplet speed v is to be always calculated with respect to the surrounding fluid. (The application of a modified form of (2) during the time the droplet is travelling inside the moving puff, instead of the ambient (still) air, is exposed at the end of this section).
dv/dt = −(9/2) μ G(Re) (ρa/ρw) v/r2 + g
The droplet radius r changes in time because of the evaporation by surface diffusion of the water vapour. The diffusion equation for a liquid droplet (in a steady environment) is well known [11], and the rate of change of the radius r can be written as:
where Tp is the actual temperature of the puff, Δhp = hs(Tp) − hp is the saturation humidity deficit in the puff, and hs(Tp) is its saturation specific humidity. L, Dv, and k are the latent vaporization heat of water, the diffusivity of water vapour in air, and the air thermal conductivity, respectively.
r dr/dt = (1/2) dr2/dt = [Dw Δhp ρa/ρw ]/[1 + (L Dw/k) dhs(Tp)/dT)]
For the constant Δhp Tp and G, Equations (2) and (3) have an analytical solution that reads (for s(0) = 0):
where A = (9/2) Gμρa, B = ρwr2(0), C = 2[Dv Δhp ρa]/[1+ (L Dv/k) dhs(Tp)/dT)], and M(t) = 1-(C/B)t is the percent residual mass of the drop at time t for 0< t < B/C, B/C, which represents the evaporation time. It is easy to verify that v(t) tends to the Stokes equilibrium velocity for C → 0 and t >> B/A, B/A representing the velocity relaxation time.
v(t) = [g B/(A-C)] [1 − (C/B) t − (1 − (C/B) t)A/C ] + v(0)(1 − (C/B) t)A/C
s(t) = ∫ vdt = [g B/(A-C)] [ t M(t) + (B/C) (M(t) (1 + A/C) − 1)/(1 + A/C) ]
− v(0) (B/C) [ M(t) (1 + A/C)− 1]/(1 + A/C)
− v(0) (B/C) [ M(t) (1 + A/C)− 1]/(1 + A/C)
However, in general, the conditions surrounding the drop actually vary with the evolution of the embedding puff. In the simplest model, the puff can be described as a close-to-saturation air-vapour ball of radius R travelling with speed V and entraining resting air from the outside environment. Then, in Equation (1), vm = 0, the drag force Fv has the same form as above, while dm/dt = 4πρaR2dR/dt, with the puff radius R that increases due to the entrainment (here, the small variations of ρa because of its variable water vapour content have been neglected for simplicity). The entrainment can be described as a cloud growth produced by turbulent diffusion, which means dR2(t)/dt~2 K where K is the turbulent diffusion coefficient, and K~β R U, where U is the modulus of the puff speed. This relationship implies a self-similar development of the cloud puff in which R is proportional to the puff path S, in the form:
with U = (Vx2 + Vz2)1/2, and Vx and Vz are the puff speed components in the horizontal and vertical directions.
dR/dt = β U or dR/dS = β
The value of β can be guessed from the literature, spans from 0.1 up to 0.6 depending on the conditions, and typically increases with the cloud bending [12,13]. Bourouiba and others [4] directly use the self-similarity relation R = β S with β = 0.2 for an expiratory cloud.
The last ingredient of the puff dynamics is the buoyancy force Fb, which can be written:
R and ΔT are time-dependent during the evolution of the puff and higher order corrections on Fb, depending on whether the density and the variable vapour content of the puff are neglected, following the usual approximations in atmospheric physics. Within these approximations, ΔT can be estimated as:
Fb = g (4/3) π R3 (ρa − ρp) ≈ g (4/3) π R3 ρp (ΔT/Ta)
ΔT = Tp – Ta = [ Tp(0) R3(0) + Ta (R3(t) – R3(0)) ]/R3(t) − Ta = [ Tp(0) - Ta ] R3(0)/R3(t)
An analogous equation can be used to approximate the specific humidity change hp in the puff
where ha is the air specific humidity.
Δhp = hp − ha = [hp(0) − ha] R3(0)/R3(t)
Using Equation (1) with vm = 0, together with the same viscous force as in (2) with ρp~ρa instead of ρw, and the rate of mass (volume) change from (6), after some algebra, the equation for the puff speed V can be written as
where now Re = 2(VR/μ), R can be calculated by (6) and, again, g = 0 in the horizontal direction. Note that the first term in the r.h.s (drag force) becomes significant for low speed (lowest Re) only.
dV/dt = −(9/2) μ G(Re) V/R2 − 3V2β/R + g (ΔT/Ta)
The system of Equations (2), (3), (6), (8), (9), (10) can be numerically integrated to obtain the horizontal and vertical displacements of the puff and the droplet. The analytic forms (4) can help to stabilize the numerical solution of Equation (2) when r(t) → 0, using them in a step-wise approximation by calculating v(t + dt) and s(t + dt) from v(t) and s(t) by (4,5) and updating G(Re), Tp, and hp at each time step. In the application of Equation (2), the droplet speed component v is to be considered with respect to the surrounding fluid. Being the droplet emitted inside the puff, v in Equation (2) must represent its velocity component relative to the puff coordinate system (v(0) = 0) until (and whenever) the droplet leaves the puff before evaporating. (This last fact is approximately determined by the decay time scale of the droplet speed B/A and the evaporation time scale B/C in (4,5)). To accomplish the above requirement, the term dV/dt (Equation (10)) is subtracted by the r.h.s of Equation (2) to take into account the puff acceleration (the non-inertial frame of reference) in the numerical solution for the time the droplet moves within the (increasing) puff radius. This guarantees the correct dynamical coupling between the droplet and the puff. After leaving the puff, the droplet equations (2) and (3) are solved in the ambient reference frame without additional terms and with a new initial speed, which is given by the sum of the calculated droplet exit speed relative to the puff and the residual puff speed. In the following paragraph, some results are examined with special attention paid to the contamination range of the particles (i.e., the total horizontal droplet path before they fall to the ground or evaporate). This is calculated as the sum of the droplet path (relative to the puff) and the puff path (until the droplet moves inside it) plus the droplet path out of the puff for the time it moves outside.
3. Results
The above equations are used to simulate the evolution of a puff, and a droplet inside it, when expelled during respiratory acts, coughs, or sneezes. The droplet radius in an expiratory act or cough typically spans a range of 10 −3 to 10−6 m [4]. A spherical puff of radius R = 0.06 m (about 1 litre in volume) emitted with an initial speed of 10 ms−1 is taken as the representative of the forced expiration events [14]. The fate of a droplet inside the puff cloud is related to its potential contamination range (the maximum horizontal path), which is determined by the fallout on the ground and the evaporation time, according to the size of the drop and the surrounding environment. Droplets and puffs are supposed to be emitted with the same speed in the ambient reference system, but their equations of motion are different, and eventually, the droplet can leave the puff vertically or horizontally and continue moving in the ambient air before evaporating. The conditions used to determine the horizontal contamination range are (1) a drop reaching 2 m below the emission height, and (2) a drop almost evaporating (more than 99% of volume reduction)—whichever condition is verified first. The Clausius–Clapeyron equation is used to calculate the saturation humidity (hs.) and also to convert the relative humidity parameter (Rh), which is used in the rest of the paper, to the specific humidity (h) used in the equations. The initial thermodynamic puff conditions are taken as constants with Tp(0) = 37 °C and Rhp(0) = 0.9, and the initial horizontal speeds are v(0) = 0 (droplet in the puff reference system) and V(0) = 10 ms−1 (puff in the ambient reference system). For the vertical components, v(0) = V(0) = 0. The events shown in Table 1 refer to the droplets with a different initial size in two opposite (neutral) environmental conditions: warm-dry (Ta = 35 °C, Rh = 0.4), and cold-humid (Ta = 5 °C and Rh = 0.8).
Table 1 shows some interesting features. The change in the 0 (bold) column marks the transition from the contamination range controlled by the gravitational settling (z = 0) to that controlled by the evaporation (r ≈ 0) that happens for the droplets with a radius between 50 and 10 μm. Note the first significant effect of the environmental conditions on the evaporation (a significant reduction in r in the dry-warm conditions) for r(0) = 50 μm. The values in brackets are relative to the coupled puff-droplet system just before the droplet exit from the puff and approximately represent a fairly horizontal path before the fallout starts. The total cloud lifting (Zp) is generally small during the droplet’s life-time, although this is also dependent on the entrainment parameter (β = 0.1, see below in this section), and the puff has a generally non-negligible residual speed Vx. However, the buoyancy–entrainment lifting, calculated in the cold-humid conditions, is able to increase the maximum height reached by the puff to up to 0.8 m over the emission level, in a time of 60 s, and over 2 m in 500 s. Thus, the puff is potentially able to go up to indoor air-conditioning systems, in agreement with the literature [4], but after a time in which most of its droplet content will be lost or transformed into nuclei (please compare with the values in the columns Zp and t in Table 1).
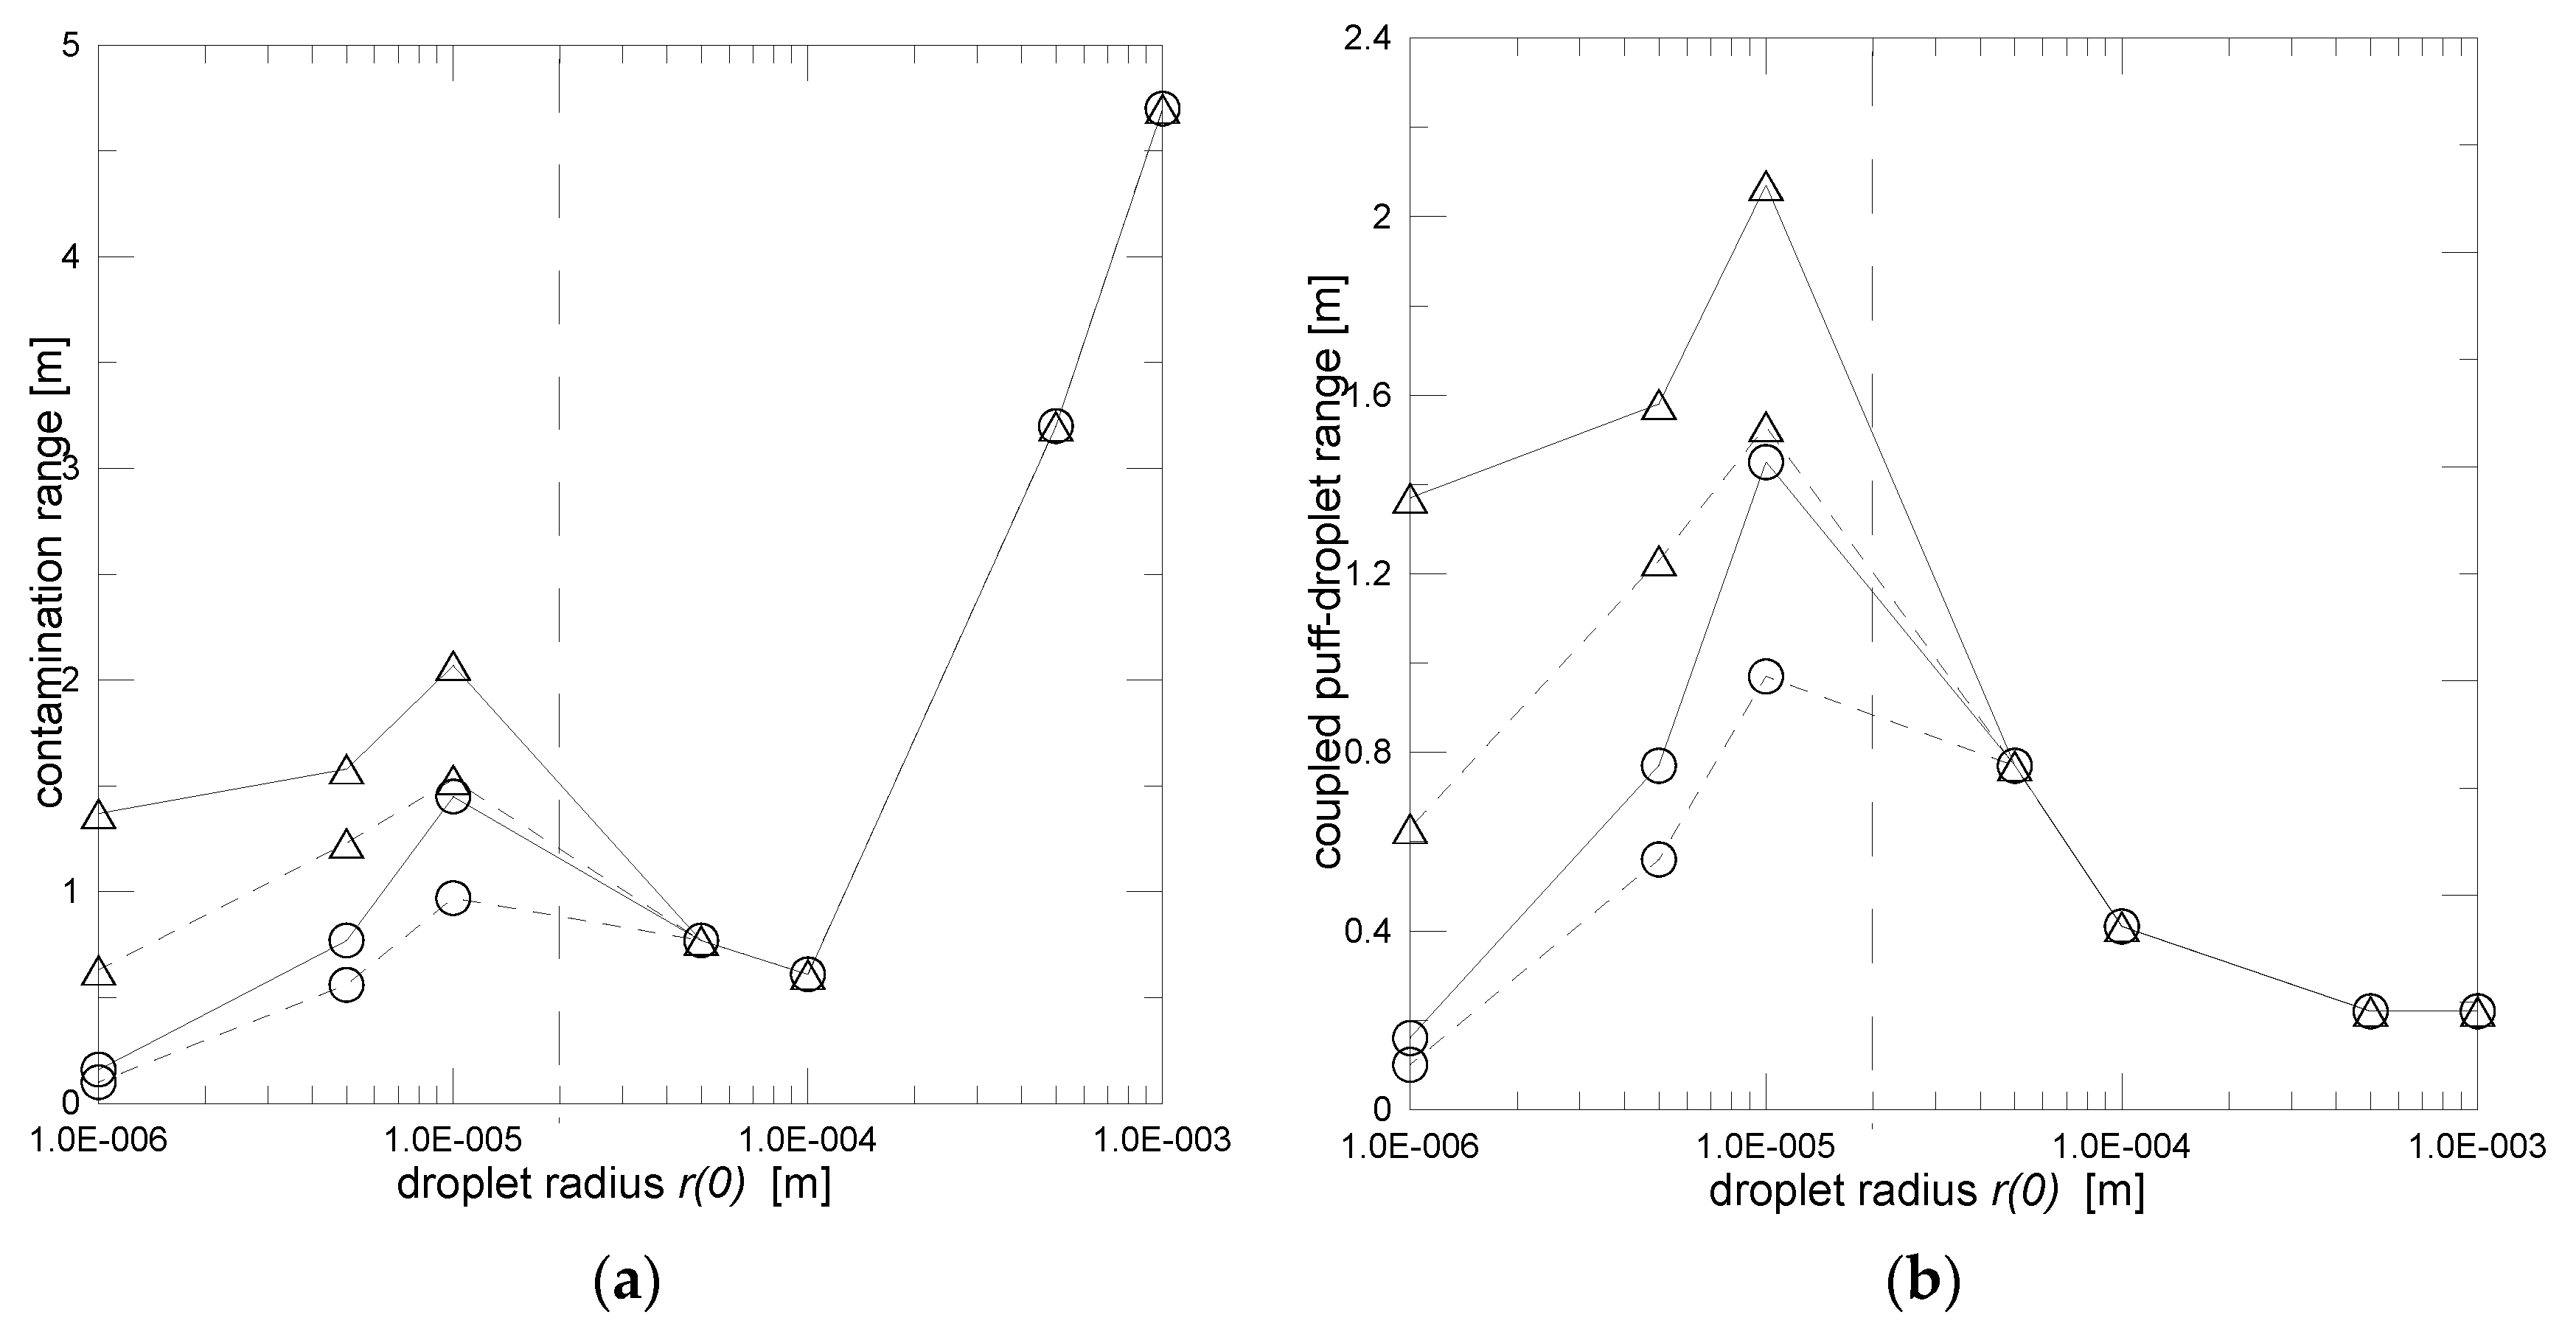
Figure 1a resumes a plot of the maximum contamination range versus the droplet’s initial radius r(0). In addition to the data from Table 1, Figure 1 also shows two additional cases for Ta = 35 °C, Rh = 0.8 and Ta = 5 °C, Rh = 0.4. The contamination range can often be well above 1 m, even for small droplets in cold-humid conditions, as for r = 10 μm, because this droplet is still massive enough to survive a quick evaporation but sufficiently light to be carried on by the puff before evaporating. The contamination range also increases for the largest droplets due to the increasing effect of the droplet’s initial momentum, with respect to drag forces and gravitational settling. The non-linearity of the curve, with a minimum around 100 μm, has already been pointed out as being due to the interplay between the inertia, drag forces, and gravitational settling at different droplet sizes—through different approaches to the droplet dynamics and not accounting for the evaporation [4]. However, in the present case, the left region of Figure 1 is strongly influenced by the evaporation, and the magnitude of a few tens of microns represents the threshold radius for switching the mechanism that determines the maximum contamination range—from the gravity fallout for larger droplets to the diffusive evaporation for smaller droplets. In the latter case, the contamination range becomes increasingly sensitive to the environmental conditions, with a variation up to one order of magnitude when changing from warm-dry to cold-humid. Additionally, in the simulated cold-humid conditions, the small droplets undergo an increase in volume in the first instants of emission, as the cloud puff can increase its relative humidity until supersaturation because of its short cooling down time after the emission, which consequently enhances the droplet life-time in cold-humid environments. Compared to Figure 1a, Figure 1b shows that small droplets do not leave the puff during their whole life-time (the left regions of the two figures coincide), thus the environmental effect in the contamination range of the puff-droplet coupled system is very significant, even with the smallest entrainment parameter β = 0.1. Due to the aforementioned variability of this parameter, this minimum value was chosen simply to minimise the effects of the external conditions on the puff cloud. From Figure 1, it is also clear that the environmental effect across the contamination range is the consequence of the interplay between both the external temperature and humidity, as a decrease in the ambient relative humidity can be associated with a decrease or increase in the contamination range, according to the change in the relative humidity of the puff, which is induced not only by humidity changes but also by temperature changes because of the mixing with entrained air (decrease in the puff temperature). As smaller droplets of a few micrometres in radius prevail in normal respiration, and in a much enhanced way in usual conversation [15], this strong environmental effect of a reduction in the contamination range (well below 1 m) could play a role in the reduction of influenza-like epidemic spread in warm conditions, such as the summer season in temperate regions. This is not in disagreement with reported studies about the decrease in epidemics with an increase in absolute humidity [16,17]. Indeed, epidemiological studies mainly refer to statistical results comparing epidemic spreading at different sites that are characterized by differences in both temperature and specific humidity. However, the specific humidity and temperature generally present a positive correlation in climatic data because of the Clapeyron–Clausius equation, and, usually, increases in specific humidity with temperature largely overcome the reduction in the local relative humidity, within its usual range of variation (a decrease of 30 °C in the air temperature is related to a specific humidity decrease in saturation of about one order of magnitude). Thus, due to the climatic correlation between temperature and specific humidity, the increase in epidemics at low-specific-humidity sites is in general agreement with these results. However, it is not possible to directly translate the droplet contamination range into the epidemic spreading, which is also related to the possible transport by the residual aerosol nuclei and to the biology of the pathogen. For example, evidence has been reported about a decrease in the coronavirus’s life span on surfaces with increasing temperature and also relative humidity [18]. Moreover, with respect to the dynamics of the airborne epidemic disease transmission, it is indeed very important to assess the role of the residual aerosol nuclei after droplet evaporation [19,20].
4. Discussion and Conclusions
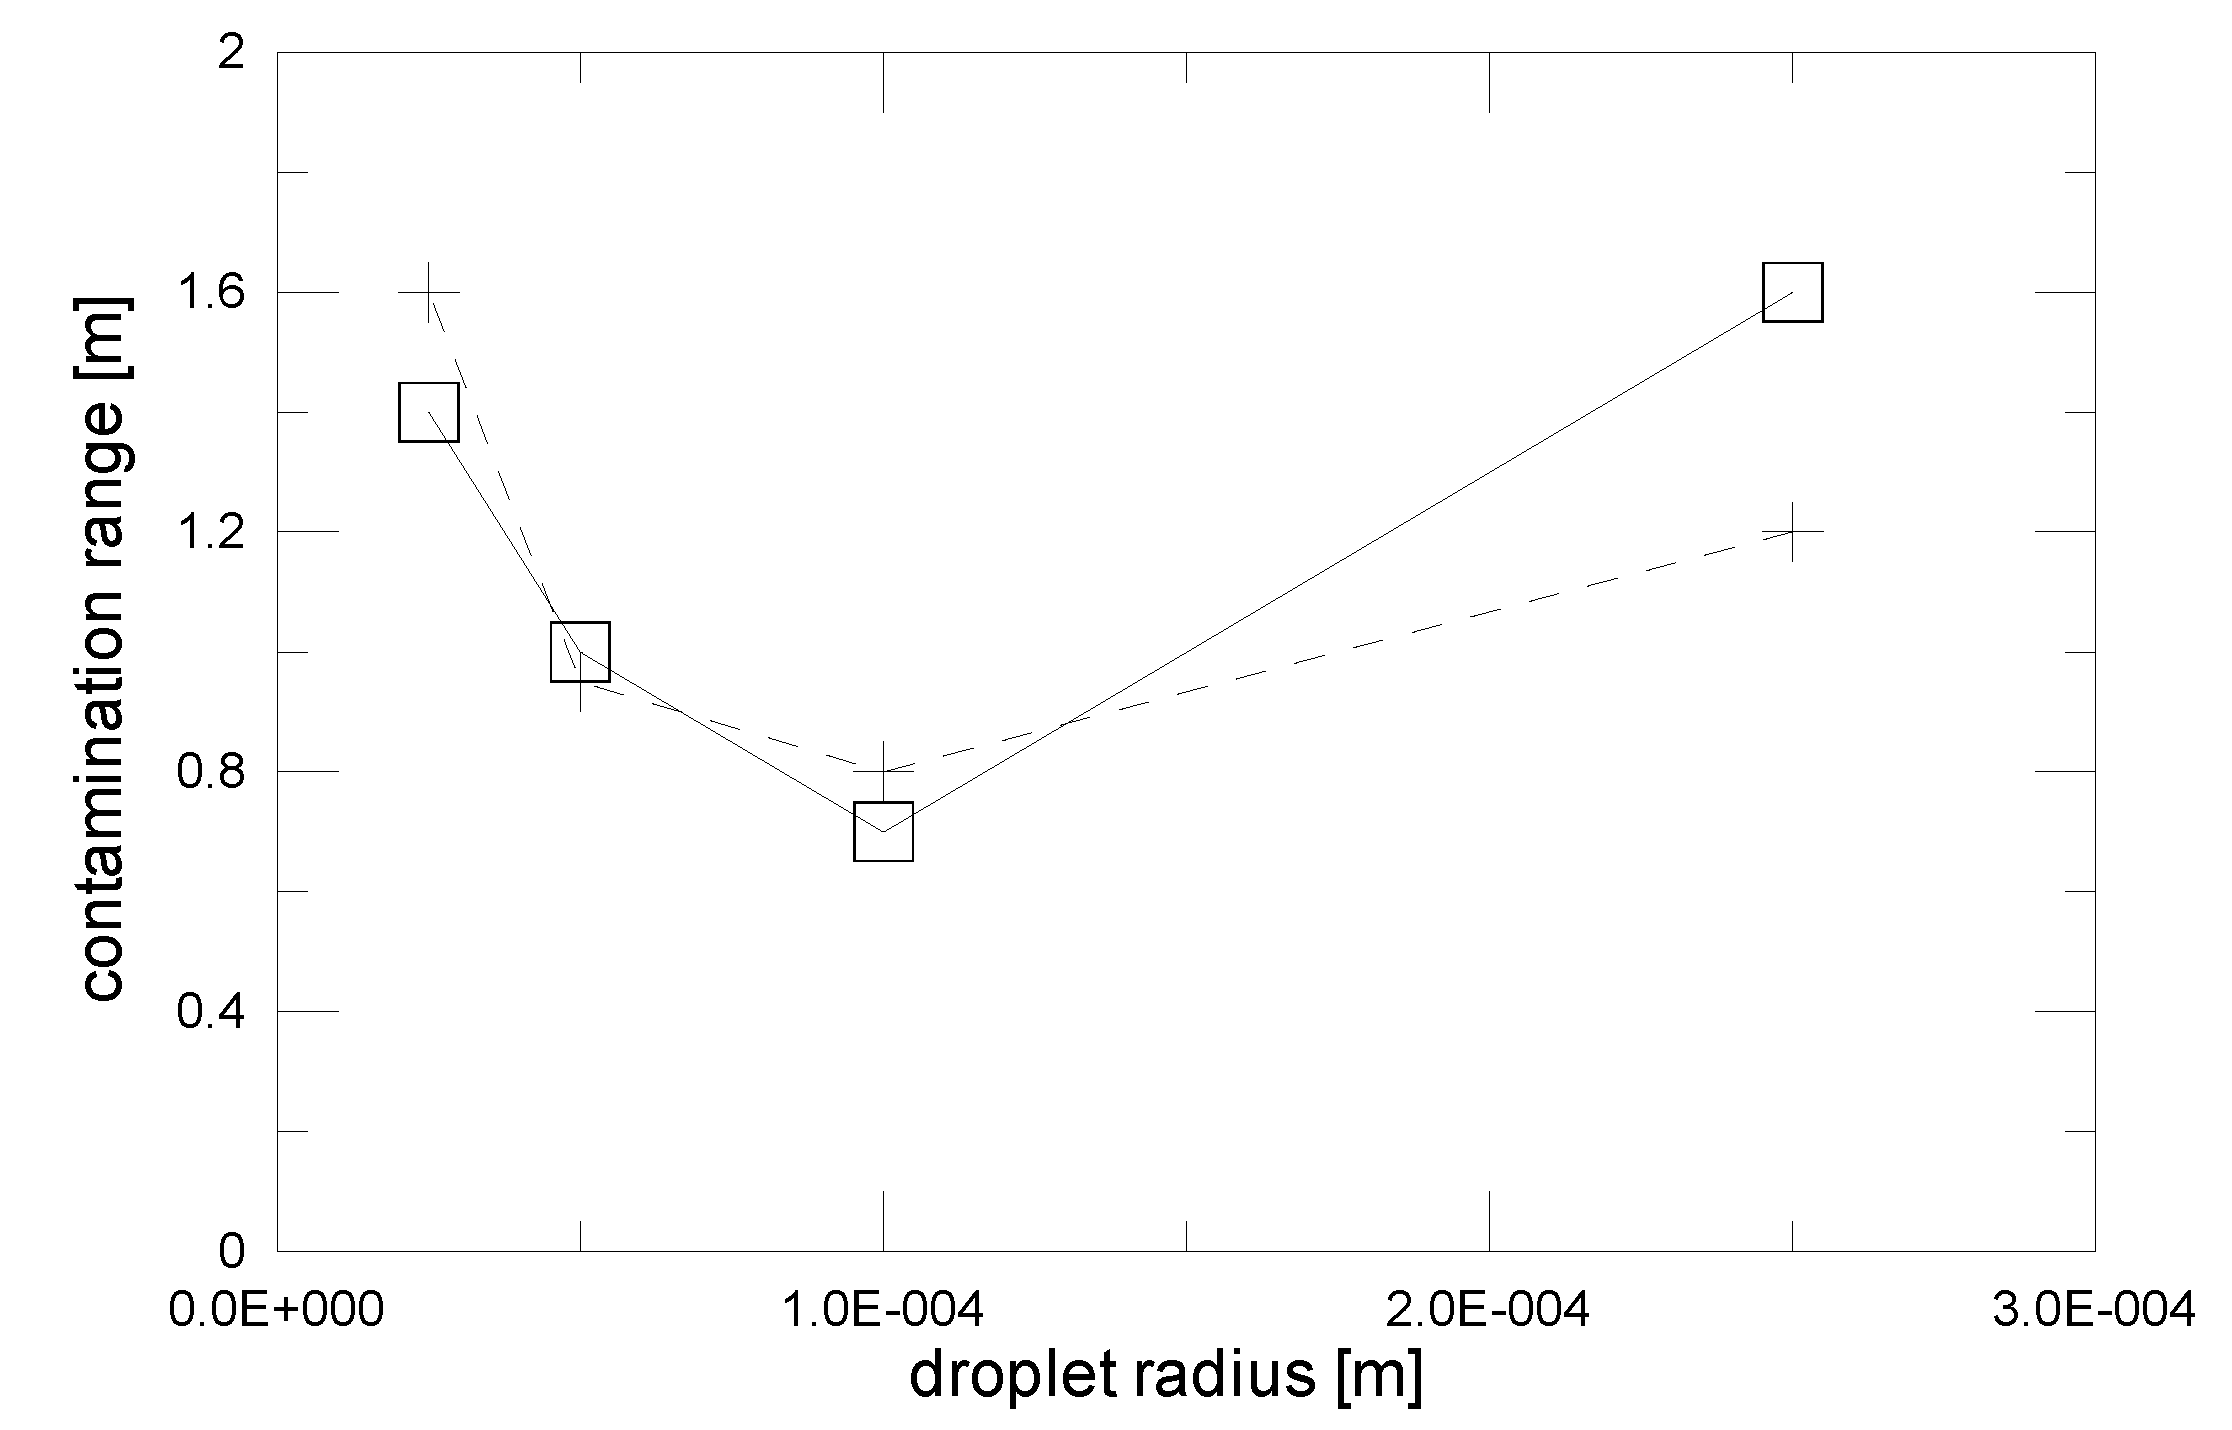
Basic equations of motion have been used to estimate the contamination range of droplets of different sizes embedded in a spherical cough puff, explicitly taking into account the effect of evaporation in different ambient conditions. Besides the evaporation effects, another characteristic of this model is to explicitly take into account the dynamics of the droplet (inertial effects), extending the results to a larger scale of droplet sizes, if compared with [4], which spans from very small (evaporating) to quite large droplets (acceleration effects). It is to be pointed out that, due to the simplified assumptions in the model equations (e.g., they do not explicitly model the turbulent transport of the droplet within the puff), they are not intended as a general framework for the study of complex multiphase flows; rather, they have proven to be valid in the present context, highlighting some qualitative and quantitative characteristics of the contamination range for evaporating droplets just in the conditions typical of expiratory acts. The dynamics of the droplets can be compared with a tested literature model (Figure 18 in [4]) by suppressing evaporation and by using the same entrainment coefficient β = 0.2. As Figure 2 shows, for the droplet radii in the range of about 30–200 μm, the results are in reasonable agreement if the evaporation is neglected, as in [4]. The largest droplets tend to have larger contamination ranges because of their own momentum in leaving the puff; however, it is still well within the overall contamination range obtained by the camera pictures of real events [5] (in [4], the droplet horizontal exit speed is assumed to be just the same as the puff speed). Indeed, the results confirm a minimum in the contamination range (between 0.6 and 0.8 m for a droplet radius of about 100 μm) and a lifting-expanding up to meters for the cloud puff [4] but taking a considerably longer time than the droplet’s life-time. For droplets smaller than 20 μm in radius, the addition of the evaporation greatly reduces the contamination range with respect to the steep increasing trend found in [4]. The added effect of the droplet evaporation gives a quantitative insight that confirms some typical qualitative assumptions found in medical literature about airborne epidemic spreading. Accounting for the evaporation, a transition is found at around a 10–20 μm droplet radius, that is between the contamination range controlled by inertia and the gravitational settling, and the range controlled by the droplet evaporation, which is in agreement with the typical assumptions made in medical literature [5]. In the evaporation-controlled region, the contamination range was found to be significantly different for warm and cold environmental conditions, with a marked increase in the contamination range with a decreasing ambient temperature (Figure 1). Although the model accounts for one single droplet evaporating in the thermodynamic conditions uniquely determined by the puff entrainment, the effect of the evaporation of the droplet cloud inside the puff (typically about 5 × 10³ droplets with an average radius in the order of 10 μm in a cough [4]) can be directly estimated to be significantly smaller than that caused by the entrainment and significant for the contamination range. Indeed, due to the relevant change in the puff size (Table 1, last column) by external entrainment, the differences in the contamination range that are found for the evaporating droplets in different ambient conditions are due to a change in the temperature of the puff by entrainment in the order of tens of degrees Celsius (about a 5 to 35 °C change in the puff temperature) and/or 10−2 kg/kg of change in specific humidity (about 40% change in the saturation humidity at 30 °C). The evolution of the droplet distribution in the puff travel would be a complex problem of cloud dynamics, but the much lower droplet density, with respect to a typical atmospheric cloud, makes the direct interaction between the droplets negligible. Instead, it is easy to estimate the specific humidity change and the temperature change of a 1 litre air volume (the smallest initial puff) due to the complete evaporation of 104 droplets of 10−5 m average radius in it using the water latent heat of evaporation and the air heat capacity. The result of the calculation is that the specific humidity change is in the order of 10−4 kg/kg and the temperature change is in the order of 0.5 °C, both more than one order of magnitude smaller than the aforementioned entrainment effects, which confirms the microclimatic ambient changes to be correctly considered as a cause of potential change in the contamination range for an exhaled droplet cloud. Thus, as a consequence of this significant ambient effect across the contamination range, even for the minimum entrainment coefficient of the puff, a possible link with the seasonal behaviour of air-borne epidemic diseases (influenza) is supposed. Nevertheless, caution is required in assuming the change of the droplet contamination range as being the direct cause of the epidemic spreading—which can be associated with several different factors (one among them being the biological characteristics of the pathogen), that are, by far, outside of the scope of the present study. In addition, even by limiting the attention only to the effect of the expired cloud (and that of the evaporating droplets) on the actual contamination impact, this requires a better understanding of the role of the residual aerosol nuclei, in order to properly assess their importance for the diffusion of different air-borne epidemics.
Funding
This research received no external funding.
Conflicts of Interest
The author declares no conflict of interest.
References
- Asadi, S.; Bouvier, N.; Wexler, A.S.; Ristenpart, W.D. The coronavirus pandemic and aerosols: Does COVID-19 transmit via expiratory particles? Aerosol. Sci. Technol. 2020, 54, 1–4. [Google Scholar] [CrossRef] [PubMed] [Green Version]
- Blocken, B.; Malizia, F.; van Druenen, T.; Marchal, T. Towards Aerodynamically Equivalent COVID-19 1.5 m Social Distancing for Walking and Running. 2020. Available online: http://www.urbanphysics.net/Social%20Distancing%20v20_White_Paper.pdf (accessed on 10 May 2020).
- Wells, W.F. On airborne infection. Study II. Droplet and droplet nuclei. Am. J. Hyg. 1934, 20, 611–618. [Google Scholar]
- Bourouiba, L.; Dehandshoewercker, E.; Bush, J.W.M. Violent expiratory events: On coughing and sneezing. J. Fluid. Mech. 2014, 745, 537–563. [Google Scholar] [CrossRef]
- Bourouiba, L. Turbulent Gas Clouds and Respiratory Pathogen Emissions: Potential Implications for Reducing Transmission of COVID-19. JAMA 2020, 323, 1837–1838. [Google Scholar] [CrossRef] [PubMed]
- Carleton, T.; Meng, K.C. Causal Empirical Estimates Suggest COVID-19 Transmission Rates Are Highly Seasonal. Available online: https://www.medrxiv.org/content/10.1101/2020.03.26.20044420v1 (accessed on 10 May 2020). [CrossRef] [Green Version]
- Bukhari, Q.; Jameel, Y. Will Coronavirus Pandemic Diminish by Summer? Available online: https://www.ssrn.com/abstract=3556998 (accessed on 10 May 2020). [CrossRef]
- Kampf, G.; Todt, D.; Pfaender, S.; Steinmann, E. Persistence of coronaviruses on inanimate surfaces and their inactivation with biocidal agents. J. Hosp. Infect. 2020, 104, 246–251. [Google Scholar] [CrossRef] [PubMed] [Green Version]
- Contini, D.; Costabile, F. Does air pollution influence COVID-19 outbreaks? Atmosphere 2020, 11, 377. [Google Scholar] [CrossRef] [Green Version]
- Monteith, J.L.; Unsworth, M. Principles of Environmental Physics, 2nd ed.; Arnold, E., Ed.; Edward Arnold Publishers Ltd.: London, UK, 1990. [Google Scholar]
- Houze, R.A. Cloud Dynamics; Academic Press: London, UK, 1993. [Google Scholar]
- Weil, J.C. Plume Rise. In Lectues on Air Pollution Modelling; Wenkatram, A., Wyngaard, J.C., Eds.; American Meteorological Society: Boston, MA, USA, 1988. [Google Scholar]
- Bush, J.W.M.; Thurber, B.A.; Blanchette, F. Particle clouds in homogeneous and stratified environments. J. Fluid Mech. 2003, 489, 29–54. [Google Scholar] [CrossRef] [Green Version]
- Gupta, J.K.; Lin, C.H.; Chen, Q. Flow dynamics and characterization of a cough. Indoor Air 2009, 19, 517–525. [Google Scholar] [CrossRef] [PubMed]
- Asadi, S.; Wexler, A.S.; Cappa, C.D.; Barreda, S.; Bouvier, N.M.; Ristenpart, W.D. Aerosol emission and superemission during human speech increase with voice loudness. Sci. Rep. 2019, 9, 2348. [Google Scholar] [CrossRef] [PubMed] [Green Version]
- Shimmei, K.; Nakamura, T.; Ng, C.F.S.; Hashizume, M.; Murakami, Y.; Maruyama, A.; Misaki, T.; Okabe, N.; Nishiwaki, Y. Association between seasonal influenza and absolute humidity: Time-series analysis with daily surveilance data in Japan. Sci. Rep. 2020, 10, 7764. [Google Scholar] [CrossRef] [PubMed]
- Wang, J.; Tang, K.; Feng, K.; Lin, X.; Lv, W.; Chen, K.; Wang, F. High Temperature and High Humidity Reduce the Transmission of COVID-19. Available online: https://www.ssrn.com/abstract=3551767 (accessed on 10 May 2020). [CrossRef] [Green Version]
- Casanova, L.M.; Jeon, S.; Rutala, W.A.; Weber, D.J.; Sobsey, M.D. Effects of Air Temperature and Relative Humidity on Coronavirus Survival on Surfaces. Appl. Environ. Microbiol. 2010, 76, 2712–2717. [Google Scholar] [CrossRef] [PubMed] [Green Version]
- Tellier, R.; Li, Y.; Cowling, B.J.; Tang, J.W. Recognition of aerosol transmission of infectious agents: A commentary. BMC Infect. Dis. 2019, 19, 101. [Google Scholar] [CrossRef] [PubMed]
- Lewis, D. Is the Coronavirus Airborne? The Experts can’t agree. Nature 2020, 580, 175. [Google Scholar] [CrossRef] [PubMed] [Green Version]
Figure 1.
Contamination range (a) and the coupled puff-droplet horizontal range (b), as a function of the initial droplet radius in cold (triangles, 5 °C) and warm environments (circles, 35 °C). Continuous line: Rh = 0.8, dashed line: Rh = 0.40 (connection lines are added to help visualization only). The vertical dashed line approximately separates the two regions in which evaporation (left) or inertia-gravitational settling prevails.

Figure 2.
The contamination range for the present model, with evaporation suppressed and entrainment parameter β = 0.2 (squares) compared with some results from [4] (crosses) within the common range of the droplet sizes (connection lines are added to help visualization only).
Figure 2.
The contamination range for the present model, with evaporation suppressed and entrainment parameter β = 0.2 (squares) compared with some results from [4] (crosses) within the common range of the droplet sizes (connection lines are added to help visualization only).


Table 1.
The main parameters of the drop-puff dynamics, until the maximum horizontal range of contamination was reached by either fallout or evaporation, as indicated by a 0 (in bold) in the z and r columns, respectively. From left to right: the initial drop radius (r(0)); elapsed time (t); contamination range (xm) at time t; radius (r) at time t; height above ground (z) at time t; puff horizontal speed (Vx) at time t; and height (Zp) reached by the puff (entrainment + buoyancy) at time t, with respect to the emission level. Brackets indicate the values at the intermediate exit time, in case of a falling droplet leaving the puff (note that the drop can leave the puff vertically or horizontally according to its speed and the puff size and speed). Square brackets in the r column indicate the actual value of the final radius for evaporating droplets. The droplet height (z) is measured with respect to the ground level, while the puff maximum height Zp is with respect to the emission level (2 m above the ground). W = warm-dry, and C = cold-humid conditions.
| r (0) (m) | t (s) | xm (m) | r (m) | z (m) | Vx (ms−1) | Zp (m) |
|---|---|---|---|---|---|---|
| 1 × 10⁻³ C | 0.73 (0.02) | 4.70 (0.22) | 10 (10) × 10−4 | 0 (2.0) | 0.43 (4.99) | 0.15 (0.07) |
| 1 × 10⁻³ W | 0.73 (0.02) | 4.70 (0.22) | 10 (10) × 10−4 | 0 (2.0) | 0.43 (4.99) | 0.15 (0.07) |
| 5 × 10⁻⁴ C | 0.84 (0.02) | 3.20 (0.22) | 5 (5) × 10−4 | 0 (2.0) | 0.39 (4.99) | 0.15 (0.07) |
| 5 ×10⁻⁴ W | 0.84 (0.02) | 3.20 (0.22) | 5 (5) × 10−4 | 0 (2.0) | 0.39 (4.99) | 0.15 (0.07) |
| 1 × 10⁻⁴ C | 1.88 (0.04) | 0.61 (0.41) | 10 (10) × 10−5 | 0 (1.99) | 0.20 (3.44) | 0.18 (0.08) |
| 1 × 10⁻⁴ W | 1.88 (0.04) | 0.61 (0.41) | 9.8 (10) × 10−5 | 0 (1.99) | 0.20 (3.44) | 0.18 (0.08) |
| 5 × 10⁻⁵ C | 6.7 (0.12) | 0.77 (0.77) | 4.8 (5.0) ×10−5 | 0 (1.98) | 0.07 (1.67) | 0.24 (0.10) |
| 5 × 10⁻⁵ W | 6.7 (0.12) | 0.77 (0.77) | 3.2 (5.0) × 10−5 | 0 (1.98) | 0.07 (1.67) | 0.24 (0.10) |
| 1 × 10⁻⁵ C | 5.9 | 2.07 | 0 [1.9 × 10⁻⁶] | 1.98 | 0.08 | 0.23 |
| 1 × 10⁻⁵ W | 0.54 | 0.97 | 0 [8.0 × 10⁻⁷] | 1.99 | 0.55 | 0.14 |
| 5 × 10⁻⁶ C | 2.98 | 1.58 | 0 [9.0 × 10⁻⁷] | 2.0 | 0.14 | 0.2 |
| 5 × 10⁻⁶ W | 0.16 | 0.56 | 0 [<1 × 10⁻⁸] | 2.0 | 1.38 | 0.11 |
| 1 × 10⁻⁶ C | 1.78 | 1.37 | 0 [1.0 × 10⁻⁷] | 2.0 | 0.21 | 0.18 |
| 1 × 10⁻⁶ W | 0.013 | 0.1 | 0 [1.5 × 10⁻⁷] | 2.0 | 6.0 | 0.07 |
© 2020 by the author. Licensee MDPI, Basel, Switzerland. This article is an open access article distributed under the terms and conditions of the Creative Commons Attribution (CC BY) license (http://creativecommons.org/licenses/by/4.0/).
Share and Cite
MDPI and ACS Style
Martano, P. Droplet Fate in a Cough Puff. Atmosphere 2020, 11, 841. https://doi.org/10.3390/atmos11080841
AMA Style
Martano P. Droplet Fate in a Cough Puff. Atmosphere. 2020; 11(8):841. https://doi.org/10.3390/atmos11080841
Chicago/Turabian StyleMartano, Paolo. 2020. "Droplet Fate in a Cough Puff" Atmosphere 11, no. 8: 841. https://doi.org/10.3390/atmos11080841
Note that from the first issue of 2016, this journal uses article numbers instead of page numbers. See further details here.