1. Introduction
More than 50% of the world’s population lives in urban areas [
1], and most developing countries are still undergoing rapid urbanization [
2]. Megacities and mega-urban regions, which host more than 10 million people, are emerging worldwide. Prominent examples of emerging megacities are Delhi (India), Sao Paulo (Brazil), Mexico City (Mexico), and London (UK). More than half of all megacities in the world are in Asian countries [
3,
4,
5]. By 2030, almost 9% of the world’s population will live in 41 megacities. Given their fast-growing urban populations and urban sprawl, 10 of the 12 cities projected to become megacities by 2030 are in Asia and Africa [
6,
7]. However, cities are vulnerable hotspots under climate change. There is an urgent need to understand future urban climate conditions under both urbanization and climate change so that cities and regions can develop corresponding science- and evidence-based mitigation and adaptation strategies.
Rapid urbanization, the likes of which China has been experiencing over the last 40 years, is characterized by rapid growth and extensive changes in economic, social, and environmental factors. Such changes include rapid GDP growth, an influx of immigrants, drastic land cover and land use change, a dramatic transformation from the natural landscape to built-up areas, intensive greenhouse gas emissions, and local climate changes [
8]. As of 2011, half of China’s population lives permanently in urban areas [
9]. According to China’s 13th Five-Year Plan, the country’s urbanization is expected to continue, peaking around 2020, with growth concentrated in 19 clusters of developing cities and mega-urban regions [
10]. The Jing-Jin-Ji metropolitan region, the Yangtze River Delta region, and the Pearl River Delta (hereafter “PRD”) region are the top three mega-urban areas in China. The PRD region is the most densely urbanized in terms of both size and population, not only in China but the world [
11].
The PRD region, located in the central area of Guangdong Province, is a leading economic region in China. From 1978 to 2000, its per-capita GDP had an average annual growth rate of 17.9%, which was much higher than that of the country [
12,
13]. Rapid economic growth contributes to urban sprawl. The built-up and urban areas in Guangzhou increased by 273% in size from 1996 to 2010, whereas those in Beijing and Shanghai increased by 197% and 148%, respectively [
14]. With the signing of the July 2017 framework agreement to transform the PRD region into the Guangdong–Hong Kong–Macau Greater Bay Area, this region is expected to play an increasingly important role in economic development.
As rapid development continues in the region, denser and compact urban areas are expected to be built to accommodate urban sprawl and human activity related to economic growth and increasing immigration [
10]. This may cause a series of impacts on both physical environment and human social systems, leading to climate change at both local and regional levels and increasing the risks of extreme weather events, negative influences on the ecosystem, and human health problems, especially in hot, humid summers [
15,
16,
17,
18,
19]. Thus, it is important for urban researchers, practitioners, and policymakers to understand the urban–environment relationship under such rapid urbanization [
20,
21], paying particular attention to changes in the local urban climate under different climate change scenarios. This insight into the future can inform the implementation of adaptive measures to alleviate potential public health risks and improve urban living conditions.
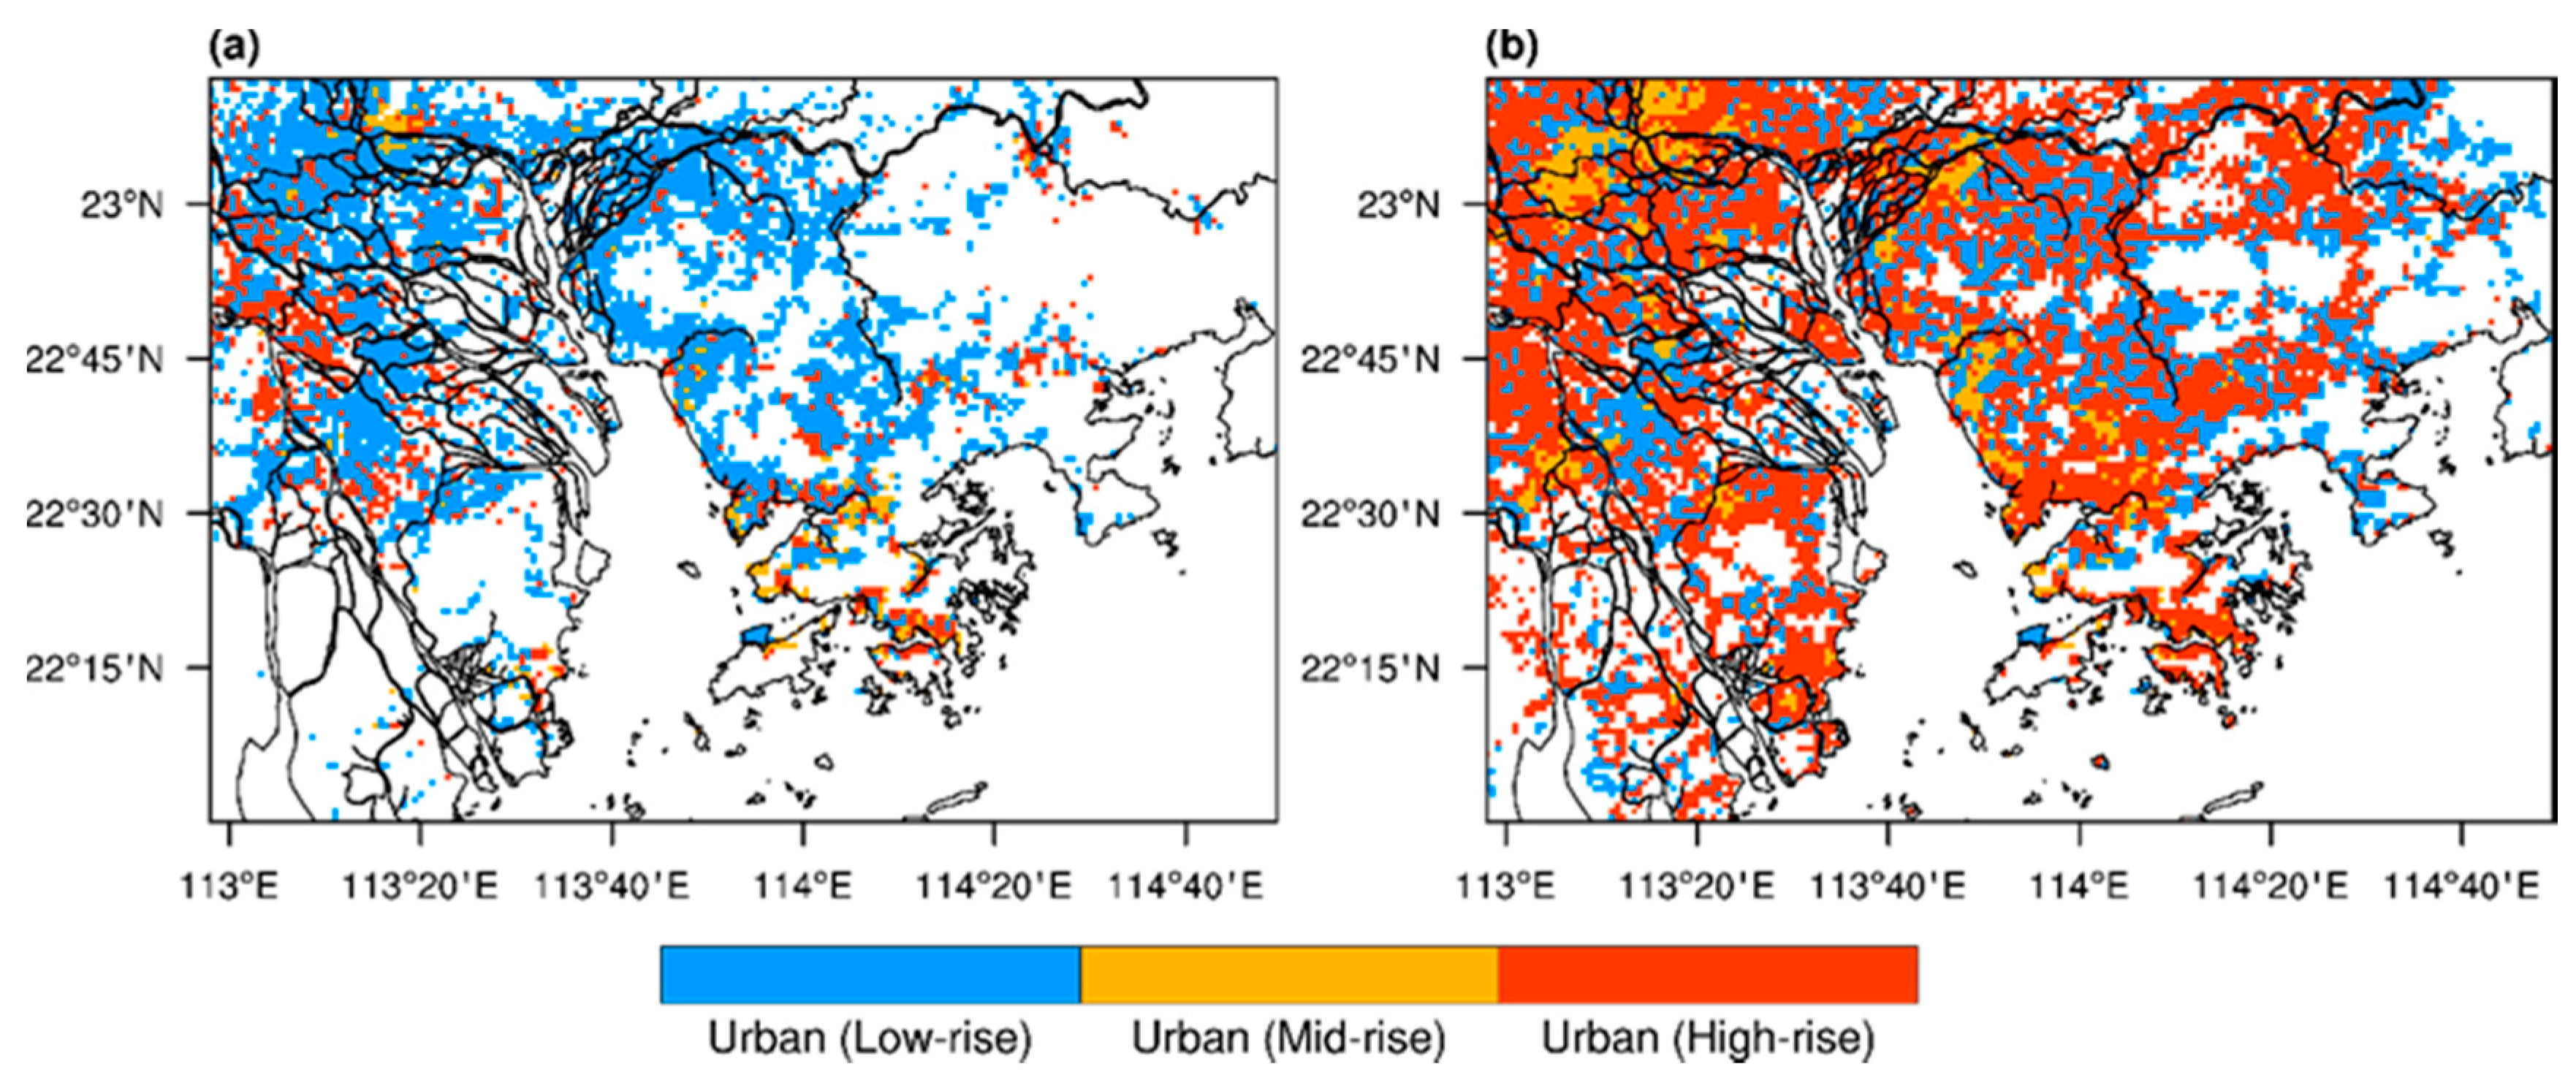
In this study, the Weather Research and Forecasting model is applied to examine the impact of future urban expansion on local climate conditions of the PRD region. The focus of this study was restricted to impacts on climate in the summer season of June and July because the PRD region has a subtropical climate characterized by hot, humid summers and mild winters. Summertime is the most uncomfortable period for residents due to heat-related stress. The WRF model was used to simulate the current (2010) and future (2030) climates of the PRD region at a 1 km spatial resolution. For the current scenario, the standard land use of the model was replaced with a more accurate dataset derived from Landsat images [
22] (
Figure 1a). For the future scenario, land use in 2030 (
Figure 1b) was projected based on the collected historical land use data in 2009 and 2014 using the Geographical Simulation and Optimization System, a Future Land Use Simulation model [
23].
Similar studies have been performed in the past. Wang et al. [
24] presented the WRF simulation in the PRD region to investigate the impact urbanization process using USGS (with pre-urbanization land use conditions representing the year 1992) and MODIS (with current land use conditions representing the year 2004) land use data. The results suggest that urbanization caused the overall temperature to increase and the diurnal temperature range to decrease. The 10-m wind speed in urban areas also weakened. Kusaka et al. [
25] projected the two urban planning scenarios for climate projections in Japan. Based on the projected land use, they applied the results of the Representative Concentration Pathway (RCP) 4.5 scenario from the global climate model MIROC5 to the regional climate models (WRF and NHRCM) to project the August climate in Tokyo in the 2050s. The results showed a significant temperature increase in the urban core from the 1990s to the 2050s.
This study is different from previous studies in terms of capturing and combining fast regional urbanization with different climate change scenarios. It attempts to use free available satellite images to project the rapid urbanization in the PRD region which is also called Guangdong–Hong Kong–Macau Greater Bay Area since both local and national policies focus on future urban development into a megacity. WRF is then used to evaluate the impact of rapid urbanization on local climate under different climate change scenarios. In addition, simulations using different RCP scenarios are carried out to identify and separate the respective contributions of urbanization and global warming. The findings will help the local government have a better understanding of the future urbanization’s impact so they can develop climate change adaptation strategies accordingly.
2. Experiments
In this study, WRF simulations for the future scenario were conducted under three different RCP scenarios, RCP4.5, RCP6.0, and RCP8.5 [
26], and the current scenario was run with RCP6.0 as a control (as summarized in
Table 1).
The current and future scenarios were compared to evaluate and capture the impact of future urban expansion on local urban climate. In addition, wet-bulb globe temperature (WBGT) was adopted as a thermal comfort index to evaluate the potential future thermal stress conditions of residents. Overall, this study aims to contribute insight into the climatological impact of large-scale urbanization in future scenarios.
2.1. The Land Use Data
The land use data for 2010 were developed by the World Urban Database and Portal Tool (WUDAPT) level 0 method. This method, which was proposed by Bechtel et al. [
22], uses freely accessible Landsat satellite data for the data creation. In the data, the basic urban morphology and land use conditions are characterized by the local climate zone (LCZ) scheme, which was developed by Stewart and Oke [
27]. LCZ is an objective classification system used to classify a city and its surrounding area into 17 types, of which 10 are built-up types, and 7 are natural types. Each LCZ type is differentiated from others based on the fractional impervious cover, sky view factor, building height, building materials, and impact on the near-surface air temperature [
27,
28,
29]. This makes it possible to use WUDAPT level 0 data as urban canopy parameters in meteorological simulation models [
30,
31]. Several recent studies have performed well using the WUDAPT tool for mesoscale modelling [
32,
33,
34].
A prediction model of Land Use and Land Cover (LULC) change states based on the defined transition rules that take into account current land use and land cover conditions, suitability for land use change, and the neighborhood influence is required to simulate and to estimate future urbanization and predict future land use. This study uses the Geographical Simulation and Optimization System (GeoSOS)—the Future Land Use Simulation (FLUS) model [
23]. It can identify the multiple LULC transition rules from the historical LULC states and apply these learned rules not only to address the complex local land use interactions but also to estimate the potential transition between different LULC types [
23]. It has been successfully applied to simulate urban dynamics and expansion and to predict urban development and landscape changes in China [
23,
35,
36,
37].
To forecast the urban land uses in 2030, the LCZ maps of PRD in 2009 and 2014 were created using the WUDAPT level 0 method [
34]. Then, based on these two LCZ maps, the past rules of land use transition were generated using GeoSOS-FLUS. Third, the same transition rules generated from the LCZ map of 2014 were applied to predict the urban land uses in 2030. The original and predicted urban land uses for 2010 and 2030 are plotted in
Figure 1. Such remarkable urbanization from 2010 to 2030 can be explained by the assumption of the constant rate of urbanization by the model. The land use prediction model adopts machine learning to learn the past urbanization rate and applied the learned pattern into the future projection. Such a constant rate of urbanization is possible in real-case scenarios due to the planned development of the Greater Bay Area by the Chinese government.
The accuracy and validity of the GeoSOS-FLUS model were assessed by running it for the period of 2009 to 2014 and then comparing the simulated 2014 LCZ map with the observed 2014 map. This comparison yields a kappa coefficient of 0.77 and overall accuracy of 0.82, suggesting that the land use change model has reasonable predictive power.
Given that the land use data in 2010 follow the definition of LCZs, it must be converted to suit the classifications that are already available in WRF. Hence, the land use data were converted to follow the USGS land cover classification. The USGS land cover classification was also modified to differentiate urban areas into 3 different types: urban (high-rise), urban (mid-rise), and urban (low-rise) (
Table 2). Such differentiation allows WRF to consider the heterogeneous urban patterns in the study area.
The accuracy and validity of the GeoSOS-FLUS model were assessed by running it from 2009 to 2014 and then comparing the simulated 2014 LCZ map with the observed 2014 map. This comparison yields a kappa coefficient of 0.77 and overall accuracy of 0.82, suggesting that the land use change model has reasonable predictive power.
2.2. The Simulation Model
The Weather Research and Forecasting Model (hereafter “WRF”) with Advanced Research WRF (ARW) Version 3.7.1 is used in this study. WRF is a mesoscale, non-hydrostatic numerical weather prediction. It provides different schemes for various physical interactions; this flexibility allows models to be used for research in different areas, such as pollution dispersion modeling (WRF-Chem) [
38] and large eddy simulation for microscale simulation (WRF-LES).
2.2.1. Study Period and Area of Interest
The study period focuses on June and July, which is a typical summer season in the Pearl River Delta, China. The simulation years are 2010 and 2029–2031. The year 2010 is chosen as the base case, whereas 2029–2031 are selected as future scenarios, and the results are averaged to represent 2030 to reduce the inter-annual variability of the climate system.
There are four domains configured with 283 × 184, 223 × 163, 172 × 130, and 190 × 133 grid points, and the corresponding horizontal resolutions are 27, 9, 3, and 1 km. The area of interest is the innermost domain, which covers the major cities in the PRD (
Figure 2 and
Figure 3). There are 48 vertical layers with eta-levels configured manually and with the model top at 50 hPa.
Throughout the simulations, WRF is run with consecutive integration by re-initialization for every four days to prevent model drift. In addition, the first day after the initialization is treated as model spin-up time and excluded from the analysis.
2.2.2. Initial and Lateral Boundary Conditions
Initial and lateral boundary conditions from the National Centre for Environmental Prediction (NCEP) are used to forecast future weather changes. These data are in 6-h intervals with a horizontal resolution of approximately 1°. They are also the outputs from the NCAR’s Community Earth System Model (CESM1), with bias correction and conversion for dynamical downscaling in WRF. The dataset has been used to forecast the global climate until the end of the 21st century under three Representative Concentration Pathways (RCPs): RCP4.5, RCP6.0, and RCP8.5 [
26]. Each of these represents different radiative forcing for 2100. RCP4.5 shows that the radiative forcing will reach 4.5 Wm
−2, and the results are similar for the other cases. The 2010 RCP6.0 is chosen as the control run to represent the current scenario. RCP4.5, RCP6.0, and RCP8.5 for 2029–2031 are chosen to represent future scenarios with low, medium, and high emissions of greenhouse gases, respectively.
2.2.3. Physics Scheme
The following physics schemes are used in the simulation. The MM5 Similarity Scheme [
39] is used for the surface layer physics, and the RRTM Shortwave and Longwave Schemes are applied for the shortwave and longwave radiation. The Grell 3D Ensemble Scheme [
40] is responsible for the cumulus parameterization in domains 1 and 2 only. The resolution of domains 3 and 4 is small enough to resolve cumulus physics by itself. Asymmetric Convection Model 2 (ACM2) [
41] is used to calculate the planetary boundary layer. According to Xie et al. (2012) [
42], ACM2 performs better for the Pearl River Delta. The Unified Noah Land Surface Model (Noah-LSM) [
43] is chosen for the land surface. The Noah-LSM modifies the land surface parameters of each computational grid, mainly based on the dominant land use category. For example, forest and urban land use generally have a roughness length value of 0.5 m, while cropland and water bodies have significantly lower values. The Noah-LSM is modified in this study to extend the bulk parameterization to the newly added urban-type land use. Following Liu et al. [
44], the roughness length and volumetric heat capacity are also adjusted for these land use categories to reflect the urban effects.
Moreover, in this study, the urban canopy model is not employed. This is because it is approximated that the high-rise urban can have an average building height exceeds the first layer nearest to the ground, causing the single-layer urban canopy model cannot be employed. The expensive computation cost in the multi-layer urban canopy models also indicates a long-term simulation is not feasible, especially under a large simulation domain.
To further justify the performance of the configuration of the WRF simulation applied in this study, a separate WRF simulation with the Single-Layer Urban Canopy Model (SLUCM) is performed, and its result is discussed in
Section 3.1.
3. Results
All of the outputs from WRF spanning 1400–1600 LST (defined as “daytime”) and 2000–2200 LST (defined as “nighttime”) are averaged. The parameters, including 2-m temperature, 10-m wind speed, and 2-m wet-bulb globe temperature, are analyzed. Spatial plots for these parameters are used to understand the spatial pattern changes.
To understand the changes specifically in the original urban area, the hourly average of these parameters is also plotted in time series. Each value is obtained by grouping the results by each hour and averaging spatially and then evaluating into a single value by averaging all the grids with urban-type land use classified in 2010. In terms of understanding the impact of urbanization on rural areas, the averaging is performed for urban-type land use classified in 2030 (i.e., future scenarios).
3.1. Validation
Before the analysis, validation was performed by comparing the control run (the year 2010) with observational results from more than 100 weather stations in domain 4. The root mean square errors (RMSE) and mean biases (MB) of 2-m temperature and 10-m wind speed were calculated by month. The results are summarized in
Table 3.
Overall, the averaged 2-m air temperature MB is a positive value, indicating the WRF simulation result tends to overestimate the temperature. The RMSE value suggests that the error of the temperature is around 2.77 °C. In terms of 10-m wind speed, it exhibits similar characteristics with 2-m air temperature, where WRF tends to predict stronger wind speed. This can be explained by the overestimation of 2-m air temperature, where a higher temperature always indicates a stronger momentum of the boundary layer, eventually leading to stronger wind speed as forecasted.
Note the model prediction in June is not as accurate as of that in July. The inaccuracy can be attributed to the fact that the WRF simulation fails to predict precipitation events in June, resulting in a higher temperature simulated than the actual situation.
where
N is the total number of observations,
Oi is the observation value, and
Mi is the model prediction over grid
i.
Also, as discussed in
Section 2.2.3, to validate the performance of the current model is comparable with the WRF simulation which employed SLUCM, a separate WRF with SLUCM simulation is run.
The WRF with SLUCM simulation applies the default morphological setting due to the lack of morphology data across the PRD region. Moreover, the WRF with SLUCM simulation keeps the same number of vertical layers, but its eta-levels setting is generated by WRF instead. This is to avoid the SLUCM limitation where the building height could not exceed the first eta-level closest to the ground. Other physical schemes are consistent with the WRF simulation used in the study. The simulation period is from the 9th to 12th of June, 2010, a period which has typical clear weather in the PRD region.
The result (as summarized in
Table 4) suggests the WRF simulation in the study has a similar performance to the WRF with SLUCM. The larger wind speed forecasted in WRF with SLUCM could be attributed to the relatively high altitude of the lowest vertical layer.
3.2. 2-m Temperature
3.2.1. Spatial Analysis for Daytime and Nighttime Temperature
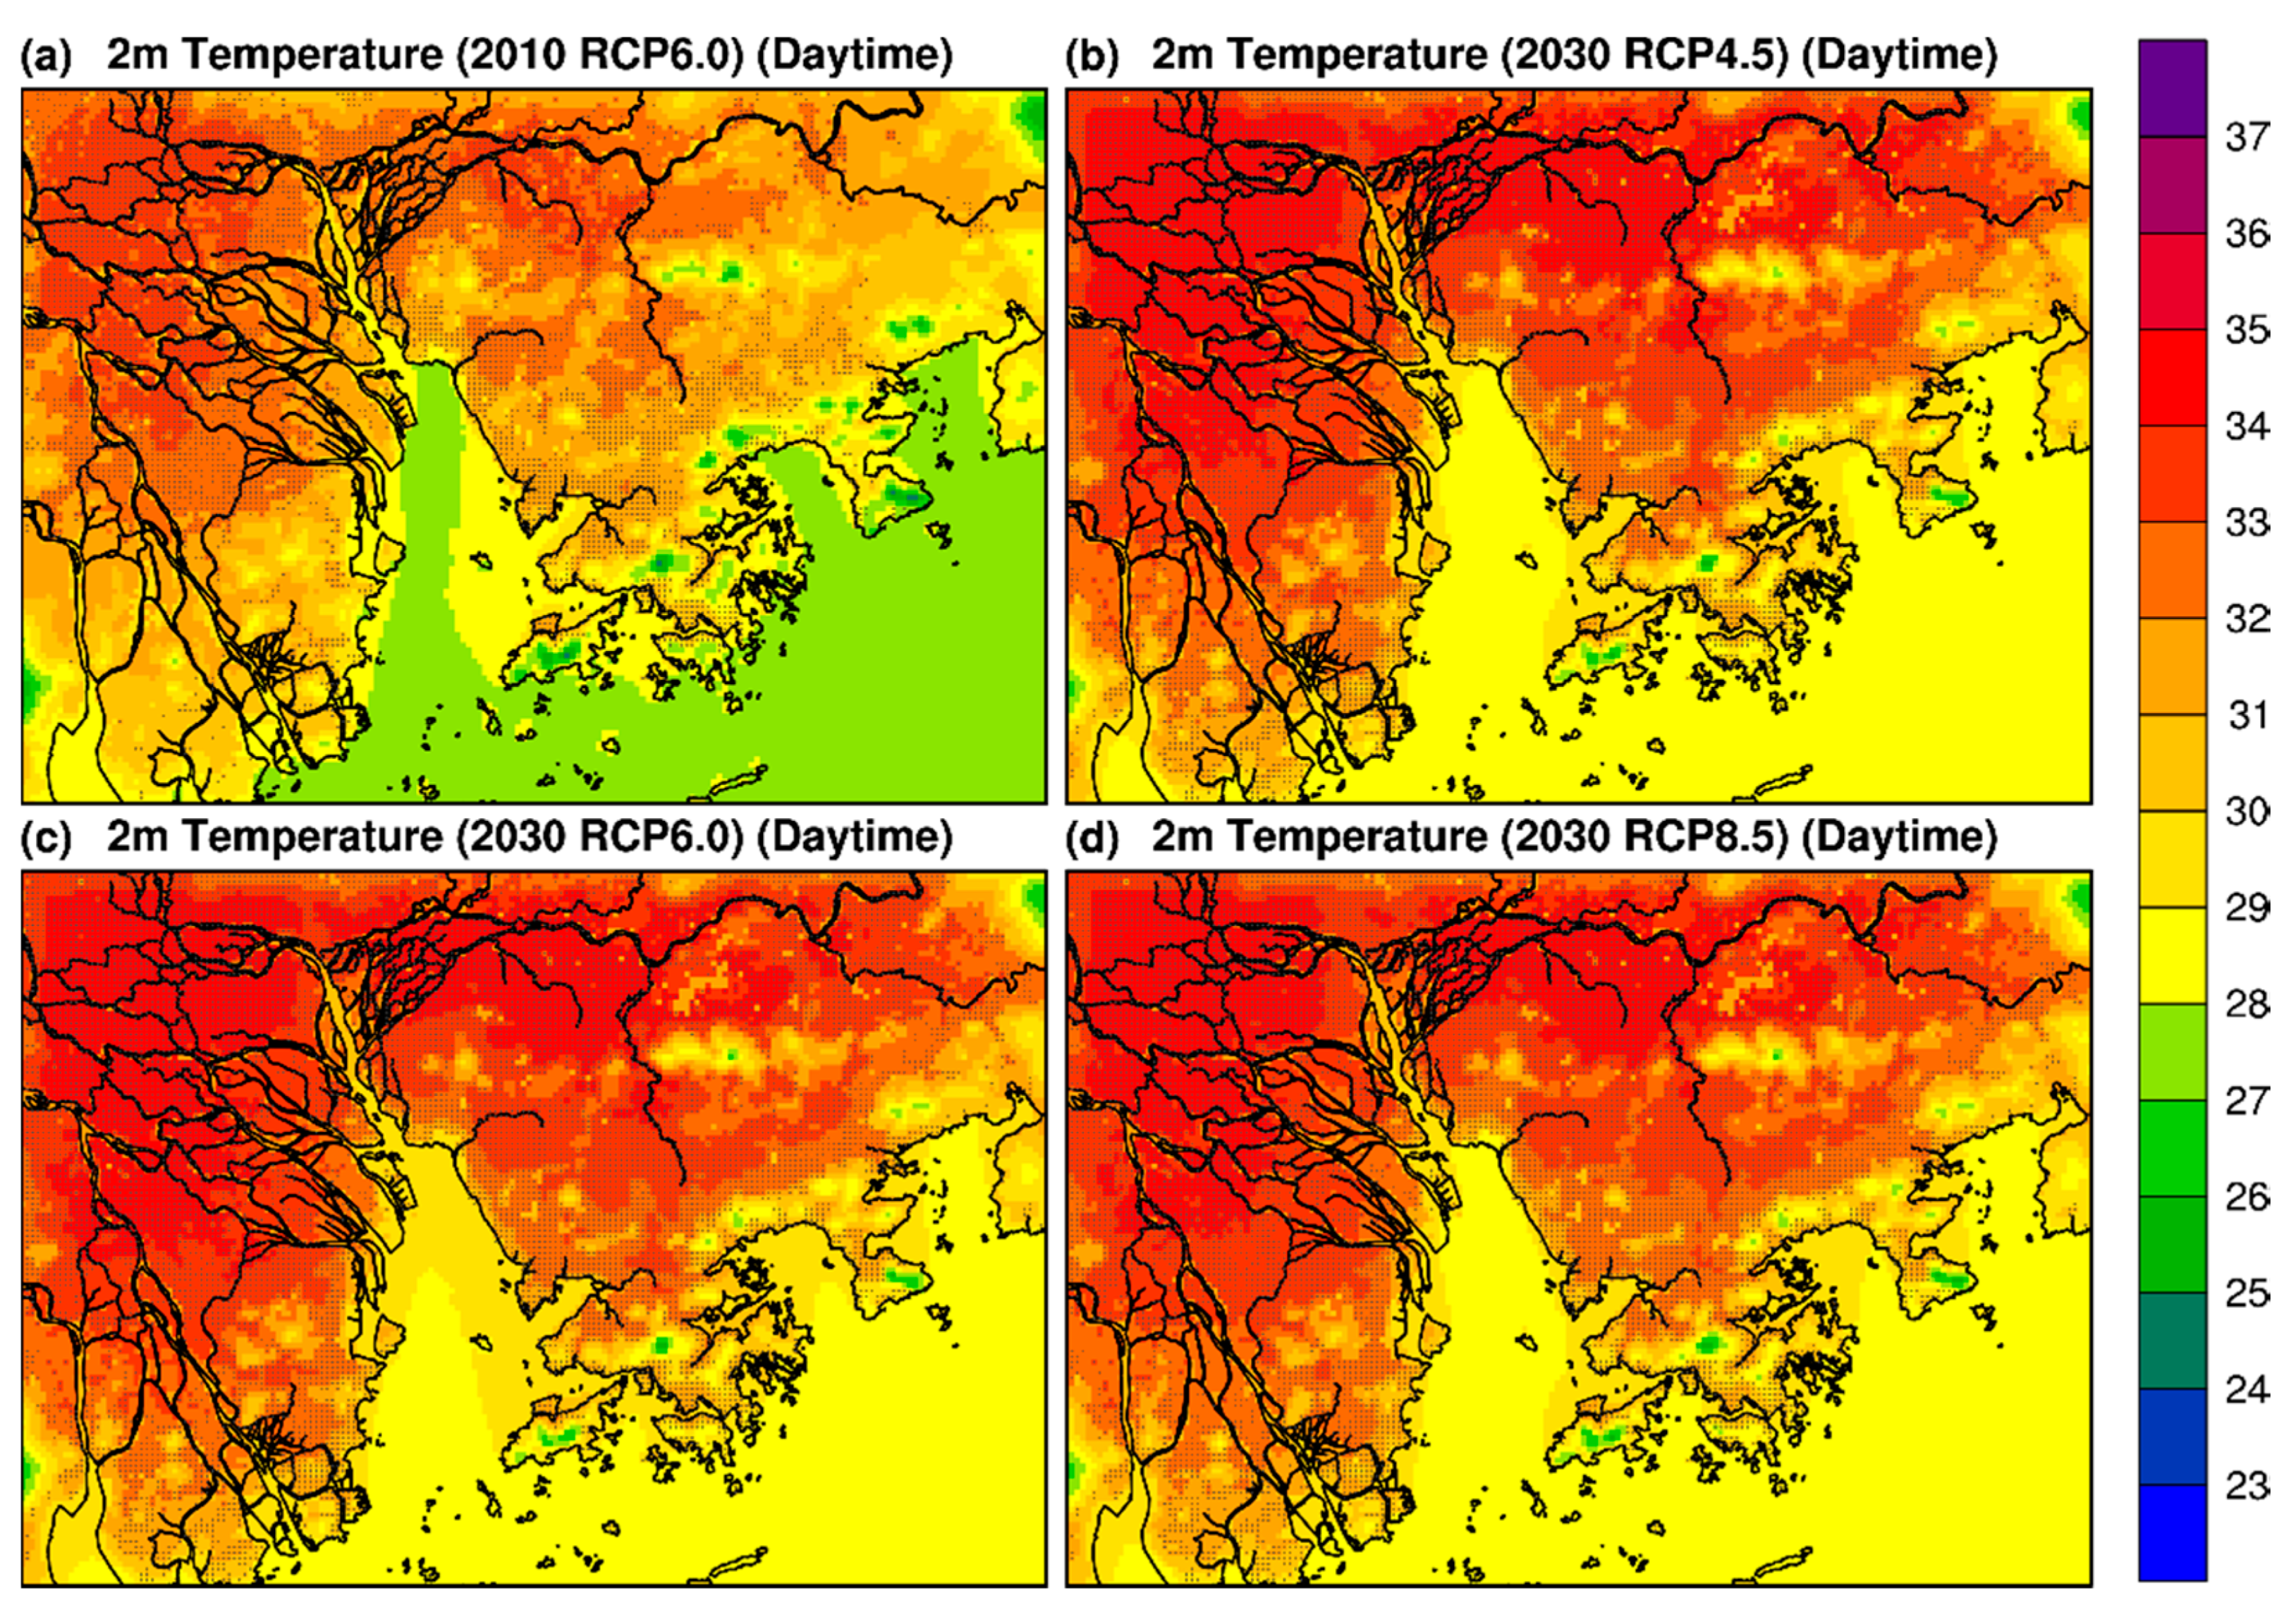
The warming trend can be observed by comparing current and future scenarios. More areas reached 34 °C and 30 °C during the daytime and nighttime, respectively (
Table 5). Most of these areas are urban and inland. In contrast, no grid cells in coastal areas exceed the specified temperature, which can be explained by the southerly wind helping to reduce the temperature.
Overall, there were 1–2 °C increases in temperature during both daytime and nighttime (
Figure 4 and
Figure 5), with lower temperatures in the mountainous areas, as shown in
Figure 3. A significant temperature increase in inland areas can be observed, particularly in regions with considerable urbanization. Moreover, the temperature in these regions is higher than the surrounding rural areas, indicating there is an urban heat island effect. For instance, compared with the current scenario, the northeastern part of the simulation domain, where rural areas were predicted to become urban (high-rise), as shown in
Figure 1, can exhibit a 2–3 °C increase in temperature when compared
Figure 4a –d. This increase can occur because the urban build-up will modify the land surface properties, with a lower albedo, higher heat capacity for absorbing energy, higher heat storage, and less vegetation [
45]. The change in these physical properties is realized in Noah-LSM.
Due to further urbanization in the future scenarios, a general increase in sensible heat flux and a decrease in latent heat flux can be observed.
Figure 6 shows the hourly averaged values of the sensible and latent heat flux in a and b, respectively, using only urban grids in domain 4 in the future scenario. Urbanization caused the sensible heat flux to increase from 250 Wm
−2 to over 300 Wm
−2 at noon (1200 LST) (
Figure 6a). With less vegetation and the consequent decrease in plant transpiration, the latent heat flux is reduced considerably. The peak is decreased from around 130 Wm
−2 at 1300 LST to nearly 0 (
Figure 6b). Note both the time series of sensible heat flux and latent heat flux is almost the same, respectively, in future scenarios. This is because the dominant factors, including but not limited to sunlight and vegetation areas, affecting these heat flux, almost remain unchanged.
3.2.2. Changes in the Original Urban and Rural Areas
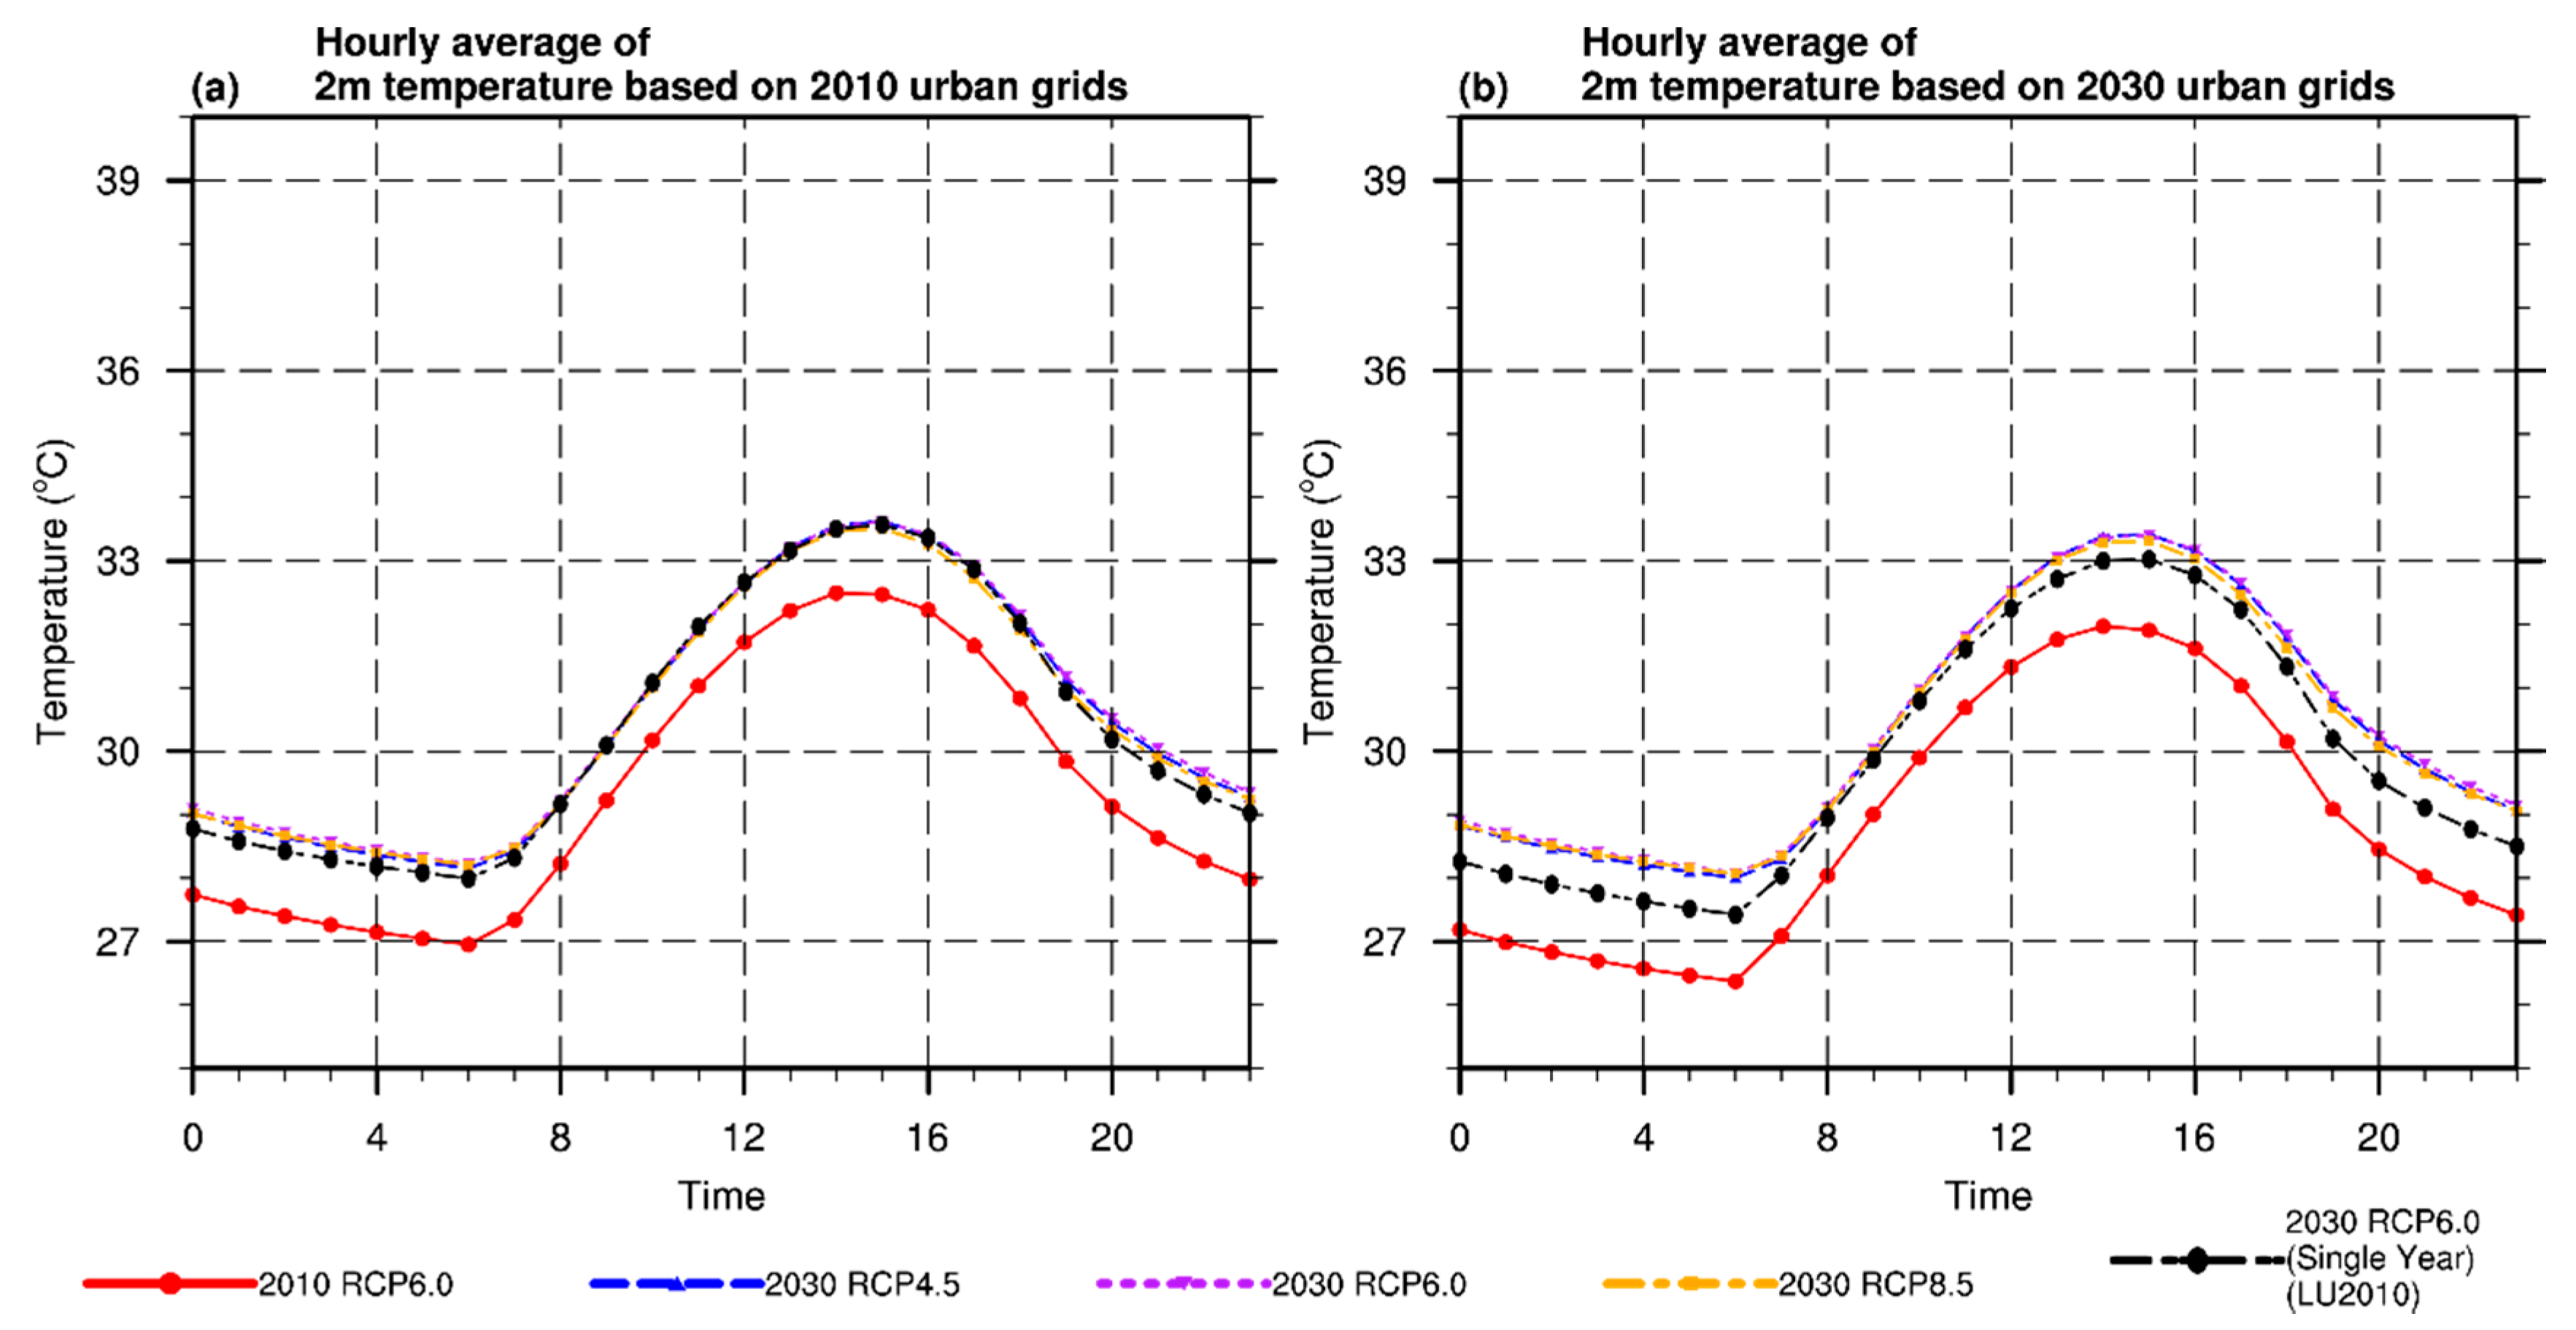
Figure 7 shows the hourly average of the 2-m temperature based on the urban grids in domain 4, which are already classified in the current scenario (2010 RCP6.0) (
Figure 7a) and the future scenario (
Figure 7b). Diurnal variation of the temperature can be observed in all scenarios. Solar radiation heats up the ground after sunrise (0600 LST), and the temperature reaches its maximum point in the afternoon (1400 LST). After sunset, the cooling begins due to lessened solar radiation (1400 LST–0600 LST) until the sunrise the next day. Note that all of the future scenarios are approximately 1 °C higher in temperature than the current scenario. In particular, there is a larger temperature difference when the average is based on classified urban areas projected for 2030 (
Figure 7b). Overall, the higher temperature can be attributed to the predicted rapid urbanization and the impact of global warming projected by the global climate model.
To understand the importance of each factor (i.e., global warming and urbanization) individually, the model must be run separately for only 2030 with RCP6.0 and with the 2010 WUDAPT land use (“2030 RCP6.0 (LU2010)”).
Figure 7a shows that the net effect of global warming results in an approximately 1 °C higher temperature between the 2030 RCP6.0 and the 2030 RCP6.0 (LU2010). To evaluate the impact of urbanization, the average temperature based on urban grids in domain 4 in 2030 is still applied to the 2030 RCP6.0 (LU2010) case (
Figure 7b). From the figure, we see that the temperature generally increases for 0.2–0.3 °C, with a stronger magnitude after midnight (0000 LST–0500 LST).
The inter-scenario comparisons in the time series plot (both
Figure 7a,b) are also consistent with the spatial analysis. Furthermore, the time series of the temperature in the future scenario is similar across all the RCP scenarios, suggesting these RCP scenarios do not make a significant difference in climatological impact on the PRD region in the future scenario.
3.3. 10-m Wind Speed
3.3.1. Spatial Analysis for Daytime and Nighttime Wind Speed
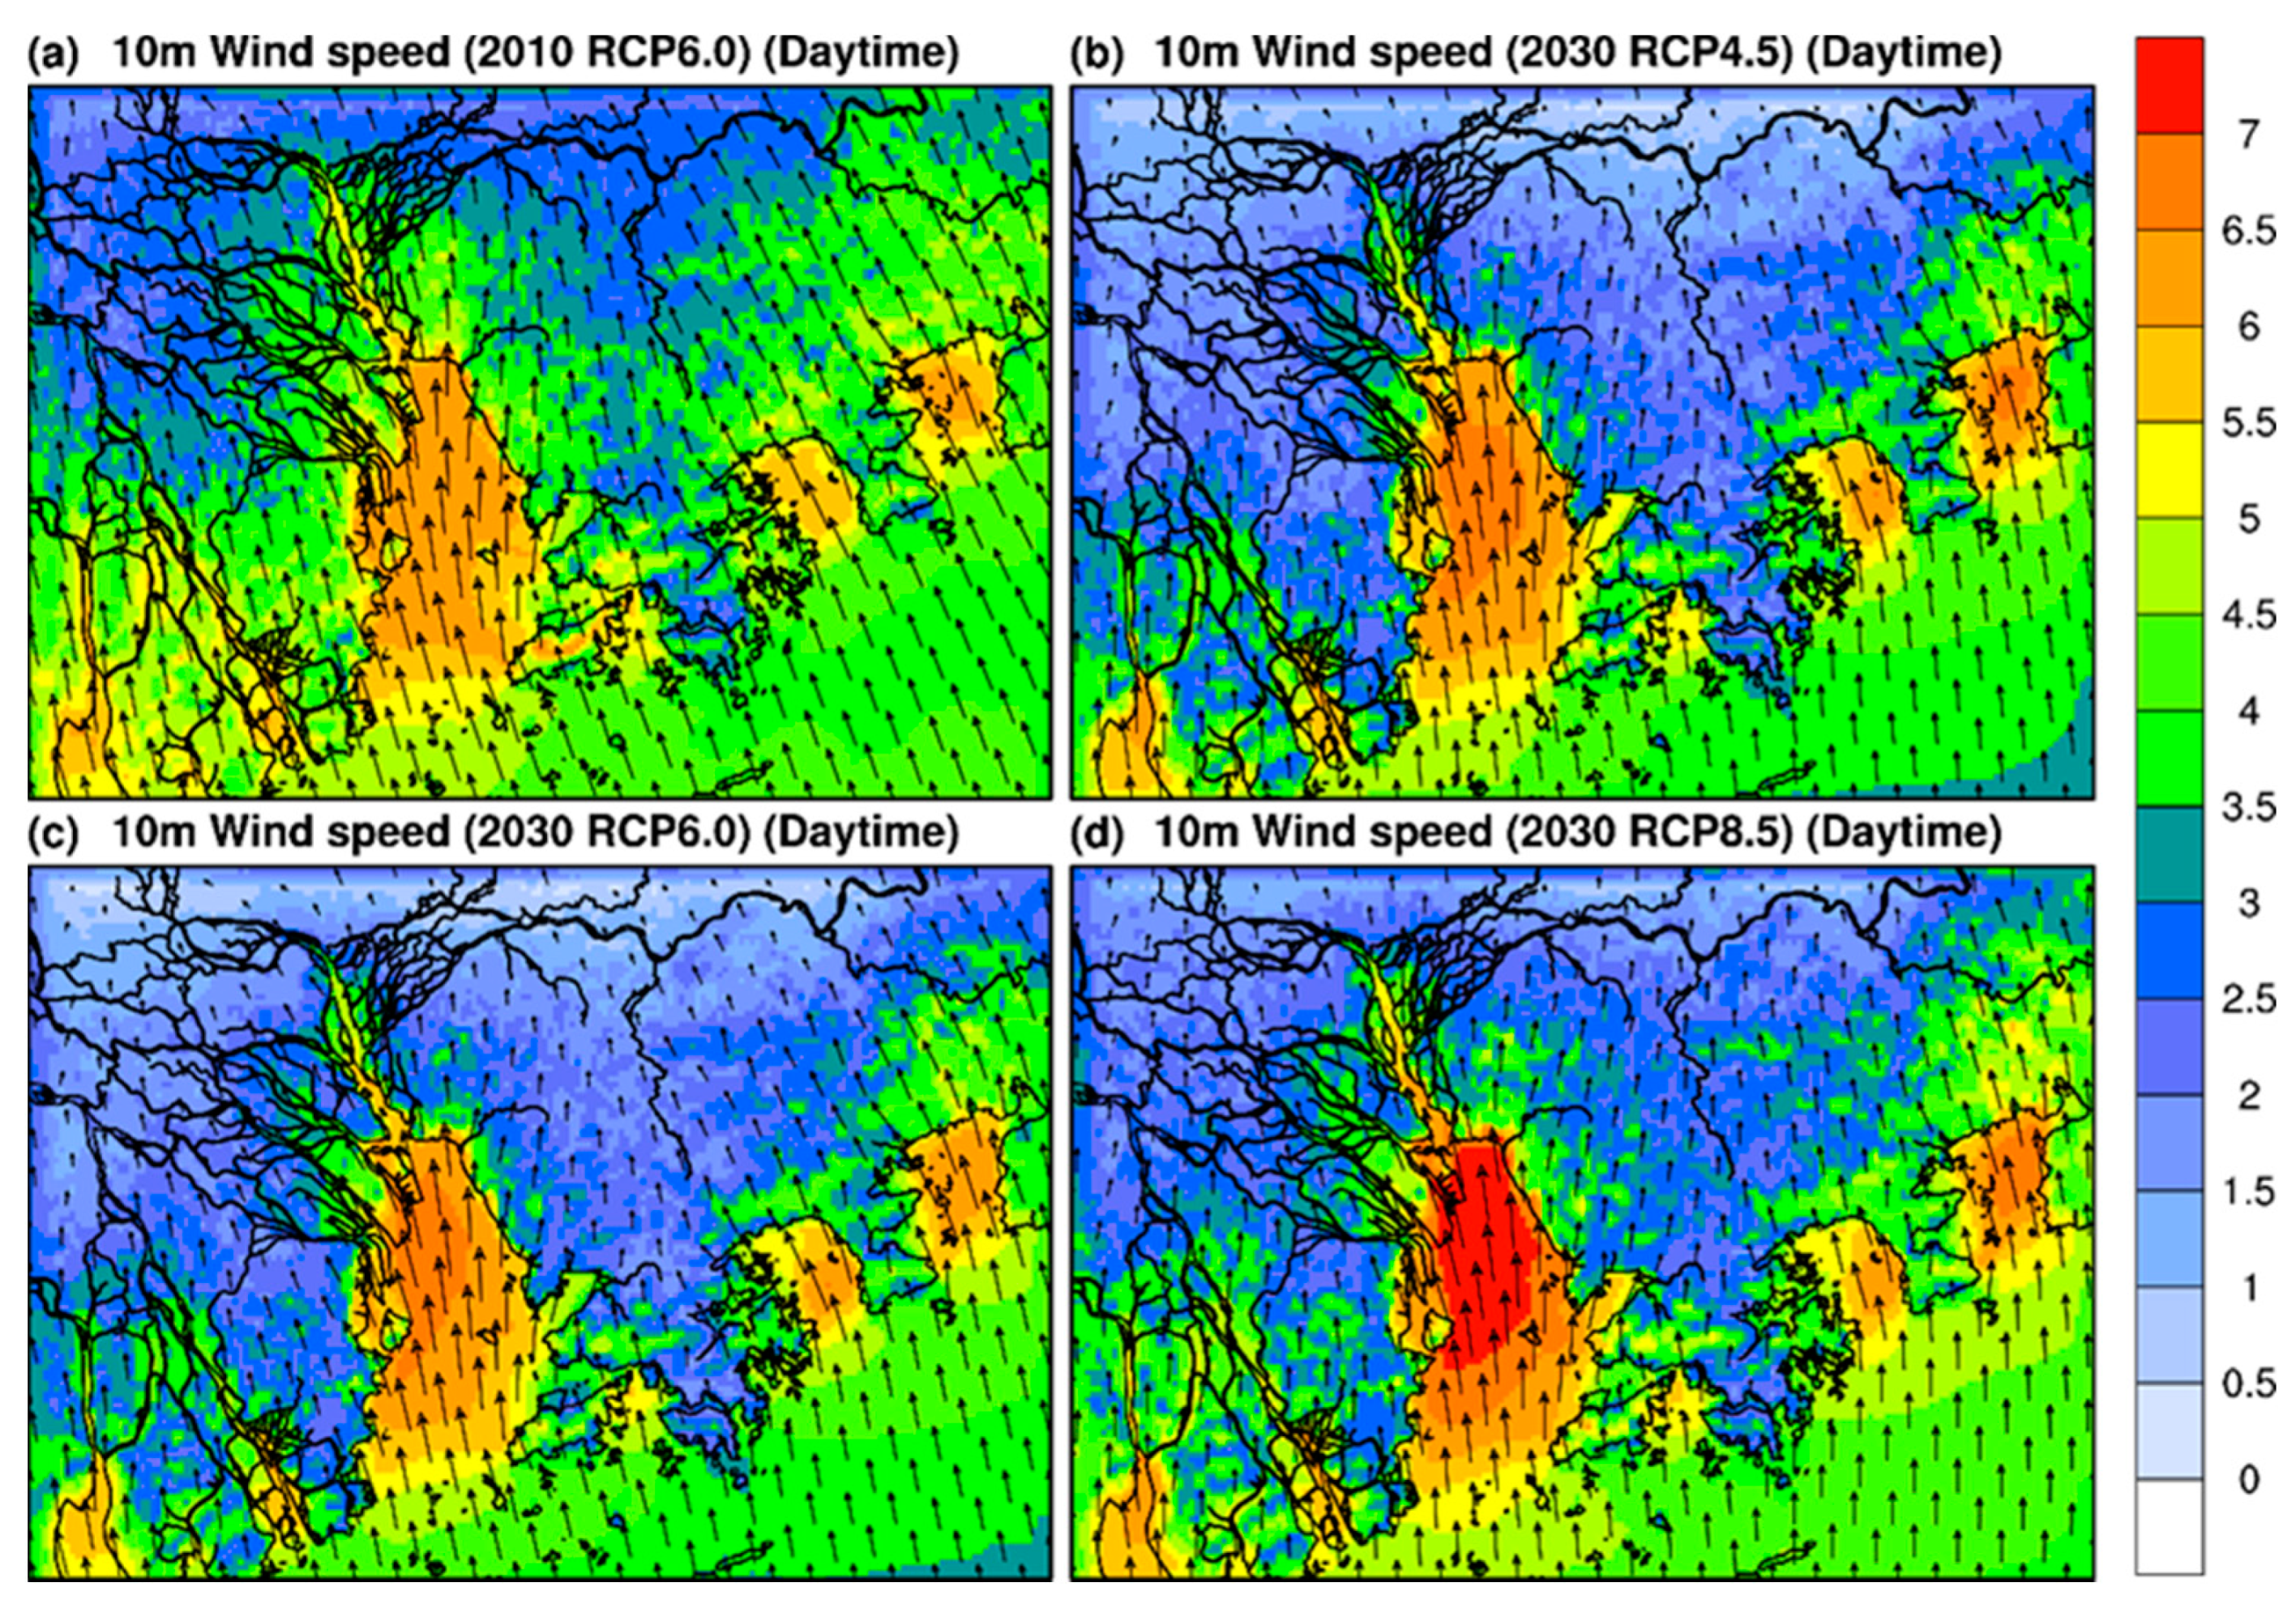
There is widespread weakened wind speed in inland areas, particularly during the daytime, due to the appreciable urbanization predicted from 2010 to 2030. For example, the wind speed in the Huizhou region is expected to be reduced from approximately 4.5 ms
−1 (
Figure 8a) to 2.5 ms
−1 (
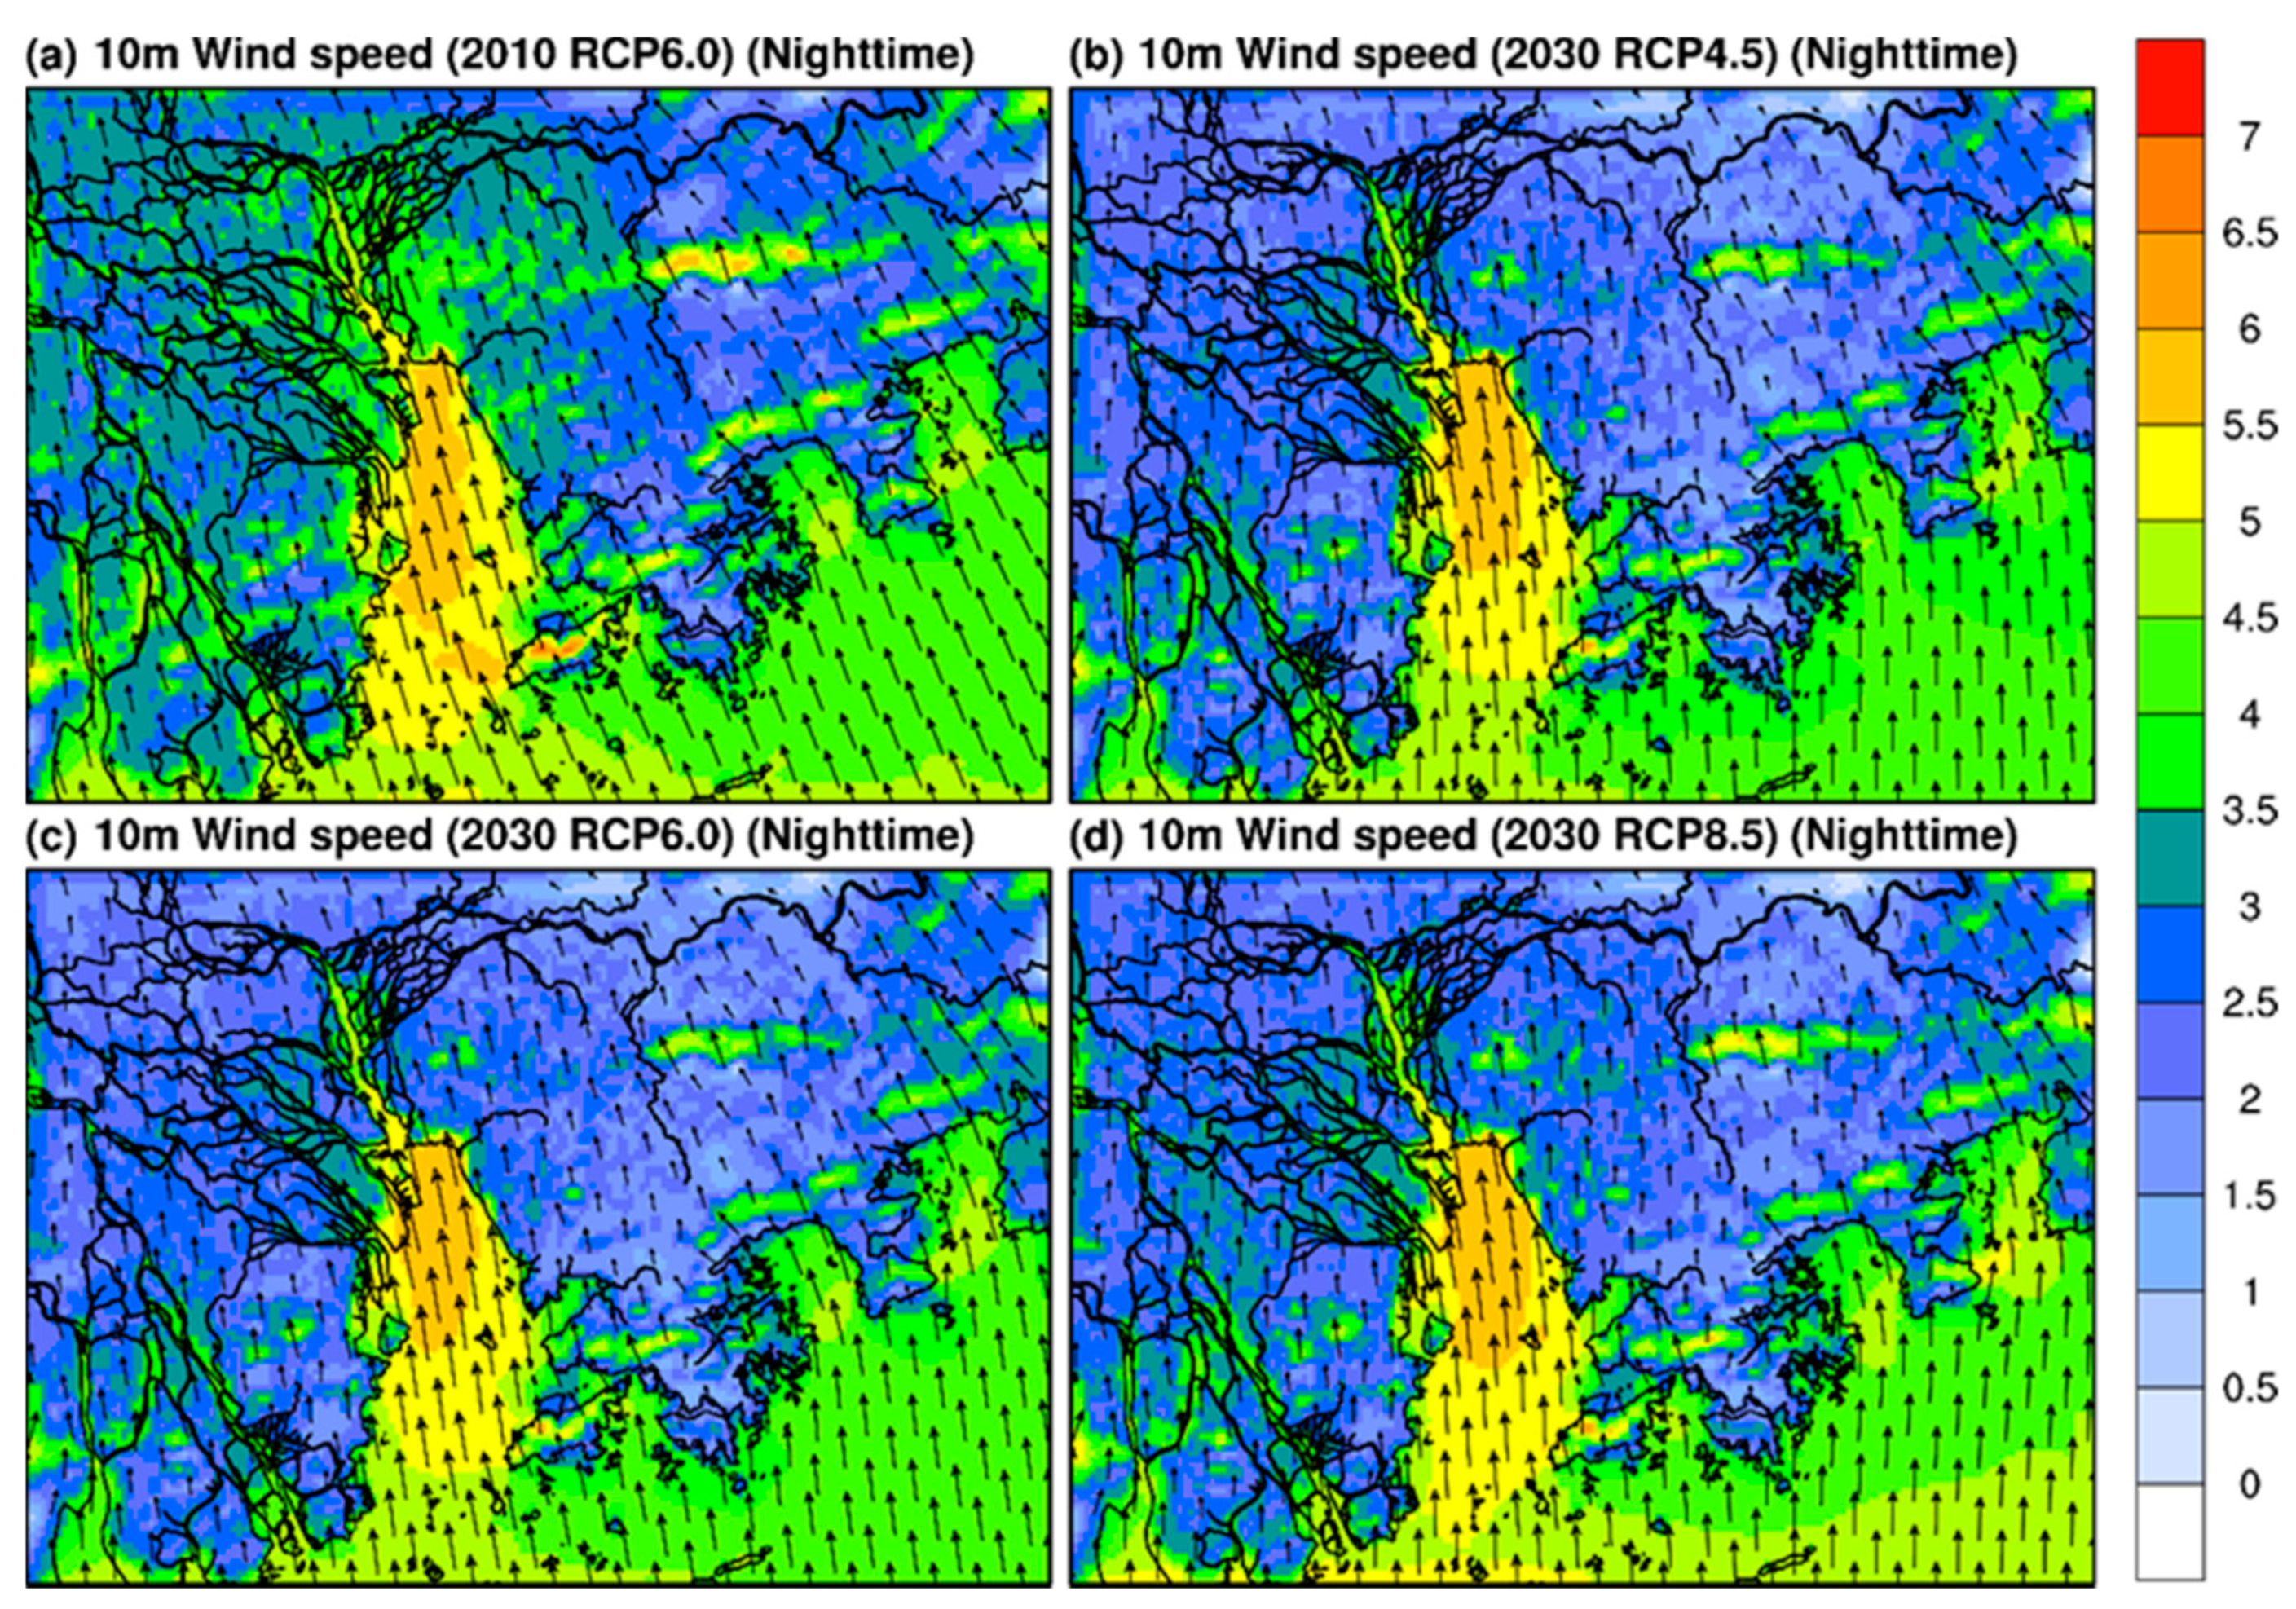
Figure 8b–d) during the daytime. However, the decrease is less evident during the nighttime (
Figure 9). This can be explained by the diurnal variation of the boundary layer, which is the dominant factor in wind speed reduction during nighttime. After sunset, the ground surface loses heat faster than the air, and typically, a stable boundary layer is formed at the lower part of the atmosphere. This explains the reduction in wind speed at night across all the scenarios. Given the already weakened wind speed due to the boundary layer, further urbanization will be less effective in reducing nighttime wind speed.
Apart from the declining wind speed, the land-sea breeze effect can be observed in the coastal areas of the PRD region. In particular, the coastal area of the Pearl River Estuary was analyzed by Lo et al. (2006) [
46].
A comparison of the wind speed of coastal areas between the control (
Figure 8a) and the future scenarios (
Figure 8b–d) reveals that the land-sea breeze is intensified in the coastal areas during the daytime. At the Pearl River Estuary, the wind speed is increased from 5.5 ms
−1 to 6.0 ms
−1, and 2030 RCP8.5 has a spread of 7.0 ms
−1 (
Figure 8d). The intensification of the land-sea breeze during daytime can be explained by the strengthened temperature gradient between the ocean and inland areas due to land use changes.
Figure 10 shows the temperature changes along the line between the ocean and the coastal regions in the Pearl River Estuary. When compared with 2010 RCP6.0, there is a steeper change of temperature in all future scenarios near 22.79 N, which can be attributed to the further urbanization predicted for 2030. Initially, it took approximately 6 model grids to have a 0.5 °C increase in temperature, while it only required 3 model grids points to achieve that same increase in the future scenario.
Despite the intensification of land-sea breeze during the daytime, its associated penetration depth is reduced because of further urbanization of the coastal areas. Such an effect can also be observed in the Pearl River Estuary, where an abrupt change of wind speed magnitude occurs during the daytime in the 2030 scenarios (
Figure 8b–d). The wind speed is significantly reduced from 4 ms
−1 to 2 ms
−1 near the coastal areas.
3.3.2. Changes in the Original Urban and Rural Areas
Similar to
Section 3.2.2, time-series considering only urban grids in domain 4 in 2010 and 2030 have been plotted (
Figure 11). In the figure, all the scenarios show the diurnal variation of wind speed. Wind speed starts to climb after the sun rises (0600 LST) due to the heating of ground surfaces and starts to weaken after sunset because of nocturnal cooling. Generally, the wind speed in future scenarios is weakened due to the rough and varied terrain created during urbanization. The weakening is magnified during the daytime when the momentum in the boundary layer is relatively high. For example, at 1700 LST, the wind speed is reduced from around 3.5 ms
−1 (in 2010 RCP6.0) to 2.5–3 ms
−1 (
Figure 11a). The difference is more significant when taking into consideration urbanization in rural areas in future scenarios. (
Figure 11b).
A comparison of the future scenarios shows that the 2030 RCP8.5 scenario has a relatively higher wind speed in urban areas, while that of the 2030 RCP4.5 and 2030 RCP6.0 scenarios is approximately the same. The stronger wind speed in the 2030 RCP8.5 scenario could be attributed to a stronger background wind, as simulated by WRF, leading to higher wind speeds in urban areas.
3.4. 2-m Wet-Bulb Globe Temperature
It is important to understand the impact of local climate changes on humans. The wet-bulb globe temperature (WBGT) is selected to evaluate human heat stress because it is not only an internationally used heat index [
47] but has often been adopted by the Hong Kong Observatory, the Hong Kong Sports Institute, and the Kau Sai Chau Golf course in Hong Kong as an outdoor heat stress assessment metric for planning and organizing events. Based on WBGT, indicators are created to suggest what precautionary steps should be taken by the general public. For instance,
Table 6 shows the threshold of WBGT developed by the Japan Sports Association in 2013 [
48].
WBGT is calculated using the following formula [
49,
50]:
where
Tw is the wet-bulb temperature,
Tg is the globe temperature, and
Td is the dry-bulb temperature. Using the outputs from the WRF,
Td is the 2-m temperature available from the model, while
Tg and
Tw are required to calculate using other formulas. For the calculation of
Tg, the method used by Kusaka et al. [
51] is adopted, which is as follows:
where S is the incoming solar radiation, and U is the magnitude of wind speed. Here, U = 1 ms
−1, as the wind speed at the 2-m level is not available from the WRF. Also, choosing U = 1 ms
−1 aims to take the weakened wind speed due to the closely-packed roughness element like trees and buildings into account when calculating the global temperature. For
Tw, the methodology of Dunne et al. [
52] is adopted to calculate
Tw using the 2-m temperature, 2-m relative humidity, and surface pressure.
3.4.1. Spatial Analysis for Daytime and Nighttime Wet-Bulb Globe Temperature
Figure 12 shows the general increase in the WBGT (0.5–1.5 °C) in future scenarios during the daytime, and the effect was magnified during nighttime (
Figure 13). Because of this increase, most areas achieved a WBGT of 32 °C and 29 °C during daytime and nighttime, respectively. According to the Japan Sports Association (2013), WBGT > 31 °C falls under the “danger” category where all physical exercise should be prohibited, while WBGT > 28 °C falls under “severe warning,” where the only heavy activity exercise is prohibited. Note that although people living in different environments may have different tolerances, overall, the increased WBGT in the simulation implies an elevated risk of associated heat-related morbidities, such as heat strokes and sleeping disorder, in the future scenarios. Potentially, this future dramatic warming trend may also cause extra cooling energy demand.
3.4.2. Changes in the Original Urban and Rural Areas
From
Figure 14, the WBGT in the future scenarios are consistently 2–3 °C higher than that in the current scenario. As a result, the WGBT value falls into the “danger” category for the whole day instead of after sunrise and before sunset. When comparing the future scenarios, the result is similar to the 2-m temperature, where the future scenarios generally have a higher WBGT than the current scenario.
In all future scenarios, most of the time, the WBGT in urban areas is higher than 28 °C, which falls under the “severe warning” category. This trend is consistent with the study by Kusaka et al. [
51], which predicts that Tokyo can expect a significant increase when the WBGT merits a severe warning.
4. Discussion
The results from the WRF simulations are generally consistent with those of similar studies. Concretely, the results predict temperature increases and weakening of wind speed in future scenarios. It is also found that the contribution of global warming is more significant than urbanization in terms of temperature increase, as suggested in the literature review in earlier sections. This is consistent with the study by Kusaka et al. [
25], which suggests that factors of urban development and results seen in regional climate models (e.g., WRF) have a limited contribution to an increase in temperature when compared with emission scenarios.
Compared with the Wang et al. [
24] results regarding the urbanization in the PRD region in past decades, which suggested a 1.4 ± 0.3 °C increase during the summer season, this study further projects a roughly 2.0 °C temperature increase between 2010 and 2030. As a result, it can be projected that there will be an overall 3.0 °C increase in temperature in the PRD region in the future.
However, there were numerous limitations to this experiment. Due to limited computational resources, only the result from CESM1 was chosen for downscaling in WRF. Although using only CESM1 for downscaling can take into consideration the inter-model uncertainty, it is still one of the representative results from the global climate model. Specifically, it is one of the models used in phase 5 of the Coupled Model Intercomparison Experiment (CMIP5) to support the assessment of the Intergovernmental Panel on Climate Change (IPCC). With the bias-corrected dataset, it corrects potential severe biases and hence prevents abnormal results from the regional climate model after downscaling [
53].
Apart from the limited computational resources, the uniqueness of the urban environment, especially in Hong Kong, also makes it difficult to couple the urban canopy model with WRF. In the PRD region, there is an exceptional number of skyscrapers, most of which exceed the first eta-level of the WRF simulation. This calls for a more complicated urban canopy model to be used, although it would be computationally expensive. Furthermore, setting up urban canopy models requires detailed city data, including but not limited to urban geometry. These data are either unobtainable or difficult to estimate. For these reasons, anthropogenic heat and detailed urban canopy are not included in the model simulation. However, assuming the anthropogenic heat to be constant in both the current and future scenarios, a 1–2 °C temperature increase still can be observed based on 2010 urban grids in domain 4. This can be attributed to global warming and the urbanization of surrounding areas.
5. Conclusions
Local climate changes due to future urbanization and climate change were analyzed. The results showed that the PRD region would generally experience increased temperature due to climate change and urbanization (around 1–2 °C increase). It is predicted that wind speed will be reduced, mainly due to urbanization. These phenomena have been observed in all future scenarios (2030 RCP4.5, RCP6.0, and RCP8.5). From the comparison of future scenarios with and without urban land use data, the results also suggest that global warming has a more significant impact on temperature increase than urbanization does.
Moreover, the high temperature and associated WBGT values attained in the future scenarios suggest a high risk of heat-related illnesses. It was projected that the urban areas in the PRD region would have WBGT greater than 28 °C, which merits a “severe warning” categorization, meaning that it is advised not to perform heavy exercises. The findings from this study, which used the PRD region as an example, can deepen the understanding of how local climate responds to rapid urbanization and various future emission scenarios. It also provides planners and local governments with science- and evidence-based information and insight into the location and magnitude of heat-related risk to public health during the summer. This information serves to improve decision making on local mitigation and adaptation strategies for improving cities’ resilience and livability. The study can also serve as a useful reference for other megacities, existing and emerging, especially those in the sub-tropical coastal regions undergoing rapid urbanization. Furthermore, this study demonstrates a possible way to address the global call from the United Nations to develop sustainably by 2030. In particular, of the 17 Sustainable Development Goals (SDG), this study is especially relevant to SDG 11 (sustainable cities and communities) and SDG 13 (climate action).

 ,
, 


