Article

Large Variations in N2O Fluxes from Bioenergy Crops According to Management Practices and Crop Type

1
BioEcoAgro Joint Research Unit, INRAE, Université de Liège, Université de Lille, Université de Picardie Jules Verne, F-02000 Barenton-Bugny, France
2
BioEcoAgro Joint Research Unit, INRAE, Université de Liège, Université de Lille, Université de Picardie Jules Verne, F-80203 Péronne, France
*
Author to whom correspondence should be addressed.
Atmosphere 2020, 11(6), 675; https://doi.org/10.3390/atmos11060675
Submission received: 28 April 2020 / Revised: 23 June 2020 / Accepted: 24 June 2020 / Published: 26 June 2020

Abstract

:
Field N2O emissions are a key point in the evaluation of the greenhouse gas benefits of bioenergy crops. The aim of this study was to investigate N2O fluxes from perennial (miscanthus and switchgrass), semi-perennial (fescue and alfalfa) and annual (sorghum and triticale) bioenergy crops and to analyze the effect of the management of perennials (nitrogen fertilization and/or harvest date). Daily N2O emissions were measured quasi-continuously during at least two years in a long-term experiment, using automated chambers, with 2–5 treatments monitored simultaneously. Cumulative N2O emissions from perennials were strongly affected by management practices: fertilized miscanthus harvested early and unfertilized miscanthus harvested late had systematically much lower emissions than fertilized miscanthus harvested late (50, 160 and 1470 g N2O-N ha−1 year−1, respectively). Fertilized perennials often had similar or higher cumulative emissions than semi-perennial or annual crops. Fluxes from perennial and semi-perennial crops were characterized by long periods with low emissions interspersed with short periods with high emissions. Temperature, water-filled pore space and soil nitrates affected daily emissions but their influence varied between crop types. This study shows the complex interaction between crop type, crop management and climate, which results in large variations in N2O fluxes for a given site.

1. Introduction

Nitrous oxide (N2O) is a potent greenhouse gas (GHG), with a 100-year global warming potential of 265–298 CO2 equivalents [1]. Its atmospheric concentration has increased by 20% since pre-industrial times and N2O represented 6.2% of the total anthropogenic GHG emissions in 2010 [1]. N2O is also currently the most important ozone-depleting substance after the success of the Montreal Protocol to regulate the emissions of chlorofluorocarbons [2]. Agriculture is the largest anthropogenic source of N2O emissions, with a relative share in total anthropogenic emissions of about 60% [3]. Reducing N2O emissions from agricultural soils is thus an important element of climate change mitigation and ozone protection strategies [4].
N2O emissions from soils predominantly originate from two microbial processes [5]: nitrification (oxidation of ammonium to nitrite and nitrate), which occurs under aerobic conditions, and denitrification (reduction of nitrate to N2), taking place in anaerobic conditions. N2O emissions are characterized by a very high spatial and temporal variability, caused by a multitude of interacting controls [6]. Because the availability of mineral nitrogen (N) is a major driver of N2O soil emissions, N input to soil is globally a key factor of N2O fluxes from agricultural soils [7,8]. N2O emissions are also strongly influenced by soil moisture and temperature, as well as other factors such as carbon availability, soil texture or pH [6].
Bioenergy crops are expected to contribute to the energy transition in response to the challenges of climate change and depletion of fossil resources [9]. However, the GHG benefits of first-generation biofuels produced from conventional annual food crops have been widely questioned, notably because of the N2O emissions associated to their large N requirements [10,11]. Among second generation biofuel options, the use of perennial C4 crops (perennial crops which photosynthesize following the mechanism called C4 photosynthesis) such as miscanthus and switchgrass is expected to improve the GHG balance because of their high yields and low N requirements [12,13,14]. These low N requirements are partly due to N cycling within the crop: in spring, part of the belowground nitrogen stocks are remobilized from belowground to aboveground organs and, during autumn and winter, part of the nitrogen accumulated in aboveground parts is subsequently remobilized from aboveground to belowground organs [15]. Nevertheless, fertilizing these crops could remain necessary to maintain high yields and soil fertility in the long term [15,16,17]. Beyond N fertilization, management of perennial crops may also affect N2O emissions through other ways, notably harvest date. In Europe, miscanthus and switchgrass are often harvested in late winter or early spring to benefit from improved quality with regard to combustion processes (i.e., low moisture content). However, with the development of other conversion technologies (such as second-generation biofuels), these crops could be also harvested in autumn. One advantage of this early harvest would be to potentially achieve higher yields, because the carbon transfer from aboveground to belowground organs in autumn and the loss of senescent leaves in winter could be partly avoided [18]. On the contrary, early harvesting increases N removal and reduces N transfer to the belowground organs, leading to lower N recycling and therefore higher fertilizer N requirements [18]. The impact of harvest date on N2O emissions from perennial bioenergy crops has received little attention in the literature. To our knowledge, only Johnson and Barbour [19] and Peyrard et al. [20] compared autumn and spring harvests with switchgrass or miscanthus, respectively. Both studies showed higher N2O emissions in late (spring) than in early (autumn) harvest for the same fertilizer N rate. This effect was attributed for miscanthus to the stimulation of denitrification by the accumulation of fallen leaves at soil surface in late harvest [20]. Further investigations are required to better understand the drivers of N2O emissions from perennial bioenergy crops, particularly to distinguish between crop-specific and management effects.
Semi-perennial forage crops (C3 grasses such as fescue) and annual crops also remain an option for second-generation biofuels. To our knowledge, there is no experimental comparison between C4 perennial crops and semi-perennial crops available in the literature regarding N2O emissions. Only few studies have compared N2O emissions from annual and perennial C4 bioenergy crops [19,21,22,23,24]. In four studies out of five, N2O emissions from perennial C4 bioenergy crops were lower than from annual crops, but perennial crops were either not fertilized or fertilized at a much lower N rate than annual crops. Only Johnson and Barbour [19] found higher N2O emissions under switchgrass than under an annual crop rotation over three years, with fertilizer N rates similar between perennial and annual crops. Almost all experimental studies evaluating the effect of N fertilization on N2O emissions from C4 perennial bioenergy crops have shown a significant increase of N2O emissions with increasing N rates [25,26,27,28,29,30,31,32,33]. Ruan et al. [28] tested eight N fertilizer rates from 0 to 196 kg N ha−1 year−1 during three years and observed an exponential increase in annual N2O emissions from switchgrass with increasing N fertilization. Beside fertilization, the length and timing of the growing season may also vary between annual and perennial crops, affecting N and water uptake and thus mineral N availability and soil water content [34].
A long-term experiment was set-up in 2006 in northern France in order to compare the yields and environmental impacts of various bioenergy crop with different management options [17]. In this study, we used this experiment to monitor N2O emissions from C4 perennial, C3 semi-perennial and annual bioenergy crops. Emissions were measured quasi-continuously during at least two years for a given treatment, with 2–5 treatments monitored simultaneously. We aimed at: (i) obtaining references on N2O emissions from C4 perennial crops, semi-perennial crops and annual crops; (ii) evaluating the effect of management practices (N fertilization and/or harvest date) on N2O emissions from C4 perennial crops; and (iii) studying the relationship between N2O fluxes and soil conditions that drive emissions (soil moisture, soil temperature and soil mineral nitrogen).

2. Experiments

2.1. Site and Experimental Design

The study was based on an ongoing long-term experiment located in Estrées-Mons, northern France (49.872 N, 3.013 E), called “Biomass & Environment” (B&E). The soil is a deep loamy Haplic Luvisol [35]. The 0–30-cm soil layer contains on average 17% clay, 78% silt and 5% sand. The climate is oceanic with continental influence. Over the 2008–2014 period, the mean annual temperature was 10.6 °C and the mean rainfall and potential evaporation were 697 and 706 mm year−1, respectively.
The B&E experiment was set up in 2006 to study the production and environmental impacts of a wide range of bioenergy crops, including C4 perennial crops, C3 “semi-perennial” crops (destroyed by soil tillage every two or three years) and C3/C4 annual crops [36]. The C4 perennial crops are miscanthus (Miscanthus × giganteus Greef & Deuter ex Hodkinson & Renvoize) and switchgrass (Panicum virgatum cv. Kanlow). The C3 semi-perennial crops are tall fescue (Festuca arundinacea) and alfalfa (Medicago sativa). Annual crops are fiber sorghum (Sorghum bicolor (L.) Moench cv. H133) and triticale (×Triticosecale Wittmack). Two harvest dates are compared for perennial crops: early harvest (E) in autumn (October) and late harvest (L) in late winter (February or March). The experiment also includes two nitrogen treatments for all crops: low N (N−) and high N (N+). Treatments are repeated three times with individual plots of 360 m2.
In this study, we focused on nine treatments (among the sixteen of the experiment), which were chosen to explore N2O emissions of a diversity of crop types, as well as the effect of management practices for perennial crops (Table 1): three treatments with miscanthus (early harvest N+, late harvest N+ and late harvest N−), two with switchgrass (early harvest N+ and late harvest N+), two with semi-perennial crops (rotations fescue–alfalfa N− and alfalfa–fescue N−) and two with annual crops (rotations sorghum–triticale N+ and triticale–sorghum N+). These treatments received 120 kg N ha−1 year−1 of mineral N fertilizer, except miscanthus L N−, which was not fertilized, and semi-perennial crops, for which fertilization was adapted according to the crop (alfalfa was not fertilized) and the year (fertilization of fescue varied between 0 and 120 kg N ha−1 according to the estimated soil N availability).
Miscanthus was planted in April 2006 and switchgrass was sown in June 2006. Fescue and alfalfa were sown in 2006, 2009, 2011 and 2014, usually in April, the previous crops being destroyed in early spring or late autumn by moldboard plowing (ca. 20 cm depth). These crops were harvested in two or three cuttings per year with the last cut in October. Sorghum was sown in late May and harvested in late September. Triticale was sown in mid-October and harvested in late July or early August. Regarding annual crops, the whole aboveground biomass was harvested. A catch crop was sown every year between triticale and sorghum (mustard–clover mixture). Annual crops were tilled superficially before sowing (12–15 cm deep) without inversion plowing. The N fertilizer was applied as urea ammonium nitrate (UAN) solution. Miscanthus and switchgrass received a single annual application in late April (all treatments were fertilized at the same date). Fescue was fertilized at the beginning of each cycle of growth, except for seedling crops which were not fertilized before the first cut. Sorghum received N fertilizer in late May before sowing and triticale in March and late April. No irrigation was used, except in May 2011 for semi-perennial and annual crops (58 mm in total).
Biomass production measured at harvest for the different treatments included in the study is given in the Supplementary Materials (Table S1). Previous studies have shown that most of the treatments included in this study have positive N surplus, except Mis E N+ and Mis L N− [17].

2.2. N2O Fluxes Measurement

N2O emissions were monitored between April 2008 and April 2014 using automated chambers [37]. Due to the limited number of available chambers, it was not possible to study the nine treatments at the same time. Consequently, 2–5 treatments were monitored simultaneously. For a given treatment, the monitoring duration varied between 17 and 42 months (29 months on average) (Figure 1). Three large size chambers were used to characterize each treatment.
This monitoring strategy was implemented in order: (i) to measure N2O emissions during at least two crop cycles for each treatment; (ii) to be able to compare different management options for perennial crops (harvest date and/or N fertilization) during the same periods, i.e., under the same climatic conditions; and (iii) to be able to compare different crop types during the same periods (miscanthus vs. semi-perennial crops and switchgrass vs. annual crops). Consequently, given the potential impact of climatic conditions on N2O fluxes, we only compared the cumulative emissions of treatments that were monitored over the same periods in order to avoid any confounding effect. Another option could have been to monitor a given treatment during the whole study, as a control or baseline for comparison between years. However, it would have reduced the possibility to explore different treatments without ensuring reliable comparisons between years. Indeed, climatic conditions may not have the same influence depending on the treatment and especially on the respective influence of nitrification and denitrification on N2O fluxes.
A major advantage of the automated chamber method is that it provides quasi-continuous measurements of N2O fluxes (four times per day). Compared to the manual closed chamber technique, it leads to much less gap filling, allows to capture short-term changes in the dynamics of emissions [38] and provides better estimates of cumulative emissions [39]. However, due to technical constraints (limited length of cables and pipes), automated chamber replicates for a given treatment are usually installed close to each other inside the same plot rather than in different plots (e.g., [40,41]). To check that the comparisons between treatments remained meaningful, we monitored on five occasions and during several months each time a given treatment simultaneously in two different plots (three chambers in one plot and three chambers in a second plot). We assumed that, if the cumulative N2O emissions were not significantly different between paired plots under the same treatment, differences between plots under different treatments could be attributed to a treatment effect.
Chamber size was 0.49 m2 (0.7 m × 0.7 m) for miscanthus and semi-perennial crops, 0.28 m2 (0.7 m × 0.4 m) for annual crops and 0.16 m2 (0.7 m × 0.23 m) for switchgrass. The chambers were inserted 8–11 cm into the soil, resulting in a headspace height of 14–17 cm, which was systematically measured. Chambers were placed in inter-row zones for highest crops (miscanthus, switchgrass and sorghum), while the plants were inside the chambers for fescue, alfalfa and triticale. They were removed only during field operations such as harvest or soil tillage. The chambers were distributed into sets of six chambers, each set connected to two infrared gas analyzers: one for CO2 (LI-COR Biosciences, LI-820) and the other for N2O (Thermo Environmental Instruments, 46c or 46i). Using pumps and valves controlled by a data logger (Campbell Scientific, CR1000), the six chambers were successively closed every 6 h (starting at 0, 6, 12 and 18 h GMT) during 18 min each. CO2 and N2O concentrations in the headspace were measured every 10 s and recorded by the data logger. Homogeneity of the air was maintained inside each chamber by a fan running during the measurement period. Ambient air concentrations were monitored before and after each sequence of measurements in order to detect any drift in concentration measurements.
CO2 measurements were mainly used to detect any problem with the chamber (e.g., leaks) and to correct N2O concentration for interference with CO2 concentration (the correction being small but not negligible). The CO2 flux (kg CO2-C ha−1 day−1) and N2O flux (g N2O-N ha−1 day−1) were calculated from the rate of change in CO2 concentration (ppm min−1) and N2O concentration (ppb min−1) as follows:
F = 0.144 h · M m V M ( d C d t ) t = t 0
where h (cm) is the headspace height, Mm the molar weight of C (12 g mol−1) or N (28 g mol−1), VM the molar volume (24.1 L mol−1 at 20 °C) and C the gas concentration. The 0.144 coefficient allows the conversion of m−2 min−1 to ha−1 day−1. To determine dC/dt at t0, a linear or an exponential model was fitted to the gas concentration kinetic measured during the 18-min period. A linear model was preferred if either the gas concentration kinetic was very close to linearity (rate constant of the exponential model < 0.01 min−1) or the quality of fit of the exponential model was not much better than that of the linear model (RMSEexp/RMSElin > 0.975). The setup and precision of the analyzers make it possible to detect fluxes of 1 g N2O-N ha−1 day−1 or larger.
The daily emissions were calculated as the mean of the four measurements made at 6-h interval for each chamber. Daily measurements were stored in a database managed with PostgreSQL. Missing data inside the monitored periods, which were due to problems with chambers or gas analyzers or to the removing of chambers during field operations, were filled in by linear interpolation. This gap filling represented 8% of the total database (containing 27,405 daily fluxes) and only 4% in terms of cumulative N2O fluxes. Cumulative emissions were calculated annually on year n by summing up daily fluxes from March (year n) to end of February (year n + 1), which was considered more pertinent than the calendar year from a crop cycle point of view. Six periods were thus distinguished for cumulative N2O emissions, from 2008–2009 to 2013–2014.

2.3. Soil Measurements

Volumetric soil water content (0–30 cm) was monitored using water content reflectometers (Campbell Scientific, CS616) in parallel with N2O measurements. Probes were inserted horizontally into the soil, either at 10 and 20 cm depth with two replicates per plot or at 15 cm depth with three replicates per plot. Soil temperature was monitored similarly using Campbell Scientific 107 probes. Data were recorded at an hourly time step using Campbell Scientific CR1000 data loggers and regularly collected in a database managed with PostgreSQL. Measurements from CS616 probes were then corrected for temperature variations using the equation provided by Rudiger et al. [42] and calibrated using gravimetric water content measurements and bulk densities obtained from previous measurements in the same experiment [34,43]. These data were aggregated to obtain daily values of soil temperature (at 15 cm depth), water content (0–30 cm) and water-filled pore space (WFPS), calculated assuming a solid density of 2.65 g cm−3.
Mineral nitrogen content (nitrate and ammonium) in the 0–30-cm soil layer was determined twice a year [36]. Additional sampling was achieved for miscanthus and semi-perennial crops. Soil cores (0–15 and 15–30 cm) were collected approximately eight times per year during two years with three replicates per plot. Gravimetric water content was determined; nitrate and ammonium were extracted using a 1 M KCl solution and measured by continuous flow colorimetry.

2.4. Data Analysis

Data analysis was performed with R 3.3.2 [44]. To test the absence of confounding effect, we first compared cumulative N2O emissions between plots having the same treatment and monitored simultaneously, using a Student test and after checking normality of data (Shapiro–Wilk test). Then, analysis of variance (ANOVA) was used to test the influence of the measurement period for each studied treatment. Finally, for each period of measurement, ANOVA was performed to test if the cumulative N2O emissions of the situations that were compared differed significantly. When significant effects were observed, significant differences between modalities (p < 0.05) were identified using the lsmeans function of the lsmeans package [45]. The assumptions of ANOVA were checked by visual examination of the residuals against predicted values and using Shapiro–Wilk and Levene’s tests. Box–Cox transformation was used when necessary to satisfy these assumptions.
We analyzed the influence of environmental conditions (temperature, WFPS, nitrate and ammonium contents in soil) on daily N2O emissions. Since soil mineral nitrogen content was not monitored continuously and not always available, we considered the period of 70 days following N fertilization as a proxy for a higher mineral N content, compared to low availability otherwise. For each crop type (perennial, semi-perennial and annual crops), we used a decision tree approach to establish a hierarchy of factors controlling N2O emissions. We used for that the rpart package [46]. Decision tree models are nested if-else conditions that, at each level, identify a key predictor variable and a threshold value that best separate a response variable of interest into two groups. The succession of such partitions provides a prediction model of the variable of interest. Because there are limited constraints on the choice of the variable used for partition, its distribution and the respective sizes of the two resulting groups, such models are efficient to capture the often non-linear nature of the processes driving N2O emissions and allow the identification of key thresholds in control variables. To limit the size of the trees and to retain only the most significant controlling factors, we set minsplit (minimum number of observation in a node to allow splitting) at 600 and cp (i.e., complexity parameter, the minimum increase of the overall R-squared at each step) at 0.05. Correlations and linear regressions were also applied as a complementary analysis. Finally, we used a covariance analysis to test if the relationship between N2O emissions and WFPS or soil nitrate content was treatment dependent.

3. Results

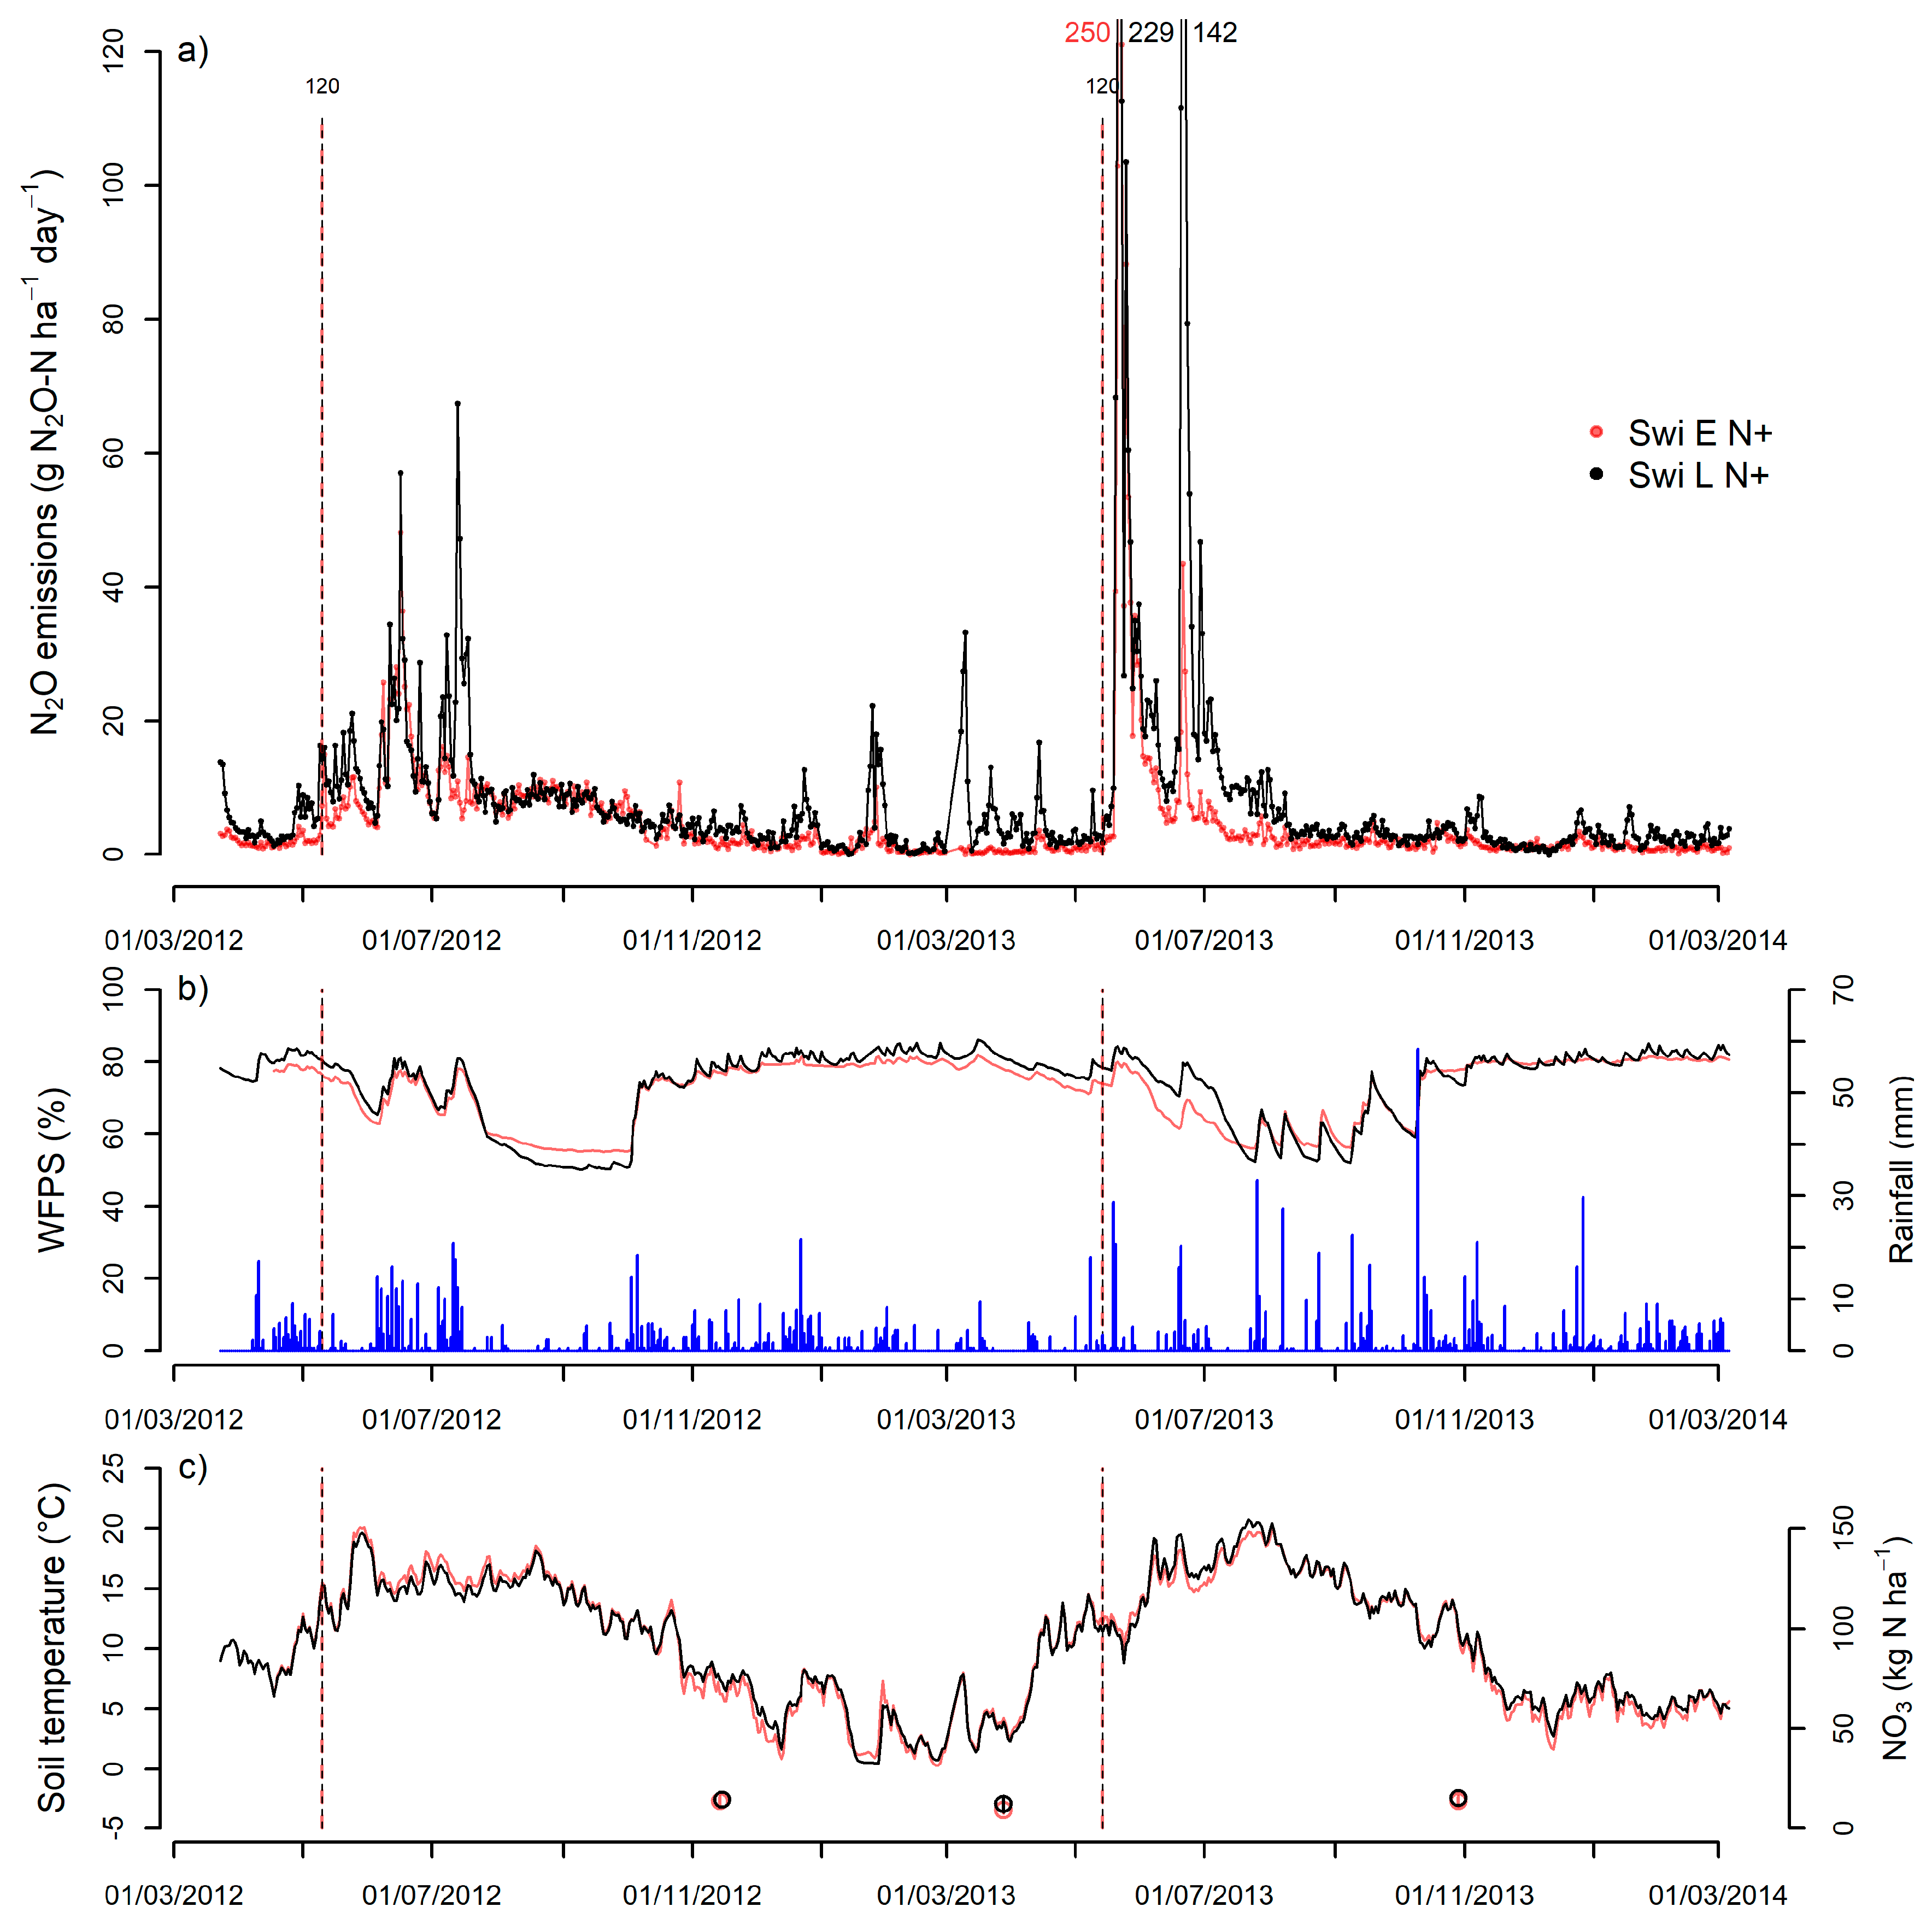
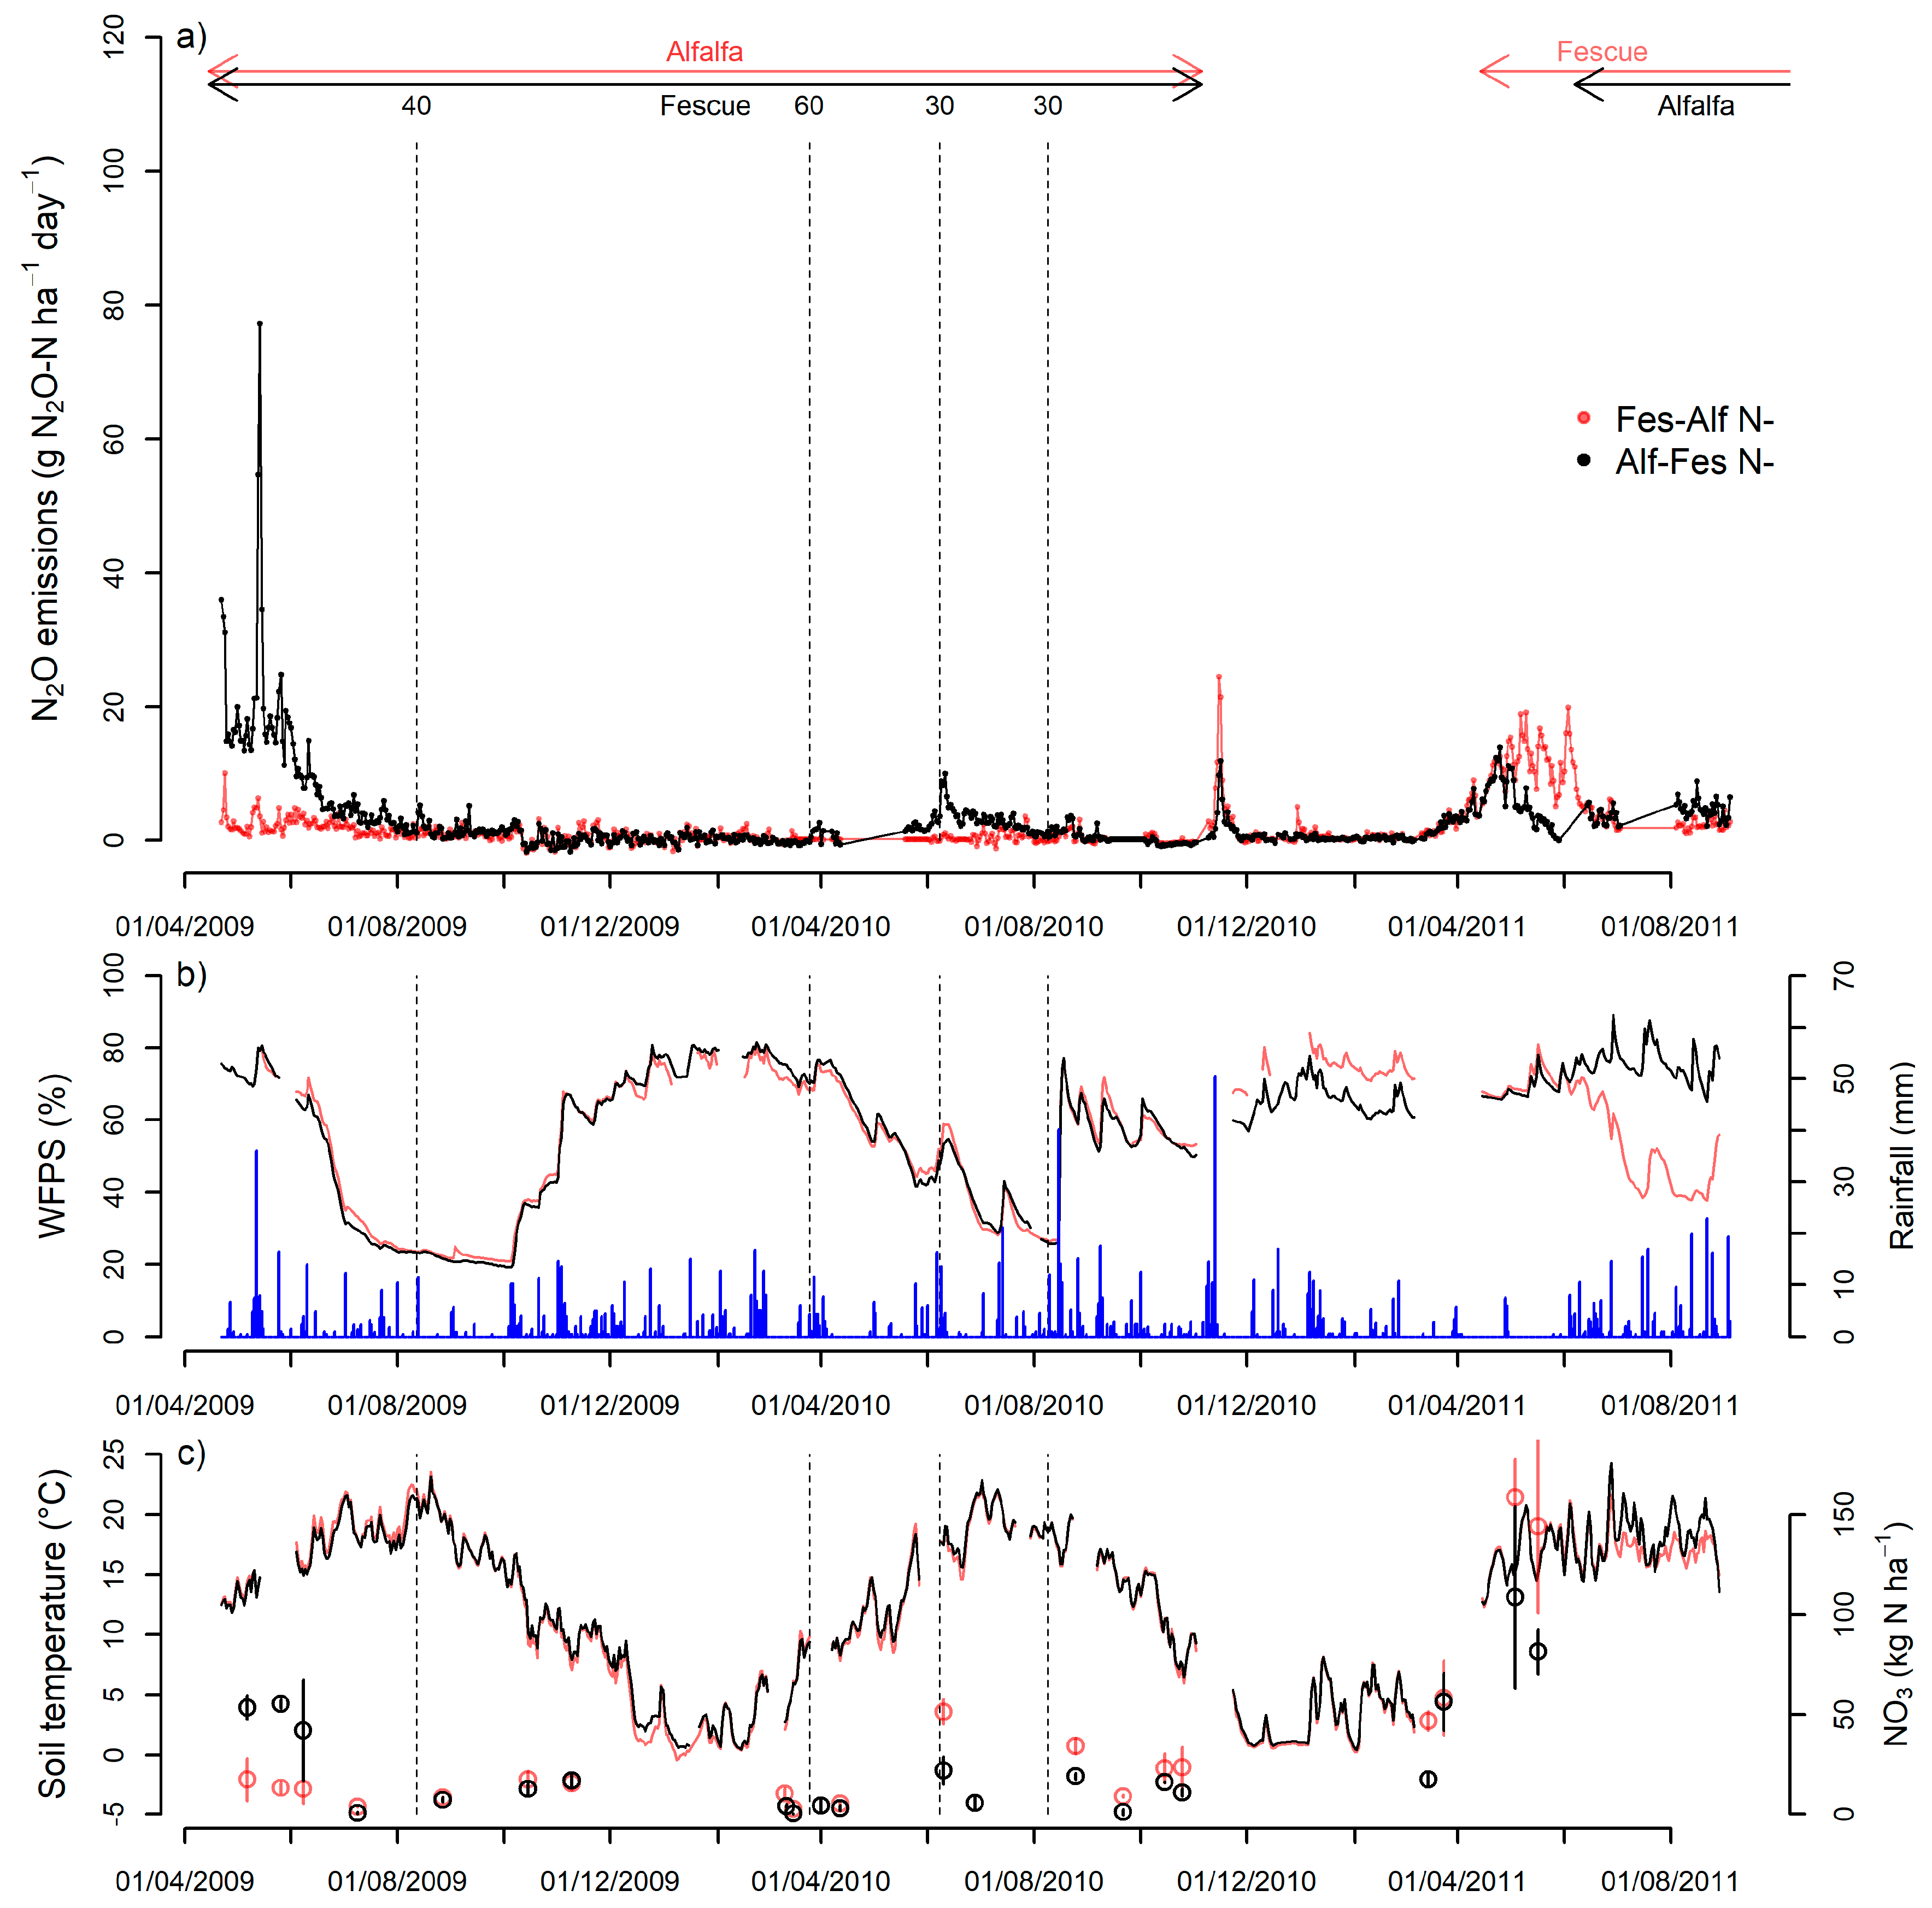
3.1. Spatial and Temporal Variability

Paired plots having the same treatment, with miscanthus or switchgrass, were monitored simultaneously during five periods lasting 184–328 days, with three chambers inside each plot. The two plots were 65–85 m apart depending on the pair considered and the three chambers inside each plot were about 5 m apart. For each of the five situations, cumulative N2O emissions did not differ significantly between paired plots, neither at 95% nor at 90% confidence level (Table 2). Differences between the paired plots under switchgrass were particularly small given the large cumulative emissions (1610 vs. 1733 g N ha−1 for Swi E N+ and 3294 vs. 2866 g N ha−1 for Swi L N+). It should also be mentioned that the difference in soil characteristics between paired plots was similar to the variability observed over the whole set of 15 plots used for N2O monitoring during the study (Table S2) and that the dynamics of daily N2O emissions was very similar both between chambers in a given plot and between paired plots. Finally, the intra-plot variability was comparable to the total variability (intra + inter plots) since the mean standard deviation (all measurements) was 284 and 514 g N2O-N ha−1 for Plots 1 and 2 considered separately versus 466 g N2O-N ha−1 for both plots combined. The corresponding coefficients of variation were 22% and 33% versus 33%, respectively.
Overall, these results are consistent with previous studies showing no or weak spatial dependence of N2O fluxes [47,48,49,50] and allow us to assume that the observed differences are related to the treatment effects and not to confounding effects. The spatial variability was also much lower than the temporal variability of daily emissions. The temporal coefficient of variation of the daily measurements was 291% on average for the five situations, compared to 33% for the spatial coefficient of variation. This confirms that putting emphasis on temporal variability using automated chambers makes sense in order to reduce the uncertainty on cumulative emissions.
We then compared cumulative N2O fluxes between periods of measurement for each treatment. Significant differences between periods were found in only three treatments out of nine (Table S3). Cumulative fluxes in Mis L N− (see Table 1 for treatment abbreviations) were negative in Period 2 (−157 ± 35 g N2O-N ha−1, net consumption of N2O) and significantly lower than in Periods 1 and 3 (277 ± 32 and 361 ± 70 g N2O-N ha−1, respectively). N2O fluxes in Fes-Alf N− and Alf-Fes N− were lower in Period 3 than in Periods 2 and 4. These differences between periods probably resulted from various factors including climate and management practices. No significant variation was found between periods for the other treatments. The temporal variability was therefore much lower for cumulative annual fluxes than for daily fluxes, which was expected. However, in the following, we chose to compare cumulative emissions only for the treatments monitored simultaneously in order to avoid any confounding effect.

3.2. Cumulative N2O Emissions Affected by Management and Crop Types

Cumulative N2O emissions were compared between treatments monitored during the same period. There was a significant effect of the treatments in five periods out of six (Table 3). Cumulative N2O emissions ranged between −157 ± 35 and 3362 ± 904 g N2O-N ha−1 for Mis L N− in Period 2 and Swi L N+ in Period 6, respectively. The spatial variability was moderate since the coefficient of variation varied from 10% to 62% around a mean value of 28% (excluding the situations with cumulative N2O fluxes lower than 150 g N2O-N ha−1). The effect of N fertilization on cumulative N2O emissions was tested during three years under miscanthus in Periods 1–3. N2O emissions were significantly higher in the fertilized (Mis L N+) than in the unfertilized (Mis L N−) treatment: 1618 ± 609 versus 160 ± 46 g N2O-N ha−1 (average of the three periods in Table 3). Cumulative emissions were also highly dependent on harvest date: the average emission over two years (Periods 3 and 4) was 51 g N2O-N ha−1 for the early harvest (Mis E N+) versus 1202 g N2O-N ha−1 for the late harvest (Mis L N+). The same result was found for switchgrass over two years (Periods 5 and 6), although the difference was not significant in Period 5. The mean cumulative emission (average of the two periods) was 1782 ± 355 g N2O-N ha−1 year−1 in the early harvest (Swi E N+) versus 3013 ± 835 g N2O-N ha−1 year−1 in the late harvest treatment (Swi L N+).
In the case of semi-perennial and annual crops (Table 3), the monitoring made simultaneously on each crop of the rotation (e.g., Sor-Tri and Tri-Sor) indicated that emissions did not differ between the two crops of the rotation except in Period 2, with higher fluxes for fescue than for alfalfa (1339 ± 346 vs. 370 ± 46 g N2O-N ha−1 in Alf-Fes N− and Fes-Alf N−, respectively). The comparison with miscanthus showed that N2O fluxes of the alfalfa–fescue rotation were either significantly smaller or equal to the late harvested, fertilized miscanthus (Mis L N+), but greater than the early harvested, fertilized miscanthus (Mis E N+). Similarly, the fluxes in the sorghum–triticale rotation were similar to the late harvested, fertilized switchgrass (Swi L N+), but greater than the early harvested, fertilized switchgrass (Swi E N+).

3.3. Dynamics of N2O Emissions

Daily N2O emissions in miscanthus had very different dynamics between treatments (Figure 2). In Mis L N+, N2O emissions were strongly stimulated by the N fertilization events, with very intense emissions (up to 117 g N2O-N ha−1 day−1) lasting from 25 to 60 days. Apart from these periods, emissions were very low except in early April 2011 when a small peak was measured before fertilization (up to 20 g N2O-N ha−1 day−1). Emissions were uniformly very low in Mis L N−, with a maximal value of 5 g N2O-N ha−1 day−1. Daily emissions in Mis E N+ also increased after fertilization but this increase was much smaller than in Mis L N+ (maximum of 11 g N2O-N ha−1 day−1). Emission rates far from fertilization events were very small and similar for all management options.
High N2O emission peaks were also observed under switchgrass during the weeks following N fertilization, but they were slightly delayed compared to miscanthus, occurring 40–70 days after fertilization (Figure 3). Emission peaks were particularly high in spring 2013 for both harvest dates (up to 250 and 229 g N2O-N ha−1 day−1, respectively, for Swi E N+ and Swi L N+). The highest peaks seemed to be synchronous with rainfall events and high WFPS. Smaller peaks (from 10 to 33 g N2O-N ha−1 day−1) were also observed for Swi L N+ in winter and early spring 2013.
Contrary to C4 perennial crops, fescue did not show large N2O emissions peaks following N applications (Figure 4). Only a small peak (up to 10 g N2O-N ha−1 day−1) was observed in June 2010 after an input of 30 kg N ha−1. The largest emissions were observed during the transition between alfalfa and fescue, i.e., after the sowing of fescue in spring 2009 and spring 2011 (up to 77 g N2O-N ha−1 day−1) (alfalfa was destroyed by plowing in mid-March 2009 and early November 2010). Very small emissions, always lower than 10 g N2O-N ha−1 day−1, were recorded under alfalfa. A short peak also took place just after alfalfa and fescue destruction (in treatments Fes-Alf N− and Alf-Fes N−, respectively) following a heavy rainfall event in November 2010.
The dynamics of daily N2O emissions in annual crops was characterized by an absence of regular pattern and many short emissions peaks (ranging from 10 to 70 g N2O-N ha−1 day−1) lasting a few days (Figure 5). There was no increase in N2O emissions during the days following N fertilization, but short peaks were observed in 2013 2–4 weeks after N application. Two longer high emission periods were observed: the first during triticale in late spring and early summer 2012 (Sor-Tri N+), during a period with rather intensive rainfall, and the second after sorghum harvest and triticale sowing in autumn 2012 (Tri-Sor N+). In 2012, sorghum yield was exceptionally low (3.1 t DM ha−1) due to establishment difficulties (Table S1). This low biomass production resulted in a low N uptake by the crop and probably a high mineral N content in soil at harvest, stimulating N2O emissions.

3.4. Factors Influencing Daily N2O Emissions

Soil temperature, WFPS and fertilization history (presence or absence of fertilization events during the last 70 days) were used as input variables in a decision tree approach to explain daily N2O emissions for perennial, semi-perennial and annual crops. For the fertilization history, the 70-day duration was chosen because it corresponded to the maximum length of the peak emission period occurring after fertilization of perennial crops. It also corresponded more or less to the time at which soil mineral N returned to a very low level. We applied this method on daily data, after removing interpolated values for N2O and ancillary data, which resulted over all treatments in 3582, 1165 and 1471 remaining daily fluxes for perennial, semi-perennial and annual crops, respectively. The decision trees explained 38% and 37% of the variance in daily N2O fluxes for perennial and semi-perennial crops respectively (Figure 6). However, for annual crops, none of the tested variables had a sufficient influence on N2O emissions to be retained. The first explaining factor for perennial crops was fertilization history, which we consider as a proxy for mineral N availability: emissions were very low when there was no fertilization event during the last 70 days (1.6 g N2O-N ha−1 day−1 on average). During the 70 days following fertilizer application, emissions were higher when WFPS exceeded 73% (mean N2O fluxes of 31 vs. 7 g N2O-N ha−1 day−1). For semi-perennial crops, the fertilization history did not appear as a significant driving factor. N2O emissions were primarily dependent on soil temperature: low N2O emissions (0.3 g N2O-N ha−1 day−1 on average) occurred when soil temperature was below 12 °C. When soil temperature was higher than 12 °C, a second controlling factor was WFPS with a threshold of 66%. The highest emissions (8.4 g N2O-N ha−1 day−1 on average) occurred when WFPS was above this threshold. Correlation analysis confirmed the significant positive effect of soil temperature and WFPS on N2O emissions for perennial and semi-perennial crops. For annual crops, no significant correlation was found between WFPS and N2O fluxes but a significant although weak positive correlation was found with soil temperature (r = 0.17, p < 0.001).
The relationship between WFPS and daily N2O emissions is shown in Figure 7. In perennial crops, high N2O emissions (>25 g N2O-N ha−1 day−1) occurred only during the 70 days following fertilization and above a WFPS threshold of ca. 70%, which is consistent with results from the decision tree. Emissions in Mis L N− were uniformly low despite similar WFPS to Mis L N+ (Figure 2). On the contrary, WFPS in Mis E N+ was on average lower than in Mis L+ and remained below 70% during the period following fertilization, which could explain the low emissions for this treatment. High N2O fluxes in semi-perennial crops also occurred only at high WFPS, whereas in annual crops high N2O fluxes were observed for a wide range of WFPS. Contrary to perennial crops, high N2O fluxes in semi-perennial and annual crops did not occur only following fertilization.
We investigated in more details the relationship between N2O emissions and WFPS for miscanthus and switchgrass during the 70 days following fertilization. Excluding WFPS values lower than 60%, for which denitrification was unlikely to be the dominant process, an overall linear relationship was found between daily ln(N2O) fluxes and WFPS by grouping the four treatments together (R2 = 0.31, p < 0.001, n = 474, Figure 8). A covariance analysis showed that this linear relationship was not significantly different between miscanthus and switchgrass and between early and late harvest.
The number of available data was much lower for soil mineral nitrogen than for soil temperature and WFPS. Measured soil nitrate content in the 0–30-cm layer was 25 kg N ha−1 on average and ranged between 0.1 and 158 kg N ha−1. Over the whole dataset (82 measurements), we found a significant positive correlation between nitrate content and N2O emissions (r = 0.56, p < 0.001). The crops for which we had the greatest number of available data were miscanthus (36 measurements, with 19 measurements for Mis L N+) and semi-perennial crops (30 measurements). We found a significant positive correlation between nitrate content and N2O emissions for Mis L N+ (r = 0.67, p < 0.005) and semi-perennial crops (r = 0.63, p < 0.001). A covariance analysis showed that the slope of the linear regression was significantly higher for Mis L N+ than for semi-perennial crops while the intercept did not differ (Figure 9). High soil nitrate content values in Mis L N+ corresponded to measurements following N fertilization. Soil nitrate content was always low in Mis L N− (maximum of 20 kg N ha−1) and N2O fluxes in Mis E N+ remained low after fertilization despite an increase in soil nitrate content (only measured in 2011 for this treatment) (Figure 2). Soil nitrate content under semi-perennial crops was higher after the sowing of fescue in spring 2009 and spring 2011 and before alfalfa sowing in spring 2011, concomitantly with the highest N2O fluxes (Figure 4). This increase in nitrate content was probably due to an active N mineralization (enhanced by the destruction of the previous crop) and a low N uptake in spring after the seeding of the next crop. The soil ammonium content in the 0–30 cm layer was 10 kg N ha−1 on average and ranged between 0.3 and 120 kg N ha−1. Contrary to nitrate, no significant correlation was found over the whole dataset between soil ammonium content and N2O fluxes. At the treatment level, only Mis L N+ showed a significant increase in N2O emission with higher soil ammonium content (r = 0.73, p < 0.001).

4. Discussion

4.1. Effect of Management Practices on N2O Emissions under C4 Perennial Crops

The strong dependence of cumulative N2O emissions on N fertilization for miscanthus harvested in late winter was consistent with previous studies [25,26,32,51]. Cumulative emissions for Mis L N+ were indeed high and ranged between 1040 and 2145 g N2O-N ha−1 year−1, which however falls in the lower range of previously published data for similar high N rates (1135–4316 g N2O-N ha−1 year−1 reported by Davis et al. [25]). This is also lower than cumulative emissions measured by Peyrard et al. [20] in the same experiment and same treatment, but in different years (2014 and 2015) and with different N fertilizers (ammonium sulfate or potassium nitrate), which were on average 4208 g N2O-N ha−1 year−1. Cumulative emissions for Mis L N- were particularly low (−157 to 361 g N2O-N ha−1 year−1) and also fall in the lower range of published results for unfertilized miscanthus. For example, Drewer et al. [21] measured on average over three years 510 g N2O-N ha−1 year−1 and Davis et al. [25] reported fluxes between 142 and 1061 g N2O-N ha−1 year−1.
To our knowledge, the effect of the miscanthus harvest date on N2O emissions has not been evaluated before, except in the same experiment by Peyrard et al. [20]. These previous results are consistent with our study, with much lower cumulative N2O emissions in early than late harvest, although our fluxes were lower than those measured by Peyrard et al. [20] (−36 to 138 g N2O-N ha−1 year−1 vs. 895 g N2O-N ha−1 year−1 on average for Mis E N+). This effect of harvest date was discussed in detail by Peyrard et al. [20], with a combination of several factors favoring N2O emissions in a (continuous) late harvest treatment: (i) the mulch resulting from the accumulation of senescent leaves fallen during winter in late harvest [52], which increases WFPS in spring compared to early harvest; (ii) the potential denitrification, which was shown to be three times higher in late than early harvest [53]; and (iii) the reduced N storage in the rhizome in the early harvest treatment [18], which enhances N uptake in spring and induces a faster decline in soil mineral N content after N fertilization.
As for miscanthus, late harvest increased N2O emissions from switchgrass, compared to early harvest: cumulative N2O emissions were on average 1.7 times higher for Swi L N+ than Swi E N+. This result is consistent with the findings of Johnson and Barbour [19], who reported a mean ratio of 1.4 between late and early harvest N2O emissions. The cumulative fluxes they measured (5633 and 7663 g N2O-N ha−1 year−1 on average over three years for early and late harvest, respectively) were however higher than ours (1782 and 3013 g N2O-N ha−1 year−1 for early and late harvest, respectively) with similar N fertilization rates. No comparison between harvest dates was done in other previous studies, switchgrass being often harvested in late autumn, which is intermediate between our two treatments. Reported cumulative fluxes were generally of the same order of magnitude than ours with comparable N fertilization rates. Contrary to miscanthus, no leave fall occurs in winter under switchgrass. The amount of crop residues on the soil surface was hence similar between early and late harvest [54], as well as WFPS dynamics. Potential denitrification rate was also found to be similar between early and late harvest for switchgrass. Finally, the N2O to N2 molar ratio tended to be smaller in the late harvest treatment [53]. Differences in WFPS, potential denitrification rates or N2O consumption rates thus cannot explain the higher emissions observed in the late harvest treatment. The smaller emissions observed in early harvest might result from a higher and/or faster plant N uptake due to lower plant N reserves [54], and therefore a faster depletion of soil mineral N content after fertilization.

4.2. Effect of Crop Type on N2O Emissions

For similar N fertilization rates, N2O emissions from perennial crops (except Mis E N+) were close or even higher than emissions from semi-perennial or annual crops. This result is in line with Johnson and Barbour [19], who found higher cumulative emissions from switchgrass than from annual crops with a N fertilization rate of ca. 120 kg N ha−1 year−1.
Cumulative emissions from annual crops (1281 to 2319 g N2O-N ha−1 year−1) were consistent with the results from the meta-analysis of Bouwman et al. [55], who reported a mean value of 1.9 kg N2O-N ha−1 year−1 for arable crops fertilized between 100 and 150 kg N ha−1 year−1. Semi-perennial crops had rather low emissions compared to annual crops (679 versus 1746 g N2O-N ha−1 year−1 on average), in accordance with the findings of Abalos et al. [56], but the two crop types were not monitored simultaneously.
Cumulative emissions seemed higher for fertilized switchgrass than for fertilized miscanthus (50 and 1470 g N2O-N ha−1 year−1 on average for Mis E N+ and Mis L N+, respectively, versus 1782 and 3013 g N2O-N ha−1 year−1 on average for Swi E N+ and Swi L N+, respectively). However, these emissions were not measured during the same periods, i.e., in the same climatic conditions, and no firm conclusion can therefore be drawn from our study. For example, spring rainfall in 2010 and 2011 (99 and 94 mm, from April to June) was much lower than the average (156 mm, 2008–2013) while it was higher in 2012 and 2013 (242 and 176 mm, respectively). WFPS measured under switchgrass during these two years were high (most of the time higher than 60%). Given the strong influence of WFPS on N2O emissions, this could have favored emissions from switchgrass compared to miscanthus and particularly Mis E N+. Smith et al. [23], who compared N2O emissions from miscanthus and switchgrass during three years, did not find a significant difference between the two crops. Oates et al. [24] found contrasted results for the same comparison according to the year and the site.
If we take into account the crop production measured during the years of N2O monitoring, we can calculate biomass-scaled emissions. There were large differences in biomass production: miscanthus showed the highest production (27.7 t DM ha−1 year−1 for Mis E N+, 20.4 and 20.5 t DM ha−1 year−1 for Mis L N+ and N−, respectively), followed by switchgrass (16.6 and 15.6 t DM ha−1 year−1 for Swi E N+ and Swi L N+, respectively), annual crops (10.7 t DM ha−1 year−1 on average) and finally semi-perennial crops (6.4 t DM ha−1 year−1 on average). Biomass-scaled emissions were lower for miscanthus (2, 8 and 72 g N2O-N t DM−1 for Mis E N+, Mis L N− and Mis L N+, respectively) than for semi-perennial crops (106 g N2O-N t DM−1). They were also lower for Swi E N+ (107 g N2O-N t DM−1) than for annual crops (163 g N2O-N t DM−1). Biomass-scaled emissions were thus more favorable to perennial crops because of their high productivity.

4.3. Temporal Patterns of N2O Emissions

Beyond differences in cumulative emissions and the high temporal variability in daily N2O emissions typical of agricultural systems [57], patterns of N2O emissions varied strongly between crop types. N2O emissions from perennial and semi-perennial crops were characterized by long time-periods with low daily emissions interspersed by short periods with intensive emissions, whereas emissions from annual crops were less structured.
Main emission peaks in perennial crops appeared in spring just after N fertilization. This pattern seems typical for miscanthus harvested late, as various authors observed previously [26,32,51]. It was also found for switchgrass [19,28]. Several authors observed that these emissions were favored by rainfall events and therefore high WFPS during the period following fertilization [19,24,28,51], consistently with our findings. These emission peaks corresponded to soil conditions favorable for N2O emissions induced by denitrification: relatively high soil temperature, high WFPS and high mineral nitrogen content [58,59]. Apart from these emissions peaks, N2O fluxes from miscanthus were very low. In total, 21%, 26% and 59% of the measured daily fluxes were negative (down to −2 g N2O-N ha−1 day−1) for Mis L N−, Mis L N+ and Mis E N+, respectively. These negative fluxes occurred for the whole range of observed WFPS and soil temperature but fluxes lower than −1 g N2O-N ha−1 day−1 were mainly observed when soil temperature was higher than 10 °C, which is consistent with lower N2O:N2 molar ratio observed when temperature increases [60]. Net negative N2O fluxes have been frequently measured under various agricultural systems and soil conditions including low WFPS [61]. The fact that we did not observe negative fluxes on switchgrass, contrary to miscanthus, may suggest that N2O reduction is more active on miscanthus, which could be related to conditions more favorable to denitrification.
Fertilization events had less influence on semi-perennial than on perennial crops. Almost no increase in N2O emissions was detected after N fertilization on fescue, which differs from results obtained on grasslands where emission peaks have been reported after fertilizer N application (e.g., [58,62]). Senapati et al. [63] found either a response of mowed grassland to N fertilizer or no response, depending on the year. In our study, three out of four N applications occurred in late spring or summer when WFPS was low, which could have prevented N2O emissions, as observed by Bell et al. [62] for a fertilized grassland. In addition, the moderate N rates and probably important plant N uptake at the time of application limited the increase in soil mineral nitrogen content after N applications. Daily N2O emissions were uniformly low under alfalfa, which was not fertilized, but strongly increased during spring following the crop destruction by moldboard plowing. Such emissions were already observed by Johnson et al. [64], Abalos et al. [56] and Westphal et al. [65] and were attributed to the decomposition of the alfalfa residues, which increased soil mineral nitrogen content due to their low C:N ratio, of about 15. The same trend was observed for fescue (C:N ratio of about 35) after destruction, but with a lower extra N mineralization [36] and then lower N2O emissions. The emission peaks mainly occurred when WFPS was higher than 66%, as shown by the decision tree, which suggests a dominant contribution of denitrification to N2O production.
N2O emission patterns under annual crops were only poorly explained by variations in soil temperature and WFPS, contrary to perennial and semi-perennial crops. Soil mineral N content was not monitored in these treatments, which did not allow for analyzing its influence. Soil mineral N content was probably more variable in time under annual than other crops, due to frequent tillage and bare fallow periods, so that a greater variability in N2O emissions was expected in annual crops. Peaks higher than 20 g N2O-N ha−1 day−1 occurred for a wide range of WFPS (42–83%), suggesting that nitrification and denitrification both contributed to N2O production under annual crops, which may explain the lack of a clear temporal pattern in emissions. The short-term response of N2O emissions of annual crops to N fertilization was not clear: there was no increase in emissions in 2012 during the month following N application, whereas short peaks associated to rainfall events were detected after fertilization in 2013.

5. Conclusions

This study provides an evaluation of N2O fluxes from different perennial, semi-perennial and annual bioenergy crops. Our results were obtained using quasi-continuous measurements during several years on cropping systems that had already been in place for at least three years.
The first main result of the study is the very strong effect of management practices on N2O emissions. The observed range of cumulative emissions was indeed very wide for the same crop on the same site. Fertilization was shown to have a strong influence on emissions, but emissions also strongly varied for a given fertilization rate according to harvest date, which thus appears as a critical management option for C4 perennial crops in the context of greenhouse gases mitigation. Regarding crop types, fertilized C4 perennial crops had similar or higher emissions than semi-perennial or annual crops. However, due to their high biomass productivity, C4 perennial crops were generally more favorable in terms of biomass-scaled N2O emissions. The strong influence of fertilization on emissions and the very low fluxes observed in unfertilized miscanthus encourage a strong limitation of N fertilization of C4 perennial crops, but too low N inputs may impact biomass production in the long term. Semi-perennials were found to have low N2O emissions, except after alfalfa destruction. Introducing semi-perennial crops in crop rotations may thus be a good biomass production strategy if the services provided, such as N supply or help in managing weeds, are more valuable than the amount of biomass produced.
The second main lesson of this study is that understanding N2O emissions from cropping systems remains a challenge: emissions are likely to result from both nitrification and denitrification, with a strong and combined influence of several environmental variables and management practices, and with contrasted temporal dynamics. WFPS and soil nitrate were found to have a strong influence on N2O emissions from C4 perennial crops, while their influence on annual crop was less apparent. That stresses the importance of continuous and long-term monitoring of emissions, as WFPS is strongly dependent on climate both at a short-term and annual scale. Soil–crop modeling, which allows managing interactions between the different processes and controls involved, should contribute to the better understanding and management of these cropping systems, especially for finding optimum compromises between biomass production and GHG emissions.

Supplementary Materials

The following are available online at https://www.mdpi.com/2073-4433/11/6/675/s1, Table S1: Biomass production measured at harvest for the different treatments included in the study, Table S2: Soil characteristics (0–30 cm) of the 15 plots of the B&E experiment used for N2O measurements, Table S3: Cumulative N2O emissions for the different periods of monitoring for each treatment.

Author Contributions

Conceptualization, B.M., F.F., and J.L.; investigation, E.G., F.F., and B.M.; methodology, E.G. and B.M.; data curation, E.G., B.M., and F.F.; formal analysis, F.F., C.P., J.L., and B.M.; writing—original draft preparation, F.F.; and writing—review and editing, J.L. and B.M. All authors have read and agreed to the published version of the manuscript.

Funding

This research was funded by the French National Research Agency (ANR) (Regix project), by Bpifrance (Futurol project) and by ADEME (CE-CARB project).

Acknowledgments

We thank the staff of the INRAE BioEcoAgro and GCIE Picardie units involved in the maintenance of the B&E experiment, and particularly Emilie Mignot and Guillaume Vitte. We also thank Magali Roussel for her contribution to N2O fluxes and soil measurements and Jérôme Duval for his contribution to data management.

Conflicts of Interest

The authors declare no conflict of interest. The funders had no role in the design of the study; in the collection, analyses, or interpretation of data; in the writing of the manuscript, or in the decision to publish the results.

References

  1. IPCC. Climate Change 2014: Synthesis Report. In Contribution of Working Groups I, II and III to the Fifth Assessment Report of the Intergovernmental Panel on Climate Change; Core Writing Team, Pachauri, R.K., Meyer, L.A., Eds.; IPCC: Geneva, Switzerland, 2014; p. 151. [Google Scholar]
  2. Ravishankara, A.R.; Daniel, J.S.; Portmann, R.W. Nitrous Oxide (N2O): The Dominant Ozone-Depleting Substance Emitted in the 21st Century. Science 2009, 326, 123–125. [Google Scholar] [CrossRef] [PubMed] [Green Version]
  3. Syakila, A.; Kroeze, C. The global nitrous oxide budget revisited. Greenh. Gas Meas. Manag. 2011, 1, 17–26. [Google Scholar] [CrossRef]
  4. Paustian, K.; Lehmann, J.; Ogle, S.; Reay, D.; Robertson, G.P.; Smith, P. Climate-smart soils. Nature 2016, 532, 49–57. [Google Scholar] [CrossRef] [PubMed] [Green Version]
  5. Bremner, J.M. Sources of nitrous oxide in soils. Nutr. Cycl. Agroecosyst. 1997, 49, 7–16. [Google Scholar] [CrossRef]
  6. Butterbach-Bahl, K.; Baggs, E.M.; Dannenmann, M.; Kiese, R.; Zechmeister-Boltenstern, S. Nitrous oxide emissions from soils: How well do we understand the processes and their controls? Philos. Trans. R. Soc. B Biol. Sci. 2013, 368. [Google Scholar] [CrossRef]
  7. Stehfest, E.; Bouwman, L. N2O and NO emission from agricultural fields and soils under natural vegetation: Summarizing available measurement data and modeling of global annual emissions. Nutr. Cycl. Agroecosyst. 2006, 74, 207–228. [Google Scholar] [CrossRef]
  8. Shcherbak, I.; Millar, N.; Robertson, G.P. Global metaanalysis of the nonlinear response of soil nitrous oxide (N2O) emissions to fertilizer nitrogen. Proc. Natl. Acad. Sci. USA 2014, 111, 9199–9204. [Google Scholar] [CrossRef] [Green Version]
  9. IPCC. Summary for Policymakers. In IPCC Special Report on Renewable Energy Sources and Climate Change Mitigation; Edenhofer, O., Pichs-Madruga, R., Sokona, Y., Seyboth, K., Matschoss, P., Kadner, S., Zwickel, T., Eickemeier, P., Hansen, G., Schlömer, S., et al., Eds.; Cambridge University Press: Cambridge, UK; New York, NY, USA, 2011; pp. 1–24. [Google Scholar]
  10. Crutzen, P.J.; Mosier, A.R.; Smith, K.A.; Winiwarter, W. N2O release from agro-biofuel production negates global warming reduction by replacing fossil fuels. Atmos. Chem. Phys. 2008, 8, 389–395. [Google Scholar] [CrossRef] [Green Version]
  11. Smith, K.A.; Searchinger, T.D. Crop-based biofuels and associated environmental concerns. Glob. Chang. Biol. Bioenergy 2012, 4, 479–484. [Google Scholar] [CrossRef]
  12. Somerville, C.; Youngs, H.; Taylor, C.; Davis, S.C.; Long, S.P. Feedstocks for lignocellulosic biofuels. Science 2010, 329, 790–792. [Google Scholar] [CrossRef] [Green Version]
  13. Don, A.; Osborne, B.; Hastings, A.; Skiba, U.; Carter, M.S.; Drewer, J.; Flessa, H.; Freibauer, A.; Hyvonen, N.; Jones, M.B.; et al. Land-use change to bioenergy production in Europe: Implications for the greenhouse gas balance and soil carbon. Glob. Chang. Biol. Bioenergy 2012, 4, 372–391. [Google Scholar] [CrossRef] [Green Version]
  14. Gabrielle, B.; Bamière, L.; Caldes, N.; De Cara, S.; Decocq, G.; Ferchaud, F.; Loyce, C.; Pelzer, E.; Perez, Y.; Wohlfahrt, J.; et al. Paving the way for sustainable bioenergy in Europe: Technological options and research avenues for large-scale biomass feedstock supply. Renew. Sustain. Energy Rev. 2014, 33, 11–25. [Google Scholar] [CrossRef] [Green Version]
  15. Cadoux, S.; Riche, A.B.; Yates, N.E.; Machet, J.-M. Nutrient requirements of Miscanthus × giganteus: Conclusions from a review of published studies. Biomass Bioenergy 2012, 38, 14–22. [Google Scholar] [CrossRef]
  16. Monti, A.; Barbanti, L.; Zatta, A.; Zegada-Lizarazu, W. The contribution of switchgrass in reducing GHG emissions. Glob. Chang. Biol. Bioenergy 2012, 4, 420–434. [Google Scholar] [CrossRef] [Green Version]
  17. Cadoux, S.; Ferchaud, F.; Demay, C.; Boizard, H.; Machet, J.M.; Fourdinier, E.; Preudhomme, M.; Chabbert, B.; Gosse, G.; Mary, B. Implications of productivity and nutrient requirements on greenhouse gas balance of annual and perennial bioenergy crops. Glob. Chang. Biol. Bioenergy 2014, 6, 425–438. [Google Scholar] [CrossRef]
  18. Strullu, L.; Cadoux, S.; Preudhomme, M.; Jeuffroy, M.H.; Beaudoin, N. Biomass production and nitrogen accumulation and remobilisation by Miscanthus × giganteus as influenced by nitrogen stocks in belowground organs. Field Crop. Res. 2011, 121, 381–391. [Google Scholar] [CrossRef]
  19. Johnson, J.M.F.; Barbour, N.W. Nitrous Oxide Emission and Soil Carbon Sequestration from Herbaceous Perennial Biofuel Feedstocks. Soil Sci. Soc. Am. J. 2016, 80, 1057–1070. [Google Scholar] [CrossRef]
  20. Peyrard, C.; Ferchaud, F.; Mary, B.; Gréhan, E.; Léonard, J. Management Practices of Miscanthus × giganteus Strongly Influence Soil Properties and N2O Emissions Over the Long Term. BioEnergy Res. 2017, 10, 208–224. [Google Scholar] [CrossRef]
  21. Drewer, J.; Finch, J.W.; Lloyd, C.R.; Baggs, E.M.; Skiba, U. How do soil emissions of N2O, CH4 and CO2 from perennial bioenergy crops differ from arable annual crops? Glob. Chang. Biol. Bioenergy 2012, 4, 408–419. [Google Scholar] [CrossRef] [Green Version]
  22. Gauder, M.; Butterbach-Bahl, K.; Graeff-Hönninger, S.; Claupein, W.; Wiegel, R. Soil-derived trace gas fluxes from different energy crops–results from a field experiment in Southwest Germany. GCB Bioenergy 2012, 4, 289–301. [Google Scholar] [CrossRef]
  23. Smith, C.M.; David, M.B.; Mitchell, C.A.; Masters, M.D.; Anderson-Teixeira, K.J.; Bernacchi, C.J.; DeLucia, E.H. Reduced nitrogen losses after conversion of row crop agriculture to perennial biofuel crops. J. Environ. Qual. 2013, 42, 219–228. [Google Scholar] [CrossRef] [PubMed]
  24. Oates, L.G.; Duncan, D.S.; Gelfand, I.; Millar, N.; Robertson, G.P.; Jackson, R.D. Nitrous oxide emissions during establishment of eight alternative cellulosic bioenergy cropping systems in the North Central United States. Glob. Chang. Biol. Bioenergy 2016, 8, 539–549. [Google Scholar] [CrossRef]
  25. Davis, M.P.; David, M.B.; Voigt, T.B.; Mitchell, C.A. Effect of nitrogen addition on Miscanthus × giganteus yield, nitrogen losses, and soil organic matter across five sites. Glob. Chang. Biol. Bioenergy 2015, 7, 1222–1231. [Google Scholar] [CrossRef] [Green Version]
  26. Roth, B.; Finnan, J.M.; Jones, M.B.; Burke, J.I.; Williams, M.L. Are the benefits of yield responses to nitrogen fertilizer application in the bioenergy crop Miscanthus × giganteus offset by increased soil emissions of nitrous oxide? Glob. Chang. Biol. Bioenergy 2015, 7, 145–152. [Google Scholar] [CrossRef]
  27. Wile, A.; Burton, D.L.; Sharifi, M.; Lynch, D.; Main, M.; Papadopoulos, Y.A. Effect of nitrogen fertilizer application rate on yield, methane and nitrous oxide emissions from switchgrass (Panicum virgatum L.) and reed canarygrass (Phalaris arundinacea L.). Can. J. Soil Sci. 2014, 94, 129–137. [Google Scholar] [CrossRef]
  28. Ruan, L.L.; Bhardwaj, A.K.; Hamilton, S.K.; Robertson, G.P. Nitrogen fertilization challenges the climate benefit of cellulosic biofuels. Environ. Res. Lett. 2016, 11. [Google Scholar] [CrossRef]
  29. Nikiema, P.; Rothstein, D.E.; Min, D.-H.; Kapp, C.J. Nitrogen fertilization of switchgrass increases biomass yield and improves net greenhouse gas balance in northern Michigan, USA. Biomass Bioenergy 2011, 35, 4356–4367. [Google Scholar] [CrossRef]
  30. Schmer, M.R.; Liebig, M.A.; Hendrickson, J.R.; Tanaka, D.L.; Phillips, R.L. Growing season greenhouse gas flux from switchgrass in the northern great plains. Biomass Bioenergy 2012, 45, 315–319. [Google Scholar] [CrossRef]
  31. Duran, B.E.L.; Duncan, D.S.; Oates, L.G.; Kucharik, C.J.; Jackson, R.D. Nitrogen Fertilization Effects on Productivity and Nitrogen Loss in Three Grass-Based Perennial Bioenergy Cropping Systems. PLoS ONE 2016, 11. [Google Scholar] [CrossRef]
  32. Jorgensen, R.N.; Jorgensen, B.J.; Nielsen, N.E.; Maag, M.; Lind, A.M. N2O emission from energy crop fields of Miscanthus “Giganteus” and winter rye. Atmos. Environ. 1997, 31, 2899–2904. [Google Scholar] [CrossRef]
  33. McGowan, A.R.; Min, D.H.; Williams, J.R.; Rice, C.W. Impact of Nitrogen Application Rate on Switchgrass Yield, Production Costs, and Nitrous Oxide Emissions. J. Environ. Qual. 2018, 47, 228–237. [Google Scholar] [CrossRef] [PubMed] [Green Version]
  34. Ferchaud, F.; Vitte, G.; Bornet, F.; Strullu, L.; Mary, B. Soil water uptake and root distribution of different perennial and annual bioenergy crops. Plant Soil 2015, 388, 307–322. [Google Scholar] [CrossRef]
  35. IUSS Working Group WRB. World Reference Base for Soil Resources 2006; World Soil Resources Reports No. 103; FAO: Rome, Italy, 2006; p. 145. [Google Scholar]
  36. Ferchaud, F.; Mary, B. Drainage and Nitrate Leaching Assessed During 7 Years Under Perennial and Annual Bioenergy Crops. BioEnergy Res. 2016, 9, 656–670. [Google Scholar] [CrossRef]
  37. Bessou, C.; Mary, B.; Leonard, J.; Roussel, M.; Grehan, E.; Gabrielle, B. Modelling soil compaction impacts on nitrous oxide emissions in arable fields. Eur. J. Soil Sci. 2010, 61, 348–363. [Google Scholar] [CrossRef]
  38. Smith, K.A.; Dobbie, K.E. The impact of sampling frequency and sampling times on chamber-based measurements of N2O emissions from fertilized soils. Glob. Chang. Biol. 2001, 7, 933–945. [Google Scholar] [CrossRef]
  39. Parkin, T.B. Effect of sampling frequency on estimates of cumulative nitrous oxide emissions. J. Environ. Qual. 2008, 37, 1390–1395. [Google Scholar] [CrossRef] [Green Version]
  40. Vermue, A.; Philippot, L.; Munier-Jolain, N.; Henault, C.; Nicolardot, B. Influence of integrated weed management system on N-cycling microbial communities and N2O emissions. Plant Soil 2013, 373, 501–514. [Google Scholar] [CrossRef]
  41. Lognoul, M.; Theodorakopoulos, N.; Hiel, M.P.; Regaert, D.; Broux, F.; Heinesch, B.; Bodson, B.; Vandenbol, M.; Aubinet, M. Impact of tillage on greenhouse gas emissions by an agricultural crop and dynamics of N2O fluxes: Insights from automated closed chamber measurements. Soil Tillage Res. 2017, 167, 80–89. [Google Scholar] [CrossRef]
  42. Rudiger, C.; Western, A.W.; Walker, J.P.; Smith, A.B.; Kalma, J.D.; Willgoose, G.R. Towards a general equation for frequency domain reflectometers. J. Hydrol. 2010, 383, 319–329. [Google Scholar] [CrossRef]
  43. Ferchaud, F.; Vitte, G.; Mary, B. Changes in soil carbon stocks under perennial and annual bioenergy crops. Glob. Chang. Biol. Bioenergy 2016, 8, 290–306. [Google Scholar] [CrossRef] [Green Version]
  44. R Core Team. R: A Language and Environment for Statistical Computing; R Foundation for Statistical Computing: Vienna, Austria, 2016. [Google Scholar]
  45. Lenth, R.V. lsmeans: Least-Squares Means. 2014. Available online: http://CRAN.R-project.org/package=lsmeans (accessed on 28 April 2020).
  46. Therneau, T.; Atkinson, B.; Ripley, B. rpart: Recursive Partitioning and Regression Trees. 2016. Available online: https://CRAN.R-project.org/package=rpart (accessed on 28 April 2020).
  47. Clemens, J.; Schillinger, M.P.; Goldbach, H.; Huwe, B. Spatial variability of N2O emissions and soil parameters of an arable silt loam—A field study. Biol. Fertil. Soils 1999, 28, 403–406. [Google Scholar] [CrossRef]
  48. Röver, M.; Heinemeyer, O.; Munch, J.C.; Kaiser, E.-A. Spatial heterogeneity within the plough layer: High variability of N2O emission rates. Soil Biol. Biochem. 1999, 31, 167–173. [Google Scholar] [CrossRef]
  49. Jahangir, M.M.R.; Roobroeck, D.; Van Cleemput, O.; Boeckx, P. Spatial variability and biophysicochemical controls on N2O emissions from differently tilled arable soils. Biol. Fertil. Soils 2011, 47, 753–766. [Google Scholar] [CrossRef]
  50. Cowan, N.J.; Norman, P.; Famulari, D.; Levy, P.E.; Reay, D.S.; Skiba, U.M. Spatial variability and hotspots of soil N2O fluxes from intensively grazed grassland. Biogeosciences 2015, 12, 1585–1596. [Google Scholar] [CrossRef] [Green Version]
  51. Behnke, G.; David, M.; Voigt, T. Greenhouse Gas Emissions, Nitrate Leaching, and Biomass Yields from Production of Miscanthus × giganteus in Illinois, USA. BioEnergy Res. 2012, 5, 801–813. [Google Scholar] [CrossRef]
  52. Amougou, N.; Bertrand, I.; Cadoux, S.; Recous, S. Miscanthus × giganteus leaf senescence, decomposition and C and N inputs to soil. Glob. Chang. Biol. Bioenergy 2012, 4, 698–707. [Google Scholar] [CrossRef]
  53. Domeignoz-Hort, L.; Spor, A.; Bru, D.; Breuil, M.-C.; Bizouard, F.; Leonard, J.; Philippot, L. The diversity of the N2O reducers matters for the N2O:N2 denitrification end-product ratio across an annual and a perennial cropping system. Front. Microbiol. 2015, 6. [Google Scholar] [CrossRef]
  54. Ferchaud, F.; Vitte, G.; Machet, J.-M.; Beaudoin, N.; Catterou, M.; Mary, B. The fate of cumulative applications of 15N-labelled fertiliser in perennial and annual bioenergy crops. Agric. Ecosyst. Environ. 2016, 223, 76–86. [Google Scholar] [CrossRef]
  55. Bouwman, A.F.; Boumans, L.J.M.; Batjes, N.H. Emissions of N2O and NO from fertilized fields: Summary of available measurement data. Glob. Biogeochem. Cycles 2002, 16, 6-1–6-13. [Google Scholar] [CrossRef]
  56. Abalos, D.; Brown, S.E.; Vanderzaag, A.C.; Gordon, R.J.; Dunfield, K.E.; Wagner-Riddle, C. Micrometeorological measurements over 3 years reveal differences in N2O emissions between annual and perennial crops. Glob. Chang. Biol. 2016, 22, 1244–1255. [Google Scholar] [CrossRef]
  57. Henault, C.; Grossel, A.; Mary, B.; Roussel, M.; Leonard, J. Nitrous Oxide Emission by Agricultural Soils: A Review of Spatial and Temporal Variability for Mitigation. Pedosphere 2012, 22, 426–433. [Google Scholar] [CrossRef]
  58. Dobbie, K.E.; McTaggart, I.P.; Smith, K.A. Nitrous oxide emissions from intensive agricultural systems: Variations between crops and seasons, key driving variables, and mean emission factors. J. Geophys. Res. Atmos. 1999, 104, 26891–26899. [Google Scholar] [CrossRef]
  59. Smith, K.A.; Thomson, P.E.; Clayton, H.; McTaggart, I.P.; Conen, F. Effects of temperature, water content and nitrogen fertilisation on emissions of nitrous oxide by soils. Atmos. Environ. 1998, 32, 3301–3309. [Google Scholar] [CrossRef]
  60. Maag, M.; Vinther, F.P. Nitrous oxide emission by nitrification and denitrification in different soil types and at different soil moisture contents and temperatures. Appl. Soil Ecol. 1996, 4, 5–14. [Google Scholar] [CrossRef]
  61. Chapuis-Lardy, L.; Wrage, N.; Metay, A.; Chotte, J.-L.; Bernoux, M. Soils, a sink for N2O? A review. Glob. Chang. Biol. 2007, 13, 1–17. [Google Scholar] [CrossRef]
  62. Bell, M.J.; Cloy, J.M.; Topp, C.F.E.; Ball, B.C.; Bagnall, A.; Rees, R.M.; Chadwick, D.R. Quantifying N2O emissions from intensive grassland production: The role of synthetic fertilizer type, application rate, timing and nitrification inhibitors. J. Agric. Sci. 2016, 154, 812–827. [Google Scholar] [CrossRef] [Green Version]
  63. Senapati, N.; Chabbi, A.; Giostri, A.F.; Yeluripati, J.B.; Smith, P. Modelling nitrous oxide emissions from mown-grass and grain-cropping systems: Testing and sensitivity analysis of DailyDayCent using high frequency measurements. Sci. Total Environ. 2016, 572, 955–977. [Google Scholar] [CrossRef] [Green Version]
  64. Johnson, J.M.F.; Weyers, S.L.; Archer, D.W.; Barbour, N.W. Nitrous Oxide, Methane Emission, and Yield-Scaled Emission from Organically and Conventionally Managed Systems. Soil Sci. Soc. Am. J. 2012, 76, 1347–1357. [Google Scholar] [CrossRef]
  65. Westphal, M.; Tenuta, M.; Entz, M.H. Nitrous oxide emissions with organic crop production depends on fall soil moisture. Agric. Ecosyst. Environ. 2018, 254, 41–49. [Google Scholar] [CrossRef]
Figure 1. Timeline of N2O measurements for the studied treatments of the B&E experiment.
Atmosphere 11 00675 g001
Figure 2. Daily N2O emissions (a); daily rainfall and WFPS (0–30 cm) (b); and daily soil temperature (15 cm) and soil nitrate content (0–30 cm) (c) under miscanthus: Mis E N+ (green), Mis L N+ (red) and Mis L N− (blue). Each point in (a) represents a measured value (daily average). Vertical dotted lines represent fertilization events with the N rate in kg N ha−1. Vertical lines in (c) represent the standard deviations for soil nitrate content. WFPS and soil temperature for Mis E N+ were not available in 2010. See Table 1 for treatment abbreviations.
Atmosphere 11 00675 g002
Figure 3. Daily N2O emissions (a); daily rainfall and WFPS (0–30 cm) (b); and daily soil temperature (15 cm) and soil nitrate content (0–30 cm) (c) under switchgrass: Swi E N+ (green) and Swi L N+ (red). Each point in (a) represents a measured value (daily average). Vertical dotted lines represent fertilization events with the N rate in kg N ha−1. Vertical lines in (c) represent the standard deviations for soil nitrate content. Five daily N2O fluxes were higher than 120 g N2O-N ha−1 day−1 and do not appear in (a). For Swi E N+: 250 g N2O-N ha−1 day−1 on 22/05/2013. For Swi L N+: 139, 229, 166 and 142 g N2O-N ha−1 day−1 on 21/05/2013, 22/05/2013, 21/06/2013 and 22/06/2013, respectively. See Table 1 for treatment abbreviations.
Atmosphere 11 00675 g003
Figure 4. Daily N2O emissions (a); daily rainfall and WFPS (0–30 cm) (b); and daily soil temperature (15 cm) and soil nitrate content (0–30 cm) (c) under semi-perennial crops: Fes-Alf N− (green) and Alf-Fes N− (red). Each point in (a) represents a measured value (daily average for the treatment). Vertical dotted lines represent fertilization events with the N rate in kg N ha−1. Horizontal arrows in (a) indicate the crop duration (between sowing and crop destruction). Vertical lines in (c) represent the standard deviations for soil nitrate content. See Table 1 for treatment abbreviations.
Atmosphere 11 00675 g004
Figure 5. Daily N2O emissions (a); daily rainfall and WFPS (0–30 cm) (b); and daily soil temperature (15 cm) and soil nitrate content (0–30 cm) (c) under annual crops: Sor-Tri N+ (green) and Tri-Sor N+ (red). Each point in (a) represents a measured value (daily average for the treatment). Vertical dotted lines represent fertilization events with the N rate in kg N ha−1. Horizontal arrows in (a) indicate the crop duration (between sowing and harvest or destruction). CC, catch crop. Vertical lines in (c) represent the standard deviations for soil nitrate content. See Table 1 for treatment abbreviations.
Atmosphere 11 00675 g005
Figure 6. Decision tree classifying daily N2O emissions according to soil conditions (soil temperature and WFPS) and fertilization history (fert.history = 0 if there was no fertilization event during the last 70 days) for: (a) perennial crops; and (b) semi-perennial crops. The number at the top of each colored box corresponds to the mean daily N2O flux in the class (in g N2O-N ha−1 day−1). The number of observations in each class (n) is also indicated, as well as the proportion of the total number of observations in each class. Color intensity is proportional to mean N2O flux in the class (from green for the lowest fluxes to orange for the highest fluxes). Below the colored box is the key variable and the condition used for partition into two classes: the one on the left for when the condition is met, the one on the right for when it is not met.
Atmosphere 11 00675 g006
Figure 7. Relationship between daily N2O emissions and WFPS (0–30 cm) for all treatments except Mis L N−. Points in red are fluxes measured during the 70 days following N fertilization. See Table 1 for treatment abbreviations.
Atmosphere 11 00675 g007
Figure 8. Relationship between daily N2O emissions (log transformed) and WFPS (0–30 cm) for fertilized perennial crops during the 70 days following N fertilization and for WFPS ≥ 60%. Colors are periods of measurement. The continuous line is the common linear regression. See Table 1 for treatment abbreviations.
Atmosphere 11 00675 g008
Figure 9. Relationship between daily N2O emissions and soil nitrate content (0–30 cm) for Mis L N+ (dark green line) and Fes-Alf and Alf-Fes N− (light blue line). Lines are linear regressions. See Table 1 for treatment abbreviations.
Atmosphere 11 00675 g009
Table 1. Treatments of the B&E long-term experiment (combining rotation and fertilizer-N rate) included in the study (Mis, miscanthus; Swi, switchgrass; Fes, fescue; Alf, alfalfa; Sor, fiber sorghum; Tri, triticale; CC, catch crop; E, early harvest (October); L, late harvest (February); N−, low fertilizer rate; N+, high fertilizer rate; n.h., not harvested).
RotationN RateCrop and Fertilizer-N Rate (kg ha−1)
200620072008200920102011201220132014
Mis E Mis n.h.Mis EMis EMis EMis EMis EMis EMis EMis E
N+0120120120120120120120120
Mis L Mis n.h.Mis LMis LMis LMis LMis LMis LMis LMis L
N+0120120120120120120120120
N-000000000
Swi E Swi n.h.Swi ESwi ESwi ESwi ESwi ESwi ESwi ESwi E
N+0120120120120120120120120
Swi L Swi n.h.Swi LSwi LSwi LSwi LSwi LSwi LSwi LSwi L
N+0120120120120120120120120
Fes-Alf CC/FesFesFesAlfAlfFesFesFesAlf
N−0120800001201200
Alf-Fes AlfAlfAlfFesFesAlfAlfAlfFes
N−000401200000
Sor-Tri CCSorTri/CCSorTri/CCSorTri/CCSorTri/CC
N+0120120120120120120120120
Tri-Sor SorTri/CCSorTri/CCSorTri/CCSorTri/CCMaize *
N+0120120120120120120120120
* Fiber sorghum was replaced by silage maize (Zea mays L.) in 2014.
Table 2. Comparison of the cumulative N2O emissions (mean; SD, standard deviation, and CV, coefficient of variation) measured simultaneously in paired plots of the same treatment during five periods. See Table 1 for treatment abbreviations.
TreatmentPeriodStartEndDurationPlot 1Plot 2Plots 1 + 2p-Value 3
MeanSD 1CV 1MeanSD 1CV 1MeanSD 2CV 2
(days)(g N ha−1) (g N ha−1) (g N ha−1)
Mis L N+318/05/201024/02/2011283757(63)8%1517(789)52%1137(651)57%0.24
Mis E N+405/03/201104/09/2011184246(73)29%102(137)134%174(126)72%0.21
Mis L N+405/03/201104/09/2011184814(75)9%1354(680)50%1084(524)48%0.30
Swi E N+613/04/201306/03/20143281610(230)14%1733(111)6%1671(175)10%0.47
Swi L N+613/04/201306/03/20143283294(916)28%2866(918)32%3080(853)28%0.60
All 13071315(284)22%1543(514)33%1429(466)33%
1 Intra-plot variability. 2 Intra- and inter-plot variability. 3 Comparison of means between Plots 1 and 2 (Student test).
Table 3. Cumulative N2O emissions measured in different treatments during six periods. Values between brackets are standard deviations (SD) between chambers (CV = coefficient of variation). Letters indicate significant differences (p < 0.05) between treatments for a given period. See Table 1 for treatment abbreviations.
TreatmentFertilizer
Rate
PeriodStartEndDurationRainfallMean Soil
Temperature
Mean
WFPS
Percentage of Days with WFPS > 60%N2O Emissions
MeanSDCV
(kg N ha−1) (days)(mm)(°C)(%)(%)(g N ha−1)
Mis L N+120123/04/200805/03/200931763210.872902145(551)26%a
Mis L N−0 23/04/200805/03/200931763210.87290277(32)12%b
Mis L N+120206/03/200904/03/201036460410.667631344(619)46%a
Mis L N−0 06/03/200904/03/201036460410.77070−157(35)22%c
Fes-Alf N−0 22/04/200904/03/201031753311.95456370(46)12%b
Alf-Fes N−40 22/04/200904/03/201031753312.053551339(346)26%a
Mis E N+120318/05/201003/03/2011290583 −36(28)78%c
Mis L N+120 05/03/201003/03/201136465010.268631364(658)48%a
Mis L N−0 05/03/201003/03/201136465010.27066361(70)19%b
Fes-Alf N−0 05/03/201004/03/201136565010.56053246(42)17%b
Alf-Fes N−120 05/03/201004/03/201136565010.75749390(242)62%b
Mis E N+120404/03/201118/10/201122934114.55324138(133)96%b
Mis L N+120 04/03/201118/10/201122934113.861531040(523)50%a
Fes-Alf N−0 05/03/201104/09/201118427114.76163987(108)11%a
Alf-Fes N−0 05/03/201104/09/201118427115.171100740(86)12%a
Swi E N+120523/03/201206/03/201334968910.472791862(532)29%a
Swi L N+120 23/03/201206/03/201334968910.373802663(766)29%a
Sor-Tri N+120 06/03/201205/03/201336569810.565632059(348)17%a
Tri-Sor N+120 06/03/201205/03/201336569811.163742319(1190)51%a
Swi E N+120607/03/201312/03/201437180810.573881702(177)10%b
Swi L N+120 07/03/201312/03/201437180810.775883362(904)27%a
Sor-Tri N+120 06/03/201305/03/201436580911.072881325(474)36%b
Tri-Sor N+120 06/03/201305/03/201436580910.660541281(201)16%b

