Article

Outdoor Thermal Comfort and Building Energy Use Potential in Different Land-Use Areas in Tropical Cities: Case of Kuala Lumpur

1
Department of Civil, Environmental and Geomatic Engineering (CEGE), University College London (UCL), London WC1E 6BT, UK
2
Institute for Environment and Development (LESTARI), Universiti Kebangsaan Malaysia (UKM), Bangi 43600, Malaysia
3
Cambridge Environmental Research Consultants (CERC), Cambridge CB2 1SJ, UK
4
Department of Earth Sciences and Environment, Universiti Kebangsaan Malaysia (UKM), Bangi 43600, Malaysia
5
University College London (UCL), Earth Sciences, London WC1E 6BT, UK
*
Author to whom correspondence should be addressed.
Atmosphere 2020, 11(6), 652; https://doi.org/10.3390/atmos11060652
Submission received: 1 May 2020 / Revised: 14 June 2020 / Accepted: 17 June 2020 / Published: 19 June 2020
(This article belongs to the Special Issue Assessing the Impact of Climate Change on Urban Cultural Heritage)

Abstract

:
High air temperature and high humidity, combined with low wind speeds, are common trends in the tropical urban climates, which collectively govern heat-induced health risks and outdoor thermal comfort under the given hygrothermal conditions. The impact of different urban land-uses on air temperatures is well-documented by many studies focusing on the urban heat island phenomenon; however, an integrated study of air temperature and humidity, i.e., the human-perceived temperatures, in different land-use areas is essential to understand the impact of hot and humid tropical urban climates on the thermal comfort of urban dwellers for an appraisal of potential health risks and the associated building energy use potential. In this study, we show through near-surface monitoring how these factors vary in distinct land-use areas of Kuala Lumpur city, characterized by different morphological features (high-rise vs. low-rise; compact vs. open), level of anthropogenic heating and evapotranspiration (built-up vs. green areas), and building materials (concrete buildings vs. traditional Malay homes in timber) based on the calculated heat index (HI), apparent temperature (TApp) and equivalent temperature (TE) values in wet and dry seasons. The results show that the felt-like temperatures are almost always higher than the air temperatures in all land-use areas, and this difference is highest in daytime temperatures in green areas during the dry season, by up to about 8 °C (HI)/5 °C (TApp). The TE values are also up to 9% higher in these areas than in built-up areas. We conclude that tackling urban heat island without compromising thermal comfort levels, hence encouraging energy use reduction in buildings to cope with outdoor conditions requires a careful management of humidity levels, as well as a careful selection of building morphology and materials.

1. Introduction

An urban heat island (UHI) is often defined as the significant temperature differential between urban and surrounding rural areas [1]. This is primarily attributable to the reduced evapotranspiration due to less greenery, construction materials with higher thermal admittance, lower ventilation due to high surface roughness, and higher anthropogenic heat sources in cities, such as traffic and waste heat from air-conditioning (AC) systems [2]. Quantification of UHI and its implications on heat induced risks on health and wellbeing has gained considerable prominence in academic literature despite the fact that temperature has been shown to be an insufficient metric by a tremendous number of epidemiological studies to appraise heat stress and mortality, which are more meaningfully linked with the combined impact of temperature and humidity [3,4,5,6,7,8,9,10]. This combined impact of temperature and humidity is better indicative of the physiological experience of heat, and the higher the humidity, the higher the perceived temperature, the higher the potential health risks, the poorer the thermal comfort, and hence, the higher the building energy use to keep the indoor conditions at favorable levels. Despite recent sporadic studies that demonstrated that humid heat is increasingly a global trend [11] and highlighted urban moisture as a prevalent issue and an aggravator of heat island impact [12,13,14,15] with important implications on health and energy use [16], the scholarly discourse on urban microclimate under current and future climatic trends is still heavily dominated by air temperatures alone.
In this respect, our presuppositions with regards to the thermal comfort in different land-use areas need also to be revisited, especially in tropical and subtropical cities (compared to mid-latitude cities), because (1) high air temperatures and UHI in tropical and subtropical cities is an almost year-round critical phenomenon, (2) humidity levels are rather high due to frequent and intense precipitation, and (3) ventilation is low due to overall lower wind speed values, further exacerbating the adverse impact of humidity on perceived temperatures.
The aim of this study was to demonstrate how urban microclimate and hence thermal comfort and building energy use potential vary in different land-use areas in Kuala Lumpur in wet and dry seasons, with specific emphasis on heritage and green areas, through multiple metrics by using on-site monitoring data. Kuala Lumpur is located in West Malaysia over the tropics at 3°09′35″ N 101°42′00″ E. The urban climatology of (sub)tropical megacities is in general a relatively sparsely studied field [17]; however, the evolution and progression of urban heat island in Kuala Lumpur (see [18] for an extensive review of some of these previous studies) and the health implications [19,20] have been examined and documented rather extensively: Greater Kuala Lumpur, with a population expected to exceed 10 million in 2020, similar to other Asian megacities, suffers from substantial urban heating [21], which is attributable mainly to the rate of urbanization (and conurbation), which is among the highest in Southeast Asia [22], subsequent changes in the cityscape and land-use, and increasingly higher anthropogenic heating due to steep population rise.

2. On-Site Monitoring

2.1. Monitoring Equipment and Locations

In order to identify the trends in near-surface air temperature (T) and relative humidity (RH) in different land-use areas, ibutton DS 1923 Hygrocon sensors (Model DS1923F5, Maxim Integrated, San Jose, CA, USA) (sensor resolution and accuracy: (T) 0.0625 °C, <0.5 °C; (RH) 0.04%, <5%) were used along with radiation shields (HOBO, model RS3, Onset Computer, MA, USA), and readings were logged every half an hour. The sensors were set up at approximately 2.5 m height, so that the readings were representative of the physiological hygrothermal experience of the urban dwellers while also ensuring the safety of the sensors.
Using this setup, a rigorous on-site monitoring work was carried out in 11 locations within central Kuala Lumpur, selected mainly based on their morphological/constructive features, and built-up/green differentiation. These included the following built up areas: (1) Intercontinental Hotel, (2) Jalan P Ramlee, (3) Chow Kit, (4) Malaysia Tourism Centre, (5) Kuala Lumpur City Centre (KLCC) Park, (6) Jalan Ampang-Jalan Tun Razak intersection, and (7 and 8) two locations in Kampung Baru. Kampung Baru is an urban heritage site characterized by traditional Malay homes made of timber, in contrast to the mainly concrete building stock in all other built-up measurement sites (see Section 2.2 for more information). In addition to these built-up areas, (9–11) three green areas, i.e., Perdana Botanic Gardens, Tugu Negara, and Eco Park, were included in the monitoring campaign.
In order to correctly categorize the land-uses the built-up monitoring locations represent, the three-dimensional (3D) building data was used to calculate the average level of compactness and average building height within the 200 m around the sensor locations (Figure 1). The assessment regarding the level of compactness was done based on the λp parameter, which was calculated as the ratio of the planar area within the grid cell occupied by the buildings to the total grid area [23].
The locations with an average λp below and above 0.3 were labelled as open and compact, respectively. Similarly, those with the average building height below and above 40 m were labelled as low- (inclusive of medium-rise) and high-rise, respectively.
The three green areas monitored here, the Perdana Botanic Gardens (BG), Tugu Negara (TN), and Eco Park (ECO), each have varying degrees of tree cover: BG is very open with almost no trees, TN is open with few trees, and ECO is thickly covered by high trees. Therefore, we had: Compact High-Rise areas (CHR) [n = 2, Intercontinental Hotel (IH), Jalan P Ramlee (JPR)], Compact Low-Rise (CLR) [n = 3, two locations within Kampung Baru (KB1 and KB2) and one in Chow Kit (CK)], Open High-Rise (OHR) [n = 2, Kuala Lumpur City Centre Park (KLCC) and Jalan Amp (JA)], Open Low-Rise (OHR) [n = 1, Malaysia Tourism Centre (MATIC)], Open Low-Green (OLG) [n = 2, Perdana Botanic Gardens (BG), Tugu Negara (TN)] and Compact Tall-Green (CTG) [n = 1, Eco Park (ECO)] (Figure 2 and Table 1).

2.2. Kampung Baru (KB)

Kampung Baru (also spelled as Kampong Bharu (KB), see Fujita, 2010; meaning “New Village”) is an urban heritage site located between Chow Kit and KLCC, i.e., right at the heart of Kuala Lumpur’s business and financial center, surrounded by major roads. KB has a total area equal to 110 hectares with a population of 45,000 [24], making this low-rise settlement one of the most densely populated in the city.
Initially a mining area, KB was founded in 1899 as a 91 ha Malay Agriculture Settlement (MAS) to allow Malays a rural life in Kuala Lumpur, although it gradually expanded beyond the MAS, with relatively new-built, non-traditional housing, until it reached its current state. KB is to this day a wholly Malay area and is still governed by a Board of Management in line with the initial management plan set up by the British; however, it is now a completely residential area as opposed to its original multifunctional use combining residential and agricultural purposes [25]. The protocols initially set up to define the land title within the MAS area in KB are still in place, which greatly contributed to remaining almost untouched to the present day. However, echoing a desire ongoing since the 1970s [26], the government in their 2020 development plan states that “many of the original buildings (…) are no longer compatible with their surroundings” and mentions the potential to developing it into a “modern commercial area” because of its proximity within the city center [24], which attracted fierce criticism both from the residents themselves, and the public in and outside Malaysia (e.g., [27,28]). The political and economic pressures pushed residents to join forces under various organizations in order to facilitate efficient negotiations with the government to ensure sustainable (re)development of the neighborhood. However, following many town meetings and the government’s ever increasing land price offers, the majority of the residents are reported to have agreed on the development of a “Taman Warisan Melayu” (Malay Heritage Park) in the neighborhood: the project involves the reconstruction/refurbishment of 11 traditional homes and preservation of a few monumental landmarks including the 119 year-old Kampung Baru Mosque, along with the development of 45,000 new houses, an upgrade of the famous Kampung Baru food markets with car parks, and other amendments regarding public transport and pedestrian routes (all with dire implications for the original spatial and social setting of KB), though there are reportedly still major issues around land ownership [29,30,31,32,33,34]. This entangled state of multi-ownership, as well as the absentee landlords, who are difficult to access to discuss an eventual purchase of their lands, are possibly the main reason for the “development” of KB becoming a reality only some 50 years after it was first proposed [35].
At an intriguing contrast to the skyscrapers visible from within it, at the time of writing this paper KB is still home to some fine examples of traditional timber Malay homes (Figure 3), mainly post and lintel structures with steep roofs, including long roofed typologies, rumah limas (“five roofs”) with crafted carpentry joinery, representative of elaborate workmanship this building culture flourished on [36]. A significant number of these are on stilts, raising floors high above the ground level to protect the building envelope from dampness, catch high winds and facilitate ventilation, and reduce flood damage potential [37,38]. It has been shown that during the “normal” floods that occur commonly during the north-east monsoon, i.e., the wet season, the flood height does not exceed the stilt heights of traditional housing in a given area [39]. The slope of the roofs facilitates easy discharge of rainwater, while the overhangs and gables provide protection from wind driven rain and the natural materials used to build it (such as attap or reeds) prevent heat absorption. The many windows and the lack of conventional partitioning between various usage areas within homes further encourage air circulation providing passive cooling, preventing stagnation and development of moisture-induced decay in the building envelope [40,41,42]. Therefore, traditional Malay typologies have been developed to ensure the highest comfort under prevailing hot and humid climatic conditions and to provide the most efficient protection from environmental hazards common to the tropics, having much to offer to modern sustainable and climate-resilient building design, as other vernacular typologies do.

2.3. Diurnal Average Temperature and Relative Humidity Variations

The diurnal near surface air T and RH variations in the monitoring locations are shown in Figure 4a–d for a month each in wet and dry seasons in 2018: from 20 February to 18 March, which correspond to the end of the rainy Northeast Monsoon, and from 9 June to 1 July, which is a part of the drier Southwest Monsoon, respectively [18,43]. The selection of these two different months also provides an opportunity to delve into the impact of solar angle on the thermal environment, as Kuala Lumpur is located near the equator the solar radiation is stronger in March, while the solar elevation angle is higher in June.
In order to improve the readability of the graphs, trends under the same land-use area with negligible differences have been averaged, such as KB1 and 2, two open low green spaces, i.e., BG and TN, two CHR locations, i.e., IH and JPR, and two OHR locations, i.e., KLCC and JA.
The results show that the T and RH ranges in wet and dry seasons are quite similar, although they are slightly narrower in the latter case. The highest T and lowest RH appear in CLR locations (CK and KB) during daytime, due to less shading that results in higher solar gain, as well as the anthropogenic heat from the traffic. While CK shows the same, among the highest T, with the lowest RH trends during the nighttime, KB tends to show lower T and higher RH trends, which is indicative of more moisture inducing anthropogenic activity such as outdoor cooking, and less anthropogenic heating (both traffic and waste heat from AC systems). This also demonstrates the impact of building materials: the concrete buildings dominating CK have both higher unit thermal storage and thicker walls (i.e., more material available to absorb heat) than traditional kampung houses of KB, made of thinner, timber walls (for a more comprehensive discussion on building materials see [44]). Interestingly, Ts on OHR are similar to CLR Ts during the wet season (March), while they are lower than CLR Ts during the dry season (June). This is considered to be because OHR locations are exposed to higher solar radiation levels due to the higher solar angle of Kuala Lumpur during the wet season. CHR locations, on the other hand, are situated somewhere in the middle of all land-use areas in terms of both daytime and nighttime T and RH values. Daytime Ts in CHR locations were found to be lower than CLR and OHR areas, as expected, due to the shading effect and large heat storage in these areas owed to the building morphology, providing increased surface area and volume that can trap and absorb more solar radiation in the daytime. This is released at nighttime, making the nighttime Ts at CHR locations comparable to those at CLR locations and OHR. The lower radiative cooling due to smaller sky view factor may also play a role in the relatively higher nighttime Ts in CHR locations. The lowest daytime Ts are observed in ECO, as expected due to more shading from the trees. However, the temperatures in ECO are higher than that in BG and TN during nighttime. This is considered to be because of the larger nocturnal cooling in BG and TN, due to lower roughness, which may result in higher wind speeds and convection rates, as well as the larger radiative cooling thanks to a more open morphology.

3. Metrics Indicative of Thermal Comfort and Energy Use

To demonstrate the importance of accounting for the impact of humidity while assessing heat induced risks on human health and wellbeing, we first used the monitoring data for an appraisal of mortality likelihood using the risk curves derived by Mora et al. [45] identifying the hygrothermal thresholds for lethal events, using a range of daily climatic data including near-surface air temperature, near-surface relative humidity, solar radiation, and ventilation (Figure 5a,b). The blue curve here indicates the threshold identified by means of Support Vector Machines to best separate lethal and non-lethal conditions based on mean daily surface air T and RH, while the red curve is the 95% probability threshold. As seen, the T and RH values obtained from various locations in Kuala Lumpur indicate that the microclimatic conditions in all land-use areas pose health risks, and green areas are not in any way devoid of risk due to much higher average daily mean relative humidity values than the built-up areas in both seasons.
This clearly shows the need for more comprehensive metrics to assess thermal comfort and heat-induced risk on health and wellbeing. In this paper we used three of these to discuss their suitability for the tropics: heat index, apparent temperature, and equivalent temperature.

3.1. Heat Index

Heat index is one of the “simple” indices to determine felt-like or perceived temperature, developed by [46] by multiple regression from the first version of Steadman’s apparent temperature model (1979), which is discussed in detail in Section 3.2 [47,48]:
HI = { 8.784695 + 1.61139411 × T + 2.338549 × RH 0.14611605 × T × RH ( 1.2308094 × 10 2 ) T 2 ( 1.6424828 × 10 2 ) RH 2 + ( 2.211732 × 10 3 ) T 2 × RH + ( 7.2546 × 10 4 ) T × RH 2 ( 3.582 × 10 6 ) T 2 × RH 2 , T 20   ° C T , T < 20   ° C
where T is air temperature (°C) and RH is the ambient relative humidity (%). The calculated average diurnal heat index variations for different land-use categories are shown in Figure 6. As can be seen, the heat index values are almost always higher than the measured air temperature values. According to the assessment scale of heat index, the index values between 27 °C and 32 °C would be category “caution,” where the possible heat disorders for people in high risk groups would include fatigue, possible with prolonged exposure and/or physical activity. The heat indexes between 32°C and 41 °C, on the other hand, would call for “extreme caution,” where sunstrokes, muscle cramps, and/or heat exhaustion possible with prolonged exposure and/or physical activity are among possible health risks [47]. As seen in Figure 6, an assessment based only on air temperatures would significantly underestimate heat experience in most of the land-use areas with the maximum temperatures lying on the 34–35 °C range as opposed to maximum heat indices at around 40 °C, which are out of the thermal comfort range by a margin dangerously beyond what is accepted as tolerable, i.e., ±1.1–1.7 °C [49], and fall almost entirely under caution and extreme caution categories. Importantly, the risk categorization used here might not be representative of people native to tropical areas. While there are no conclusive studies regarding how heat-induced health risks vary in the tropics, the natives of tropical areas are reported to have a higher tolerance to elevated temperature and humidity conditions [50,51,52,53,54].
The results indicate that the felt-like temperatures in green areas are up to 5 °C lower than the built-up areas at night and early in the morning, while the daytime temperatures in these locations can be comparable to or even higher than those in the built-up areas. Interestingly, while the daytime temperatures are highest in Kampung Baru among built-up case study monitoring sites, they are lowest at night and in the small hours, which is indicative of the lower heat absorption and storage capacity of the building stock in this neighborhood. The lowest daytime temperatures are observed in CHR locations, as expected, owed to the high thermal admittance capacity.

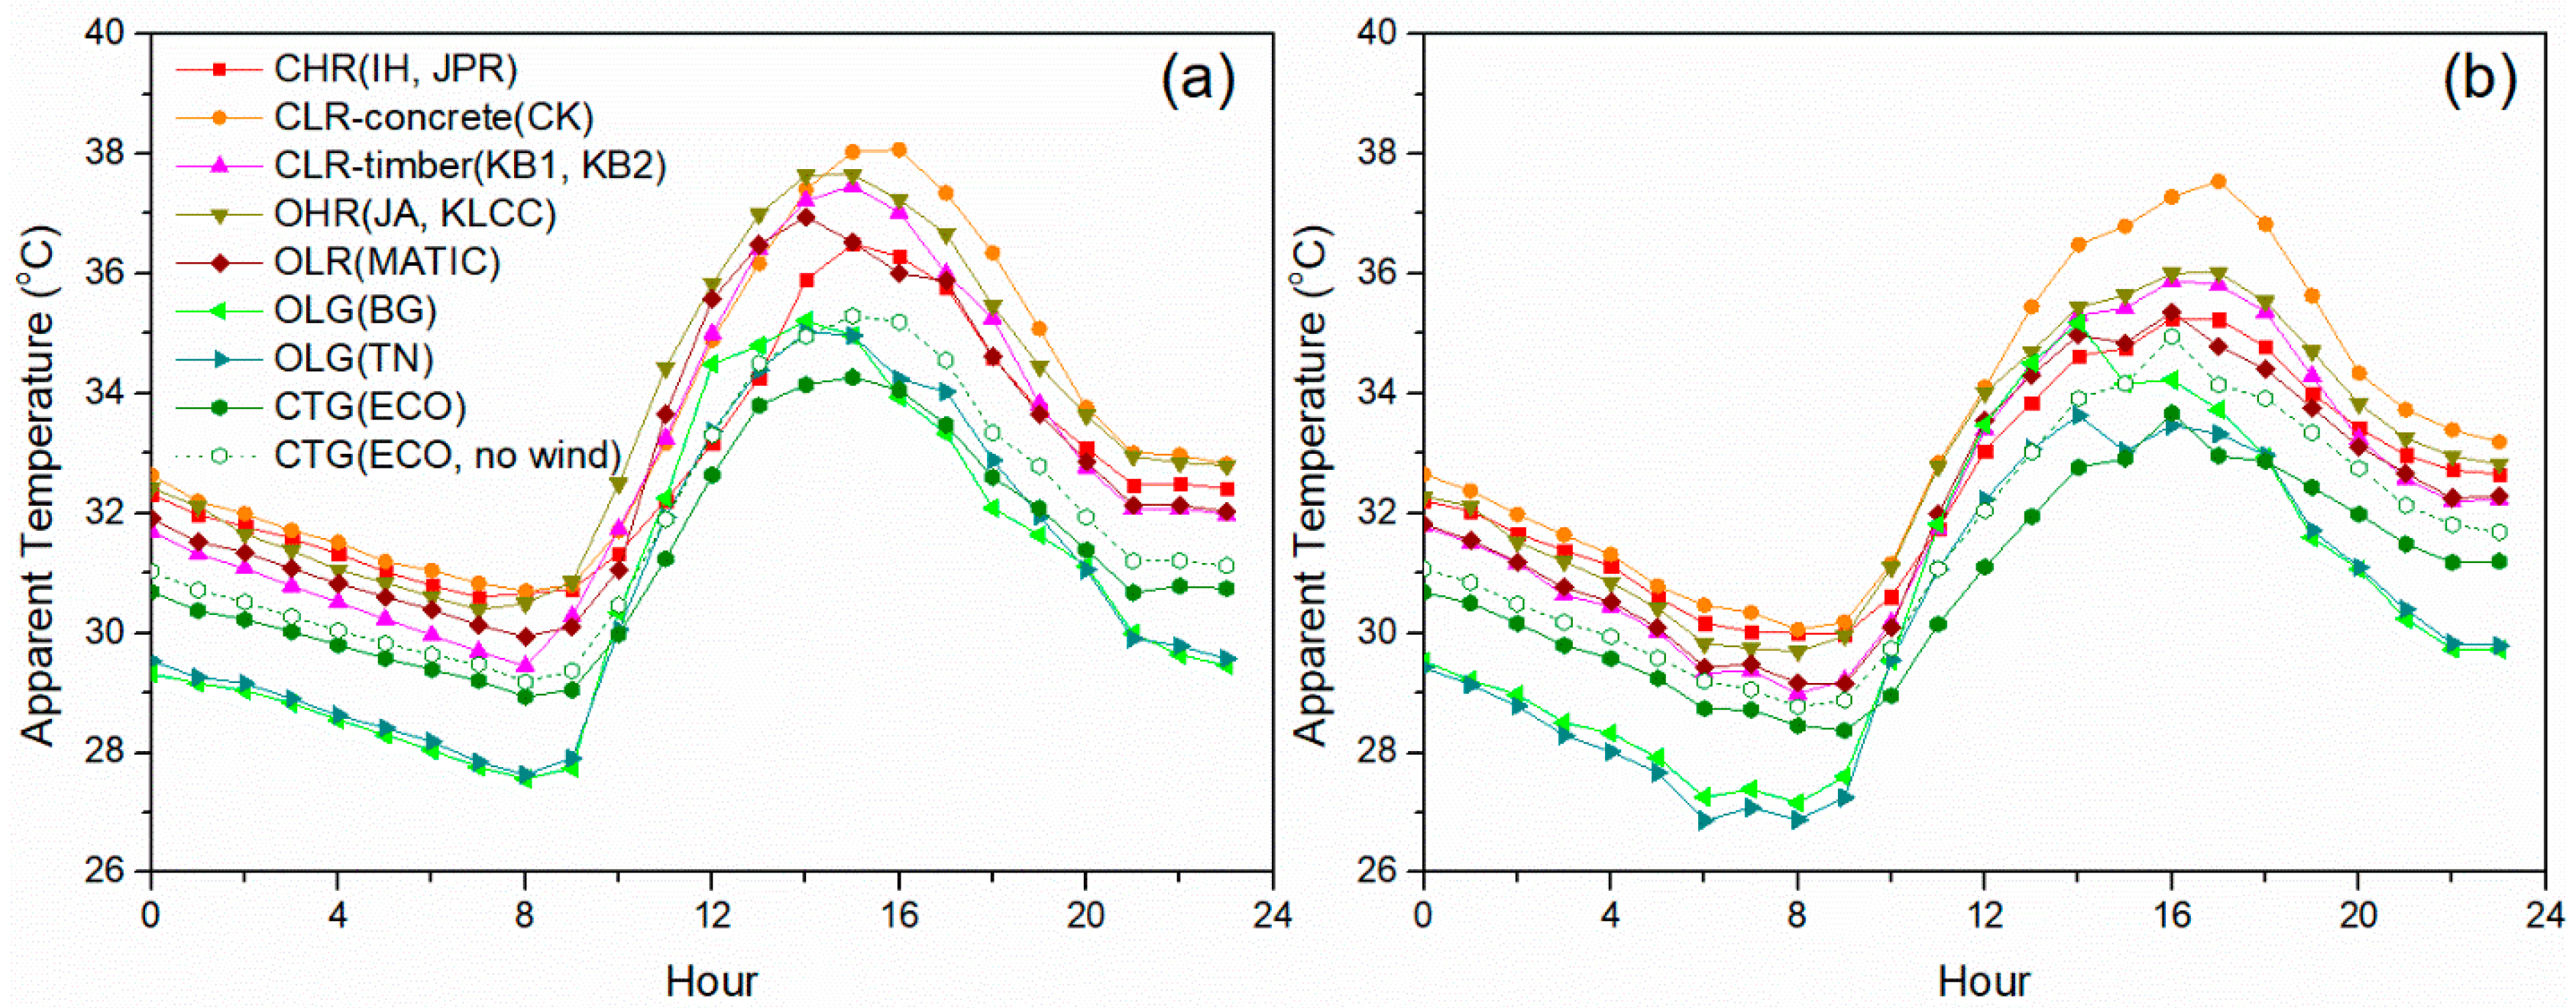
3.2. Apparent Temperature

In addition to heat index, we also used Steadman’s Universal Apparent Temperature Model [55] for a further appraisal of the felt-like temperatures in different land use areas, accounting also for ventilation as follows:
T App = 2.7 + 1.04 × T + 2.0 × P 0.65 υ
where TApp is apparent temperature (°C), T is air temperature (°C), P is water vapor pressure (kPa), which was estimated from our monitored temperature and relative humidity using procedures described by Steadman [56], and υ is the wind speed at 10 m above ground (m/s).
Meteorological Department data from Subang station show that wind speeds can be as high as 7 m/s, while the average values do not exceed 3.5 m/s (Figure 7). The often-lower median values point out overall very still conditions, as expected in the tropics. Importantly, Subang is in Kuala Lumpur’s suburbs in the west, and the wind speed values in the city center are expected to be even lower, due to the increased surface roughness from the buildings. As our monitoring program did not include the measurement of wind speeds, we used wind speed modelling via ADMS-Urban (Atmospheric Dispersion Modelling Software) [57] to estimate wind speeds in different land use to use in the apparent temperature calculations.
ADMS-Urban is a fast local-scale urban climate modelling tool, widely used to calculate the spatiotemporal variation of neighborhood or city scale urban temperatures and dispersion modelling. The parametrization and land-use input data used in the ADMS modelling of Kuala Lumpur to study the urban temperature perturbations was previously described in [58]. In addition to this, in this study a detailed urban canopy model with 200 m resolution was developed to quantify the roughness length in terms of building density and geometry [59] to model hourly wind speeds at 10 m height. The modelled diurnal wind speed trends for 20 February 2018 and 9 June 2018 are shown in Figure 8a,b, respectively. 20 February and 9 June are the first days of our selected wet and dry season windows, respectively, and it was assumed that the overall diurnal wind speed profiles obtained for these two days are representative for the rest of the selected months. The obtained trends clearly demonstrate the contrast of wind speed diurnally between the two green areas, BG and TN, and built up areas for both seasons, with slightly higher values in the dry season.
The diurnal apparent temperature variations calculated as such are shown in Figure 9, which indicates that the apparent temperatures are also always higher than the measured air temperatures shown in Figure 4a,b, especially in the wet season, on green areas and at night, while the ranking of various land-use areas in terms of the thermal comfort they offer does not change. While there are no general risk categories for apparent temperature, similar to the ones we report above for heat index, previous studies suggest that the apparent temperature thresholds for defining levels, beyond which mortality risk increases significantly can be as low as 30.7 °C for Taipei [60], 27 °C for Korea, and 29.4 °C for the Mediterranean basin [6], highlighting the potentially dangerous levels of apparent temperatures in all land-use areas we investigate in Kuala Lumpur. The high temperature values in CK combined with very low wind speed values make this area the one with the highest apparent temperatures, around 4 °C higher than the ambient temperatures in this location at its peak. Because trees have a significant impact on the urban wind flows [61] and as the ADMS modelling is unable to process complex terrain and urban canopy flow simultaneously, and considers only building obstacles, the modelled diurnal wind profile for ECO might not reflect the low ventilation levels prevailing in this very intensely tree covered park. Therefore, we also calculated TApp values based on a no-wind case in ECO, which led to around 1.5 °C higher felt-like temperatures in this location than TApp estimates if this was a largely open, grass covered park such as BG and TN, indicating thermal comfort levels comparable to a built-up area.

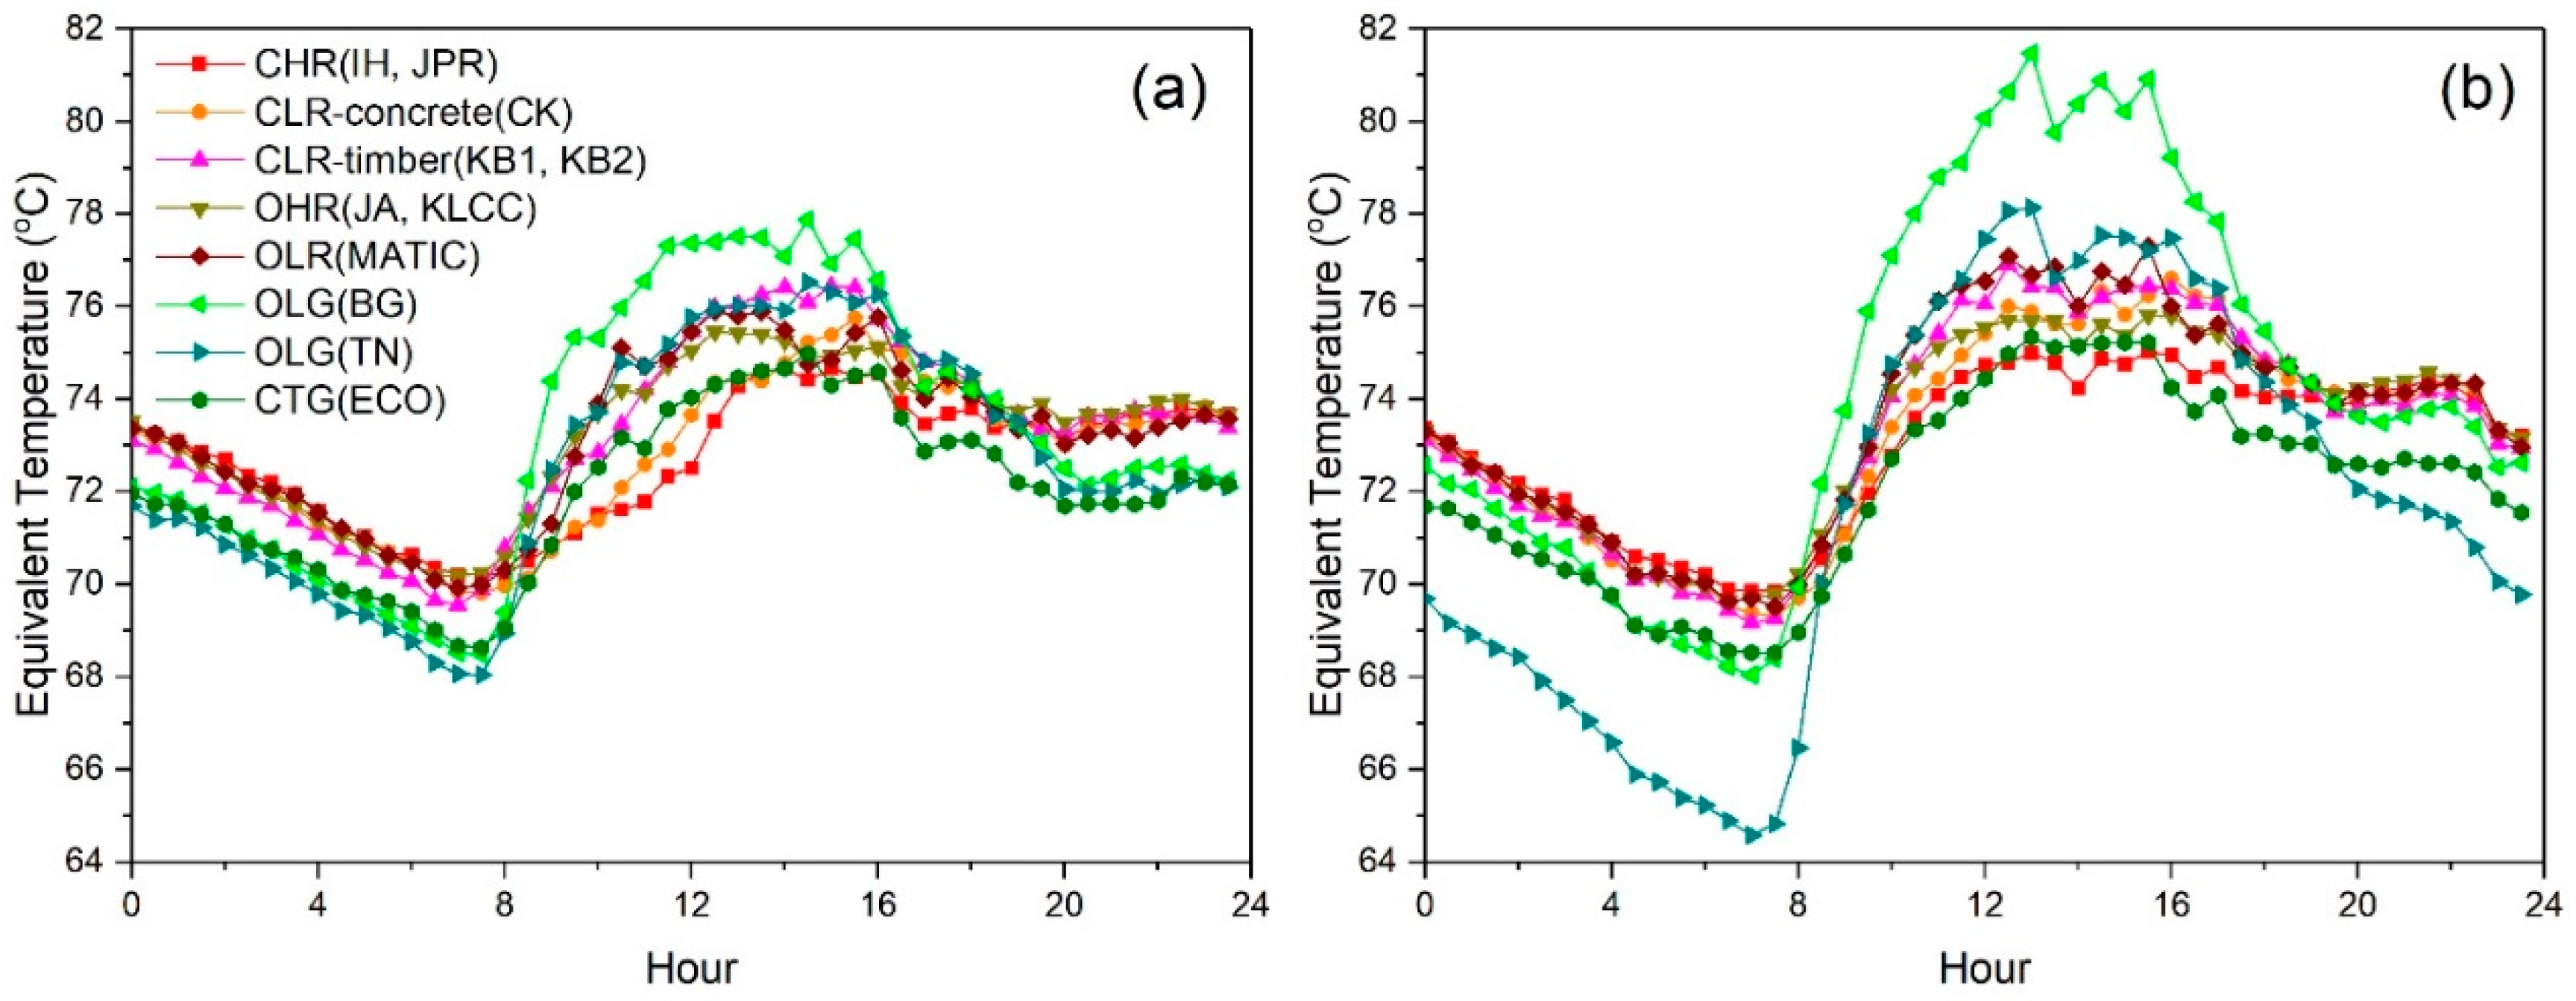
3.3. Equivalent Temperature

In this study, we also focused on equivalent temperature (TE), which shows the total enthalpy from both sensible and latent heat [3,62], and is calculated as follows:
T E = C p T + Lq C p
where Cp is heat capacity of air, taken as 1.005 kJ/(kg·°C), T is the air temperature (°C) measured at each land-use location, L is the latent heat of vaporization taken as 2.5 × 10³ kJ/kg, and q is the specific humidity in kg/kg, which was calculated using the observed RH and air pressure based on the empirical relationship by [63]. As we do not have air pressure measurements at monitoring locations, the air pressure data for Subang Station, which is located at a similar elevation as all the monitoring locations, were used in this study. The data are available from the Integrated Surface Database (ISD) at NOAA (https://www.ncdc.noaa.gov/isd/data-access). Note that the air pressure data are 3-hourly at Subang Station, which were interpolated to a half-hourly dataset in analogy with the monitoring data by Fast Fourier Transform method. The findings can be seen in Figure 10. The results show that open green areas (BG and TN) have the highest equivalent temperature in the daytime, though the air temperature is much lower, due to the very high humidity in these areas. Kampung Baru offers the second highest daytime equivalent temperature, which may be attributed to the high anthropogenic moisture in this area due to a high number of street food vendors. The difference between the equivalent temperature in different land-use areas is otherwise rather small.

4. Discussion

This study used a near-surface monitoring campaign in 11 different locations in Kuala Lumpur, Malaysia, in order to identify temperature and humidity variations in their associated six different land-use categories in wet and dry seasons, for an appraisal of outdoor thermal comfort, on a comparative basis. The results are briefly discussed below in terms of the role of green areas, morphology, and building materials.
Urban green areas are a major source of evapotranspiration, which is a natural cooling mechanism, and therefore, is considered one of the most obvious ways of mitigating elevated urban temperatures. While greenery is indeed effective at reducing urban temperatures (e.g., [64]) at different levels [65], our results show that temperatures in these areas can still be dangerously high in a tropical city. More critically, the thermal comfort in green areas is further compromised due to high humidity levels and, depending on the local morphology, very low ventilation rates. Our results show that while these areas offer the best thermal comfort in the evening and at night, regardless the season, the daytime thermal comfort in open, grass covered green areas (Botanic Gardens and Tugu Negara) is comparable to built-up areas in the wet season, while it is poorer than the built-up areas in the dry season, especially from early-morning to mid-afternoon, with higher felt-like temperatures of up to 8 °C (heat index)/5 °C (apparent temperatures) than air temperatures measured in these locations. As the general human perception of these spaces is that they are thermally comfortable even when the measurements show that they are not [66], this is important to address while advising about risk areas and times for vulnerable segments of the population (e.g., elderly, very young, those with cardiovascular illnesses), and while regulating the maintenance of these areas (e.g., watering times). The Eco Park, which is a thickly wooded green area, was found to offer the lowest daytime temperatures; however, thermal comfort here can converge to built-up areas, when the humidity levels and very low wind speed values due to high surface roughness are accounted for.
The reduced diurnal temperature values, i.e., cool islands, observed in the Compact High-Rise areas, indicate a strong morphological advantage in the daytime over Open and Low-Rise settings, as expected. The difference in results obtained from two different Open Low-Rise locations (i.e., Chow Kit and Kampung Baru), however, indicate the impact of traffic-induced anthropogenic heating and building materials: use of timber, which has lower thermal inertia and thermal storage capacity, combined with the constructive features of timber housing with thinner walls (see [44]), lead to a smaller thermal mass and higher daytime temperatures in Kampung Baru than in Chow Kit with a building stock with similar morphological characteristics but made in concrete and with thicker walls. This disadvantage in the daytime, however, becomes a major benefit at nighttime: Kampung Baru offers the highest nighttime thermal comfort of all built-up areas.
Previous studies found out that in warm climates/seasons, there is a strong correlation between the outdoor and indoor ambient conditions [67]. Therefore, all three metrics used here can be used as some proxy to assess the building energy use potential under the given outdoor hygrothermal conditions. However, only the equivalent temperature uses absolute humidity, and it is therefore best representative of the cooling load, which is the energy required to remove both sensible and latent heat from an enclosed space through AC systems to maintain a constant indoor dry-bulb air temperature and humidity. Our calculated mean diurnal equivalent temperatures mimic the heat index and apparent temperature findings, though with a more accentuated increases in green areas in the daytime with up to 9% higher values than built-up areas. Of all monitoring locations investigated here, the transferability of outdoor thermal comfort levels to the building energy use potential must be the weakest in Kampung Baru as the building stock here is less reliant on the AC systems to keep the indoor conditions at comfort levels thanks to the constructive features developed over time to tackle hot and humid climatic conditions by encouraging ventilation through the building and limiting heat absorption by materials used and architectural detailing.
Based on these results, humidity and low wind speed values emerge as critical variables governing thermal comfort in tropical areas. Any mitigation method put in place to tackle high urban temperatures, or any urban redevelopment work should consider their impact on humidity and ventilation patterns. Our results do not indicate a significant difference in thermal comfort in dry and wet seasons, at least in the comparative performances of the land-use areas we examine here (cf. [15]). Importantly, it should be noted that within the complexities of an actual urban setting, every area is either a conglomeration of various features that can be defined as low- or high-rise, or open or compact, making labelling them with a given urban morphology class very difficult, or is very closely surrounded by other areas able to be more closely aligned with other, sometimes quite opposing morphologies. To complicate things even further, the traffic-induced heating greatly impacts urban microclimate, especially through the main transport network arteries. Therefore, the temperature and relative humidity values obtained from each site which has been named as a certain land-use area here do not necessarily reflect the ideal hygrothermal characteristics of their associated land-uses. For instance, increasingly heavy traffic surrounding Kampung Baru is known to have made the urban cool island which site once was disappear [68,69].

5. Conclusions

This study shows that our presumptions with regards to thermal comfort levels in different land-use areas should be revisited, especially in a tropical context. In the face of a changing climate and ever-increasing temperatures, mitigating urban heat island without compromising thermal comfort levels and inflating building energy use requires a careful management of humidity levels, as well as a careful selection of building morphology and materials. Urban climate models and a scholarly discourse relying only on-air temperatures will critically underestimate the health, wellbeing, and energy use implications under current and future climates.
Our results, based on mean diurnal variations in different thermal comfort indexes, suggest critically poor thermal comfort levels under normal conditions, even in green areas. A higher risk is expected under increasingly common extreme conditions, such as heatwaves, and absence of background wind, which should be investigated further.
Finally, the pressures that urban heritage sites are facing in growing megacities are not unique to Kampung Baru; rather, it is a global trend with different cultural and legal backdrops against which heritage preservation operates. Vernacular architecture with constructive and architectural features, which have been proven sustainable under a given climatic context do give important clues about thermal comfort and energy efficiency to be considered in modern urban planning, development, and regeneration.

Author Contributions

Conceptualization, Y.D.A.; formal analysis, K.W., Y.Z., J.S., M.J. and C.H.; funding acquisition, Y.D.A., D.D. and J.H.; investigation, Y.D.A.; methodology, Y.D.A. and K.W.; supervision, Y.D.A.; visualization, K.W.; writing—original draft, Y.D.A.; writing—review and editing, K.W., M.O., D.C., M.T.L., D.D. and J.H. All authors have read and agreed to the published version of the manuscript.

Funding

This study was carried out as part of (a) “Future Cities-Disaster Resilient Cities: Forecasting Local Level Climate Extremes and Physical Hazards for Kuala Lumpur,” jointly funded by Innovate UK and EPSRC under the Malaysia–UK Research and Innovation Bridges Competition for Collaborative R&D; Y.D.A., K.W. and D.D. by EPSRC Grant ref. EP/P015506/1; J.H. by EPSRC Grant ref. EP/P015476/1; J.S., M.J., C.H. and D.C. by Innovate UK Grant ref. 102718; M.T.L. and M.O. by Newton-Ungku Omar Fund XX-2017-002 and (b) “Modelling Apparent Temperatures in the Tropical City of Kuala Lumpur” funded by UCL EPSRC Impact Acceleration Award; Y.D.A., K.W., D.D. and J.H. for Grant ref. EP/R511638/1.

Acknowledgments

The 3D building dataset is courtesy of the UKM’s Southeast Asia Disaster Prevention Research Initiative (SEADPRI-UKM) based on the 2013 LiDAR dataset from the KL City Hall (DBKL). We thank Lim Choun-Sian for facilitating building data acquisition, and the Malaysian Meteorological Department for the weather data. Finally, we are indebted to the Malaysian project leader Joy Pereira for making this collaboration possible.

Conflicts of Interest

The authors declare no conflict of interest.

Abbreviations

TAir temperature (°C)
RHAmbient relative humidity (%)
PWater vapor pressure (kPa)
υ Wind speed at 10 m above ground (m/s)
TEEquivalent temperature (°C)
CLRCompact Low-Rise
OLROpen Low-Rise
JAJalan Ampang
LLatent heat of vaporization (kJ/kg)
JPRJalan P Ramlee
BGBotanic Gardens
ECOEco Park
CHRCompact High-Rise
OHROpen High-Rise
CKChow Kit
KBKampung Baru
IHIntercontinental Hotel
HIHeat index (°C)
TAppApparent temperature (°C)
CpHeat capacity of air (kJ/(kg·°C))
qSpecific humidity (kg/kg)
MATICMalaysia Tourism Centre
TNTugu Negara
KLCCKL City Centre Park

References

  1. Oke, T.R. Boundary Layer Climates, 2nd ed.; Routledge: New York, NY, USA, 1987. [Google Scholar]
  2. Hunt, J.C.R.; Aktas, Y.D.; Mahalov, A.; Moustaoui, M.; Salamanca, F.; Georgescu, M.; Palou, F.S. Climate change and growing megacities: Hazards and vulnerability. Proc. Inst. Civ. Eng. Eng. Sustain. 2018, 171, 314–326. [Google Scholar] [CrossRef] [Green Version]
  3. Matthews, T. Humid heat and climate change. Prog. Phys. Geogr. Earth Environ. 2018, 42, 391–405. [Google Scholar] [CrossRef] [Green Version]
  4. Wichmann, J.; Andersen, Z.J.; Ketzel, M.; Ellermann, T.; Loft, S. Apparent Temperature and Cause-Specific Emergency Hospital Admissions in Greater Copenhagen, Denmark. PLoS ONE 2011, 6, e22904. [Google Scholar] [CrossRef] [Green Version]
  5. Baccini, M.; Biggeri, A.; Accetta, G.; Kosatsky, T.; Katsouyanni, K.; Analitis, A.; Anderson, H.R. Heat effects on mortality in 15 European cities. Epidemiology 2008, 19, 711–719. [Google Scholar] [CrossRef]
  6. Basu, R. High ambient temperature and mortality: A review of epidemiologic studies from 2001 to 2008. Environ. Health 2009, 8, 40. [Google Scholar] [CrossRef] [Green Version]
  7. Basu, R.; Ostro, B.D. A Multicounty Analysis Identifying the Populations Vulnerable to Mortality Associated with High Ambient Temperature in California. Am. J. Epidemiol. 2008, 168, 632–637. [Google Scholar] [CrossRef]
  8. Zanobetti, A.; Schwartz, J. Temperature and Mortality in Nine US Cities. Epidemiology 2008, 19, 563–570. [Google Scholar] [CrossRef] [Green Version]
  9. Bell, M.; O’Neill, M.S.; Ranjit, N.; Borja-Aburto, V.H.; A Cifuentes, L.; Gouveia, N. Vulnerability to heat-related mortality in Latin America: A case-crossover study in São Paulo, Brazil, Santiago, Chile and Mexico City, Mexico. Int. J. Epidemiol. 2008, 37, 796–804. [Google Scholar] [CrossRef] [Green Version]
  10. Stafoggia, M.; Forastiere, F.; Agostini, D.; Biggeri, A.; Bisanti, L.; Cadum, E.; Caranci, N.; Donato, F.K.D.; De Lisio, S.; De Maria, M.; et al. Vulnerability to Heat-Related Mortality. Epidemiology 2006, 17, 315–323. [Google Scholar] [CrossRef]
  11. Raymond, C.; Matthews, T.; Horton, R.M. The emergence of heat and humidity too severe for human tolerance. Sci. Adv. 2020, 6, eaaw1838. [Google Scholar] [CrossRef] [PubMed]
  12. Wang, Z.; Song, J.; Chan, P.W.; Li, Y. The urban moisture island phenomenon and its mechanisms in a high-rise high-density city. Int. J. Clim. 2020. [Google Scholar] [CrossRef]
  13. Doan, Q.-V.; Kusaka, H.; Ho, Q.-B. Impact of future urbanization on temperature and thermal comfort index in a developing tropical city: Ho Chi Minh City. Urban Clim. 2016, 17, 20–31. [Google Scholar] [CrossRef]
  14. Qaid, A.; Bin Lamit, H.; Ossen, D.R.; Shahminan, R.N.R. Urban heat island and thermal comfort conditions at micro-climate scale in a tropical planned city. Energy Build. 2016, 133, 577–595. [Google Scholar] [CrossRef]
  15. Chow, W.T.L.; Akbar, S.N. Assyakirin, B.A.; Heng, S.L.; Roth, M. Assessment of measured and perceived microclimates within a tropical urban forest. Urban For. Urban Green. 2016, 16, 62–75. [Google Scholar] [CrossRef] [Green Version]
  16. Maia-Silva, D.; Kumar, R.; Nateghi, R. The critical role of humidity in modeling summer electricity demand across the United States. Nat. Commun. 2020, 11, 1–8. [Google Scholar] [CrossRef] [Green Version]
  17. Roth, M. Review of urban climate research in (sub)tropical regions. Int. J. Clim. 2007, 27, 1859–1873. [Google Scholar] [CrossRef]
  18. Ramakreshnan, L.; Aghamohammadi, N.; Fong, C.S.; GhaffarianHoseini, A.; GhaffarianHoseini, A.; Wong, L.-P.; Hassan, N.; Sulaiman, N.M. A critical review of Urban Heat Island phenomenon in the context of Greater Kuala Lumpur, Malaysia. Sustain. Cities Soc. 2018, 39, 99–113. [Google Scholar] [CrossRef]
  19. Aghamohammadi, N.; Ramakreshnan, L.; Fong, C.S.; Sulaiman, N.M. Climate-Related Disasters and Health Impact in Malaysia. In Extreme Weather Events and Human Health: International Case Studies; Springer: Cham, Switzerland, 2019; pp. 247–264. [Google Scholar]
  20. Wong, L.P.; Alias, H.; Aghamohammadi, N.; Aghazadeh, S.; Lai, S.H. Urban heat island experience, control measures and health impact: A survey among working community in the city of Kuala Lumpur. Sustain. Cities Soc. 2017, 35, 660–668. [Google Scholar] [CrossRef]
  21. Yatim, A.N.M.; Latif, M.T.; Ahamad, F.; Khan, F.; Nadzir, M.S.M.; Juneng, L. Observed Trends in Extreme Temperature over the Klang Valley, Malaysia. Adv. Atmos. Sci. 2019, 36, 1355–1370. [Google Scholar] [CrossRef]
  22. Yuen, B.; Kong, L. Climate change and urban planning in Southeast Asia. SAPIENS Surv. Perspect. Integr. Environ. Soc. 2009, 2, 1–11. [Google Scholar]
  23. CERC. ADMS Urban Canopy Tool User Guide; CERC: Cambridge, UK, 2014. [Google Scholar]
  24. DBKL. Kuala Lumpur Structure Plan 2020; Kuala Lumpur City Hall: Kuala Lumpur, Malaysia, 2018. [Google Scholar]
  25. Alhabshi, S.M. Urban Renewal of Traditional Settlements in Singapore and Malaysia: The Cases of Geylang Serai and Kampung Bharu. Asian Surv. 2010, 50, 1135–1161. [Google Scholar] [CrossRef]
  26. Chee, W.T. From Spontaneous Settlement to Rational Land Use Planning: The Case of Kuala Lumpur, Malaysia. Sojourn J. Soc. Issues Southeast Asia 1991, 6, 240–262. [Google Scholar]
  27. Mayberry, K. A Village Amid Skyscrapers: How Long Can Kuala Lumpur’s Enclave Hold out? The Guardian. 9 March 2017. Available online: https://www.theguardian.com/cities/2017/mar/09/village-amid-skyscrapers-kuala-lumpur-kampung-bharu (accessed on 14 April 2020).
  28. FMT News. Skyscrapers Threaten to Swallow KL’s Last Malay Village. Free Malaysia Today. 13 April 2018. Available online: https://www.freemalaysiatoday.com/category/nation/2018/04/13/skyscrapers-threaten-to-swallow-kls-last-malay-village/ (accessed on 14 April 2020).
  29. Hassan, H. Malaysia’s Malay Enclave of Kampung Baru Inches Closer to Redevelopment. The Straits Times. 13 January 2020. Available online: https://www.straitstimes.com/asia/se-asia/malaysias-malay-enclave-of-kampung-baru-inches-closer-to-redevelopment (accessed on 18 April 2020).
  30. Azis Ngah, O.M. Bandar Moden Simbol Kekuatan Melayu Kota. BH Online. 21 April 2019. Available online: https://www.bharian.com.my/berita/nasional/2019/04/555541/bandar-moden-simbol-kekuatan-melayu-kota (accessed on 11 April 2020).
  31. Babulal, V.; Ying, T.P. Kampung Baru Land Deal: Final Offer to Be Made by PM. New Straits Times. 22 September 2019. Available online: https://www.nst.com.my/news/nation/2019/09/523428/kampung-baru-land-deal-final-offer-be-made-pm (accessed on 3 March 2020).
  32. New Straits Times. 2019 Sees a Glimmer of Hope towards Kampung Baru Redevelopment. New Straits Times. 26 December 2019. Available online: https://www.nst.com.my/news/nation/2019/12/550875/2019-sees-glimmer-hope-towards-kampung-baru-redevelopment (accessed on 9 March 2020).
  33. Rodzi, N.H. PH Govt Makes Fresh Offer to Redevelop Malay Enclave in KL. The Straits Times. 22 September 2019. Available online: https://www.straitstimes.com/asia/se-asia/ph-govt-makes-fresh-offer-to-redevelop-malay-enclave-in-kl (accessed on 5 April 2020).
  34. Zainol, M.J. Transform Kampung Baru into a Central Park. New Straits Times. 3 October 2019. Available online: https://www.nst.com.my/opinion/letters/2019/10/526867/transform-kampung-baru-central-park (accessed on 7 March 2020).
  35. Fujita, M.A. Forays into Building Identity. J. Arch. Educ. 2010, 63, 8–24. [Google Scholar] [CrossRef]
  36. Hashim, W.; Nasir, A.H. The Traditional Malay House; Institut Terjemahan Negara Malaysia: Kuala Lumpur, Malaysia, 2011. [Google Scholar]
  37. Yuan, L.J. Under one roof: The traditional Malay house. IDRC Rep. 1984, 12, 15–16. [Google Scholar]
  38. Chan, N.W.; Parker, D.J. Response to Dynamic Flood Hazard Factors in Peninsular Malaysia. Geogr. J. 1996, 162, 313. [Google Scholar] [CrossRef]
  39. Chan, N.W. Increasing flood risk in Malaysia: Causes and solutions. Disaster Prev. Manag. Int. J. 1997, 6, 72–86. [Google Scholar] [CrossRef]
  40. Yuan, L.J. The Malay House: Rediscovering Malaysia’s Indigenous Shelter System; Institut Masyarakat: Penang, Malaysia, 1987. [Google Scholar]
  41. Kamal, K.S.; Wahab, L.A.; Ahmad, A.C. Climatic design of the traditional Malay house to meet the requirement of modern living. In Proceedings of the 38th International Conference of Architectural Science Association ANZAScA: “Contexts of Architecture”, Launceston, Tasmania, 10–12 November 2004; pp. 175–179. [Google Scholar]
  42. Nordin, T.E.; Husin, H.N.; Kamal, K.S. Climatic Design Feature in the Traditional Malay House for Ventilation Purpose. In Proceedings of the International Seminar on Malay Architecture as Lingua Franca, Jakarta, Indonesia, 22–23 June 2005; pp. 41–48. [Google Scholar]
  43. Ooi, M.; Chan, A.; Subramaniam, K.; Morris, K.; Oozeer, M.Y. Interaction of Urban Heating and Local Winds During the Calm Intermonsoon Seasons in the Tropics. J. Geophys. Res. Atmos. 2017, 122, 11, 499–523. [Google Scholar] [CrossRef]
  44. Aktaş, Y.D.; Stocker, J.; Carruthers, D.; Hunt, J. A Sensitivity Study Relating to Local Urban Climate Modelling within the Built Environment. Procedia Eng. 2017, 198, 589–599. [Google Scholar] [CrossRef]
  45. Mora, C.; Dousset, B.; Caldwell, I.; Powell, F.E.; Geronimo, R.C.; Bielecki, C.R.; Counsell, C.W.W.; Dietrich, B.S.; Johnston, E.T.; Louis, L.; et al. Global risk of deadly heat. Nat. Clim. Chang. 2017, 7, 501–506. [Google Scholar] [CrossRef]
  46. Rothfusz, L.P. The Heat Index Equation; SR/SSD 90–23; NWS Southern Region Technical Attachment: Fort Worth, TX, USA, 1990. [Google Scholar]
  47. Blazejczyk, K.; Epstein, Y.; Jendritzky, G.; Staiger, H.; Tinz, B. Comparison of UTCI to selected thermal indices. Int. J. Biometeorol. 2011, 56, 515–535. [Google Scholar] [CrossRef] [Green Version]
  48. Anderson, G.B.; Bell, M.; Peng, R.D. Methods to Calculate the Heat Index as an Exposure Metric in Environmental Health Research. Environ. Health Perspect. 2013, 121, 1111–1119. [Google Scholar] [CrossRef] [PubMed]
  49. Wang, S.K. Handbook of Air Conditioning and Refrigeration; McGraw-Hill: New York, NY, USA, 2001. [Google Scholar]
  50. Saat, M.; Tochihara, Y.; Hashiguchi, N.; Sirisinghe, R.G.; Fujita, M.; Chou, C.M. Effects of Exercise in the Heat on Thermoregulation of Japanese and Malaysian Males. J. Physiol. Anthr. Appl. Hum. Sci. 2005, 24, 267–275. [Google Scholar] [CrossRef] [PubMed] [Green Version]
  51. Nguyen, M.; Tokura, H. Observations on Normal Body Temperatures in Vietnamese and Japanese in Vietnam. J. Physiol. Anthr. Appl. Hum. Sci. 2002, 21, 59–65. [Google Scholar] [CrossRef] [PubMed] [Green Version]
  52. Mallick, F.H. Thermal comfort and building design in the tropical climates. Energy Build. 1996, 23, 161–167. [Google Scholar] [CrossRef]
  53. Nasir, R.A.; Ahmad, S.; Zain-Ahmed, A. Adaptive Outdoor Thermal Comfort at an Urban Park in Malaysia. Asian J. Behav. Stud. 2018, 3, 13. [Google Scholar] [CrossRef] [Green Version]
  54. Karyono, T.H. Thermal Comfort in the Tropical South East Asia Region. Arch. Sci. Rev. 1996, 39, 135–139. [Google Scholar] [CrossRef]
  55. Steadman, R.G. A Universal Scale of Apparent Temperature. J. Clim. Appl. Meteorol. 1984, 23, 1674–1687. [Google Scholar] [CrossRef]
  56. Steadman, R.G. The assessment of sultriness. Part I: A temperature-humidity index based on human physiology and clothing science. J. Appl. Meteorol. 1979, 18, 861–873. [Google Scholar] [CrossRef] [Green Version]
  57. CERC. ADMS-Urban Urban Air Quality Management System User Guide; CERC: Cambridge, UK, 2017. [Google Scholar]
  58. Wang, K.; Aktas, Y.D.; Stocker, J.; Carruthers, D.; Hunt, J.; Malki-Epshtein, L. Urban heat island modelling of a tropical city: Case of Kuala Lumpur. Geosci. Lett. 2019, 6, 4. [Google Scholar] [CrossRef]
  59. Hood, C.; Carruthers, D.; Seaton, M.; Stocker, J.; Johnson, K. Urban canopy flow field and advanced street canyon modelling in ADMS-Urban. In Proceedings of the 16th International Conference on Harmonisation within Atmospheric Dispersion Modelling for Regulatory Purposes, Varna, Bulgaria, 8–11 September 2014. [Google Scholar]
  60. Chung, J.-Y.; Honda, Y.; Hong, Y.-C.; Pan, X.-C.; Guo, Y.L.; Kim, H. Ambient temperature and mortality: An international study in four capital cities of East Asia. Sci. Total. Environ. 2009, 408, 390–396. [Google Scholar] [CrossRef]
  61. Salim, M.; Schlünzen, K.H.; Grawe, D. Including trees in the numerical simulations of the wind flow in urban areas: Should we care? J. Wind. Eng. Ind. Aerodyn. 2015, 144, 84–95. [Google Scholar] [CrossRef] [Green Version]
  62. Pielke, R.A., Sr.; Davey, C.; Morgan, J. Assessing “global warming” with surface heat content. Eos Trans. Am. Geophys. Union 2004, 85, 210. [Google Scholar] [CrossRef]
  63. Ford, T.W.; Schoof, J.T. Characterizing extreme and oppressive heat waves in Illinois. J. Geophys. Res. Atmos. 2017, 122, 682–698. [Google Scholar] [CrossRef]
  64. Buyadi, S.N.A.; Mohd, W.M.N.W.; Misni, A. Impact of Land Use Changes on the Surface Temperature Distribution of Area Surrounding the National Botanic Garden, Shah Alam. Procedia Soc. Behav. Sci. 2013, 101, 516–525. [Google Scholar] [CrossRef] [Green Version]
  65. Richards; Fung, T.; Belcher, R.; Edwards, P. Differential air temperature cooling performance of urban vegetation types in the tropics. Urban For. Urban Green. 2020, 50, 126651. [Google Scholar] [CrossRef]
  66. Ali, S.B.; Patnaik, S. Thermal comfort in urban open spaces: Objective assessment and subjective perception study in tropical city of Bhopal, India. Urban Clim. 2018, 24, 954–967. [Google Scholar] [CrossRef]
  67. Nguyen, J.; Schwartz, J.D.; Dockery, D. The relationship between indoor and outdoor temperature, apparent temperature, relative humidity, and absolute humidity. ISEE Conf. Abstr. 2013, 2013, 4712. [Google Scholar] [CrossRef]
  68. Elsayed, I.S. A study on the urban heat island of the city of Kuala Lumpur, Malaysia. JKAU Met. Environ. Arid. Land Agric. Sci. 2012, 23, 121–134. [Google Scholar] [CrossRef]
  69. Elsayed, I.S. Mitigation of urban heat island of the city of Kuala Lumpur, Malaysia. Middle East J. Sci. Res. 2012, 11, 1602–1613. [Google Scholar]
Figure 1. Average λp and building heights for the monitoring locations within 200 m distance.
Atmosphere 11 00652 g001
Figure 2. T and RH monitoring locations in Kuala Lumpur city center (drawn on Google Earth).
Atmosphere 11 00652 g002
Figure 3. Some examples from the traditional Malay building stock in Kampung Baru (photos taken by Y. D. Aktas in 2016).
Atmosphere 11 00652 g003
Figure 4. Diurnal variation of air temperature (T) and relative humidity (RH) in wet (a,c) and dry (b,d) seasons for different land use areas.
Atmosphere 11 00652 g004
Figure 5. Measured average daily and average daily mean temperature (T) and relative humidity (RH) values in different land-use areas against the risk threshold derived by Mora et al. [45] in wet (a) and dry months (b).
Atmosphere 11 00652 g005
Figure 6. Diurnal variation of calculated heat index in wet (a) and dry (b) seasons for different land use areas.
Atmosphere 11 00652 g006
Figure 7. The diurnal wind speed ranges, averages and medians for Subang averaged over the wet and dry periods focused in this study (data from MetMalaysia).
Atmosphere 11 00652 g007
Figure 8. Average diurnal wind speed variation as modelled by ADMS-Urban in wet (a) and dry (b) seasons for different land use areas.
Atmosphere 11 00652 g008
Figure 9. Diurnal variation of calculated apparent temperatures in wet (a) and dry (b) seasons for different land use areas.
Atmosphere 11 00652 g009
Figure 10. Diurnal variation of calculated equivalent temperature in wet (a) and dry (b) seasons for different land use areas.
Atmosphere 11 00652 g010
Table 1. On-site monitoring locations (photos taken by K. Wang and M. Othman in 2017).
Open High-Rise (OHR)Jalan Ampang Near KL City Centre Park (KLCC)Jalan Ampang—Jalan Tun Razak Intersection (JA)Green (OLG and CTG)Botanic Gardens (BG)Tugu Negara (TN)Eco Park (ECO)Open Low-Rise (OLR)Malaysia Tourism Centre (MATIC)
Atmosphere 11 00652 i001 Atmosphere 11 00652 i002 Atmosphere 11 00652 i003 Atmosphere 11 00652 i004 Atmosphere 11 00652 i005 Atmosphere 11 00652 i006
Compact High-Rise (CHR)Intercontinental Hotel (IH)Jalan P Ramlee (JPR)Compact Low-Rise (CLR)Kampung Baru (KB1)Kampung Baru (KB2)Chow Kit (CK)
Atmosphere 11 00652 i007 Atmosphere 11 00652 i008 Atmosphere 11 00652 i009 Atmosphere 11 00652 i010 Atmosphere 11 00652 i011

