Article

Impact of VOCs and NOx on Ozone Formation in Moscow

A.M. Obukhov Institute of Atmospheric Physics, Russian Academy of Sciences, 119017 Moscow, Russia
*
Author to whom correspondence should be addressed.
Atmosphere 2020, 11(11), 1262; https://doi.org/10.3390/atmos11111262
Submission received: 7 October 2020 / Revised: 2 November 2020 / Accepted: 19 November 2020 / Published: 23 November 2020
(This article belongs to the Special Issue Tropospheric Ozone Observations)

Abstract

:
Volatile organic compounds (VOCs), ozone (O3), nitrogen oxides (NOx), carbon monoxide (CO), meteorological parameters, and total non-methane hydrocarbons (NMHC) were analyzed from simultaneous measurements at the MSU-IAP (Moscow State University—Institute of Atmospheric Physics) observational site in Moscow from 2011–2013. Seasonal and diurnal variability of the compounds was studied. The highest O3 concentration in Moscow was observed in the summer daytime periods in anticyclonic meteorological conditions under poor ventilation of the atmospheric boundary layer and high temperatures (up to 105 ppbv or 210 μg/m3). In contrast, NOx, CO, and benzene decreased from 8 a.m. to 5–6 p.m. local time (LT). The high positive correlation of daytime O3 with secondary VOCs affirmed an important role of photochemical O3 production in Moscow during the summers of 2011–2013. The summertime average concentrations of the biogenic VOCs isoprene and monoterpenes were observed to be 0.73 ppbv and 0.53 ppbv, respectively. The principal source of anthropogenic VOCs in Moscow was established to be local vehicle emissions. Yet, only about 5% of the observed isoprene was safely attributed to anthropogenic sources, suggesting significant contribution of biogenic sources into the total levels of ozone precursors. The non-linear O3–NOx dependence shows a decrease in ground-level O3 with an increase in NOx during the summers of 2011–2013, which is typical for the VOC-sensitive photochemical regime of O3 formation. Nevertheless, during the elevated ozone episodes in July 2011, the photochemical regime of ozone production was either transitional or NOx-sensitive. Contribution of various anthropogenic and biogenic VOCs into the measured ozone values was evaluated. The ozone-forming potential (OFP) of total VOCs was 31–67 μg/m3 on average and exceeded 100 μg/m3 in the top 10% of high ozone events, reaching 136 μg/m3. Acetaldehyde, 1.3-butadiene, and isoprene have the highest ozone production potential in Moscow compared to that of other measured VOCs.

1. Introduction

Ozone (O3) is one of the most important secondary pollutants of the atmosphere for a variety of environmental conditions ranging from heavily polluted urban atmospheres to remote areas subjected to the impact of regional (biomass burning) and distal sources of ozone precursors through long-range transport [1,2]. In cities, O3 is mainly formed from complex photochemical interactions of volatile organic compounds (VOCs) and nitrogen oxides (NOx) [3,4,5,6]. VOCs help in oxidizing primary NO released from various sources to form NO2 and in retaining the existing ozone by competing with ozone to react with NO [6]. Reductions in VOCs emissions from local and/or upwind sources will decrease ambient ozone formation (and ground-level ozone concentrations) in VOC-sensitive areas but increase ozone production in NOx-sensitive areas. On the other hand, controls of NOx emissions will decrease ozone formation in areas with the NOx-sensitive regime but increase ozone formation in VOC-sensitive areas [6,7,8,9,10,11].
Downwind from climatically important atmospheric pollution sources, ozone production is largely NOx-sensitive at a regional scale, though urban areas with high NOx emissions are frequently VOC-sensitive [10,12]. However, some observation-based studies [4,6,10,11,13] have shown that O3 production in an urban environment can also be NOx-sensitive or at least have a mixed (transitional) regime [5,6,8,12,13,14,15,16,17,18]. The latter may indicate that ozone production in cities is sensitive to specific meteorological conditions affecting a VOC/NOx ratio through a vertical mixing in the planetary boundary layer for a given strength of ozone precursor emission sources. Hence, a closer study of high ozone events in large cities is important for choosing an effective ozone control strategy through reduction of VOCs and/or NOx emissions [10,12].
Ozone concentrations higher than 50 ppbv have a detrimental effect on plants, and levels higher than 100 ppbv cause irreversible changes in the human respiratory system [19]. High air temperature and low wind speeds create the most favorable conditions for ozone photochemical production in Moscow, as in other world megacities, with the daytime ozone levels frequently exceeding its maximum allowable concentration (MAC = 80 ppbv or 160 μg/m3). Ozone concentrations exceeding the MAC were recorded in Moscow under strong anticyclonic conditions [20,21,22,23,24,25,26].
Despite a significant reduction of industrial plants in Moscow over recent decades, the problem of air pollution continues to be urgent due to the rapid and steady growth of the city’s car fleet and the expansion of the motorway area. Hence, understanding the relationship between ozone production and its precursors as well as their impact on ozone generation is important for development of an effective ozone control strategy. We studied diurnal and seasonal variability of ozone and its precursors in the surface air in Moscow; determined the regime of ozone generation; and quantified the contribution of anthropogenic and biogenic VOCs to O3 generation in polluted urban air.

2. Experiments

Ground level concentrations of various species including VOCs (acetaldehyde, ethanol, 1.3-butadiene, acetone, acetic acid, isoprene, MVK + MACR (isoprene products), benzene, 2-methyl-3-buten-2-ol (MBO), toluene, phenol, styrene, C8-aromatics, C9-aromatics, and monoterpenes) and meteorological parameters (air temperature, atmospheric pressure and humidity, solar radiation, wind speed and direction, cloud height, and rainfall amount) were simultaneously measured (Table 1) at the joint ecological station of the Obukhov Institute of Atmospheric Physics, Russian Academy of Sciences, and the Geographic Faculty of Moscow State University (MSU-IAP) [20]. The site is located in the southwestern part of Moscow (about 8 km away from the city center) in the green area of the Botanical Gardens of Moscow State University. The nearest roads with intense traffic are about 300–450 m away from the site.
The measurements at the MSU-IAP site corresponded to the State Standards [27] and satisiued the international requirements for measuring systems operating at the Global Atmospheric Watch network of the World Meteorological Organization (GAW WMO) (see [28,29] for the complete description of the measurement devices). One-hour averages of the measured compounds are used in the subsequent discussion.

3. Results

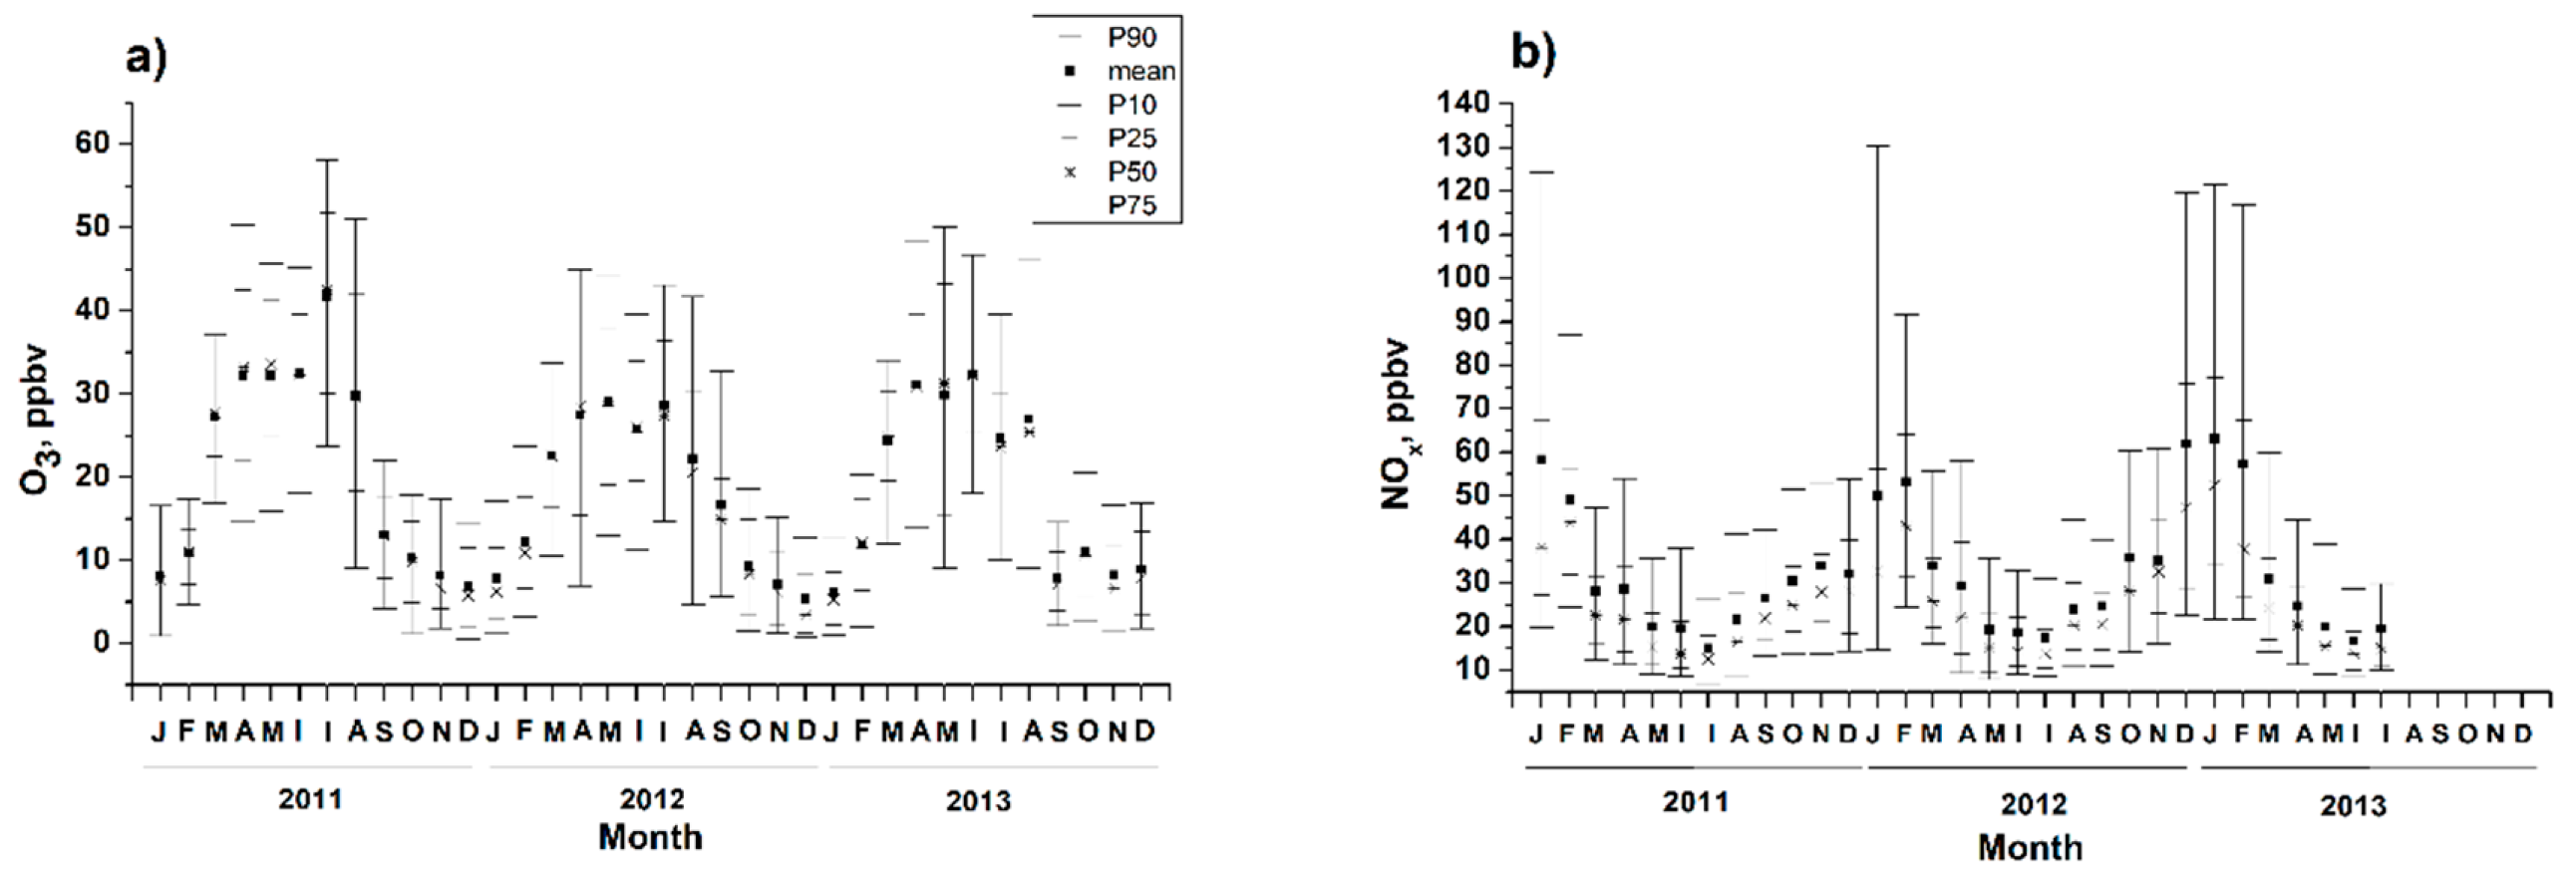
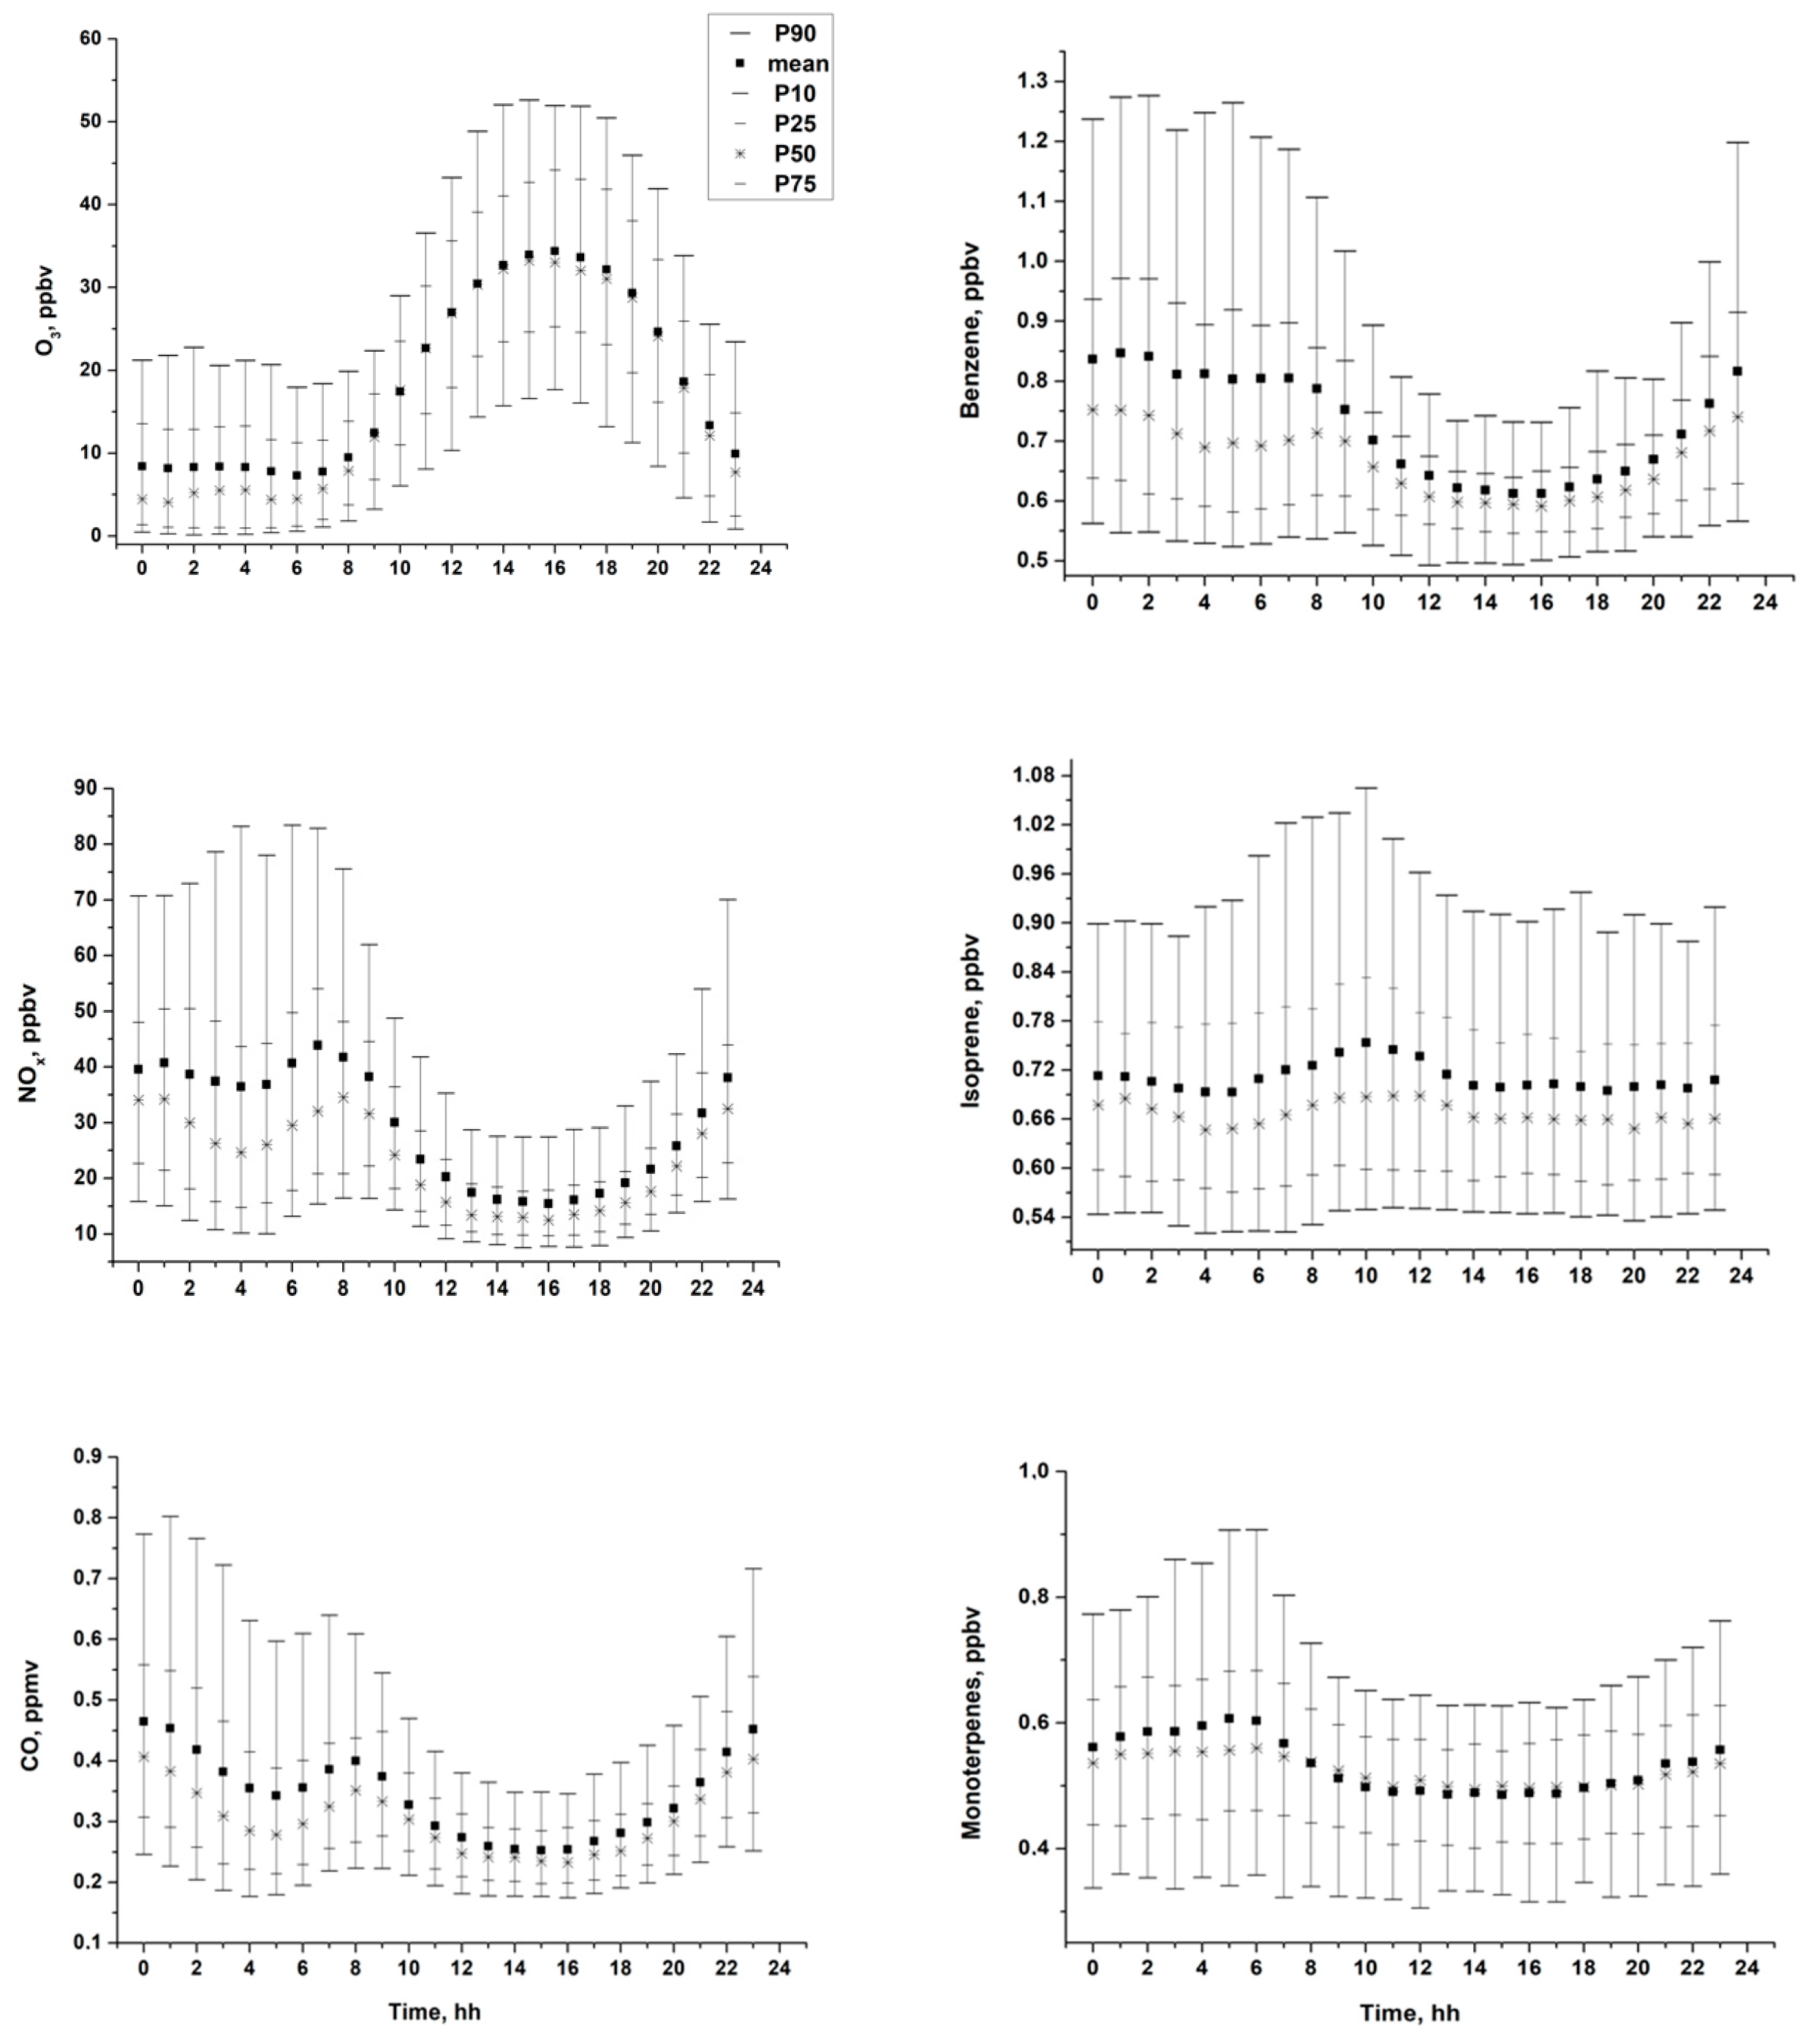
3.1. Diurnal and Seasonal Variability of Inorganic and Organic Species

According to Figure 1a, the highest daytime ozone levels in Moscow were observed from April to August, following closely the annual cycle of the total intensity of solar UV radiation measured at the MSU-IAP site [30,31,32]. The observed abrupt increase of ozone levels in early spring, peaking in April, is a general feature of ozone climatology over the continent as evidenced from a variety of ozone measurements in both polluted and background environments [33,34]. It has been suggested previously that the accumulation of ozone precursors during the cold season at northern latitudes provides a great potential for intense production of ozone under rapid increases of solar UV radiation in late winter and into early spring (see more discussion in [20,34,35]). It is likely that the observed springtime ozone maximum at MSU-IAP has two primary contributions, which are the large-scale tropospheric chemistry and local ozone photochemical production in the polluted boundary layer under sufficient abundance of odd nitrogen species. Another distinct feature of the MSU-IAP ozone seasonal cycle is a prolonged spring–summer maximum [28,35,36], which undoubtedly reflects the primary contribution of large local sources of ozone precursors in the photochemically active period (April–September) [34] and not the downward ozone flux from the stratosphere and continental-scale transport from other potentially important areas of net photochemical production of ozone in the western part of North Eurasia. Over the whole observation period, the highest ozone levels were observed in July 2011, when daytime O3 mixing ratios exceeded the short-time MAC (80 ppb or 160 μg/m3). These episodes are described in detail below.
Seasonal daytime NOx variation is opposite to that of O3 (Figure 1b) with the highest values being observed in winter (up to 130 ppbv). In summer, NOx levels usually did not exceed 30 ppbv. Evidently, the observed four-fold increase in wintertime NOx levels with respect to the summer values is a local manifestation of seasonal variations in vertical mixing intensity and associated atmospheric residence times of pollutants in the lower troposphere over the continent.
Since the origin of the observed enhanced levels of ozone in Moscow during the summer months is photochemical generation, we focus below on the summertime period of the observations to explore some basic features of the urban ozone photochemistry.
Meteorological observations at the MSU-IAP site during the summers of 2011–2013 (Figure 2) show favorable conditions for accumulation of ozone precursors in the surface air and active photochemistry during a substantial part of the summer months. In the observed period, daytime air temperature often reached 25–30 °C. Wind speeds were ≤2 m/s on average and exceeded 3 m/s only in 5% of the whole observation time, thus evidencing generally stagnant meteorological conditions. The prevailing wind directions were from W and NW to N, which correspond to the transport of relatively clean air, subjected to a limited impact of regional pollution sources.
According to Figure 3, O3 mixing ratio increases monotonically from early morning, reaching its maximum value of 34 ppbv (sample mean) at ~4 p.m. LT The diurnal variations of NOx, CO, and benzene, the latter being an important ozone precursor with anthropogenic origin, are opposite to that of O3 and characterized by a stable decrease from their morning peak values at 8 a.m. to late afternoon minimums at ~3–4 p.m. LT. Thus, the observed diurnal variation of the secondary pollutants was strongly and negatively correlated in the day time hours with the depth of the convective mixing layer, and the associated changes with vertical mixing intensity, over Moscow, which peaks at 1–3 p.m. LT, following a daily cycle of radiation and heat balance [37]. Additionally, chemical distraction of the primary emitted VOCs, with benzene as an example, may contribute to their late afternoon decrease accompanied by significant accumulation of ozone and other secondary pollutants (Figure 4). According to Figure 4, the maximum O3 production rate is observed during the late morning hours (10–12 a.m. LT), which also coincides with diurnal peaks of the most abundant secondary VOCs (acetaldehyde, acetone, and acetic acid). The origin of the observed late morning maximum of the above species can be attributed to both photochemical oxidation of primary emitted VOCs after sunrise and entrainment of partially oxidized products from the upper layers under development of the convective boundary layer. The latter may be especially efficient for ozone accumulation in prolonged stagnation conditions leading to overnight retention of secondary organics above a nocturnal inversion layer [38]. All compounds discussed except for O3 are not normally distributed (see Figure S1 in the Supplementary Materials). Thus, we calculated the nonparametric Spearman’s correlation coefficients (Rs) to measure the strength of association between maximal afternoon O3 (3–5 p.m. LT) and maximal morning (10–12 a.m. LT) mixing ratios of some secondary VOCs during the summer months from 2011–2013. High correlations were found between acetaldehyde, ethanol, acetone, and acetic acid (Rs = 0.55–0.91) as well as between the above species and the products of isoprene oxidation, MVK and MACR (Rs = 0.67–0.81) (Table 2). The positive correlation of daytime O3 (Rs = 0.45–0.52) with secondary VOCs affirms an important role of photochemical O3 production in Moscow during the summers of 2011–2013.
According to the MSU-IAP observations, the toluene to benzene ratio (T/B) was mainly in the range of 1–2 (mean = 1.39; P75 = 1.50; P90 = 1.89) (Figure 5). This ratio is known to be a safe indicator of vehicle pollution as well as proximity of the sampled air to the associated pollution sources [39,40,41,42,43]. A T/B ratio approaching 1 indicates traffic-originated emission sources, and the value increases with the closeness of the pollution source [44]. It suggests that the dominated anthropogenic VOCs source in the region of the MSU-IAP site during the summers of 2011–2013 was local vehicle emissions.
The diurnal cycles of biogenic VOCs, isoprene, and monoterpenes were generally weak (Figure 3), which can be explained by the direction of the prevailing winds (Figure 2) blowing mainly from areas with highly limited vegetation. Isoprene levels are the highest during the morning hours (07:00–10:00 a.m.) whereas monoterpenes increase during evening and nighttime hours owing to their emissions at these hours and accumulation in the stable atmosphere.
Since motor vehicle emissions dominate over other pollution sources in urban environments, VOCs primarily produced by motor vehicles (benzene, 1.3-butadiene etc.) are commonly used as suitable exhaust tracers. This allows for quantifying the traffic contributions to ambient isoprene and then separating biogenic isoprene from traffic emissions [45,46,47]. The nighttime isoprene/anthropogenic VOC ratio in a vehicle-polluted atmosphere is supposed to characterize vehicle exhaust [46,48]. We then used benzene concentration to estimate the traffic contribution to isoprene at the MSU-IAP site. Since biogenic isoprene emissions are strongly dependent on air temperature and the amount of local vegetation, nighttime winter isoprene concentrations are supposed to be of anthropogenic origin. Consequently, the monthly mean diurnal isoprene/benzene ratio was lowest during the cold season and reached its maximum during the summer months (mean = 0.94), thus following a seasonal cycle of biogenic isoprene emissions (Figure 6). Yet, the observed high positive nonparametric Spearman’s correlation between isoprene and benzene on summer days (Rs = 0.69) clearly indicates significant contribution of the anthropogenic signal in isoprene data during the warm season as well. A somewhat better correlation is observed for nighttime winter values (Rs = 0.75). The nighttime winter isoprene/benzene ratio in the observed site was calculated to be 0.7 on average (see scatter diagram on Figure 6). It was about 5% of the summer daytime isoprene/benzene ratios. Thus, we suppose that about 5% of the daytime summer isoprene in Moscow had an anthropogenic origin, presumably from vehicle exhaust.

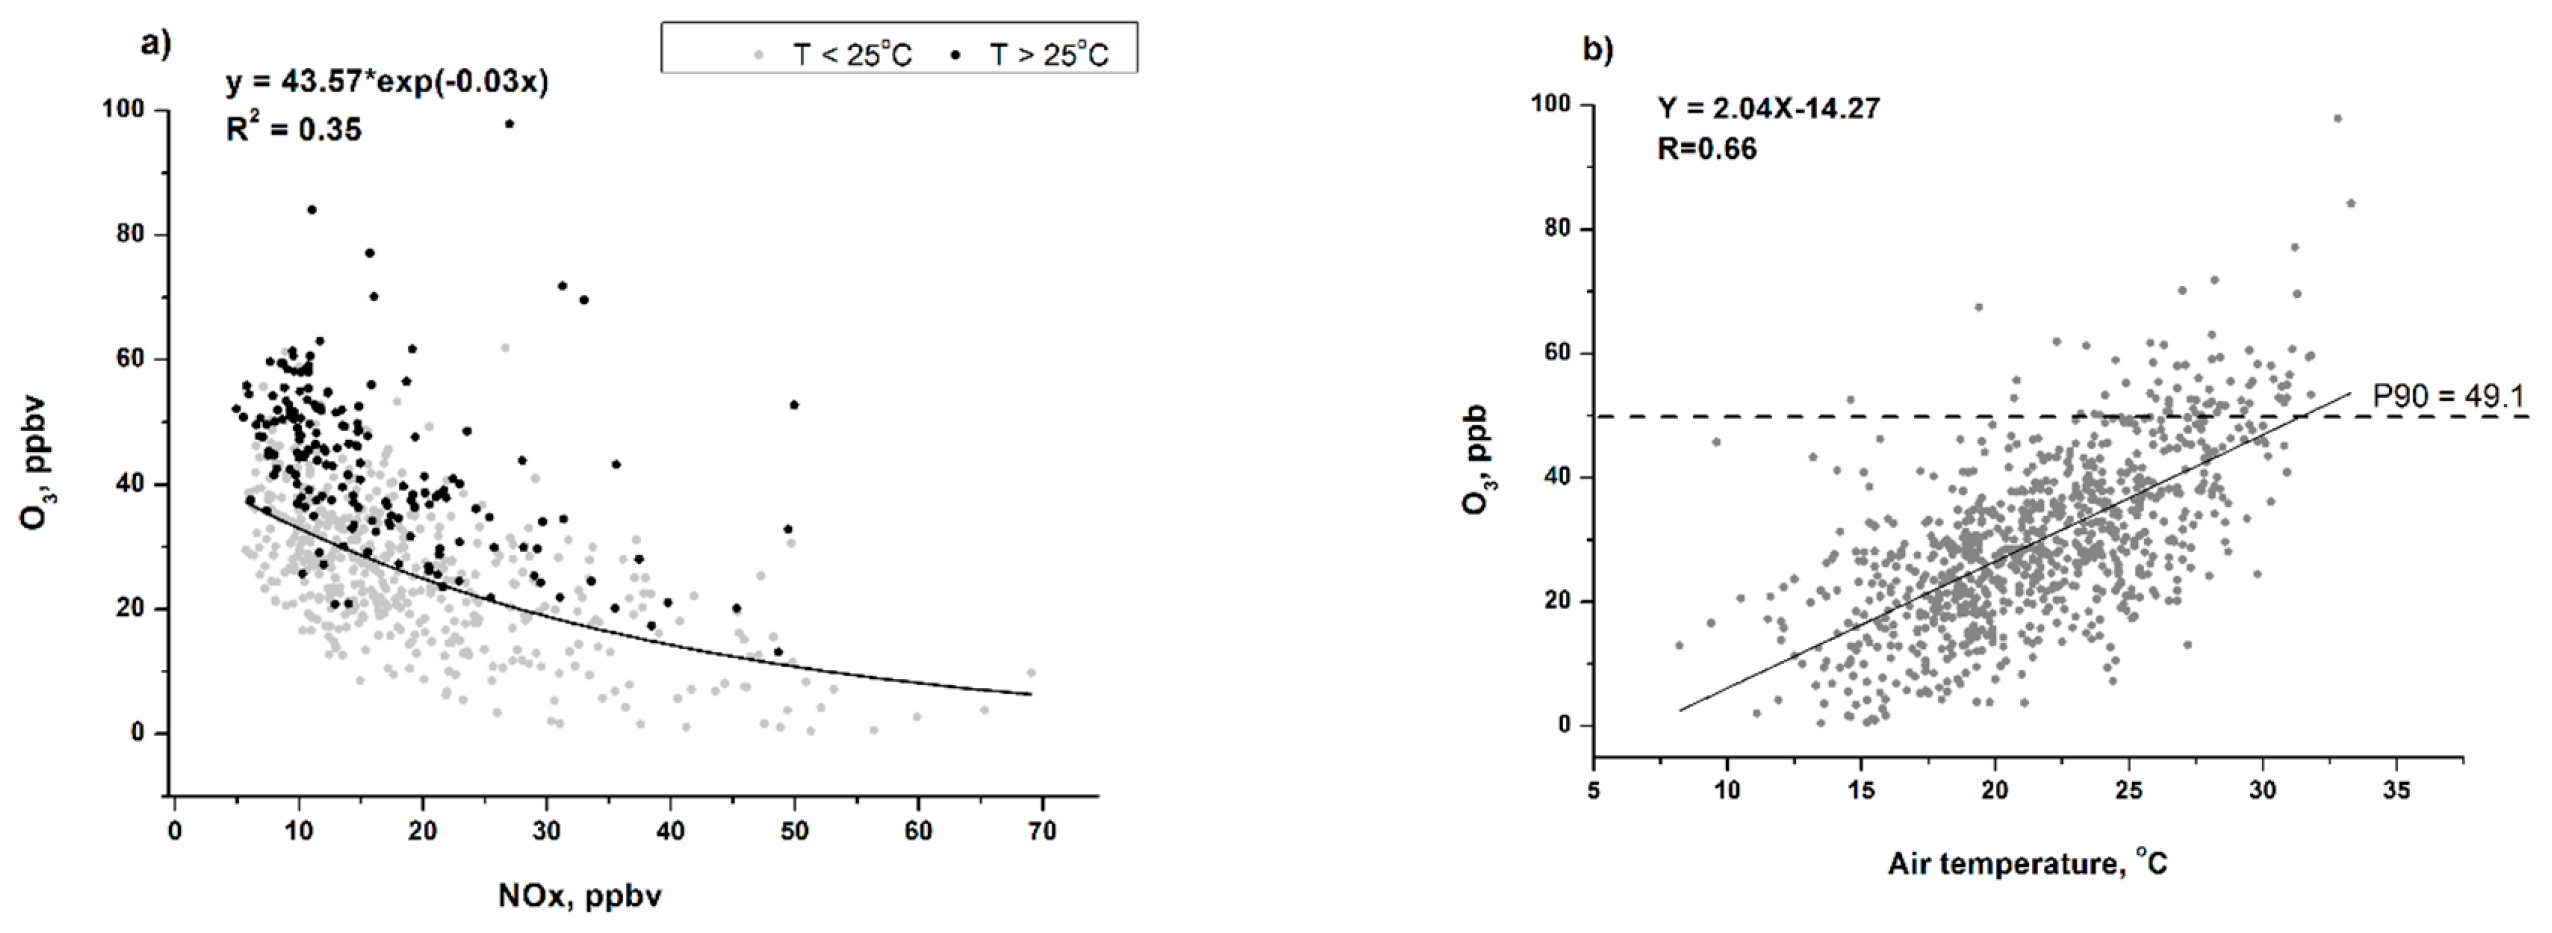
3.2. Ozone Generation in Moscow

Although mean daytime summer O3 concentration at the MSU-IAP was ~30 ppbv (Figure 7), about 5% of the observed hourly mean ozone mixing ratios exceeded 80 ppbv, marking severe pollution events in Moscow under favorable weather conditions.
According to Figure 8, ground-level O3 mixing ratios decreased with increasing NOx, which is typical for VOC-sensitive urban conditions [5,6]. Since the ozone photochemical production rate depends strongly on temperature (Figure 8b), the highest O3 concentrations were observed at air temperatures >25 °C under low-NOx conditions (Figure 8a).
According to the authors of [10], efficiency of ozone photochemical production depends on the relationship between VOCs and NOx, with an increase in the VOCs/NOx causing an increase in O3 production per NOx molecule and, consequently, to an increase in O3 ground level concentration. Such behavior is clearly evidenced from our data (Figure 9), showing an ozone production efficiency value ranging from 1 to 6 ppb O3 per mol NOx based on all summertime measurements.

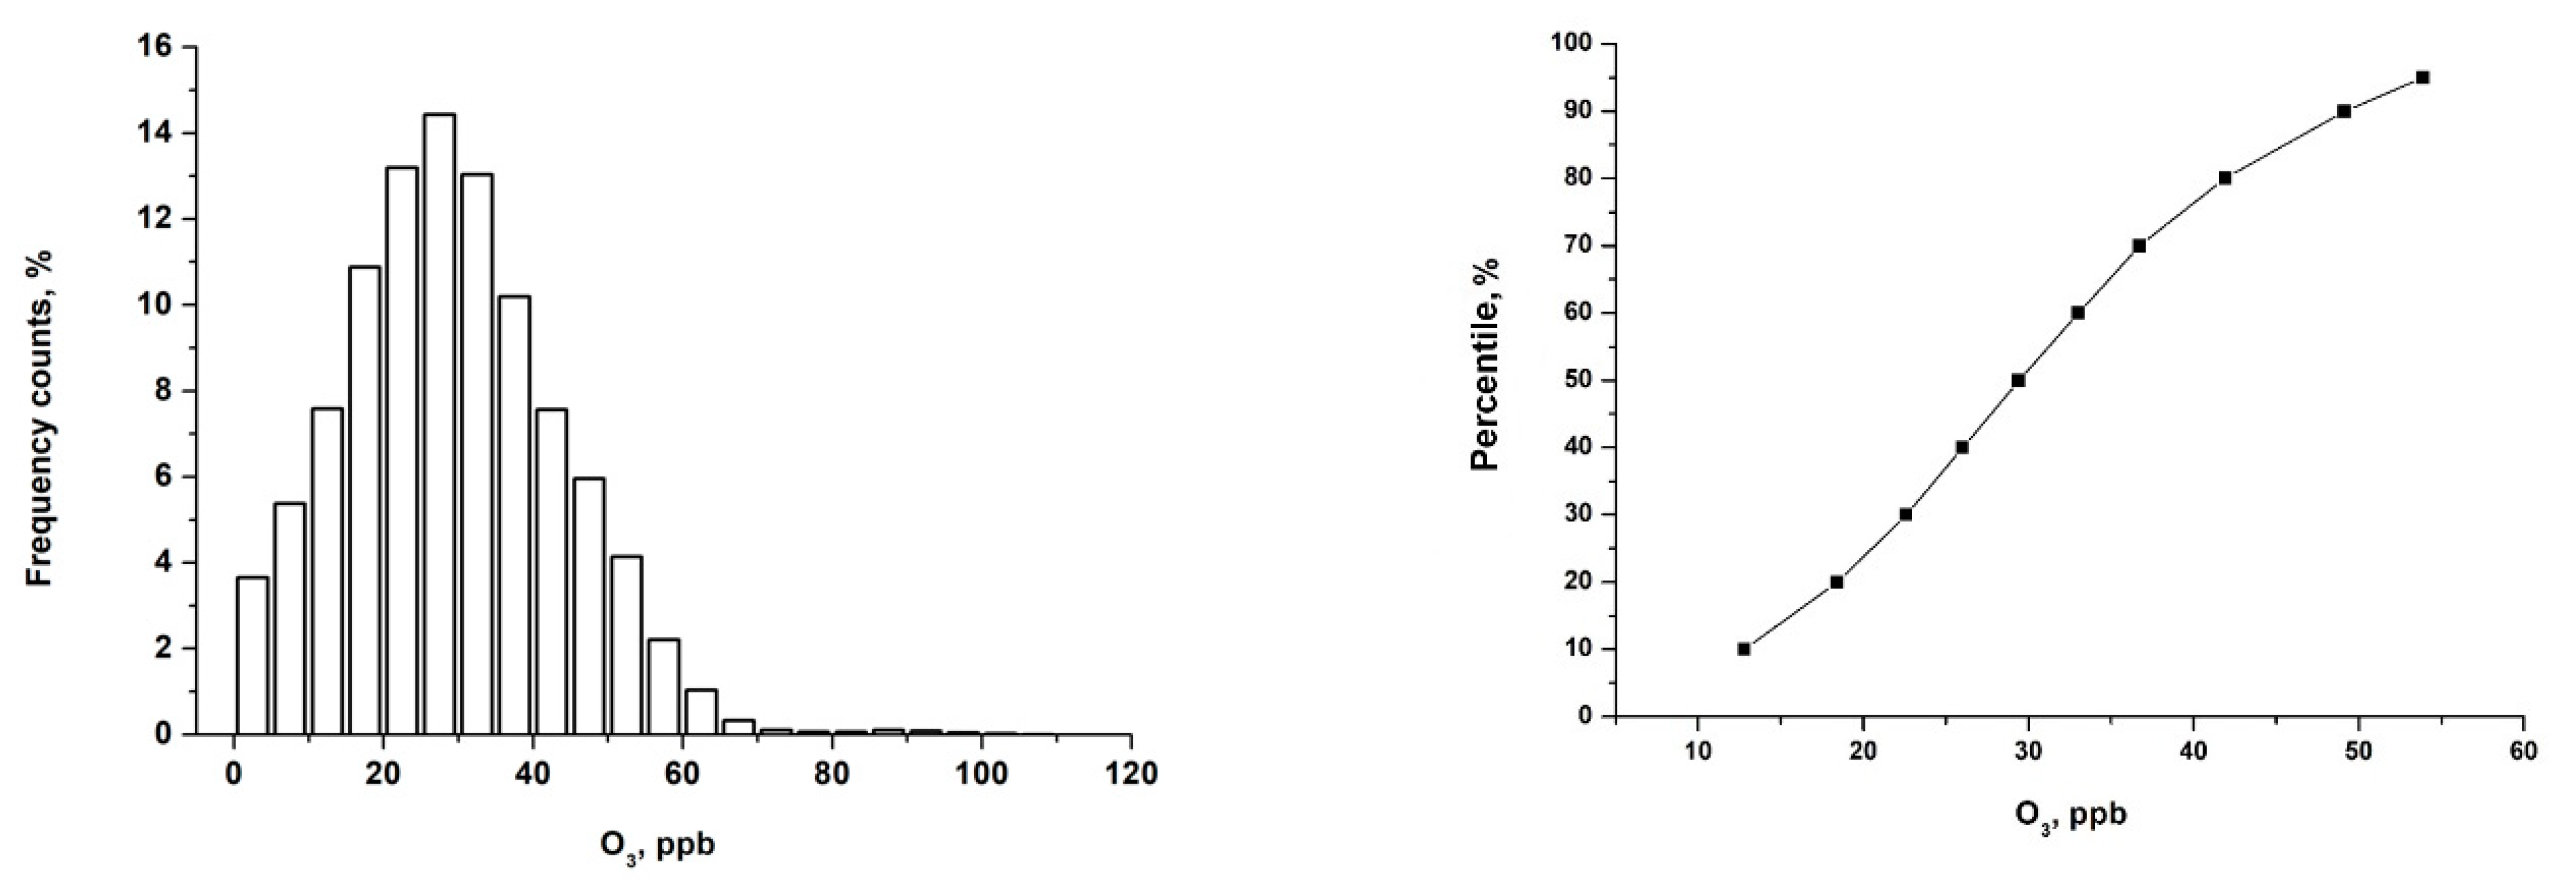
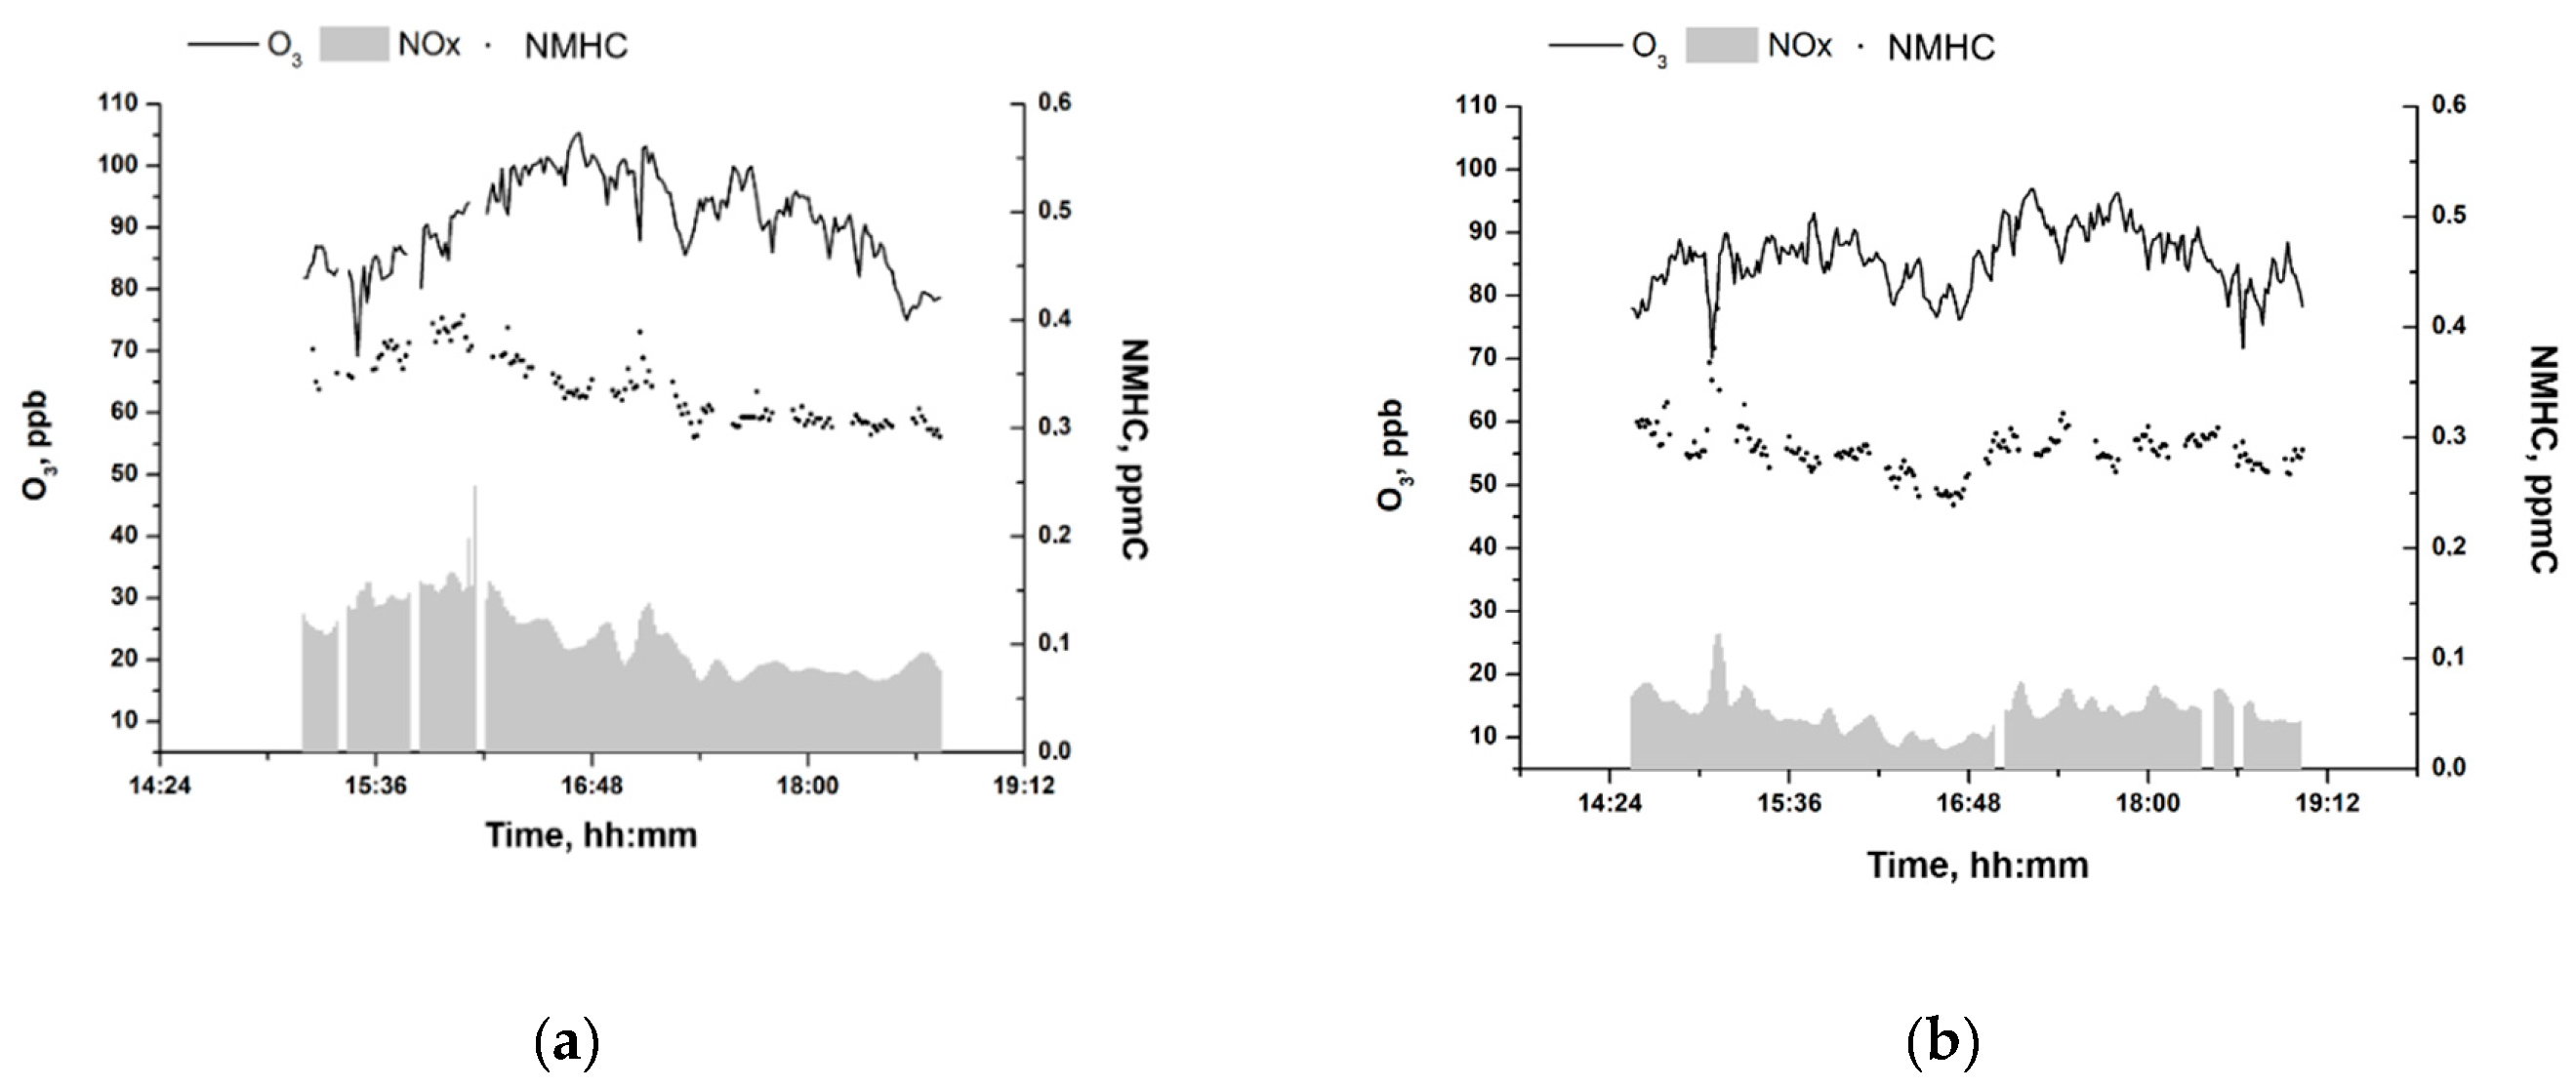
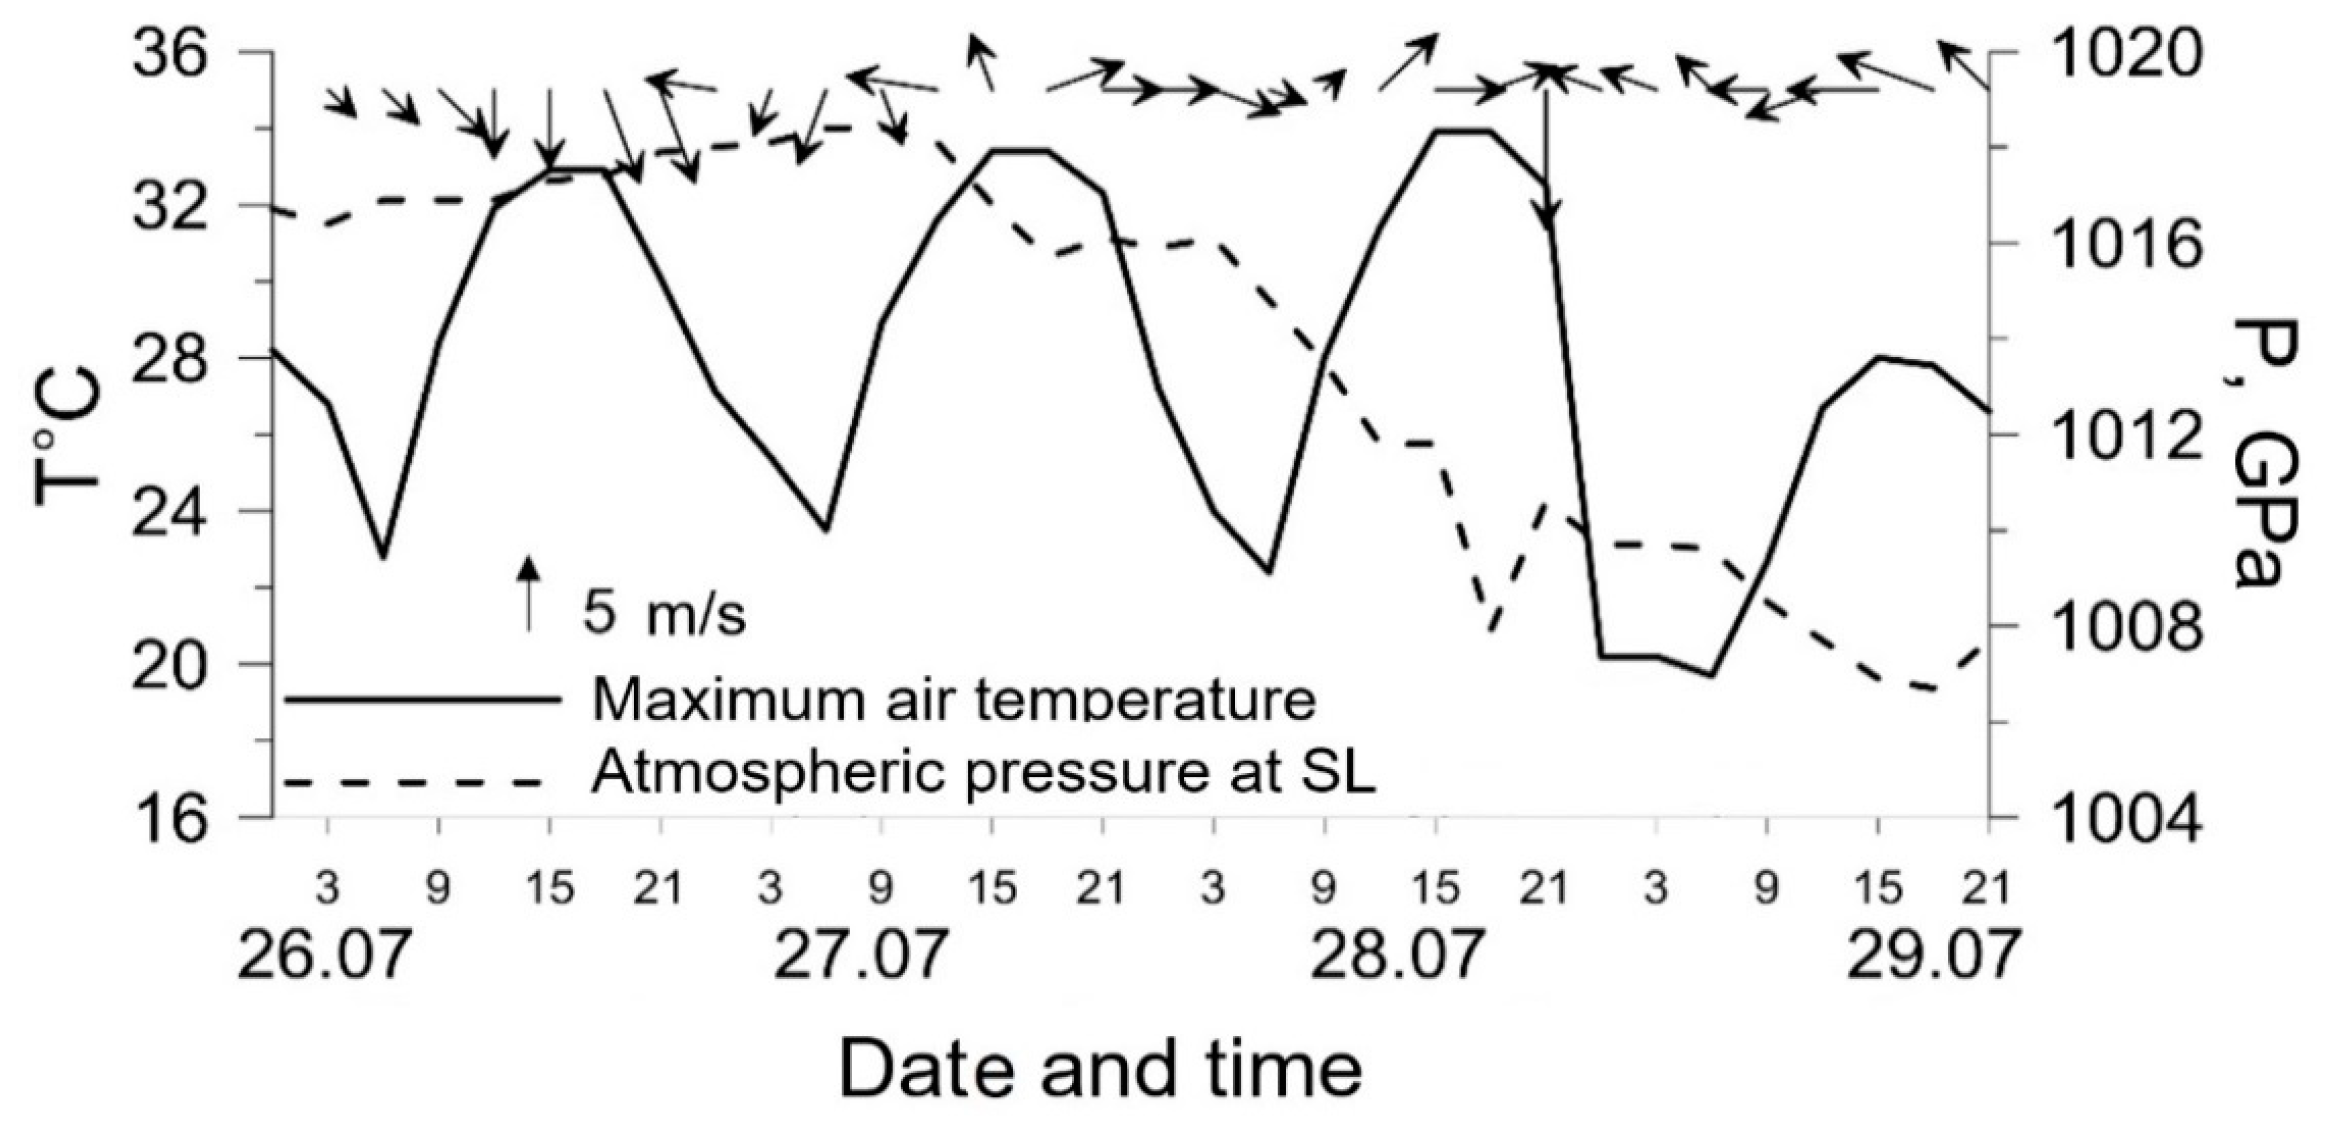
3.3. High O3 Episodes in Moscow

In summer 2011, two high O3 concentration episodes at the MSU-IAP site were observed, these were from the 27 July (3–5 p.m. LT) and 28 July (2–5 p.m. LT) pollution events. In these events, hourly O3 mixing ratios exceeded 80 ppbv, which is well above the short-time MAC value (Figure 10).
Both episodes were observed in the period of hot weather (daytime air temperature >30 °C). During the first episode (27.07), the daytime O3 mixing ratio increased stably and peaked at 4–5 p.m. LT whereas the observed non-methane hydrocarbons (NMHC) and NOx mixing ratios increased along with O3 until 4 p.m. LT with a subsequent decrease throughout late afternoon. During the second episode (28.07), a simultaneous increase in O3 with a decrease in NMHC and NOx, changed by some outliers, in the concentration graphs of all compounds was observed (Figure 10, right graph) from 3:30 to 5 p.m. LT.
According to the meteorological data (Figure 11), in July 2011 there was hot and dry weather because of strong anticyclonic conditions. From 27 to 28 July, the anticyclone decayed, which was accompanied by the respective drop in atmospheric pressure. In the evening (6–9 p.m. LT), thunderstorms with heavy rain (about 14 mm of precipitations) and squall winds were observed, accompanied by a change in wind direction from west to east.
The observed drop in the concentrations of the species at 28 July.2011 is assumed to be connected with the change in the weather conditions and ventilation of the boundary layer through the passage of the front system.
Some studies reported that daytime NMHC/NOx ratios lower than 10 are associated to VOC-sensitive ozone production regimes whereas daytime NMHC/NOx ratios greater than 20 correspond to NOx-sensitive ozone photochemistry [10,12]. Figure 12 shows that during the first high ozone episode, the NMHC/NOx ratio was in the range of 10–20, which points to photochemical ozone production. During the second episode, O3 was produced mainly in NOx-sensitive (~in 80% of cases) and transitional (~in 20% of cases) regimes.
There was no significant increase in the concentrations of VOCs measured on 27 and 28 July 2011 compared to that of other days of the month, except for two compounds: acetone and acetic acid (Figure 13). During the high ozone episodes, acetone, acetic acid, and isoprene concentrations exceeded their averages in July 2011 by 5.0, 4.6, and 0.3 ppbv, respectively. Acetone and acetic acid can be both biogenic and anthropogenic. This is confirmed by the high Spearman’s correlation of these compounds with biogenic isoprene (Rs = 0.7–0.8), 2-methyl-3-buten-2-ol (MBO) (Rs = 0.8–0.9), and anthropogenic benzene (Rs = 0.5–0.6) according to our data.

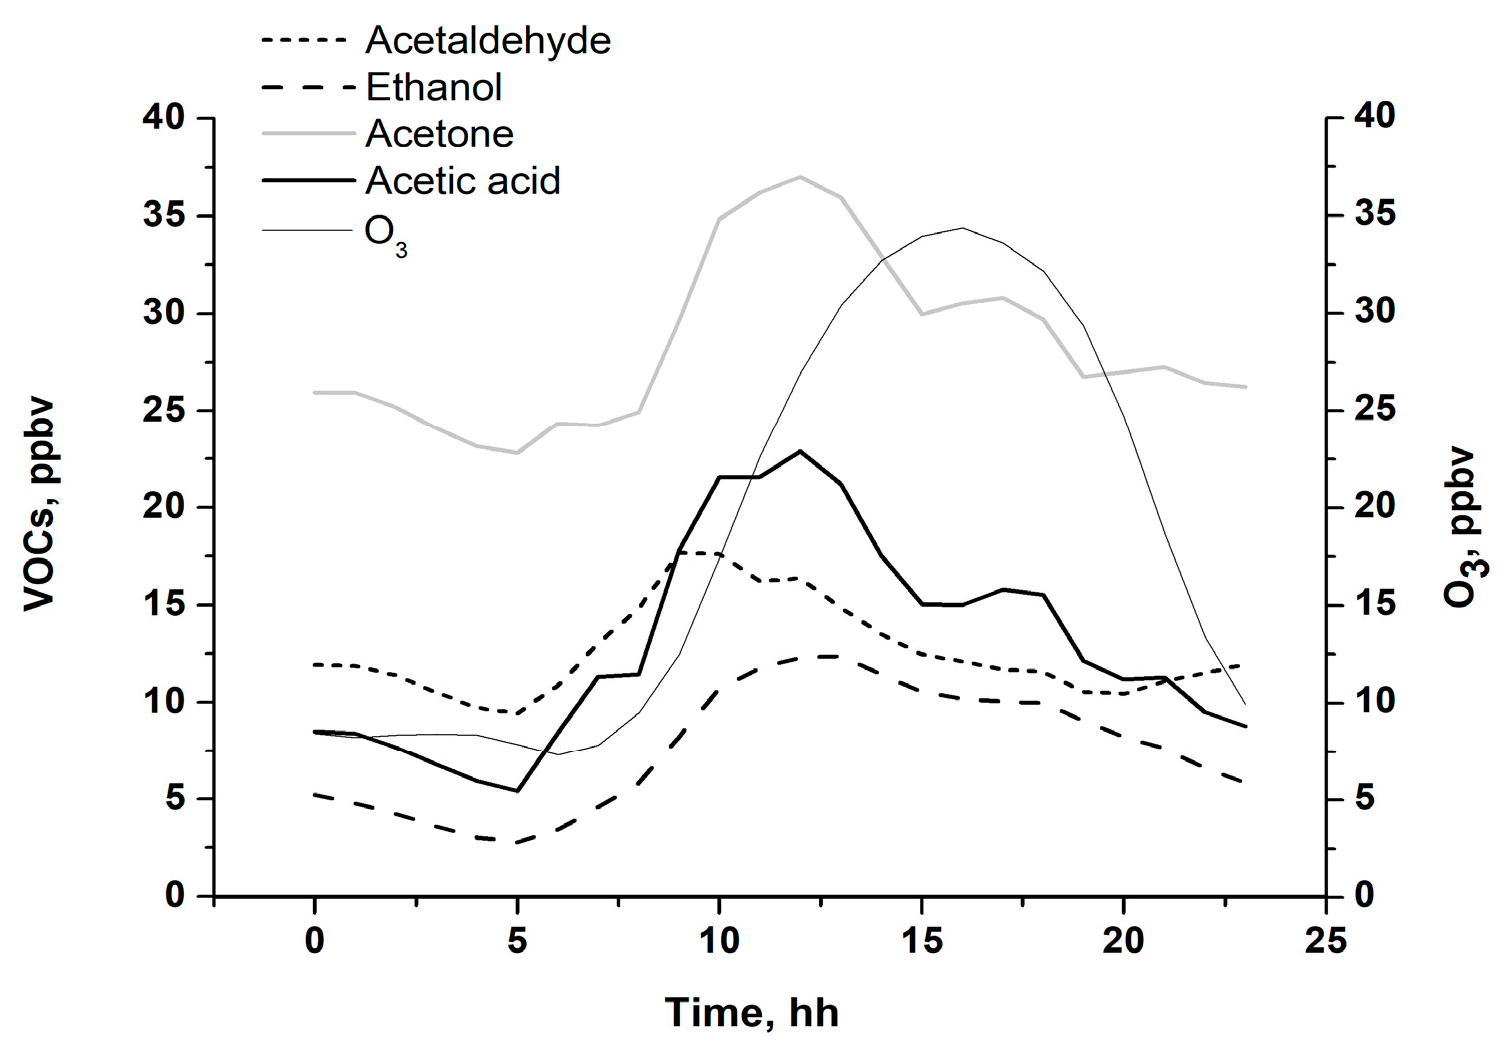
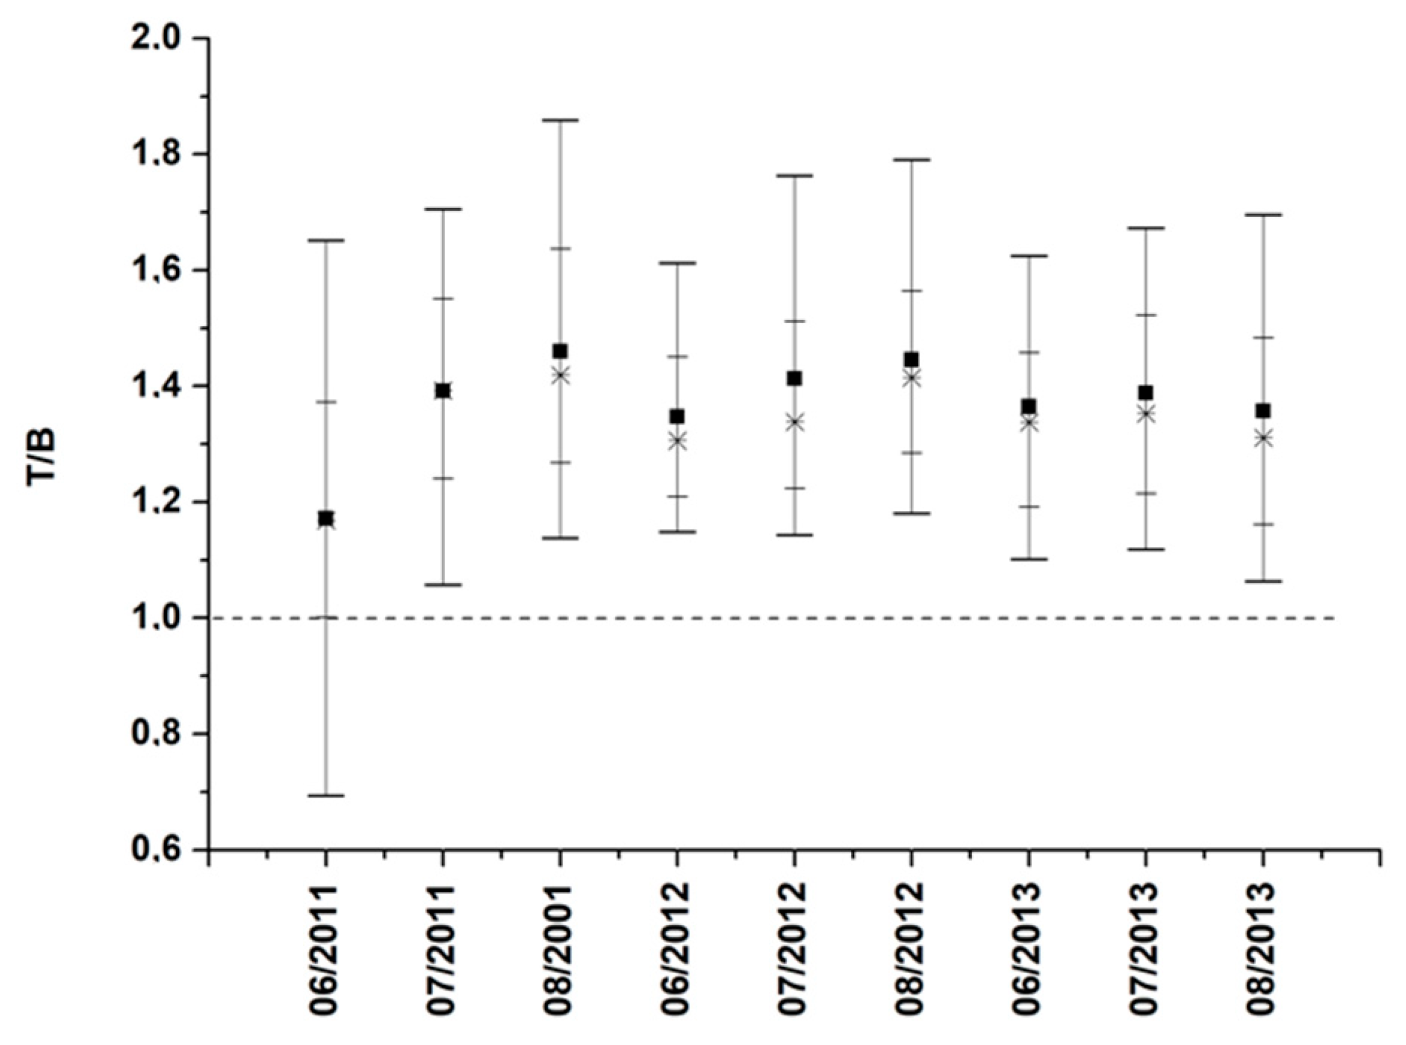
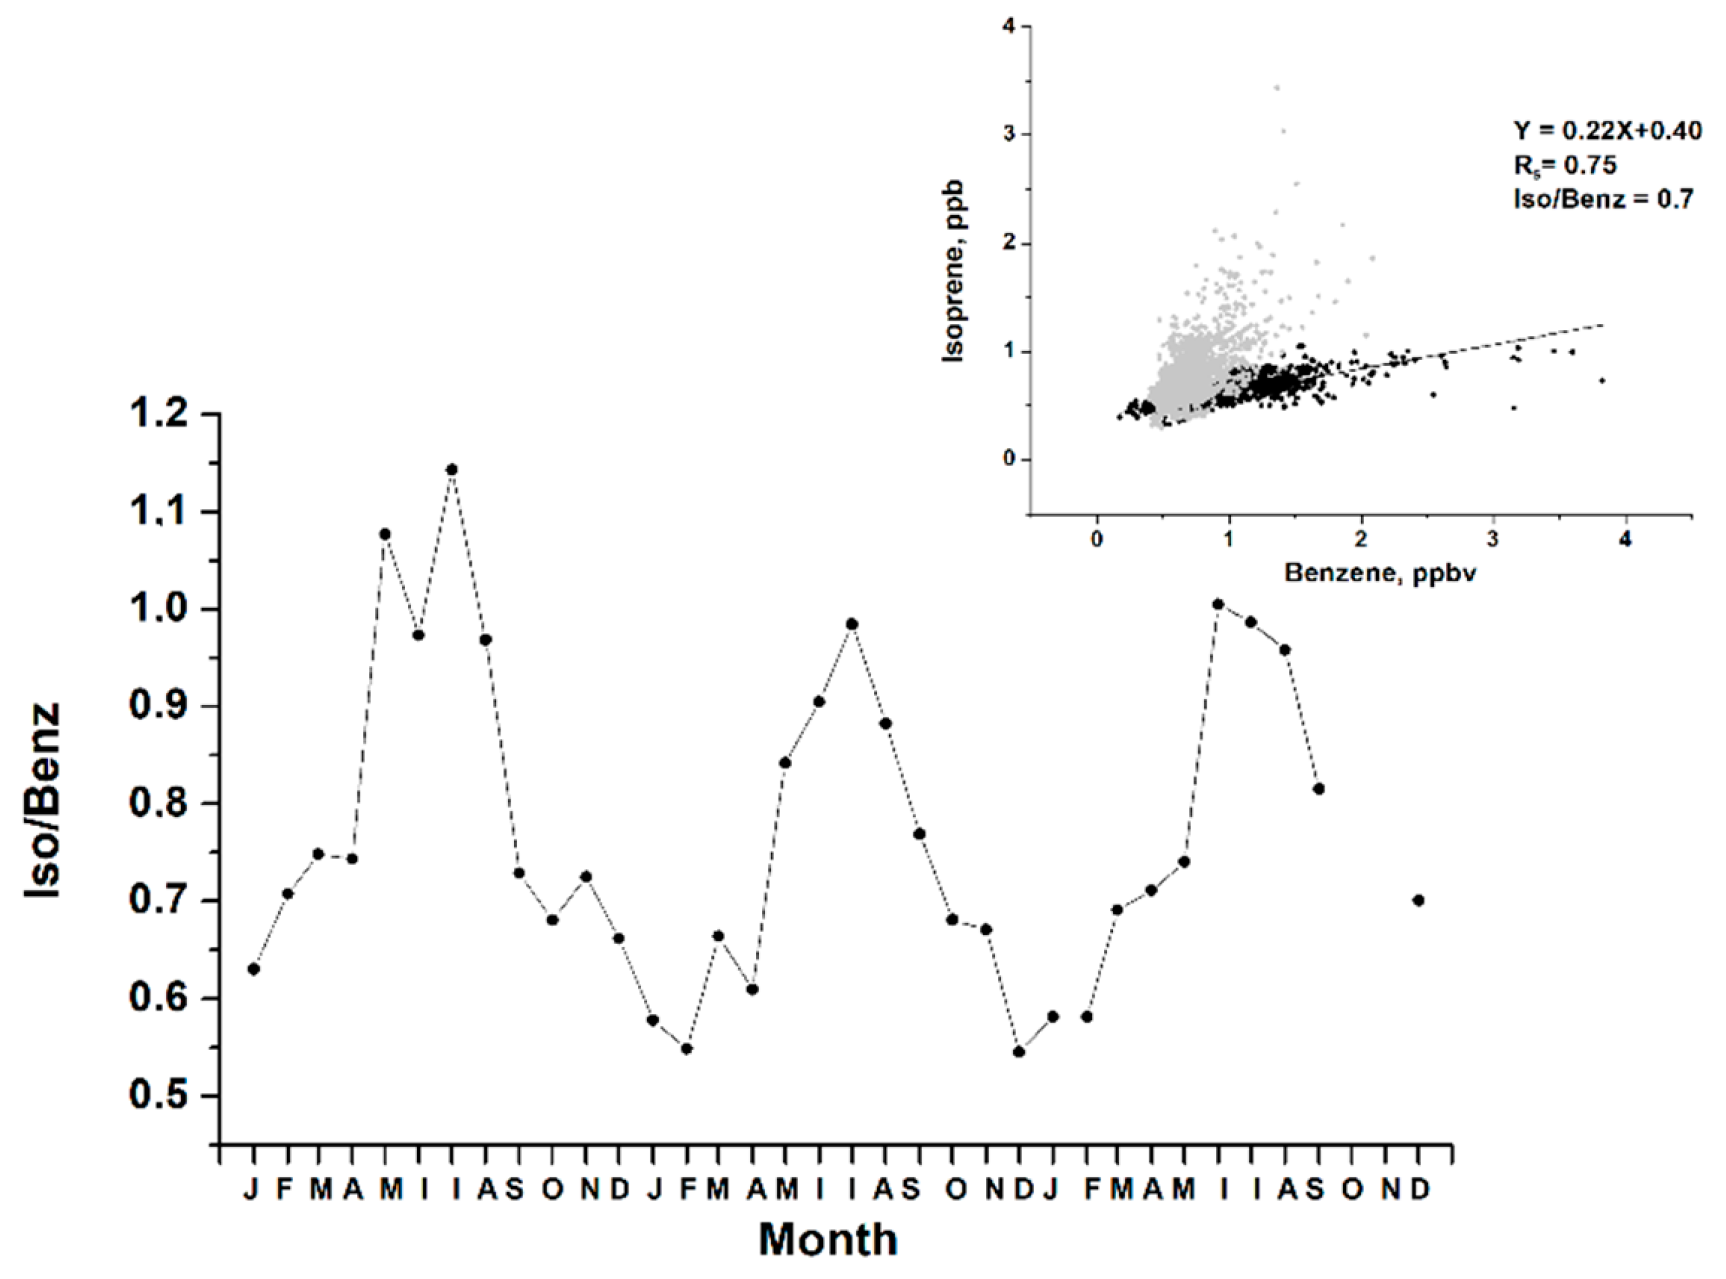
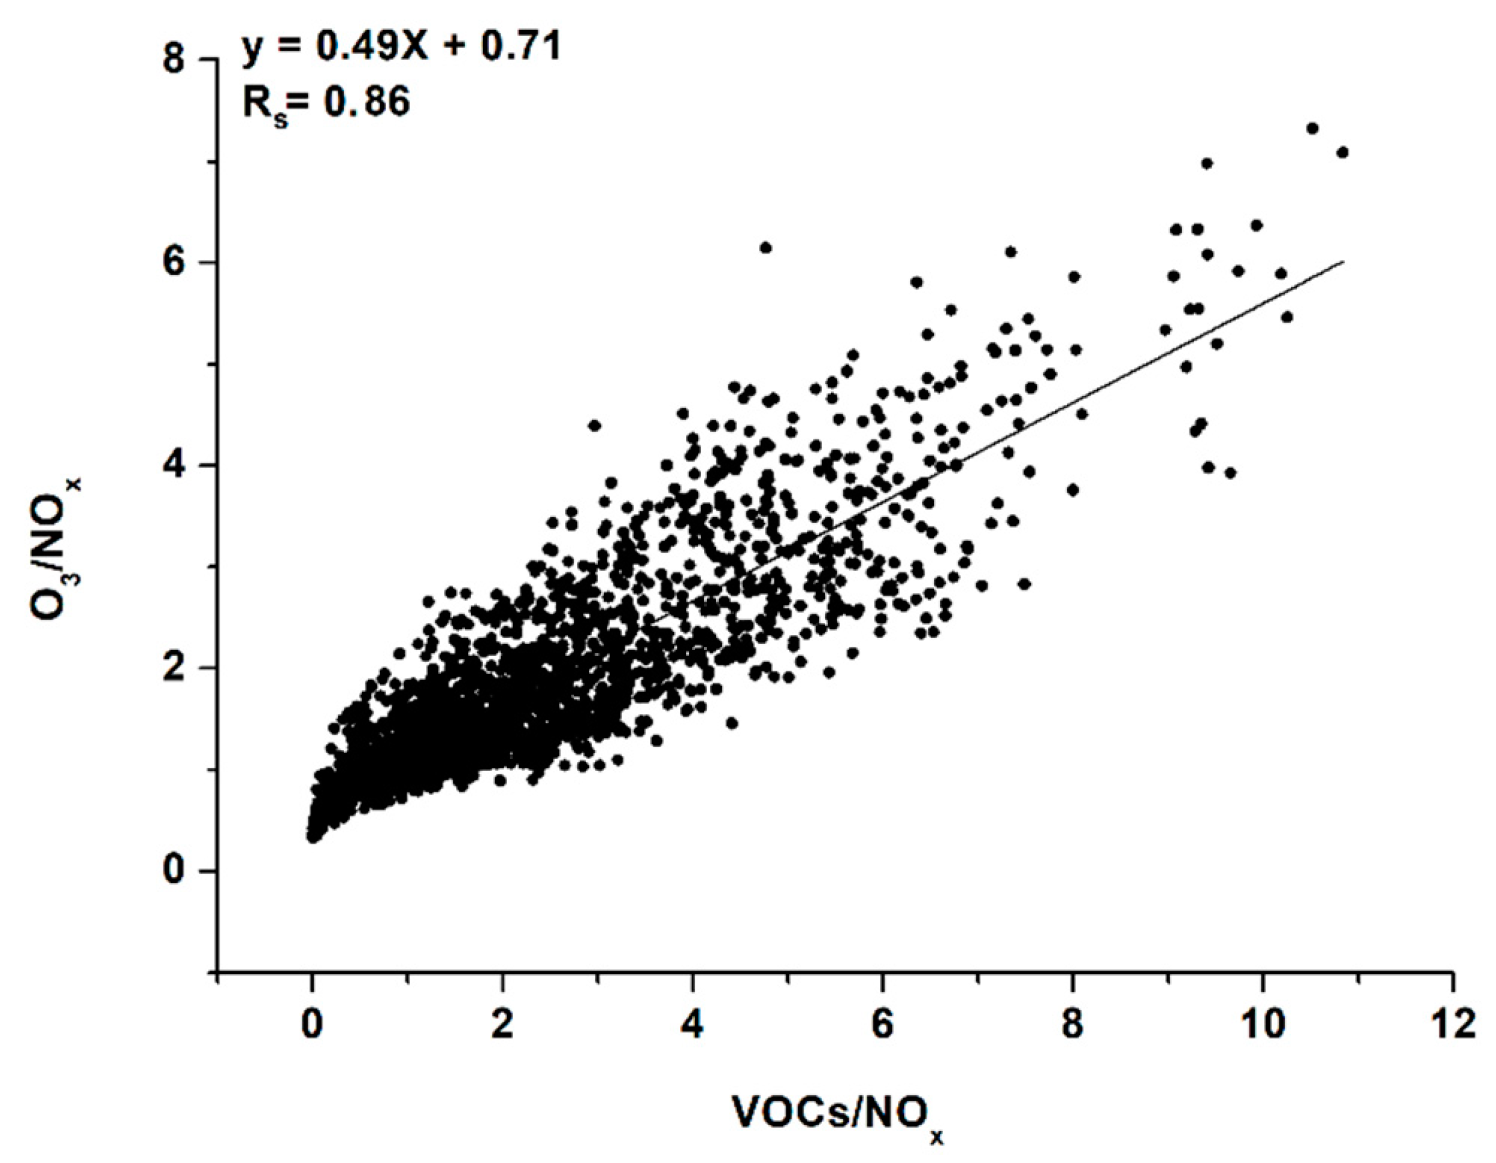
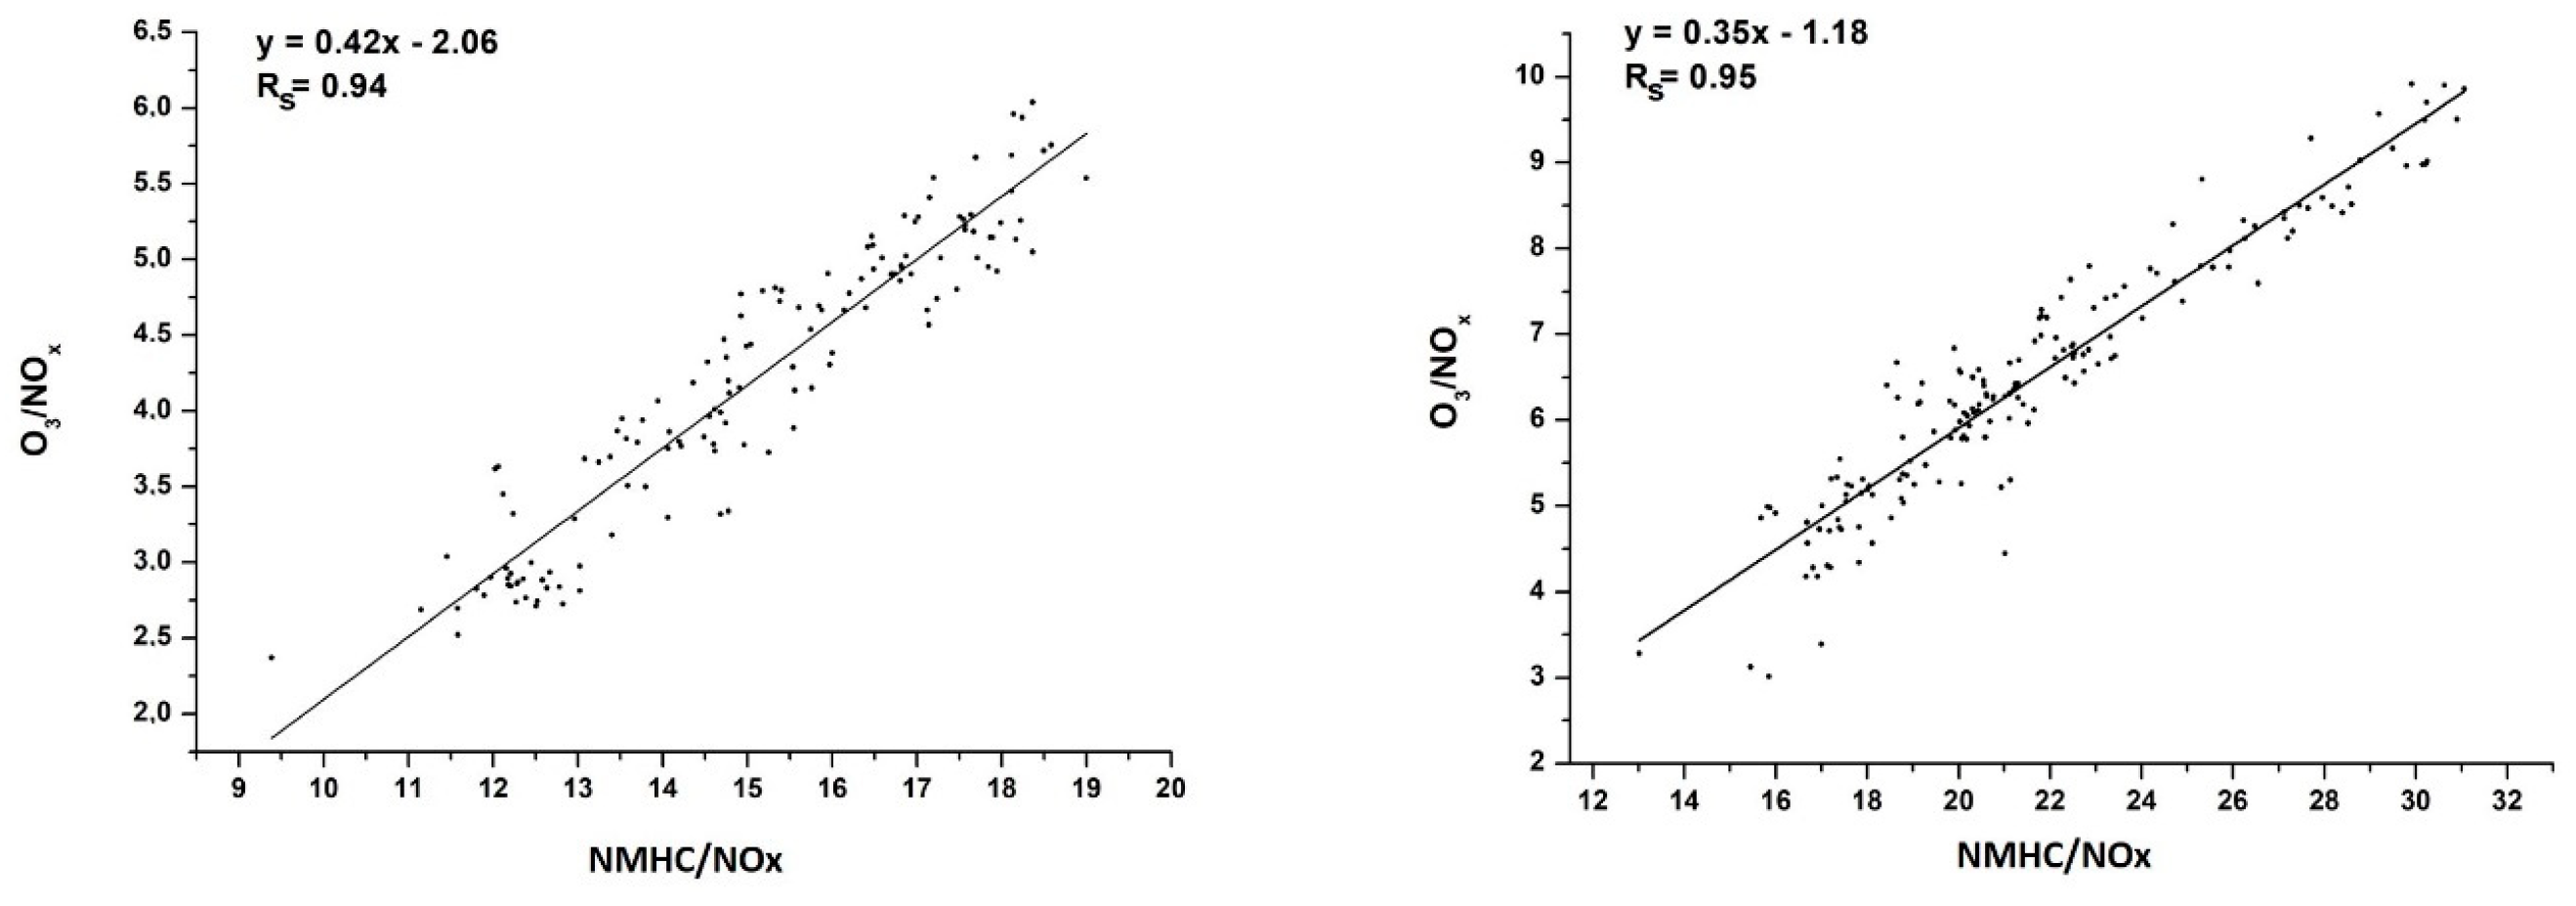
3.4. VOCs Impact on O3 Generation in Moscow

To estimate the impact of the measured VOCs on ground-level ozone production in Moscow, we employed the widely used quantity, ozone-forming potential (OFP) [49]:
OFP [ μ g / m 3 ] = C VOC × MIR VOC ,
where CVOC is a VOC concentration having the dimension of μg/m3 and MIRVOC is a maximum incremental reactivity, a dimensionless quantity defined as grams of O3 produced per gram of the VOC [50]. The method allows for estimating the maximum ozone concentration produced from the chemical destruction of the given VOC based on predefined MIRVOC values.
For all the measured VOCs in Moscow during the summers of 2011–2013, the OFP values did not exceed 115 μg/m3 for 90% of the measurement time (Figure 14), with the highest OFP values observed during the summer of 2011 (mean 67.3 μg/m3, 90-th percentile 103 μg/m3). Acetaldehyde, 1.3-butadiene, and isoprene were found to play the leading roles in O3 generation, whereas benzene, styrene, phenol, and monoterpenes made a minor contribution to O3 formation in the city (Table 3 and Table 4).
During the high July 2011 ozone events, the 90th percentile of OFPs for the total observed VOCs reached 110–136 μg/m3 (55–68 ppbv), with acetaldehyde (42–60 μg/m3 in 90% of cases) and 1.3-butadien (16–19 μg/m3 in 90% of cases) making the highest contribution to ozone generation. At the same time, the estimated inputs of acetone, acetic acid, and isoprene, which increased during the high O3 episodes (Figure 13), to ozone production were about 2 times less than that of acetaldehyde and 1.3-butadien. The highest O3 production was found during the first episode on 27 July, when the anticyclonic meteorological conditions were not yet changed, as those changes took place during the second episode.
Thus, the total contribution of all the measured VOCs to daytime ozone levels in Moscow was found to be significant in hot and calm weather conditions. O3 production from VOCs was 31–67 μg/m3 on average and in 10% of cases exceeded 100 μg/m3. Anticyclonic conditions with high air temperature (above 30 °C), low cloud cover, and low wind speeds led to active ozone generation in the presence of local pollution sources and resulted in near-surface day-time ozone mixing ratios exceeding hazardous levels (OFPs from total VOCs was about 100–122 μg/m3 on average and were higher than 136 in 10% of calculations).

4. Conclusions

The detailed analysis of ground-level O3 and its precursors measured at the MSU-IAP site located in the southwestern part of Moscow (about 8 km away from the city center) showed the highest O3 to be in the daytime warm periods of the observation period. The O3 mixing ratio increased monotonically from early morning, reaching its maximum value of 34 ppbv (sample mean) at ~4 p.m. LT. However, anticyclonic meteorological conditions with high air temperatures (above 25 °C) and low wind speeds (2–3 m/s) contributed to O3 reaching a hazardous level (up to 105 ppbv or 210 μg/m3) in the city.
Diurnal variations of anthropogenic O3 precursors, NOx, CO, and benzene, were opposite to that of ozone, showing a stable decrease from their morning peak values at 8 a.m. to late afternoon minimums at 5-6 p.m. LT. The observed diurnal variability of the above species can be explained by changes in vertical mixing intensity in the course of the day. Additionally, chemical distraction of the primary emitted VOCs, with the benzene as an example, could contribute to their daytime decrease, accompanied by significant accumulation of O3 and other secondary pollutants. The maximum O3 production rate was observed during the late morning hours (10–12 a.m. LT) which coincided markedly with diurnal peaks in a number of the most abundant secondary VOCs (acetaldehyde, acetone, and acetic acid). The origin of the observed late morning maximum of the above species could be attributed to both photochemical oxidation of primary emitted VOCs after sunrise and entrainment of partially oxidized products from the upper layers under development of the convective boundary layer. The high positive relationships of acetaldehyde, ethanol, acetone, and acetic acid with each other (Rs = 0.6–0.9) and with the products of isoprene oxidation, MVK and MACR, (Rs = 0.7–0.8) and no correlation with CO and NOx confirmed the significant role of photochemistry in the production of these VOCs in the city along with their primary sources. The positive correlation of daytime O3 (Rs = 0.5) with secondary VOCs affirmed an important role of photochemical O3 production in Moscow during the summers of 2011–2013.
The toluene to benzene ratio (T/B), which can serve as an indicator of vehicle pollution as well as air chemical aging, suggested that the dominant anthropogenic VOCs source in Moscow was local vehicle emissions. The non-linear O3–NOx dependence showed a decrease in ground-level O3 with am increase in NOx, which is typical for the VOC-sensitive photochemical regime of O3 formation in Moscow. Increase in the VOCs/NOx ratio caused an increase in O3 production of the NOx molecule and, consequently, to an increase in ground-level O3 concentration. The NMHC/NOx ratio calculated for the elevated ozone episodes in July 2011 showed that O3 was mainly generated in the conditions of transitional and NOx-sensitive photochemical regimes.
The concentrations of the biogenic VOCs isoprene and monoterpenes were 0.73 ppbv and 0.53 ppbv, respectively, on average. Their diurnal variations were poorly distinguished, which may have been due to the mainly southwest and west winds blowing from the roads and limited vegetation area. The high positive relationship of isoprene (Rs= 0.7) with the vehicle exhaust tracer benzene in the summer daytime hours pointed to the impact of anthropogenic isoprene on the data. The calculated nighttime winter isoprene/benzene ratio showed that about 5% of the daytime summer isoprene in Moscow was anthropogenic.
For all the measured VOCs in Moscow from 2011to 2013, OFP values did not exceed 115 μg/m3 in 90% of the whole observation period. The highest OFPs were found in 2011 and 2012 (67.3 μg/m3 on average and did not exceed 103 μg/m3 in 90% of cases). The lowest O3 formation was found in 2013 (31.3 μg/m3 on average and did not exceed 44.3 μg/m3 in 90% of cases). Acetaldehyde, 1.3-butadiene, and isoprene played the leading roles in O3 generation (9.6–20.4 μg/m3 in average). Benzene, styrene, phenol, and monoterpenes made less of a contribution to O3 formation in the city (0.3–0.9 μg/m3 in average). Anticyclonic conditions catalyzed active generation of ground-level O3 in polluted urban air (OFPs from total VOCs was about 100–122 μg/m3 on average and were higher than 136 μg/m3 in 10% of calculations).

Supplementary Materials

The following are available online at https://www.mdpi.com/2073-4433/11/11/1262/s1. Figure S1: Frequency distribution of some atmospheric compounds in Moscow (summers of 2011–2013).

Author Contributions

All authors contributed to the original draft preparation of the manuscript; I.B.B., V.A.B. and N.F.E. conceived and designed the experiments; E.V.B., K.B.M. and N.V.P. contributed to the data analysis; K.B.M. and A.I.S. provided project administration and revised the whole manuscript. All authors have read and agreed to the published version of the manuscript.

Funding

This work was funded by the Russian Foundation for Basic Research (grants # 18-35-20031 (VOCs impact on O3 generation in cities) and #19-05-50088 (transformation of polluting gases in Moscow)).

Acknowledgments

The authors acknowledge the colloquies with the MSU meteorological observatory for provision of meteorological data.

Conflicts of Interest

The authors declare no conflict of interest.

References

  1. Lefohn, A.S.; Malley, C.S.; Smith, L.; Wells, B.; Hazucha, M.; Simon, H.; Naik, V.; Mills, G.; Schultz, M.G.; Paoletti, E.; et al. Tropospheric ozone assessment report: Global ozone metrics for climate change, human health, and crop/ecosystem research. Elem. Sci. Anth. 2018, 6, 1–28. [Google Scholar] [CrossRef] [Green Version]
  2. Manisalidis, I.; Stavropoulou, E.; Stavropoulos, A.; Bezirtzoglou, E. Environmental and Health Impacts of Air Pollution: A Review. Front. Public Health 2020, 8, 14. [Google Scholar] [CrossRef] [PubMed] [Green Version]
  3. Seinfeld, J.H. Chemistry of Ozone in The Urban and Regional Atmosphere. In Conical Intersections; World Scientific Publishing Co Pte Ltd.: Singapore, 1995; Volume 3, pp. 34–57. [Google Scholar]
  4. Thielmann, A.; Grüebler, F.C.; Prévôt, A.S.H.; Staehelin, J. Empirical ozone isopleths as a tool to identify ozone production regimes. Geophys. Res. Lett. 2001, 28, 2369–2372. [Google Scholar] [CrossRef]
  5. Bowman, F.M.; Seinfeld, J.H. Ozone productivity of atmospheric organics. J. Geophys. Res. Space Phys. 1994, 99, 5309–5324. [Google Scholar] [CrossRef]
  6. Mazzuca, G.M.; Ren, X.; Loughner, C.P.; Estes, M.; Crawford, J.H.; Pickering, K.E.; Weinheimer, A.J.; Dickerson, R.R. Ozone production and its sensitivity to NOx and VOCs: Results from the DISCOVER-AQ field experiment, Houston 2013. Atmos. Chem. Phys. Discuss. 2016, 16, 14463–14474. [Google Scholar] [CrossRef] [Green Version]
  7. Sharma, A.; Sharma, S.K.; Rohtash; Mandal, T.K. Influence of ozone precursors and particulate matter on the variation of surface ozone at an urban site of Delhi, India. Sustain. Environ. Res. 2016, 26, 76–83. [Google Scholar] [CrossRef] [Green Version]
  8. Chang, C.-Y.; Faust, E.; Hou, X.; Lee, P.; Kim, H.C.; Hedquist, B.C.; Liao, K.-J. Investigating ambient ozone formation regimes in neighboring cities of shale plays in the Northeast United States using photochemical modeling and satellite retrievals. Atmos. Environ. 2016, 142, 152–170. [Google Scholar] [CrossRef]
  9. Karl, T.; Graus, M.; Striednig, M.; Lamprecht, C.; Hammerle, A.; Wohlfahrt, G.; Held, A.; Von Der Heyden, L.; Deventer, M.J.; Krismer, A.; et al. Urban eddy covariance measurements reveal significant missing NOx emissions in Central Europe. Sci. Rep. 2017, 7, 1–9. [Google Scholar] [CrossRef] [Green Version]
  10. Sillman, S. The relation between ozone, NOx and hydrocarbons in urban and polluted rural environments. Atmos. Environ. 1999, 33, 1821–1845. [Google Scholar] [CrossRef]
  11. Goldberg, D.L.; Vinciguerra, T.P.; Anderson, D.C.; Hembeck, L.; Canty, T.P.; Ehrman, S.H.; Martins, D.K.; Stauffer, R.M.; Thompson, A.M.; Salawitch, R.J.; et al. CAMx Ozone Source Attribution in the Eastern United States using Guidance from Observations during DISCOVER-AQ Maryland. Geophys. Res. Lett. 2016, 43, 2249–2258. [Google Scholar] [CrossRef] [Green Version]
  12. Jin, X.; Fiore, A.M.; Murray, L.T.; Valin, L.C.; Lamsal, L.N.; Duncan, B.; Boersma, K.F.; De Smedt, I.; Abad, G.G.; Chance, K.; et al. Evaluating a Space-Based Indicator of Surface Ozone-NOx-VOC Sensitivity Over Midlatitude Source Regions and Application to Decadal Trends. J. Geophys. Res. Atmos. 2017, 122, 10–439. [Google Scholar] [CrossRef] [PubMed]
  13. Duan, J.; Tan, J.; Yang, L.; Wu, S.; Hao, J. Concentration, sources and ozone formation potential of volatile organic compounds (VOCs) during ozone episode in Beijing. Atmos. Res. 2008, 88, 25–35. [Google Scholar] [CrossRef]
  14. Guo, H.; Lyu, X.; Cheng, H.; Ling, Z.; Guo, H. Overview on the spatial–temporal characteristics of the ozone formation regime in China. Environ. Sci. Process. Impacts 2019, 21, 916–929. [Google Scholar] [CrossRef]
  15. Tan, Z.; Lu, K.; Jiang, M.; Su, R.; Dong, H.; Zeng, L.; Xie, S.; Tan, Q.; Zhang, Y. Exploring ozone pollution in Chengdu, southwestern China: A case study from radical chemistry to O3-VOC-NOx sensitivity. Sci. Total. Environ. 2018, 636, 775–786. [Google Scholar] [CrossRef]
  16. Thielmann, A.; Prévôt, A.S.H.; Staehelin, J. Sensitivity of ozone production derived from field measurements in the Italian Po basin. J. Geophys. Res. Space Phys. 2002, 107, 8194. [Google Scholar] [CrossRef]
  17. Ren, X.; Van Duin, D.; Cazorla, M.; Chen, S.; Mao, J.; Zhang, L.; Brune, W.H.; Flynn, J.; Grossberg, N.; Lefer, B.L.; et al. Atmospheric oxidation chemistry and ozone production: Results from SHARP 2009 in Houston, Texas. J. Geophys. Res. Atmos. 2013, 118, 5770–5780. [Google Scholar] [CrossRef]
  18. Xue, L.K.; Wang, T.; Gao, J.; Ding, A.; Zhou, X.H.; Blake, D.R.; Wang, X.F.; Saunders, S.M.; Fan, S.J.; Zuo, H.C.; et al. Ozone production in four major cities of China: Sensitivity to ozone precursors and heterogeneous processes. Atmos. Chem. Phys. Discuss. 2013, 13, 27243–27285. [Google Scholar] [CrossRef]
  19. Elansky, N.F. Impurities in the atmosphere of continental Russia. Priroda 2002, 2, 32–43, [In Russian]. [Google Scholar]
  20. Elansky, N.; Lokoshchenko, M.A.; Trifanova, A.V.; Belikov, I.B.; Ckorokhod, A.I. On Contents of Trace Gases in the Atmospheric Surface Layer over Moscow. Izv. Atmos. Ocean. Phys. 2015, 51, 39–51. [Google Scholar] [CrossRef]
  21. Elanskii, N.F.; Belikov, I.B.; Golitsyn, G.S.; Grisenko, A.M.; Lavrova, O.V.; Pankratova, N.V.; Safronov, A.N.; Skorokhod, A.I.; Shumskii, R.A. Observations of the atmosphere composition in the Moscow megapolis from a mobile laboratory. Dokl. Earth Sci. 2010, 432, 649–655. [Google Scholar] [CrossRef]
  22. Gorchakov, G.I.; Semutnikova, E.G.; Isakov, A.A.; Kopeikin, V.M.; Karpov, A.V.; Kurbatov, G.A.; Ponomareva, T.Y.; Sokolov, A.V. The Moscow smoke haze of 2010: Extreme aerosol and gaseous air pollution of in the Moscow region. Atmos. Ocean. Opt. 2011, 24, 6, 452–458. [Google Scholar]
  23. Yurganov, L.N.; Rakitin, V.; Dzhola, A.; August, T.; Fokeeva, E.; George, M.; Gorchakov, G.; Grechko, E.; Hannon, S.; Karpov, A.; et al. Satellite- and ground-based CO total column observations over 2010 Russian fires: Accuracy of top-down estimates based on thermal IR satellite data. Atmos. Chem. Phys. Discuss. 2011, 11, 7925–7942. [Google Scholar] [CrossRef] [Green Version]
  24. Lokoshchenko, M.A.; Elansky, N.F.; Trifanova, A.V.; Belikov, I.B.; Skorokhod, A.I. Limiting levels of air pollution in Moscow. Vestn. Mosk. Univ. Geogr. 2016, 5, 29–39. [Google Scholar]
  25. Lokoshchenko, M.A.; Elanskii, N.F.; Malyashova, V.P.; Trifanova, A.V. Dynamics of the surface content of sulfur dioxide in Moscow. Atmos. Ocean. Opt. 2015, 21, 384–391. [Google Scholar]
  26. Causes and factors of positive anomalies of surface ozone in the Moscow region and the south-eastern coast of the Crimea. Atmos. Ocean. Opt. 2016, 29, 493–502. [CrossRef]
  27. GOST 17.2.3.01-86. Environmental Protection. Atmospheric Air. Residential Air Quality Control Regulations; USSR State Committee of Standards: Moscow, Russia, 1986. (in Russian) [Google Scholar]
  28. Elansky, N.F.; Lokoshchenko, M.A.; Belikov, I.B.; Skorokhod, A.I.; Shumskii, R.A. Variability of trace gases in the atmospheric surface layer from observations in the city of Moscow. Izv. Atmos. Ocean. Phys. 2007, 43, 219–231. [Google Scholar] [CrossRef]
  29. Elansky, N.F.; Belikov, I.B.; Berezina, E.V. Atmospheric Composition over Northern Eurasia: The TROICA Experiments; Agrospas: Moscow, Russia, 2009; pp. 73–90. [Google Scholar]
  30. Chubarova, N.Y. UV variability in Moscow according to long-term UV measurements and reconstruction model. Atmos. Chem. Phys. Discuss. 2008, 8, 3025–3031. [Google Scholar] [CrossRef] [Green Version]
  31. Nezval, E.I.; Chubarova, N.E. Long-term variability of UV radiation in the spectral range of 300–380 nm in Moscow. Russ. Meteorol. Hydrol. 2017, 42, 693–699. [Google Scholar] [CrossRef]
  32. Elansky, N.F.; Shilkin, A.V.; Ponomarev, N.A.; Semutnikova, E.G.; Zakharova, P.V. Weekly patterns and weekend effects of air pollution in the Moscow megacity. Atmos. Environ. 2020, 224, 117303. [Google Scholar] [CrossRef]
  33. Crutzen, P.J.; Elansky, N.F.; Hahn, M.; Golitsyn, G.S.; Brenninkmeijer, C.A.M.; Scharffe, D.H.; Belikov, I.B.; Maiss, M.; Bergamaschi, P.; Röckmann, T.; et al. Trace Gas Measurements Between Moscow and Vladivostok Using the Trans-Siberian Railroad. J. Atmos. Chem. 1998, 29, 179–194. [Google Scholar] [CrossRef]
  34. Monks, P.S. A review of the observations and origins of the spring ozone maximum. Atmos. Environ. 2000, 34, 3545–3561. [Google Scholar] [CrossRef]
  35. Pochanart, P.; Kajii, Y.; Potemkin, V.M.; Khodzher, T.V.; Akimoto, H. Regional background ozone and carbon monoxide variations in remote Siberia/East Asia. J. Geophys. Res. Space Phys. 2003, 108, 4028. [Google Scholar] [CrossRef]
  36. Belikov, I.B.; Belousov, V.A.; Gubanova, D.P.; Skorokhod, A.I. Variations in the Concentrations of Volatile Organic Compounds and Aerosol Particles PM2.5 In the Surface Layer of the Atmosphere of Moscow. In Proceedings of the Fundamental and Applied Aspects of Geology, Geophysics and Geoecology Using Modern Information Technologies, Maykop, Russia, 20–24 May 2019; pp. 80–89, ISBN 978-5-907004-38-2. (in Russian). [Google Scholar]
  37. Lokoshchenko, M.A. Long-Term Sodar Observations in Moscow and a New Approach to Potential Mixing Determination by Radiosonde Data. J. Atmos. Ocean. Technol. 2002, 19, 1151–1162. [Google Scholar] [CrossRef]
  38. Liu, S.C.; Trainer, M.; Fehsenfeld, F.C.; Parrish, D.D.; Illiams, E.J.W.; Fahey, D.W.; Hübler, G.; Murphy, P.C. Ozone production in the rural troposphere and the implications for regional and global ozone distributions. J. Geophys. Res. Space Phys. 1987, 92, 4191–4207. [Google Scholar] [CrossRef]
  39. Tiwari, V.; Hanai, Y.; Masunaga, S. Ambient levels of volatile organic compounds in the vicinity of petrochemical industrial area of Yokohama, Japan. Air Qual. Atmos. Health 2010, 3, 65–75. [Google Scholar] [CrossRef] [PubMed] [Green Version]
  40. Shaw, M.D.; Lee, J.D.; Davison, B.; Vaughan, A.R.; Purvis, R.; Harvey, A.; Lewis, A.C.; Hewitt, C.N. Airborne determination of the temporo-spatial distribution of benzene, toluene, nitrogen oxides and ozone in the boundary layer across Greater London, UK. Atmos. Chem. Phys. Discuss. 2015, 15, 5083–5097. [Google Scholar] [CrossRef] [Green Version]
  41. Carballo-Pat., C.G.; Cerón-Bretón, J.G.; Cerón-Bretón, R.M.; Ramírez-Lara, E.; Aguilar-Ucán, C.A.; Montalvo-Romero, C.; Guevara-Carrió, E.; Córdova-Quiroz, A.V.; Gamboa-Fernández, J.M.; Uc-Chi, M.P. Latest trends in Energy. Environment and Development. In Proceedings of the 7-th International Conference on Environmental and Geological Sciences and Engineering (EG’14), Salerno, Italy, 3–5 June 2014; pp. 132–140. [Google Scholar]
  42. Warneke, C.; van der Veen, C.; Luxembourg, S.; de Gouw, J.A.; Kok, A. Measurements of benzene and toluene in ambient air using proton-transfer-reaction mass spectrometry: Calibration humidity dependence and field intercomparison. Int. J. Mass Spectrom. 2001, 207, 167–182. [Google Scholar] [CrossRef]
  43. Atkinson, R. Atmospheric chemistry of VOCs and NOx. Atmos. Environ. 2000, 34, 2063–2101. [Google Scholar] [CrossRef]
  44. Gelencsér, A.; Siszler, A.K.; Hlavay, J. Toluene−Benzene Concentration Ratio as a Tool for Characterizing the Distance from Vehicular Emission Sources. Environ. Sci. Technol. 1997, 31, 2869–2872. [Google Scholar] [CrossRef]
  45. Wagner, P.; Kuttler, W. Biogenic and anthropogenic isoprene in the near-surface urban atmosphere—A case study in Essen, Germany. Sci. Total Environ. 2014, 475, 104–115. [Google Scholar] [CrossRef] [Green Version]
  46. Wang, J.L.; Chew, C.; Chang, C.Y.; Liao, W.C.; Lung, S.C.C.; Chen, W.N.; Lee, P.J.; Lin, P.H.; Chang, C.C. Biogenic isoprene in subtropical urban settings and implications for air quality. Atmos. Environ. 2013, 79, 369–379. [Google Scholar] [CrossRef]
  47. Chang, C.-Y.; Wang, J.-L.; Lung, S.-C.; Lee, P.-J.; Chew, C.; Liao, W.-C.; Chen, W.-N.; Ou-Yang, C.-F. Seasonal characteristics of biogenic and anthropogenic isoprene in tropical–subtropical urban environments. Atmos. Environ. 2014, 99, 298–308. [Google Scholar] [CrossRef] [Green Version]
  48. Borbon, A.; Fontaine, H.; Locoge, N.; Veillerot, M.; Galloo, J. Developing receptor-oriented methods for non-methane hydrocarbon characterisation in urban air—Part I: Source identification. Atmos. Environ. 2003, 37, 4051–4064. [Google Scholar] [CrossRef]
  49. Carter, W.P.L. Development of Ozone Reactivity Scales for Volatile Organic Compounds. J. Air Waste Manag. Assoc. 1994, 44, 881–899. [Google Scholar] [CrossRef] [Green Version]
  50. Carter, W.P.L. Development of the SAPRC-07 Chemical Mechanism and Updated Ozone Reactivity Scales, Final report to the California Air Resources Board Contract No. 03-318. California, USA. 27 January 2010. Available online: https://intra.engr.ucr.edu/~carter/pubs/ (accessed on 20 November 2020).
Figure 1. Seasonal variation of daytime O3 (a) and NOx (b) concentrations in Moscow from 2011 to 2013 (MSU-IAP data).
Atmosphere 11 01262 g001
Figure 2. Wind speed, wind rose and maximum daytime air temperature from 3-h MSU-IAP observations during the summers of 2011–2013. Down arrows are elevated ozone (>80 ppbv) episodes.
Atmosphere 11 01262 g002
Figure 3. Diurnal variations of O3 and its precursors at the MSU-IAP site during the summers of 2011–2013.
Atmosphere 11 01262 g003
Figure 4. Mean diurnal variations of O3 and secondary VOCs at the MSU-IAP site during the summers of 2011–2013.
Atmosphere 11 01262 g004
Figure 5. Toluene to benzene ratio (T/B) ratio in Moscow from daytime summer values.
Atmosphere 11 01262 g005
Figure 6. Monthly mean isoprene/benzene ratio from 2011 to 2013 and isoprene versus benzene (black circles: winter nighttime values; white circles: summer daytime values).
Atmosphere 11 01262 g006
Figure 7. Frequency distribution and percentiles of O3 daytime (10 a.m.–6 p.m. LT) values during the summers of 2011–2013.
Atmosphere 11 01262 g007
Figure 8. O3–NOx daytime dependence (a) and O3 versus air temperature (b) from summer daytime (10 a.m.–6 p.m. LT) measurements (R2: determination coefficient; R: Pearson’s correlation coefficient).
Atmosphere 11 01262 g008
Figure 9. Ozone production per molecule of NOx at different VOC/NOx ratios from summer daytime measurements at the MSU-IAP from 2011 to 2013 (Rs: Spearman’s correlation coefficient).
Atmosphere 11 01262 g009
Figure 10. High O3 episodes in Moscow in July 2011 ((a): 27 July, (b): 28 July) from 1-min measurements at the MSU-IAP site.
Atmosphere 11 01262 g010
Figure 11. Maximum air temperature, atmospheric pressure at SL (sea level), and speed and wind direction at the MSU-IAP site from 26 to 27 July 2011.
Atmosphere 11 01262 g011
Figure 12. Ozone production per molecule of NOx with different photochemical regimes during the episodes of elevated ozone (Rs: Spearman’s correlation coefficient).
Atmosphere 11 01262 g012
Figure 13. Acetone, acetic acid, and isoprene on July 27 and 28, 2011. The ratios of the daily mean and monthly mean values are near the arrows.
Atmosphere 11 01262 g013
Figure 14. Ozone formation potentials in Moscow (summers of 2011–2013).
Atmosphere 11 01262 g014
Table 1. The compounds measured at the Institute of Atmospheric Physics, Russian Academy of Sciences, and the Geographic Faculty of Moscow State University (MSU-IAP) site. NOx: nitrogen oxide; O3: ozone; CO: carbon monoxide; NMHC: non-methane hydrocarbons; VOCs: volatile organic compounds.
CompoundInstrumentResponse Time, sRange Limits
NOx, ppbvTE42C-TL (Thermo Inc., USA)600.05–200
O3, ppbv1008AH (Dasibi Inc., USA)601–1000
CO, ppmvTE48S (Thermo Inc., USA)600.05–10
NMHC, μ/m3APHA-360 (Horiba Inc., Japan)600.1–100
VOCs, ppbvCompact PTR-MS (Ionicon Analytic GmbH, Austria)0.5/each comp.0.05–1000
Table 2. Daytime summer nonparametric Spearman’s correlation coefficients (Rs) of O3 and its precursors from 1-h data. Significant at the 0.05 level.
Acetaldeh.AcetoneAcet.acidEthanolMVK + MACRO3CONOx
Acetaldeh.1.000.910.620.550.810.470.000.00
Acetone0.911.000.580.450.820.450.110.00
Acet.acid0.620.581.000.820.750.60−0.090.00
Ethanol0.550.450.821.000.670.52−0.16−0.09
MVK + MACR0.780.820.750.671.000.490.000.00
O30.470.450.600.520.491.00−0.39−0.49
CO0.000.11−0.09−0.160.00−0.391.000.82
NOx0.000.000.00−0.090.00−0.490.821
Table 3. Daytime ozone-forming potentials (OFPs) (in μg/m3) for VOCs measured at the MSU-IAP site during the summers of 2011–2013 (from 1-h VOCs data).
VOCN TotalMeanStandard DeviationP10P90
Acetaldehyde241620.3914.714.8239.84
Ethanol24224.743.121.659.89
1.3-Butadiene242413.869.736.7428.87
Acetone24241.450.960.232.71
Acetic acid24182.911.691.045.33
Isoprene24249.5812.063.5326.20
MVK + MACR24243.571.162.535.14
Benzene24240.280.080.200.36
MBO24241.880.491.442.50
Toluene24241.860.801.222.73
Phenol24240.870.390.621.22
Styrene24240.430.070.360.51
C8-aromatics24242.711.171.774.03
C9-aromatics24242.240.841.503.02
Terpenes24240.780.250.521.03
Total VOCs242467.2727.0438.13102.90
Table 4. OFPs (in μg/m3) for the high ozone episodes on July 27 and 28, 2011 based on 1-h VOCs data.
VOCN TotalMeanStandard DeviationP10P90
1212121212
Acetaldehyde20726449.9233.088.767.0439.5424.660.2942.06
Ethanol20726414.4313.391.161.4512.8811.3515.9715.07
1.3-Butadiene20726415.7312.922.152.1113.0810.3918.6015.47
Acetone2042644.233.870.400.463.713.384.784.45
Acetic acid1822637.276.780.950.906.095.678.597.98
Isoprene2072647.986.931.641.575.954.8510.208.85
MVK + MACR2072647.766.031.391.025.904.739.467.42
Benzene2072640.420.310.060.060.350.230.510.39
MBO2072643.252.960.510.532.662.333.953.67
Toluene2072643.032.090.590.452.301.553.912.66
Phenol2072640.810.910.180.180.570.671.061.15
Styrene2072640.370.430.090.080.250.320.480.54
C8-aromatics2072643.573.010.940.652.522.204.853.79
C9-aromatics2072642.122.050.590.611.331.292.972.88
Terpenes2072640.760.710.330.320.300.321.191.13
Total VOCs207264121.7095.5012.2211.27105.8681.3136.38110.36
Publisher’s Note: MDPI stays neutral with regard to jurisdictional claims in published maps and institutional affiliations.

