Article

An Analysis of Fog in the Mainland Portuguese International Airports

by
Pedro M. P. Guerreiro
1,*,
Pedro M. M. Soares
2,
Rita M. Cardoso
2 and
Alexandre M. Ramos
2
1
Portuguese Air Force Academy Research Center, 2715-021 Pêro Pinheiro, Portugal
2
Instituto Dom Luiz, Faculdade de Ciências, Universidade de Lisboa, 1749-016 Lisboa, Portugal
*
Author to whom correspondence should be addressed.
Atmosphere 2020, 11(11), 1239; https://doi.org/10.3390/atmos11111239
Submission received: 17 September 2020 / Revised: 11 November 2020 / Accepted: 15 November 2020 / Published: 18 November 2020
(This article belongs to the Special Issue Weather and Aviation Safety)

Abstract

:
An analysis of 17 years of half-hourly aeronautic observations (METAR) and special observations (SPECI) in the three international airports of mainland Portugal indicates strong variations in fog properties. Fog is a rare event at Faro, a winter phenomenon in Lisbon and mainly a summer process at Porto. At both Lisbon and Porto, fog is favoured by specific synoptic circulations, here classified into a set of weather types, compatible with the strict requirements of fog formation. At the same time, however, a detailed analysis of the distribution of fog, and the classification of its onset processes, reveal a crucial dependence on local wind. This suggests that the advection of moist air from nearby sources, from the Tagus estuary at Lisbon and from the ocean at Porto, is the dominant process at both locations, despite the large differences found in the timing of those fog processes. The observational data (METAR) prior to the fog formation is used to classify the fog generation mechanism for 96.9% of the fog events at Porto, and 98.9% at Lisbon. Among the five fog types identified using a classification algorithm, cloud base lowering is the most common one at both locations, gathering half of the classified fog events, followed by advection, precipitation, and radiation. No fog event of the evaporation type was detected at both airports. The analysis of the observed horizontal visibility during the fog events revealed that cloud base lowering and radiation fog are the most intense events. The median of the minimum horizontal visibility of these two types of fog varies between 150 and 250 m, as the average ranges between 217.8 and 312.9 m. The study results have revealed a promising prefog diagnosis tool to be explored in detail in further operational context studies.

Graphical Abstract

1. Introduction

Despite the progress in navigation technology, fog remains as a major constraint to many human activities, especially aviation. In the presence of fog, airport activities may be suspended or restricted, often with great economic impact, sometimes even with human losses [1]. The World Meteorological Organization (WMO) [2] defines fog as the suspension of water droplets in the lower atmosphere that reduces the horizontal visibility to less than 1 km near to the ground. Such a simple definition, however, encompasses many different physical processes, at different scales, typically making fog a very difficult target for forecasters. The classical study of fog by Willett [3] describes the physical processes responsible for fog formation and the synoptic circumstances in which those processes may occur. Byers [4], working on Willett results, proposed a classification of fog events in eleven classes, which could be grouped into four main categories: radiation, advection, frontal and maritime [5]. While such classifications do provide useful clues to the forecasting process, different empirical studies [1,5,6] tend to show that individual processes are often difficult to distinguish, particularly due to interactions between rather different spatial and temporal scales, from the synoptic [5] to local [7].
The extreme sensitivity of fog to interactions between synoptic and local circulations is probably the reason for the large spatial variability of the fog, making its forecast highly dependent on local knowledge, and not yet well supported by numerical weather prediction products [8]. A number of studies have looked at fog statistics in different locations, such as the airports in the northeastern United States: Newark, John F. Kennedy, LaGuardia and White Plains [1,9], in Europe: Paris [10], especially Orly [11], Madrid [12], Thessaloniki [6], Ioannina [5] and Zürich [13]. In the case of Lisbon airport, a conceptual model for the onset of fog has generally assumed that it is predominantly formed in the Tagus estuary, at Lisbon’s eastern border, and then slowly advected inland. This process was observed and simulated by Teixeira and Miranda [7] with a simple 1D boundary layer model, which, however, could not represent in detail the crucial initial and final stages of fog development.
Policarpo et al. [14] has shown the major role of a water reservoir on local weather conditions as an important moisture source. A large artificial lake of 250 km2 and its associated irrigated areas in the interior of southern Portugal have increased the supply of water vapour, favouring the formation of fog over the lake area and its surroundings. This study has outlined the terrain characteristics as a geographical conditioning on mass and energy fluxes involved in the formation of fog. Later, Egli et al. [15] studied the connection between the terrain characteristics, the predominant weather situations and the identification and classification of fog patterns.
At local scale, prefog conditions are examined through the evolution of observed key parameters [1,3,5,6]. In the vast majority, the classification of fog is performed using a classification algorithm proposed by Tardif and Rasmussen [1], based on observational features regarding the precipitation, the evolution of cloud base height, 10 m wind speed, 2 m air temperature and 2 m dewpoint temperature. The classification of fog is characterized by the primary processes which leads to the formation of fog, such as precipitation, advection, cloud base lowering, radiation, and evaporation.
The formation of fog is very sensitive to the air quality. Vautard et al. [16] found a relationship between the decadal trend of the fog occurrence and the improvement of air quality, also suggested by Akimoto and Kusaka [17]. The decreasing occurrence of fog exposes the surface to diurnal warming that inhibits the onset mechanisms. Moreover, growing urban areas continuously change the landscape and the surface cover, which affects the occurrence of different types of fog [18,19]. The urban heat-island effect significantly decreases the formation of fog driven by radiation processes, and the advection of warmer air to surrounding areas may increase the formation of other types of fog. Although the International Airport of Lisbon is in the metropolitan area, no connection between the fog types and air quality was investigated.
In the present study, the main objectives consist in a statistical characterization of the fog events, as well as the conditions prior to onset at large and local scales, and classification of fog types.
Therefore, 17 years of half-hourly surface weather observational data from the Portuguese international airports of Porto, Lisbon and Faro are used to compute statistics concerning the frequency, duration, timing and its annual cycle of fog at each location. The synoptic and local favouring conditions, and the classification of the fog types is also performed. The characterization of the synoptic circulation used here follows the classification into weather types proposed by Trigo and DaCamara [20] and applied by Ramos et al. [21]. Fog types classification uses an algorithm proposed by Tardif and Rasmussen [1] regarding the variability of the wind speed, near surface cooling, cloudiness, and significant weather along five-hour period prior to the fog onset.
The observational data characterization, the circulation weather type method and the classification of fog types method are described in Section 2. In Section 3, the distribution of fog in the airports is characterized, with a classification of fog types and subsequent large and local scale analysis at Porto and Lisbon. The final discussion and conclusions are presented in Section 4.

2. Observational Data and Methods

2.1. Observational Data

The observational dataset consists of half-hourly surface weather observations from aerodrome routine meteorological reports (METAR), and aerodrome special meteorological reports (SPECI), at specific times. The METAR data includes local weather parameters, such as wind, present weather, horizontal visibility, cloud amount and cloud base height, temperature, dewpoint and atmospheric pressure. Some of these parameters, or their combination, may significantly affect an aircraft flight and navigation, especially during landing or take-off procedures. SPECI provides the same weather information but are issued whenever there is a significant change of one or more weather parameters by deterioration or improvement of the weather conditions. The METAR and SPECI code forms are defined in the WMO Manual on Codes, Volume I, Part A [22] and the governing criteria for issuing SPECI reports are specified in the WMO Technical Regulations, Volume II [23].
METAR and SPECI from the airports of Porto, Lisbon, and Faro, provided by the Portuguese weather service (Instituto Português do Mar e da Atmosfera, IPMA: Lisbon, Portugal) over a 17-year period (2002–2018) were used to identify and characterize fog events. Good data availability was granted by the 0.32% of missing data at Porto, 0.1% at Lisbon and 0.08% at Faro. The observational data were available from 2002, however, since the weather types were calculated from ERA-Interim reanalysis data, which ended on August 31 2019, the dataset was limited to 2018. The dataset consists of weather data obtained by conventional observation practices, instead of automatic reporting. All the airports are located on flat terrain but surrounded by different topographical features. Porto is completely exposed to the westerly flow from the Atlantic Ocean, with an inshore gentle slope. Among the three airports, Lisbon is the highest location above sea level, with the Tagus estuary to its east. Faro is located at sea level with an orographic barrier 17 km northward that shapes low level atmospheric flow parallel to the southerly coastline (Figure 1).
The identification of fog in the METAR reports, consisted not only in the “FG” statement, but also in the prevailing horizontal visibility less than 1000 m. METAR is restricted to local weather observation, although the encoding rules of horizontal visibility allows the reporting of significant weather phenomena in the airport vicinity, such as partial fog, fog patches and shallow fog. Thus, to identify a fog occurrence at the airport, the strict conditions of the WMO fog definition were applied.

2.2. Large Scale Circulation Classification

Circulation weather types are a simplified system used to classify synoptic scale circulations into a small number of typical representative synoptic patterns [24]. The methodology used here has been applied by different authors in several Iberian regional studies, such as precipitation trends and variability by Trigo and DaCamara [20], lightning activity in mainland Portugal [21] and coastal upwelling prediction in the western coast of the Iberian Peninsula [25]. Trigo and DaCamara [20] and subsequent authors, e.g., [26,27,28,29], had their weather classification assumptions on Lamb weather-typing [30]. However, an objective method founded on Jenkinson and Collin classification scheme [31] was adopted. The objective classification method uses indices derived from atmospheric pressure fields, which is an advantage over the subjective methods of Lamb weather type classification and the Grösswetterlagen catalogues [32]. As in Ramos et al. [21], the circulation weather types used herein were computed from daily mean sea level pressure (SLP) on a 0.75° latitude-longitude grid retrieved from the ERA-Interim reanalysis data [33] for the 2002–2018 period.
Following Ramos et al. [25], the circulation weather types were aggregated into 10 classes, eight of them dominated by directional flow in the main directions (north, northeast, east, southeast, south, southwest, west and northwest) the other two corresponding to the anticyclonic (A) and cyclonic (C) rotational classes, thereby avoiding all possible hybrid types, which were evenly decomposed into the contributing pure classes. Figure 2 shows the average regional patterns associated to each one of the 10 classes computed for a western Iberian point.

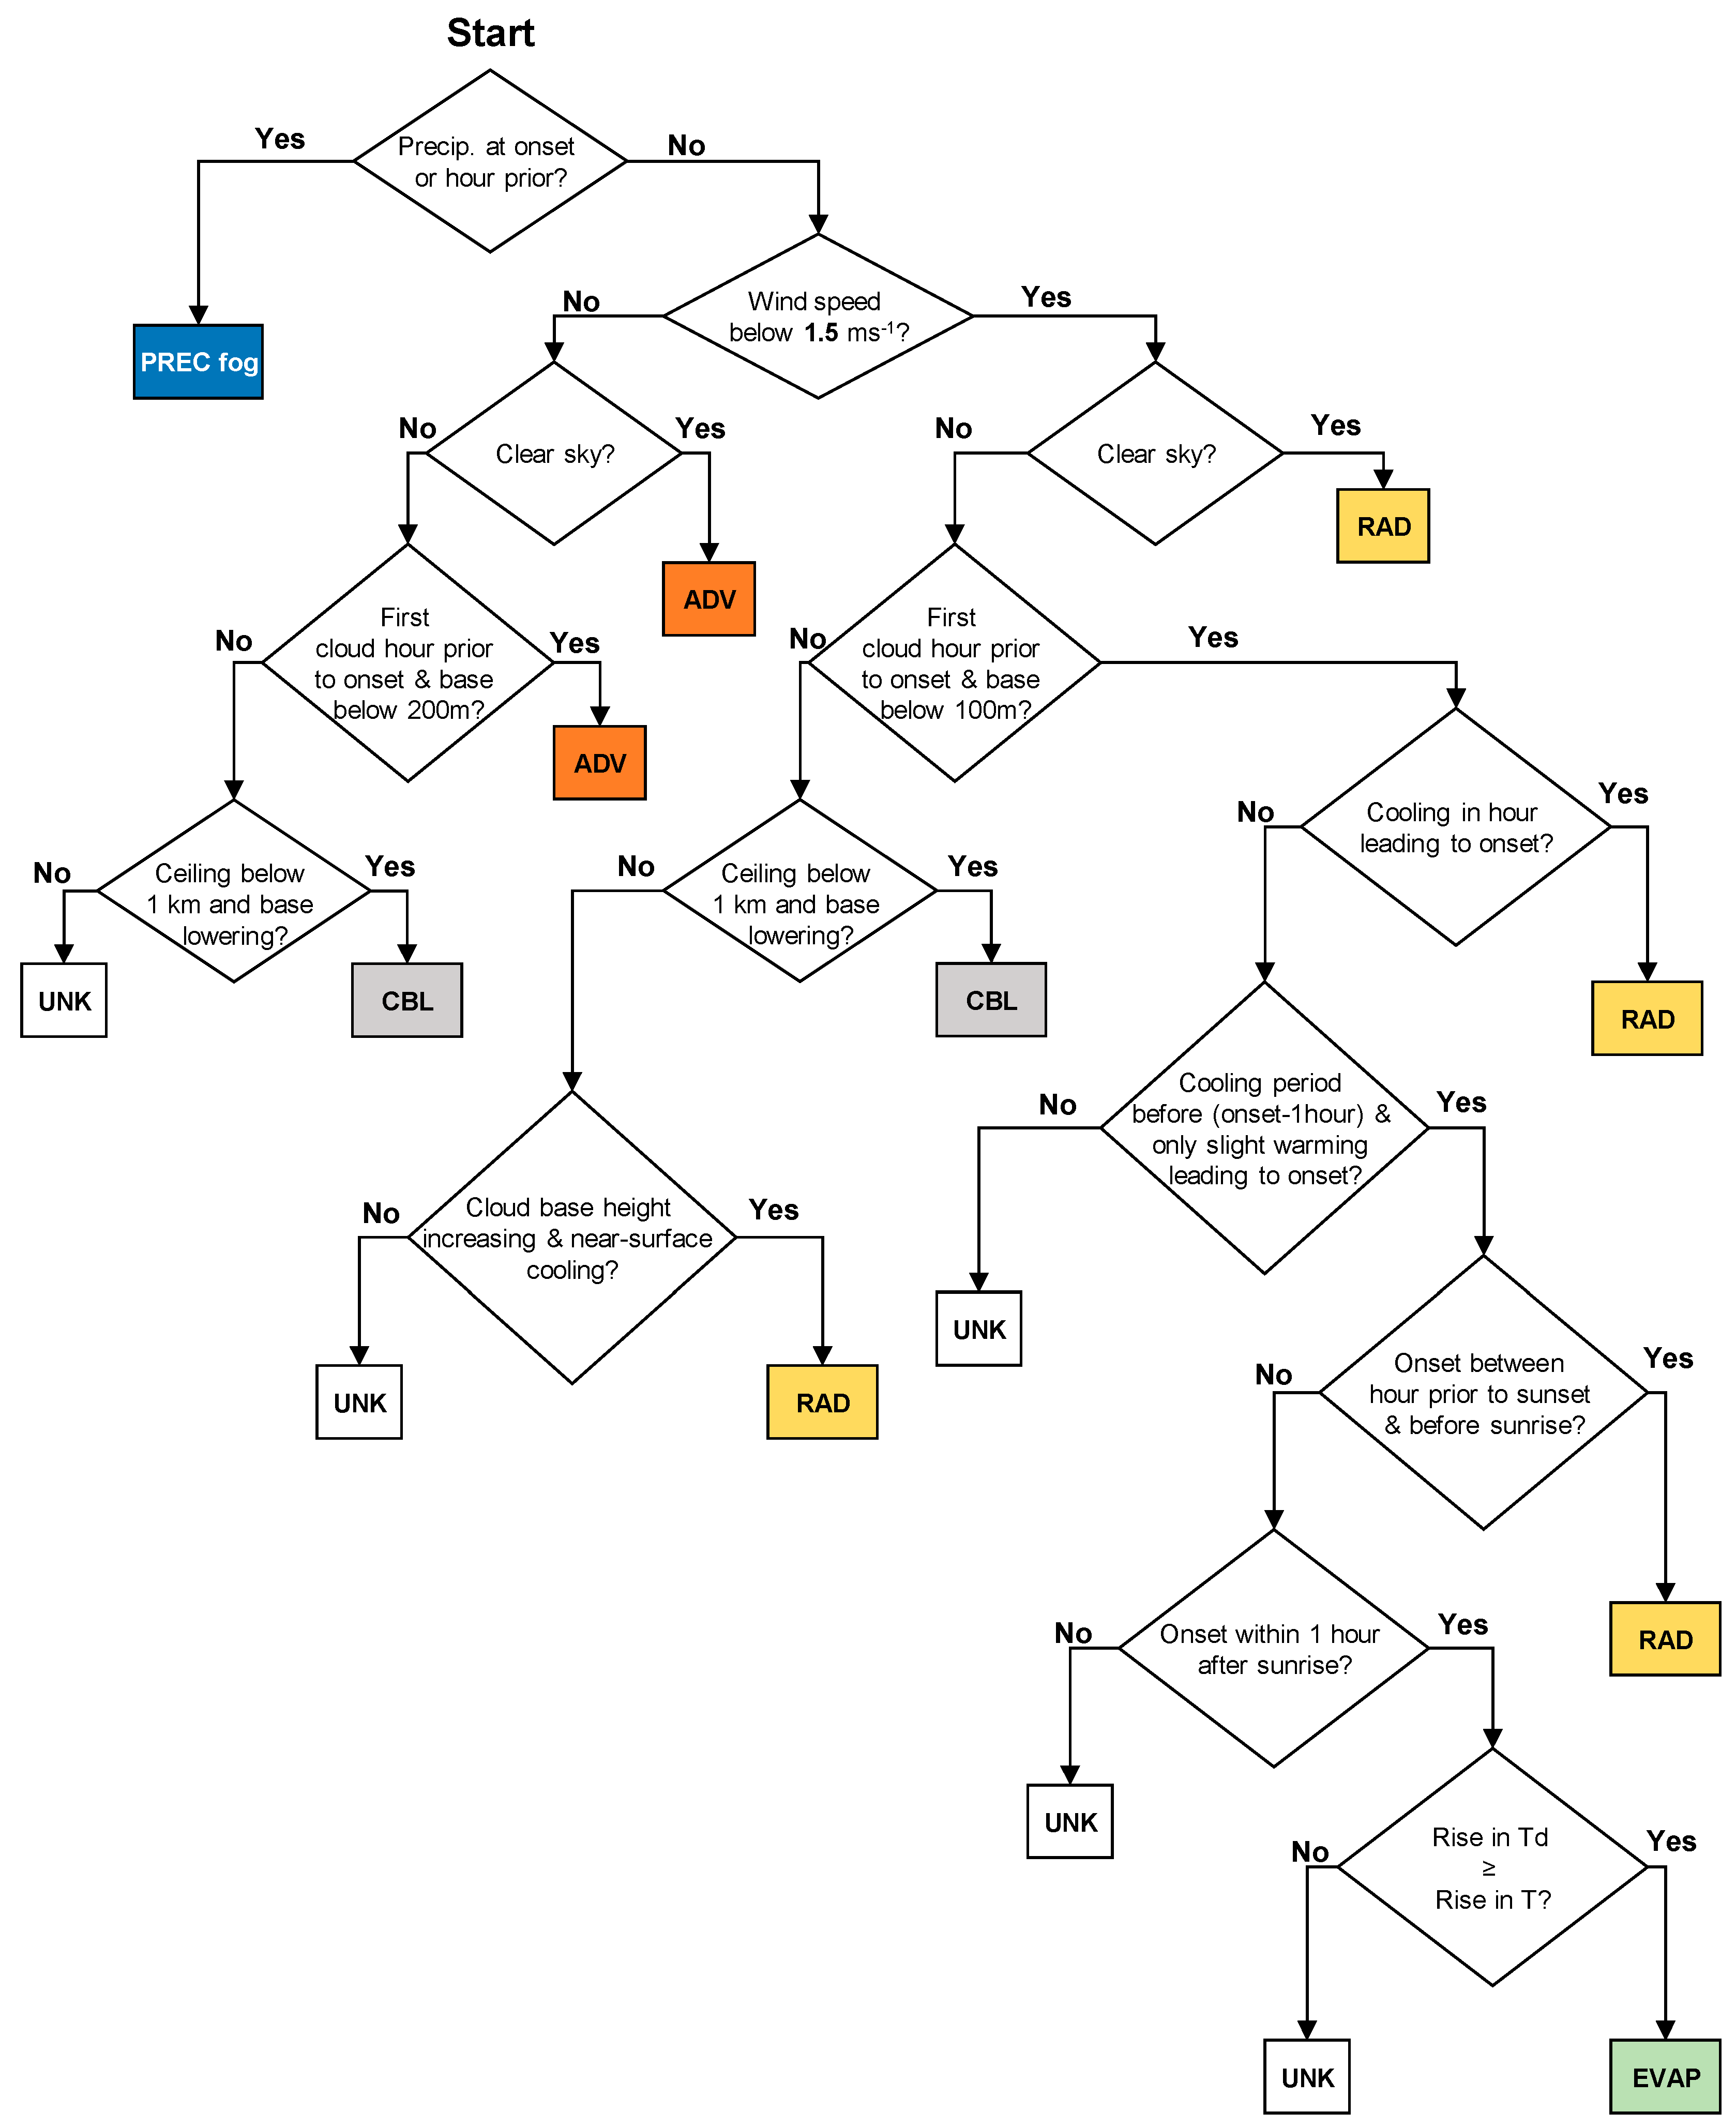
2.3. Fog Types Classification

Horizontal visibility may increase above 1000 m leading to short interruptions of the fog occurrences. When the visibility improvement takes longer than 10 min, a SPECI report is issued. However, when followed by a sudden visibility reduction below 1000 m, the deteriorating condition is immediately reported, although the separation between the fog occurrences by minutes, the primary mechanism, which favoured the formation of the first occurrence, is practically the same. In this way, a set of well-defined fog sequences separated by less than two hours is considered as a fog event. The algorithm was adapted from the event concept proposed by Tardif and Rasmussen [1], with the only criteria based on the separation of the fog occurrences by two hours at least.
Broadly speaking, the underlying processes of the fog formation have temperature and moisture as the thermodynamic properties and wind acting as a dynamic driver. The half-hourly observational sampling, even when interspersed with special observations, restricts any detailed analysis of the properties behaviour into the mechanisms favouring the formation of fog and, therefore, an accurate classification. Nevertheless, a study in the New York City region carried out by Tardif and Rasmussen (2007), using hourly datasets from the surface observations network, identified five different types of fog, namely precipitation fog (PREC), advection fog (ADV), cloud-base lowering fog (CBL), radiation fog (RAD) and evaporation fog (EVAP). The formation of fog is triggered by a primary mechanism resulting from preconditioning features gathered during the five-hour period prior to onset as described in Table 1.
In the present work, the precondition variations of temperature, humidity, wind, and cloudiness were analysed during the previous period and each fog event was classified into one of the fog types. If the physical reasoning does not match any fog type, the fog is classified as unknown type (UNK). The flow chart in Figure 3 depicts the classification method.
Despite the simplicity of the decision-making process, the same classification approach was broadly applied to fog climatology studies in airports sites [6,34,35], and to complex field experiments as well, such as PARISFOG [11].
Despite being the second level of the classification process, the wind intensity threshold plays a major role in the distinction between the advection (transport) and the local scale turbulence features (mixing). Inadequate choice of the wind threshold increases the probability of fog type misidentification between the kinematic (advection) and the thermal mechanisms (radiative cooling) and may therefore produce erroneous classification. At Porto airport, the wind intensity average and median are 1.85 ms−1 and 1.54 ms−1, respectively. At Lisbon airport, the average and median are 1.86 ms−1 and 1.54 ms−1. A straightforward analysis of the wind intensity average and median, and a careful examination of the data, led us to choose the wind intensity threshold of 1.5 ms−1 for both airports.

3. Results

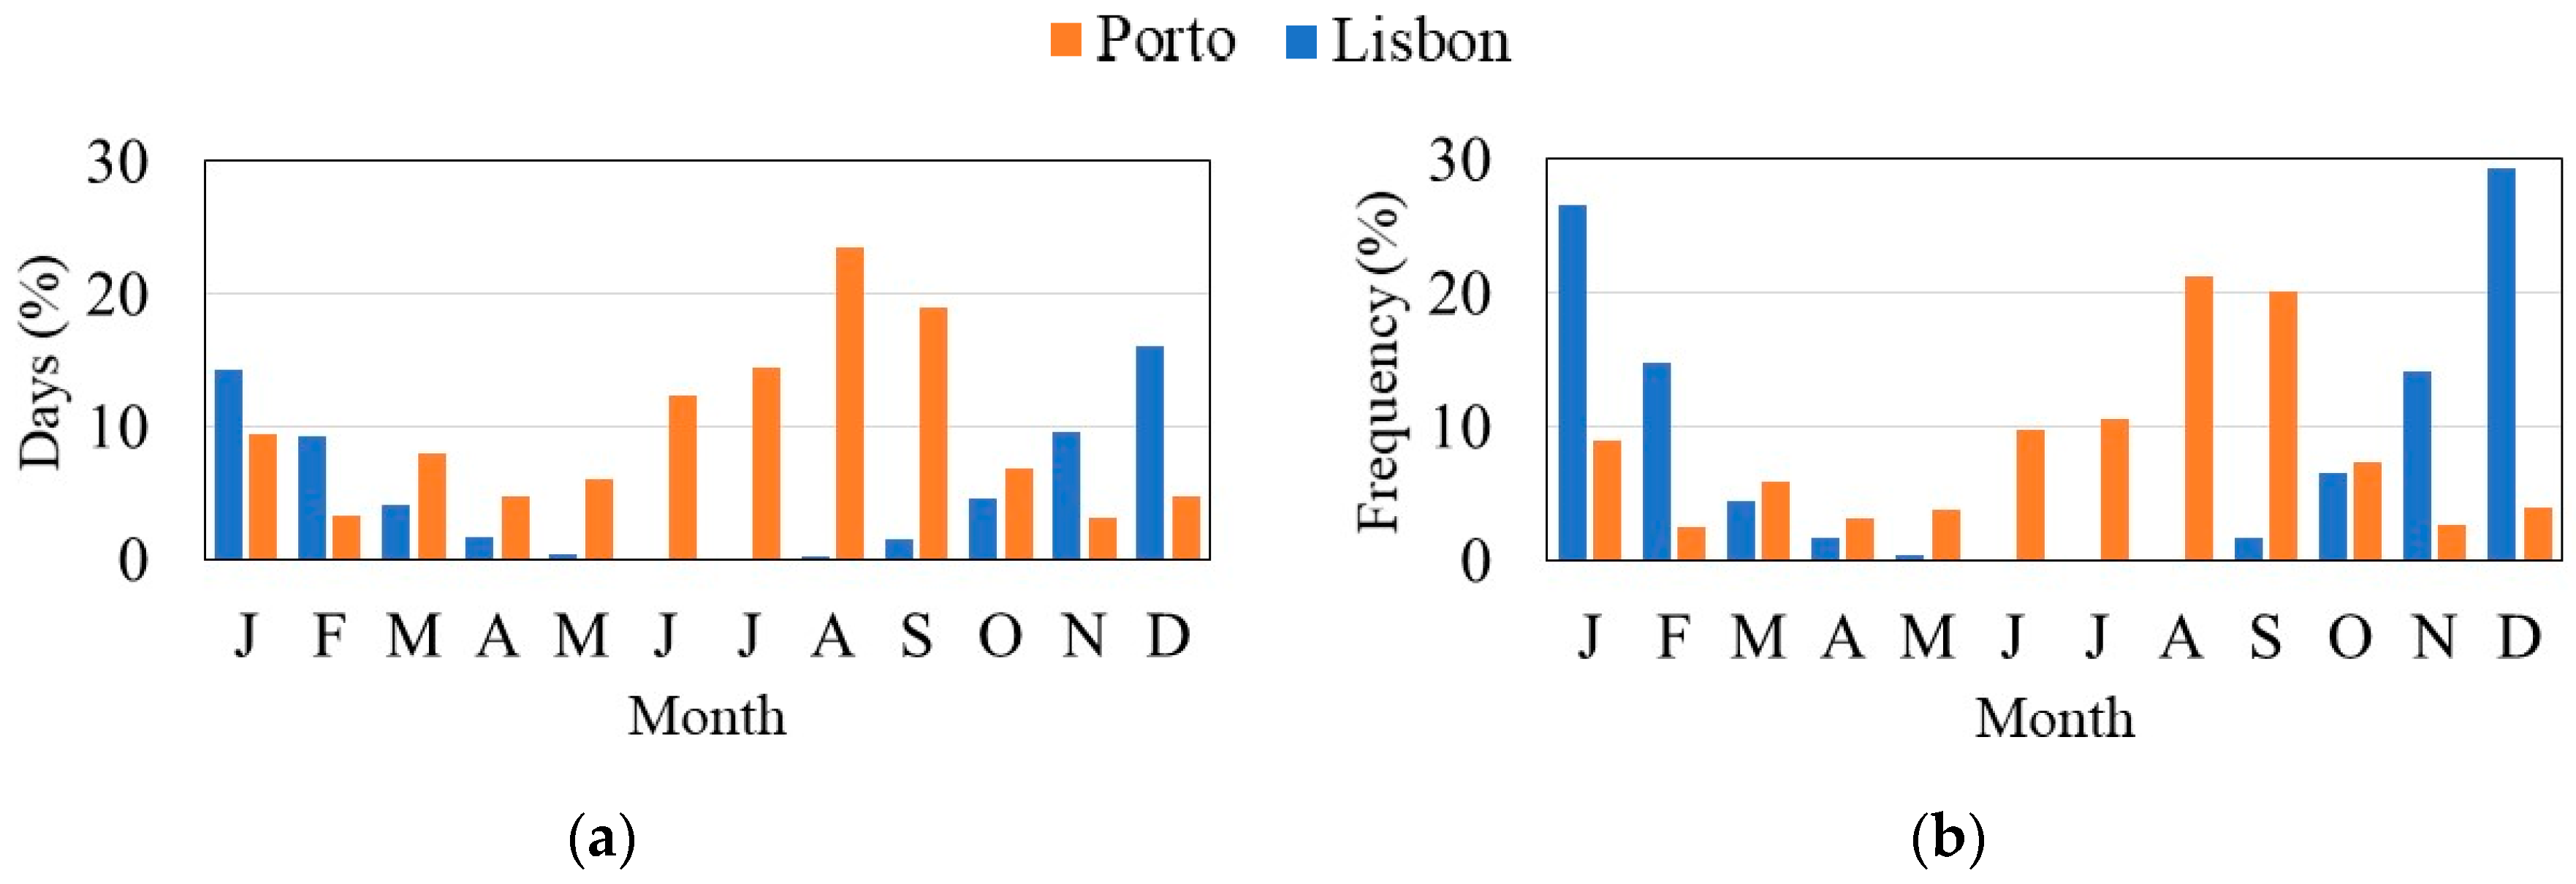
3.1. Annual and Monthly Fog Events

The daily observational dataset consists of a daily report of fog occurrences even if a single instantaneous occurrence with few minutes’ duration occurs. Table 2 shows the number of daily fog occurrences in the three airports between 2002 and 2018, and the decadal average. The yearly average percentage of the days with at least one METAR fog report is 9.68% at Porto, 5.15% at Lisbon and 0.97% at Faro. This latter airport is discarded from the analysis since fog seldom occurs.
The annual cycle of the monthly mean frequency of fog is plotted in Figure 4a,b and shows that fog occurrences are more frequent at Porto during the summer while, at Lisbon, the fog is a winter event. The annual cycles at both locations are completely different, with almost all the events in Lisbon occurring in the extended winter, while the maximal monthly frequencies of fog at Porto (a mere 300 km north of Lisbon) occur in summer. Moreover, at Porto, 70.3% of the daily occurrences are between June and September, and only 49.3% between November and February at Lisbon (Figure 4a). However, the relative frequency of the monthly distribution at Lisbon (Figure 4b) shows 84.5% of the fog occurrences, against the 61.7% at Porto, in the respective periods. Therefore, more fog occurrences in each day are observed at Lisbon compared to Porto. Fog is a more daily recurrent phenomenon at Lisbon than at Porto, despite being less frequent.

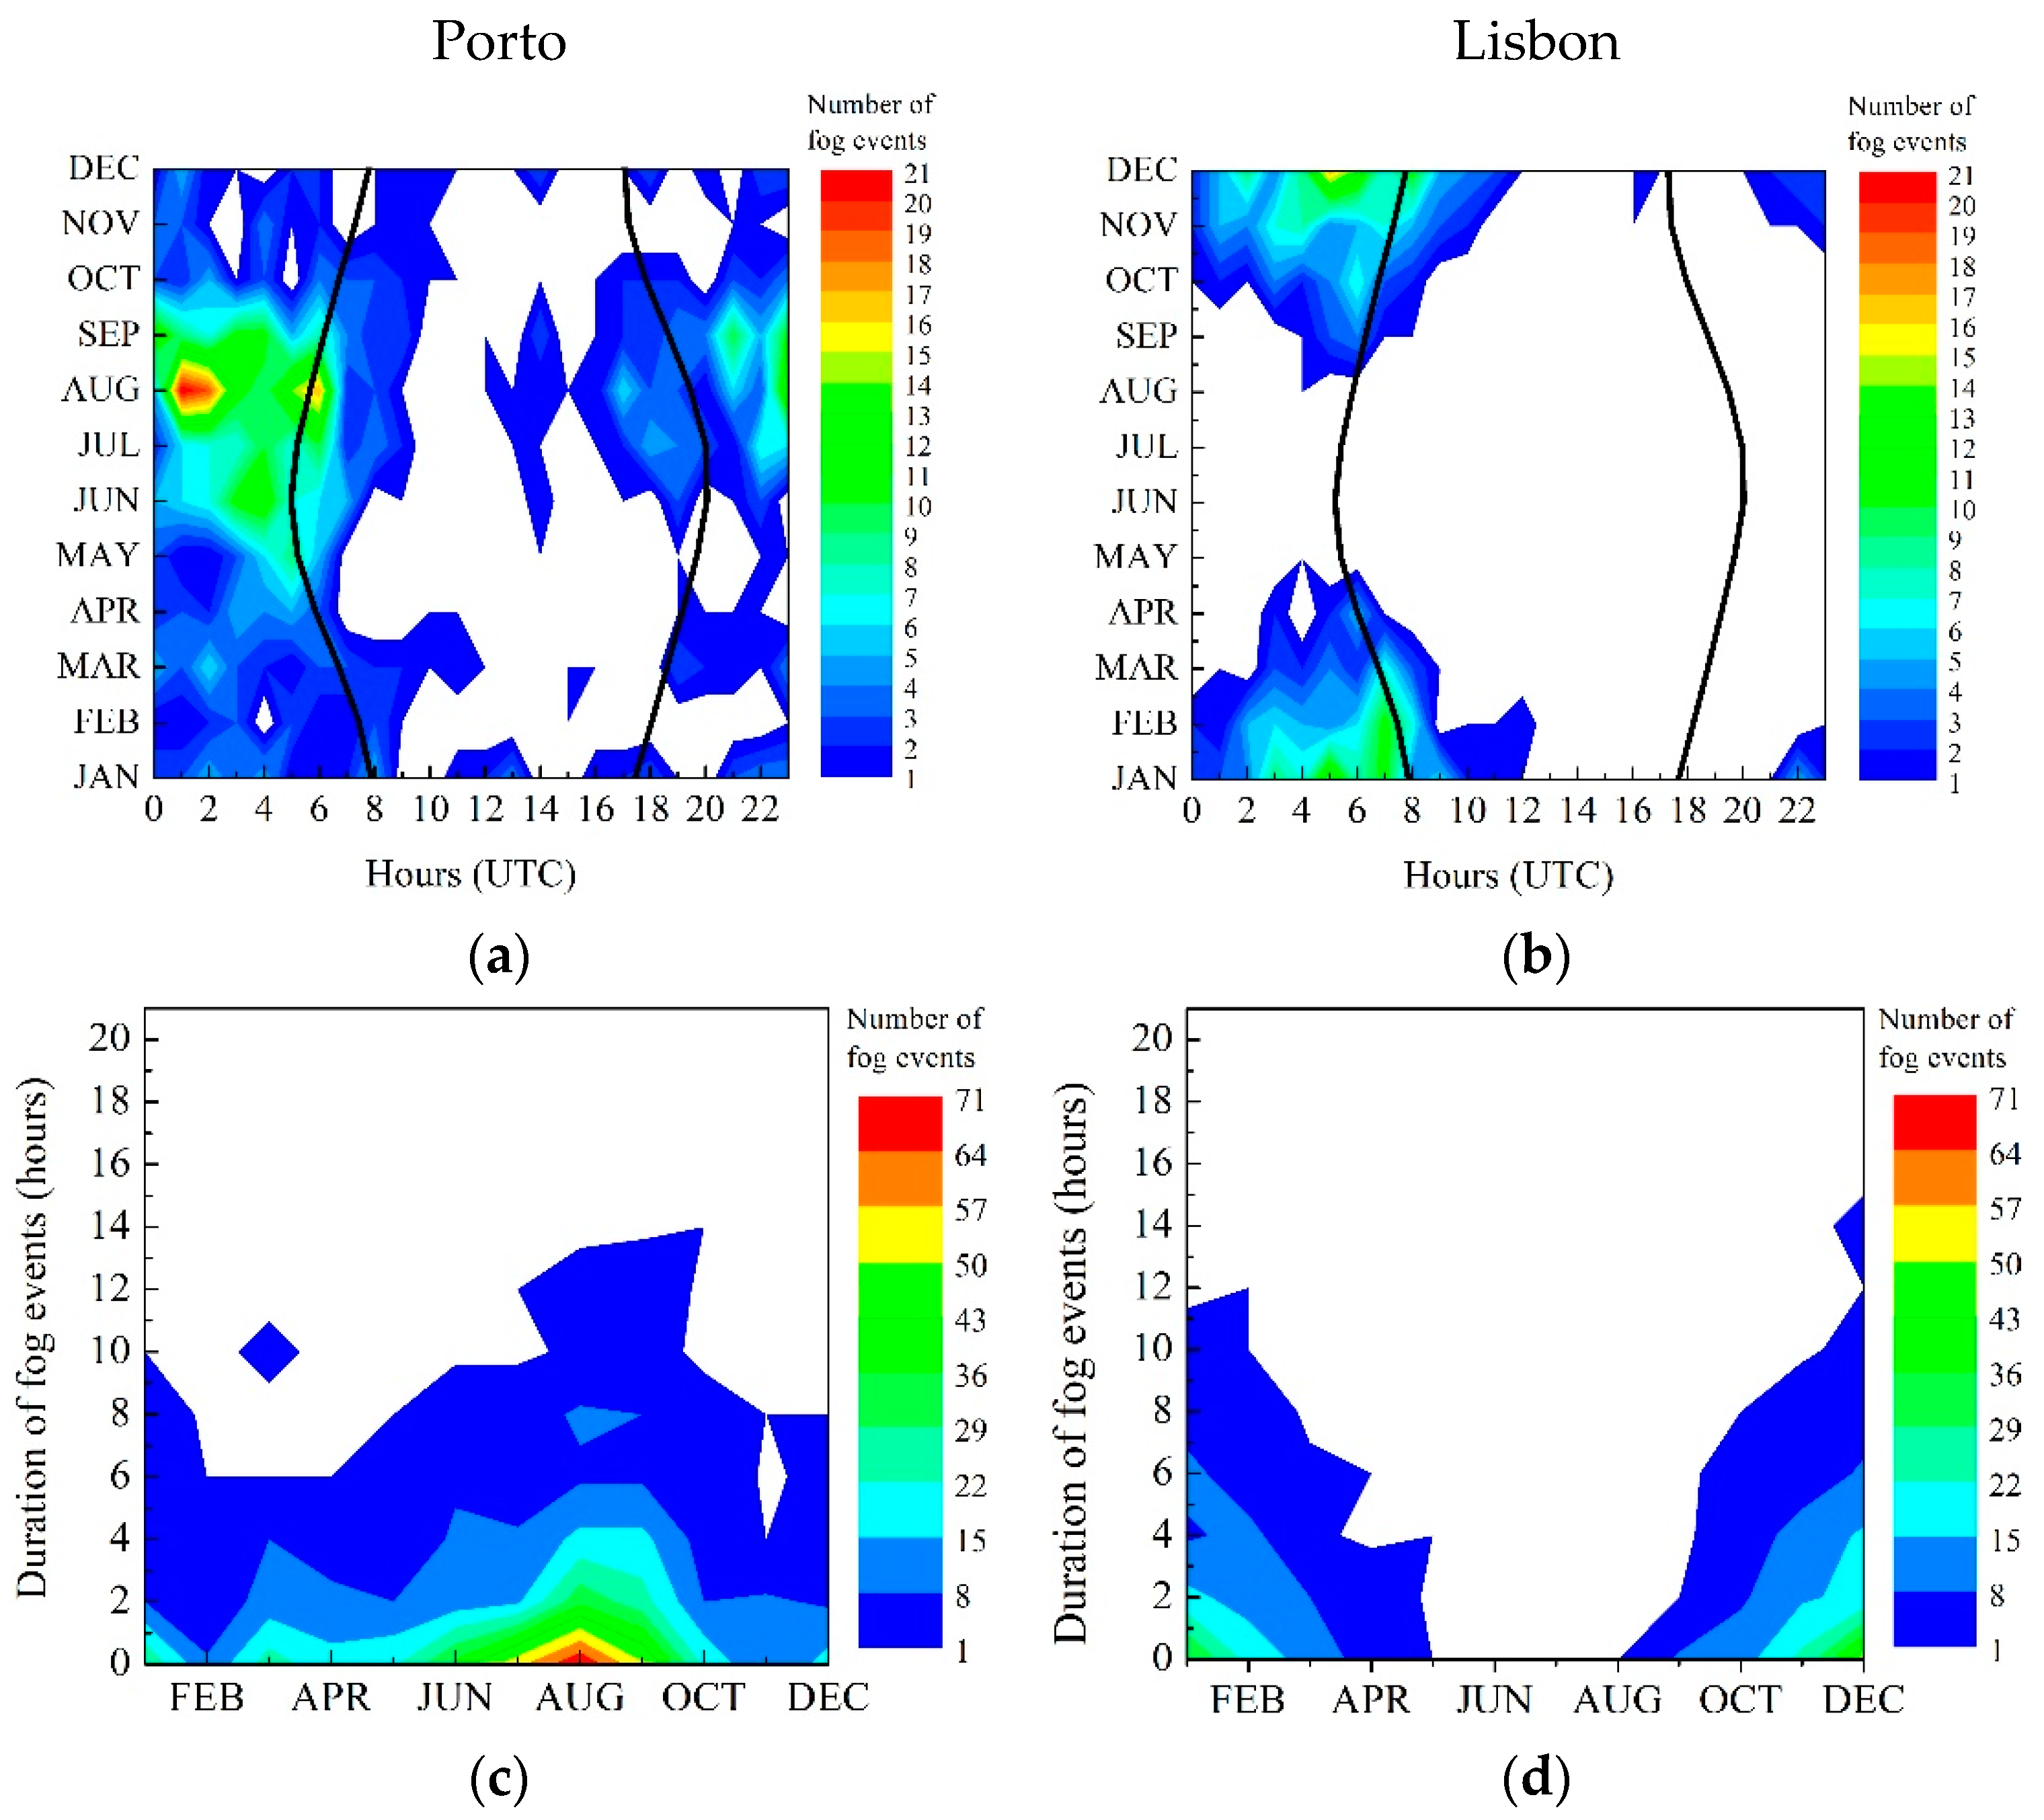
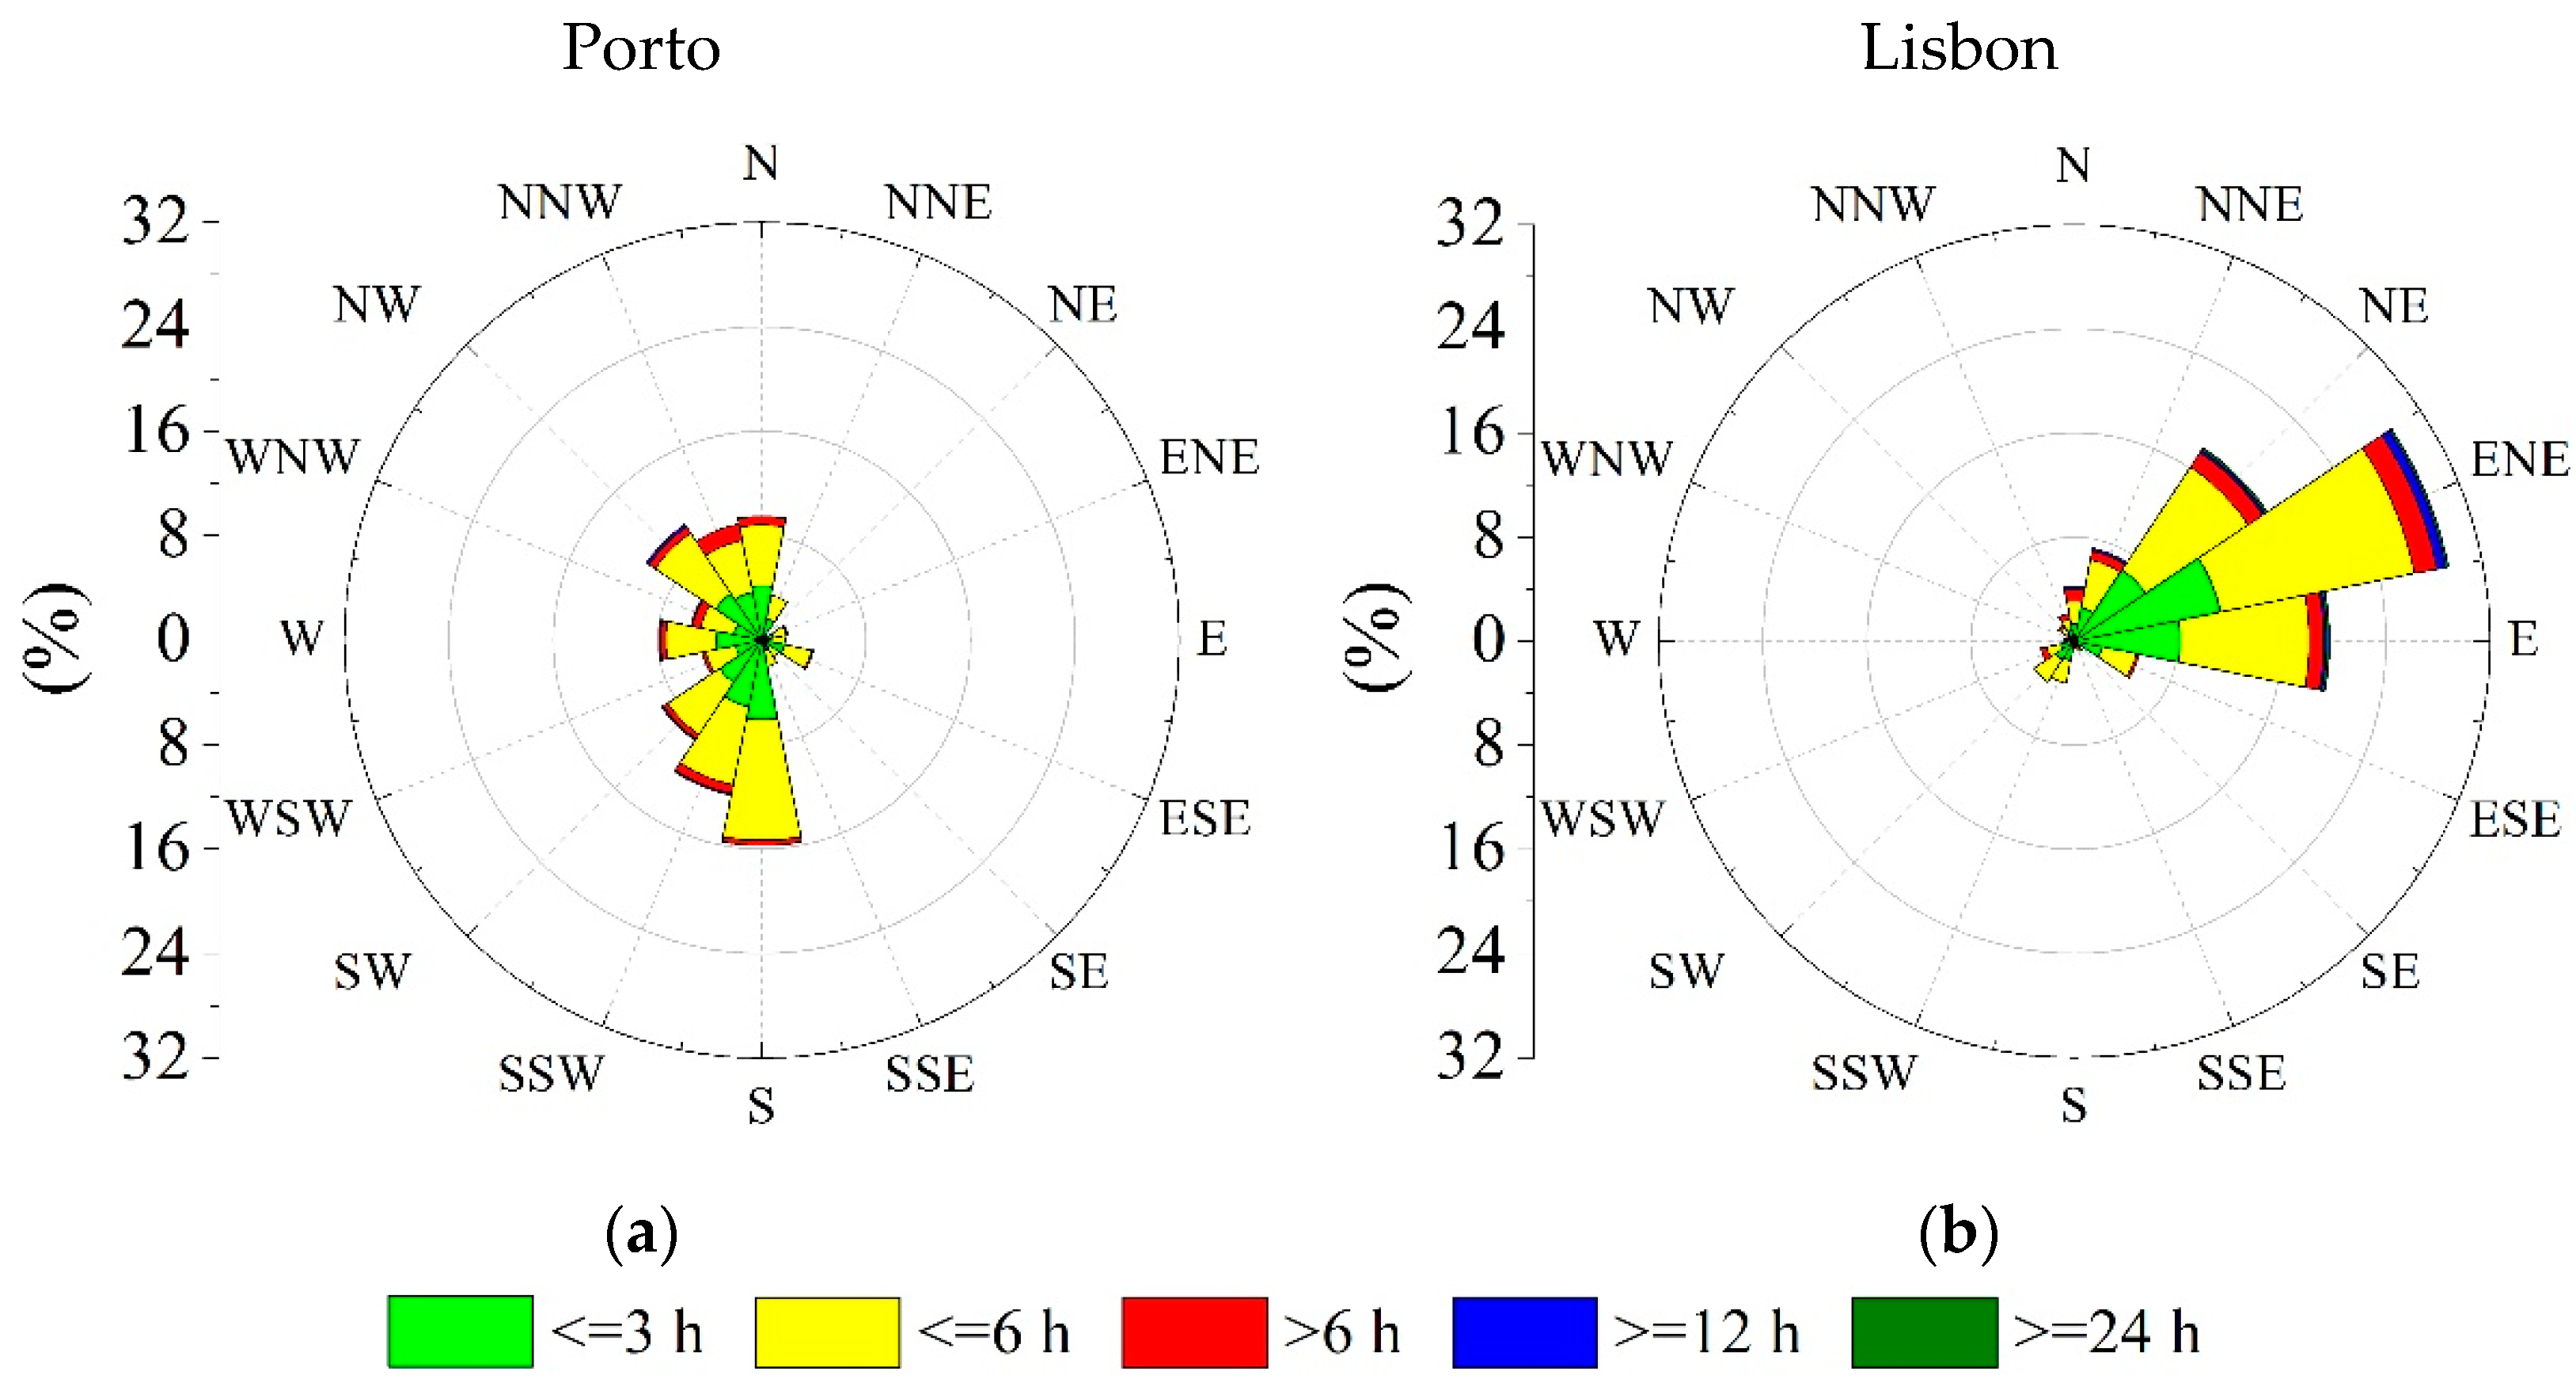
3.2. Diurnal Cycle and Duration

In general, at Porto, the formation of fog occurs before the sunrise (Figure 5a). In the period June–August, there are some cases starting after sunrise, and the late-night formation of fog occurs between July and September. At Lisbon, fog is only observed between September and April. Fog forms mostly late at night or early in the morning, between 0300 and 0900 UTC (Figure 5b).
The lower panels (c) and (d) depict the distribution of the fog events duration time, up to 12 h. Despite the seasonality of the fog, the wider duration range is centred in August at Porto and in December at Lisbon.
At first inspection, the fog events at Porto and Lisbon are driven by distinct local advections. Figure 6 shows the prevailing wind direction and the cumulative frequency of the fog events’ length. The predominant fog events had a duration up to six hours in both airports, being associated to southerly wind at Porto (Figure 6a) and to East-NorthEeast (ENE) wind at Lisbon (Figure 6b). Regarding the longer events, ten events were longer than 12 h and last up to 24 h. At Porto, they were driven by 2 ms−1 SW flow, where the average wind direction is 245° and the median is 280°. At Lisbon, eleven events exceeded 12 h of duration, and eight of them lasted up to 36 h, and a single event was slightly longer than 52 h. All these events were driven by 1.5 ms−1 ENE flow, where the average wind direction was 60° and the median was 80°.

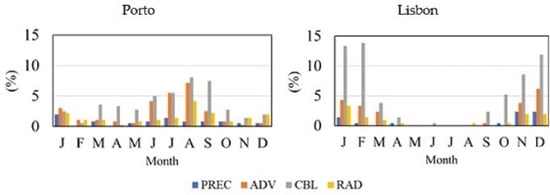
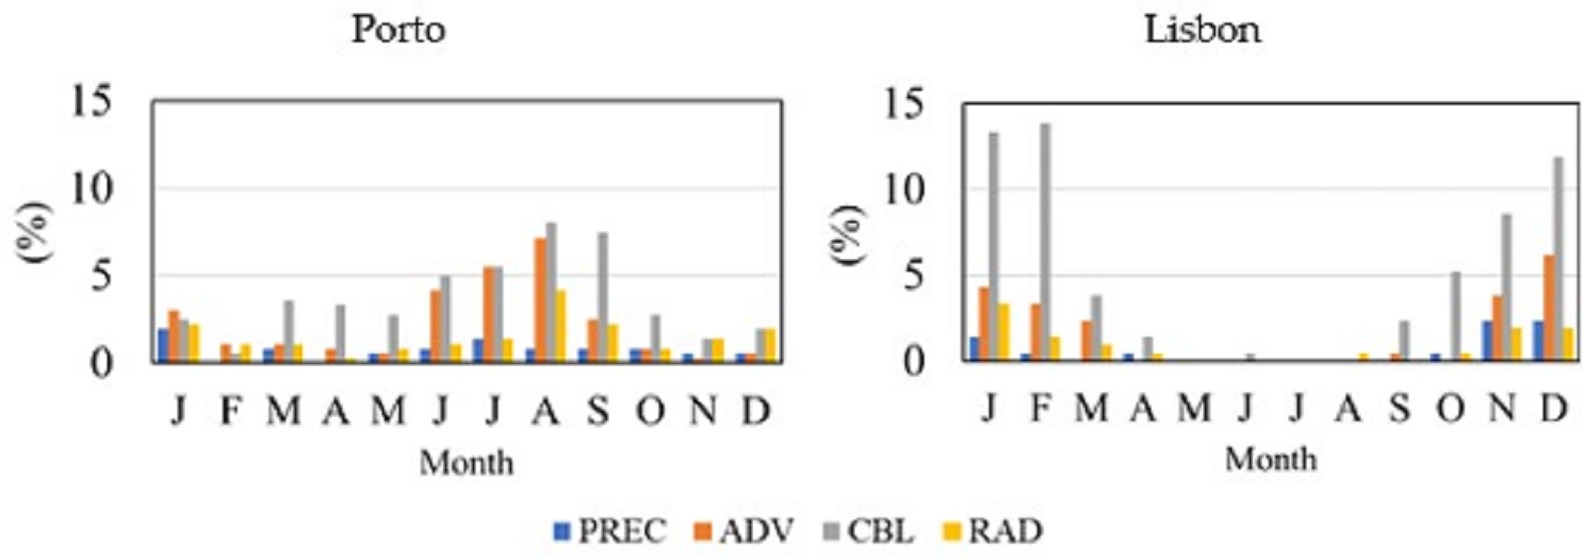
3.3. Fog Types Classification

The classification algorithm applied to Porto and Lisbon datasets classified 96.9% of the fog events at Porto and 98.9% at Lisbon. The frequency and the percentage of occurrence of each fog type are presented in Table 3.
The predominant fog type at both airports is the cloud base lowering type, with 57.7% of the events at Porto and 66.9% at Lisbon, followed by the advection (27.8% and 24.0%), precipitation (6.7% and 5.3%) and radiation types (4.7% and 2.7%). For none of the fog events was the evaporation type identified, and the classification was inconclusive for 3.5% of the fog events at Porto and 1.1% at Lisbon. It should be noted that the ADV type, as the second most frequent type of fog at Lisbon, is suggested to be the mechanism favouring the formation of fog by the study of Teixeira and Miranda as a result of simulations generated from a 1D conceptual model.
The classification algorithm provides different mechanisms to estimate the fog of cloud-base lowering type: one associated to winds higher than 1.5 ms−1, which might be related to the conveyed low clouds laid at surface due to orography, and the other associated to wind intensities lower than 1.5 ms−1, which might be related to turbulent mixing due to the cloud top cooling. Below 1.5 ms−1, the number of the fog events from the most frequent type (CBL), at both airports, is 343 events at Porto, and 190 at Lisbon, and above 1.5 ms−1 windspeed events number 60 at Porto, and 61 at Lisbon.
The fog monthly distribution according to fog types presented in Figure 7 shows the relative frequency of the different types, where the prominence of the CBL type is evident at both airports, followed by the ADV and RAD types, the last one of which is very close to the PREC type. At Porto (Figure 7a), CBL is the prevalent type during spring and CBL and ADV frequencies increase during the summer. Although a significant decrease of the frequency of the ADV type occurs in September, the frequency of CBL has only a slight decrease relative to August. The fog events in September are then merely the cloud-base lowering type. At Lisbon (Figure 7a), CBL is clearly the predominant fog type, significantly more frequent than the ADV and RAD types.

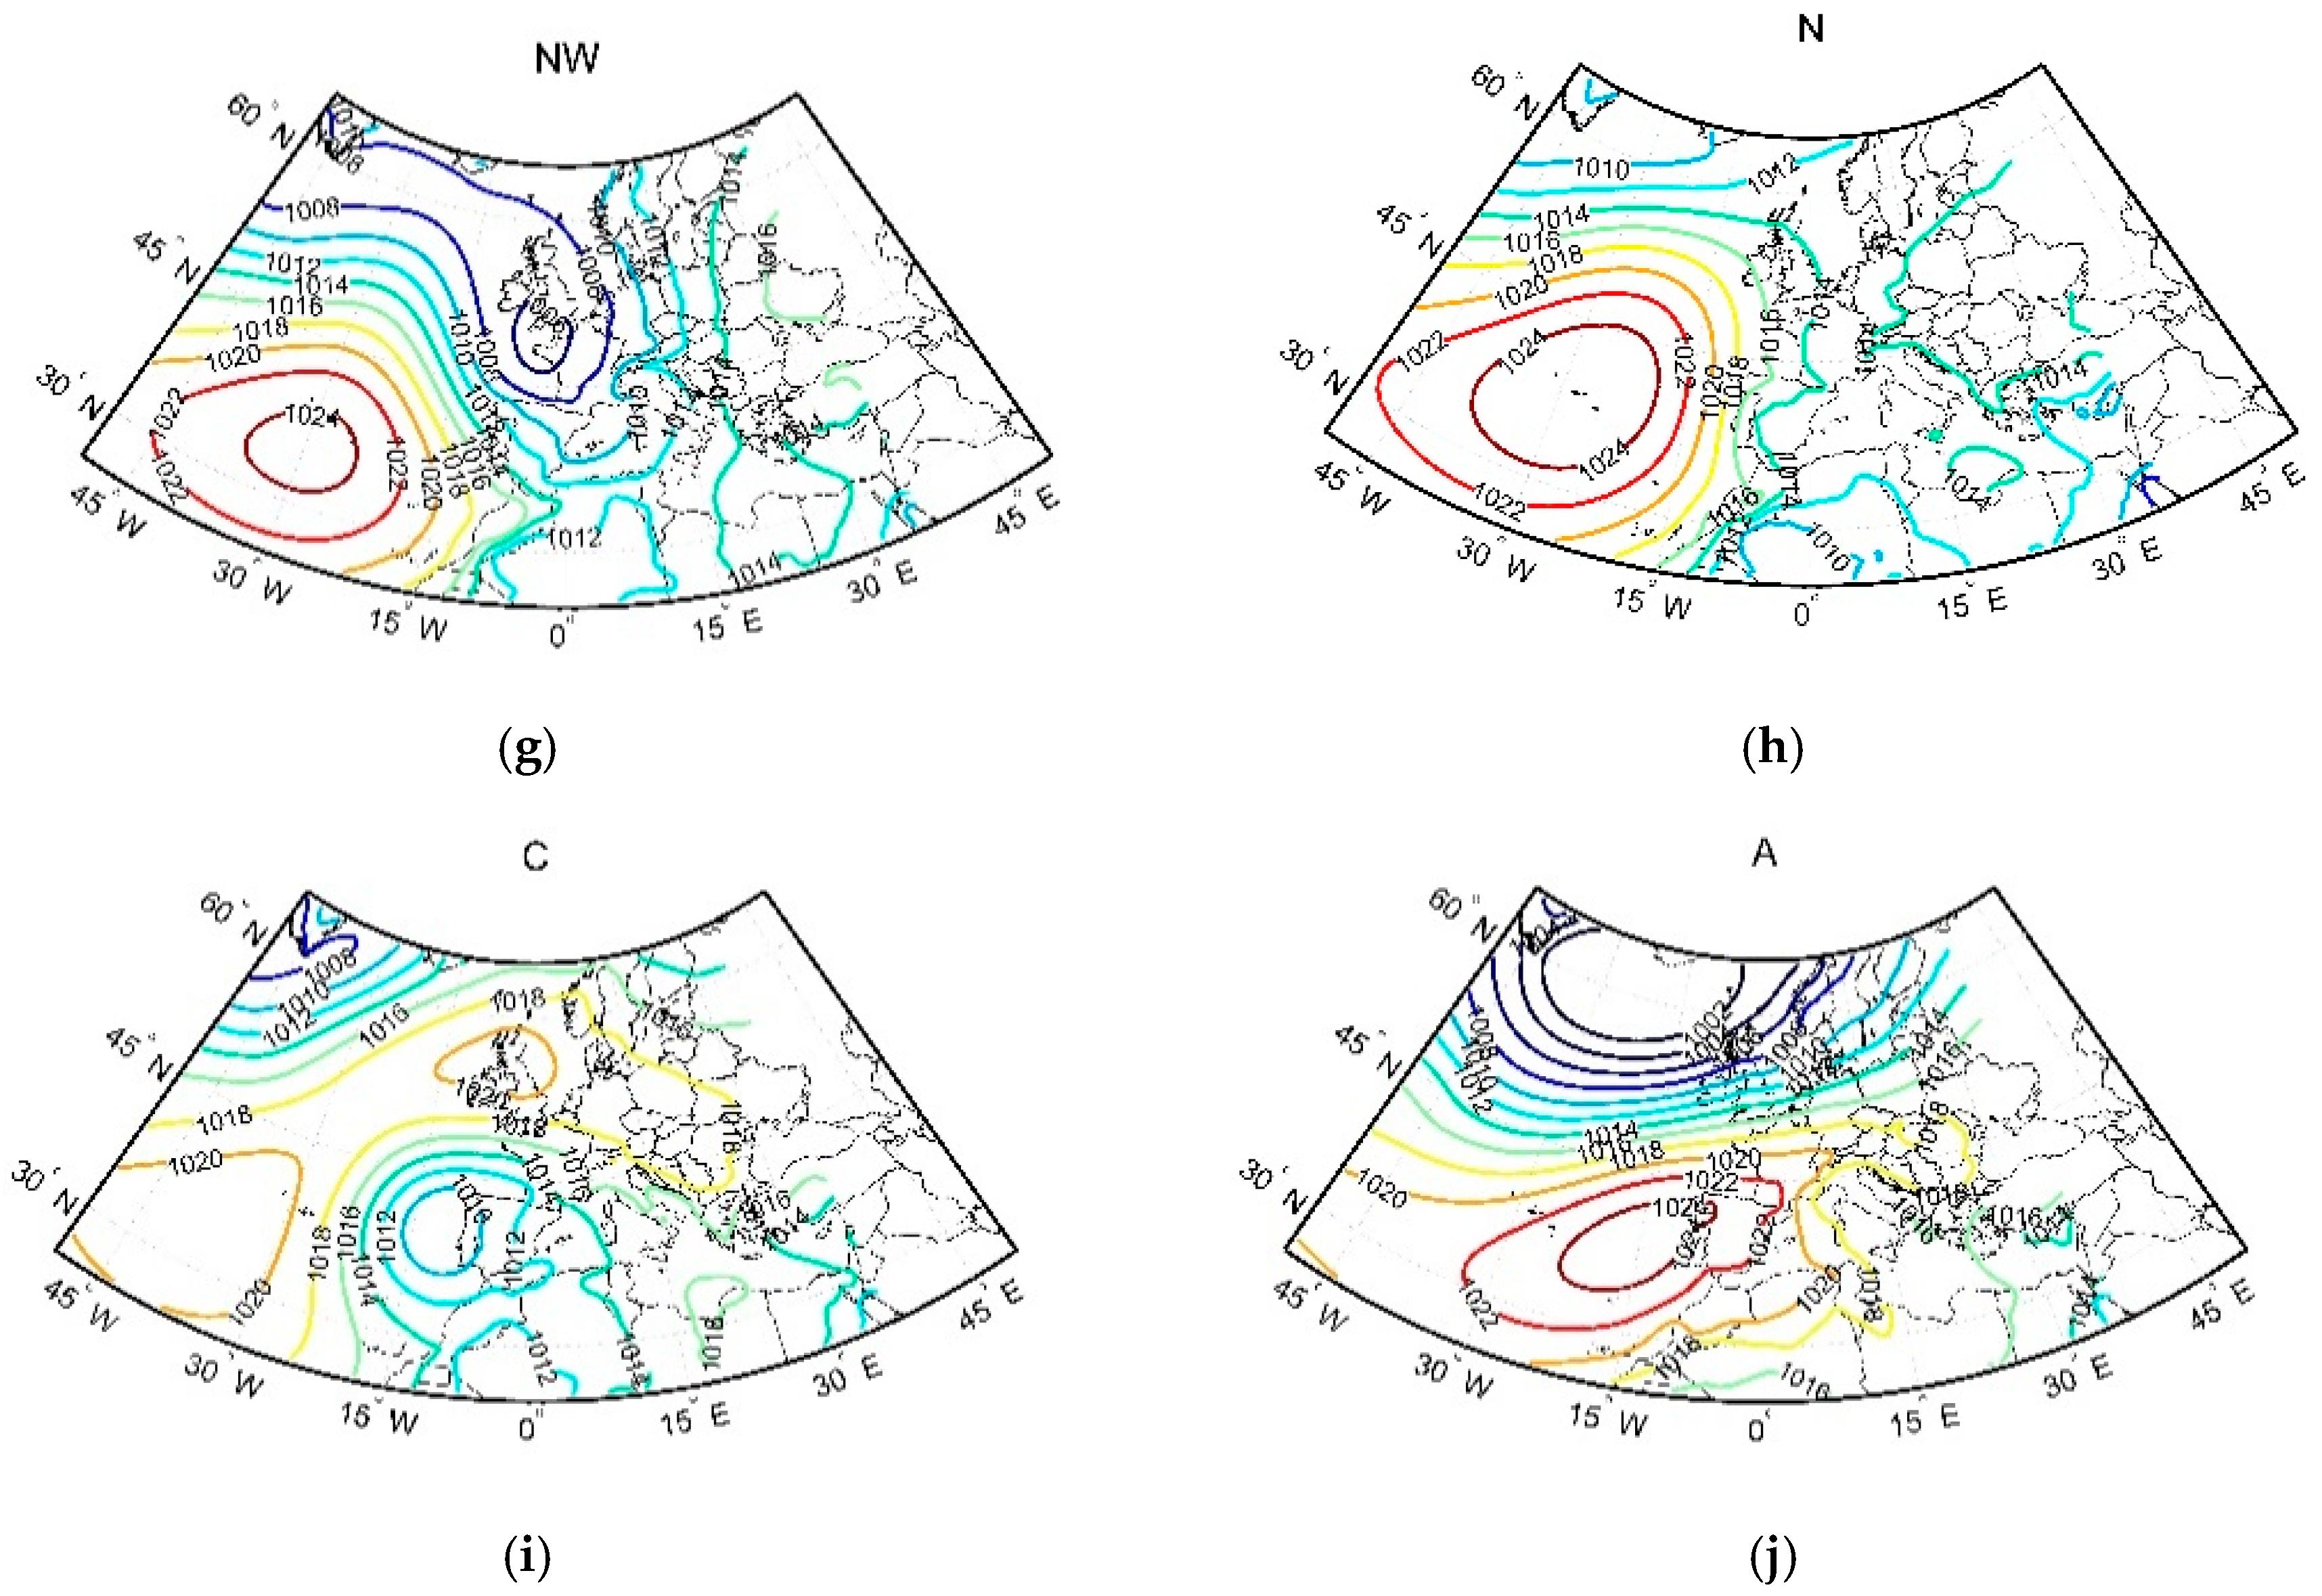
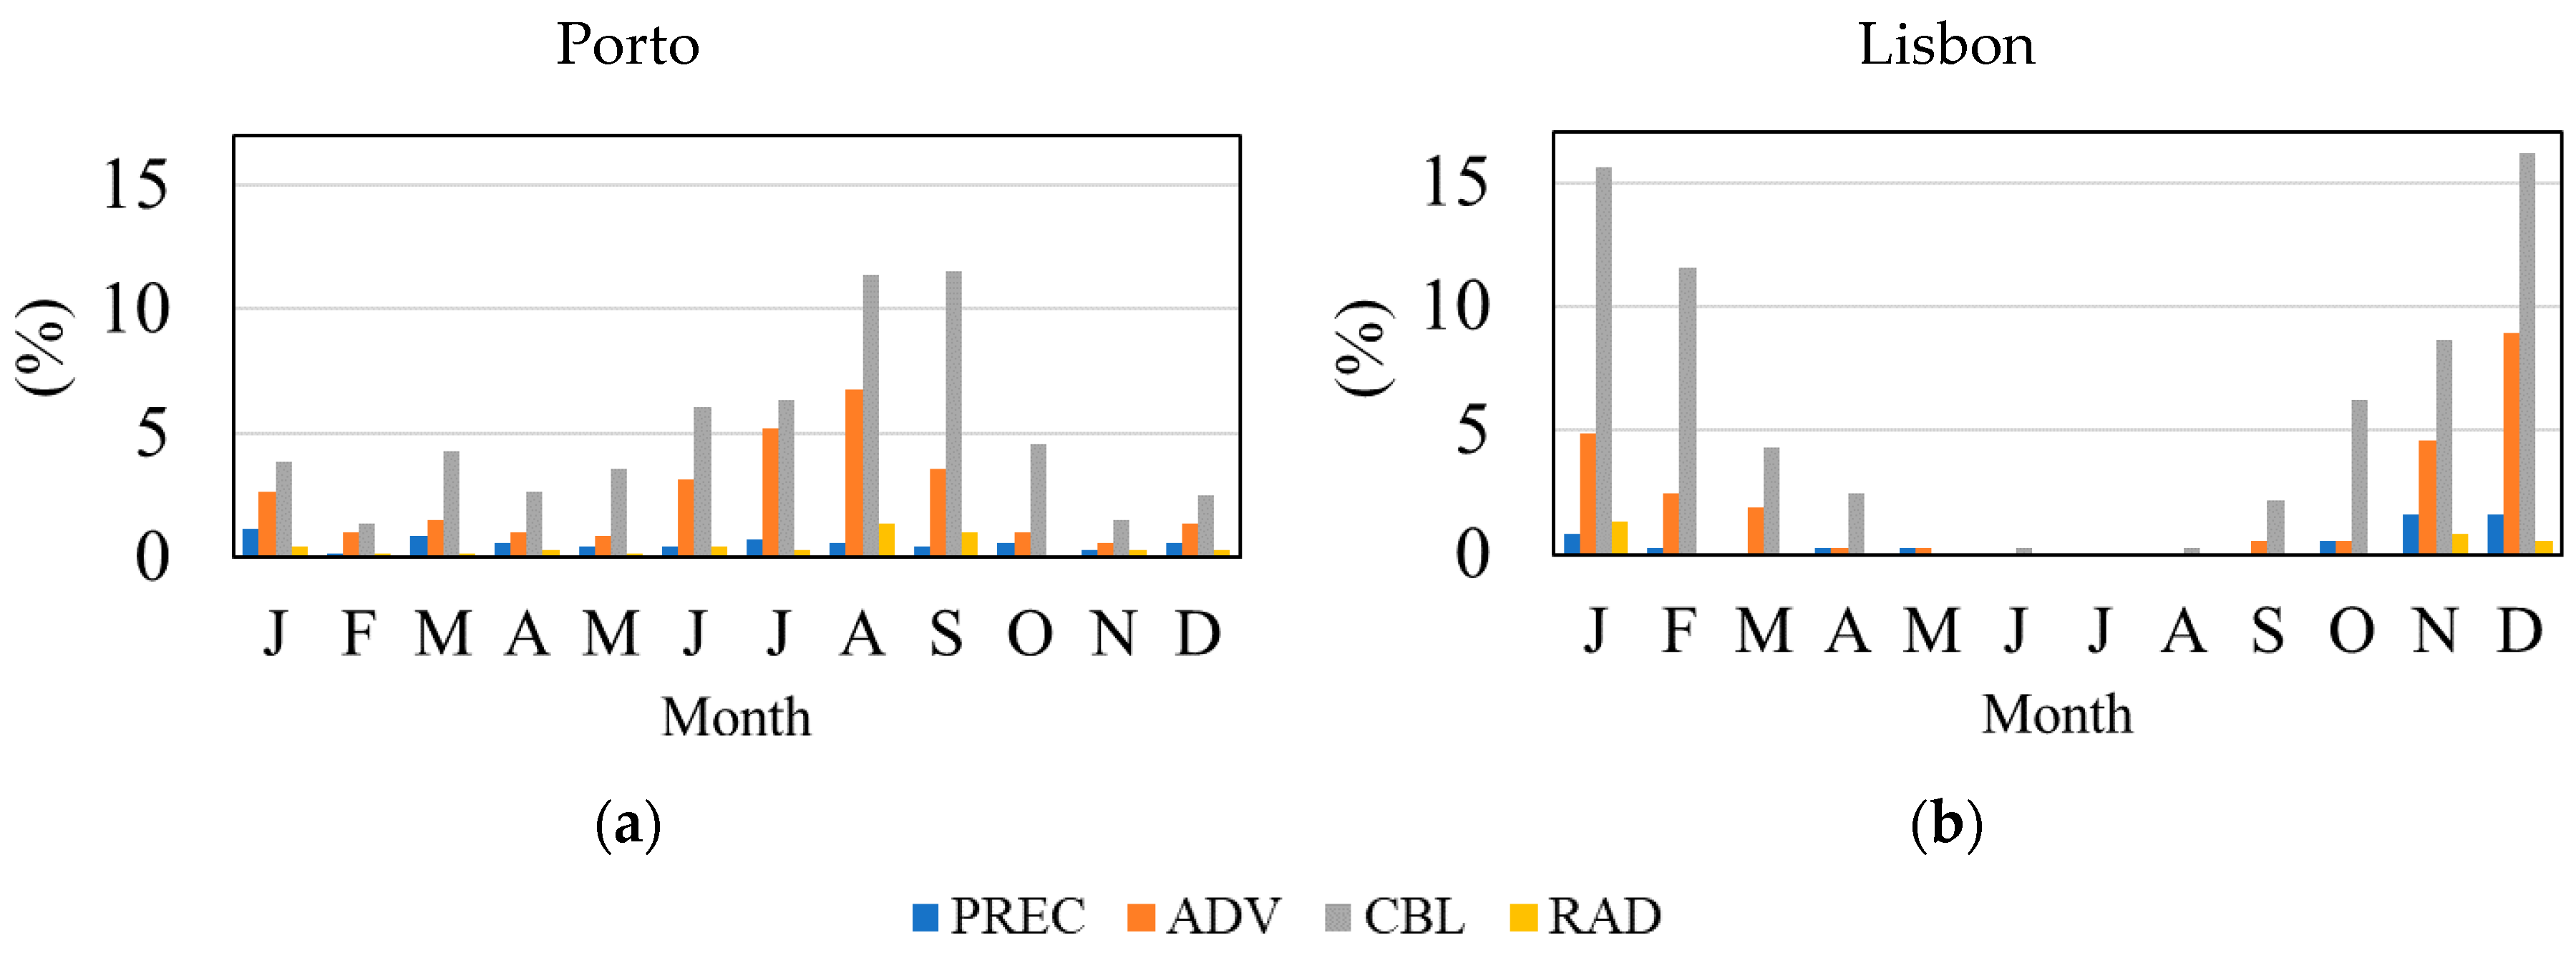
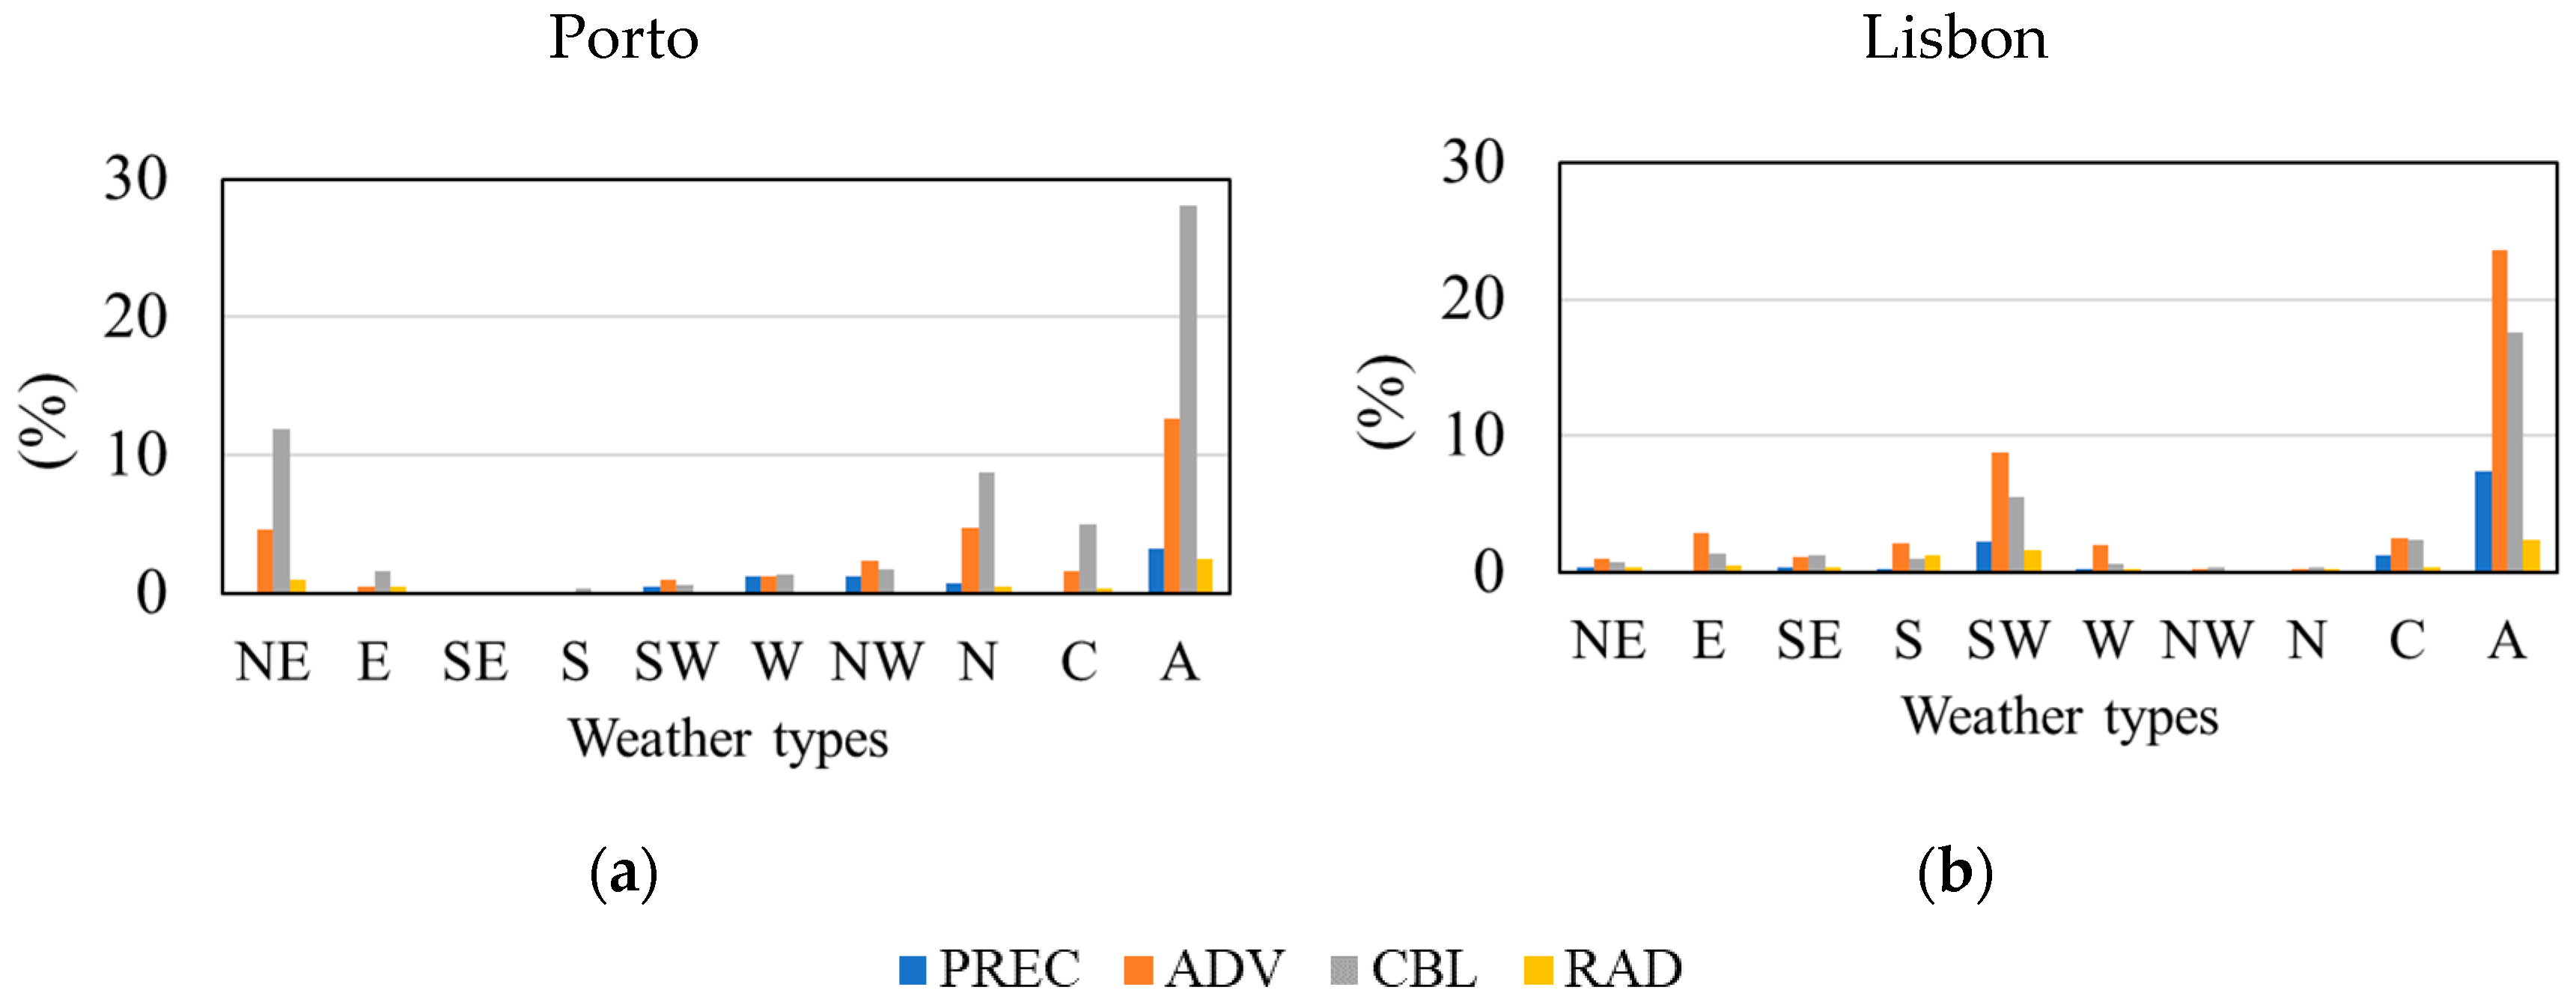
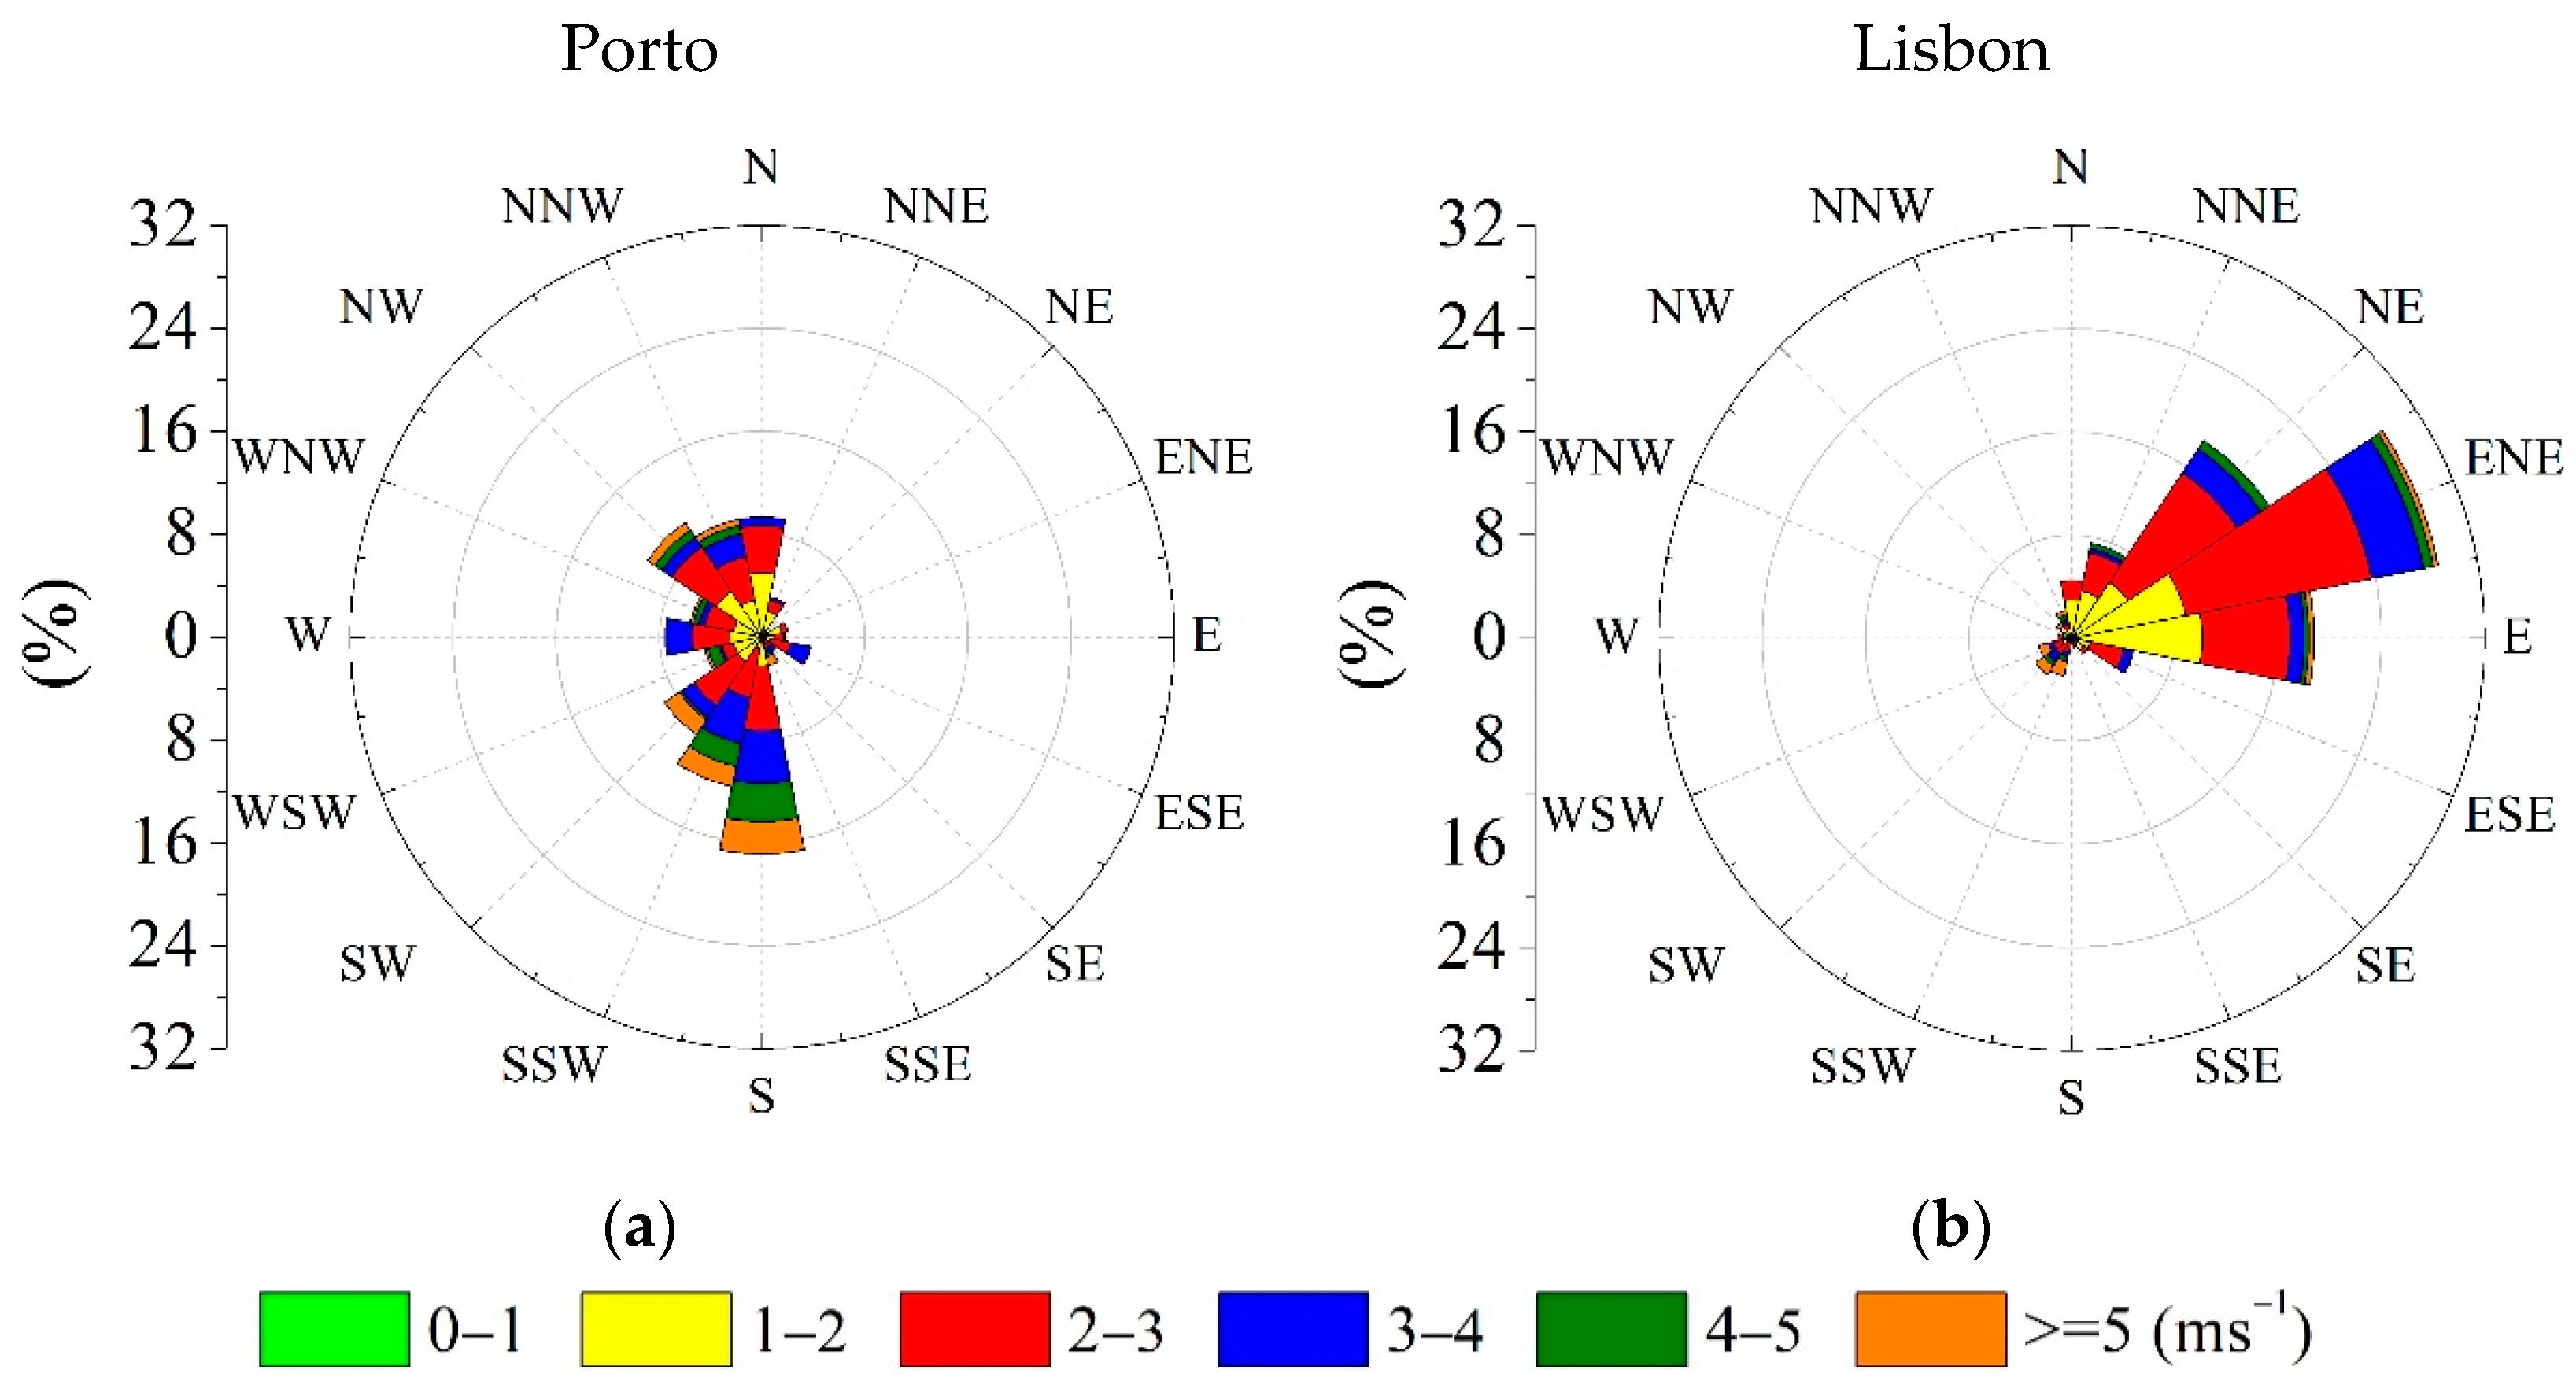
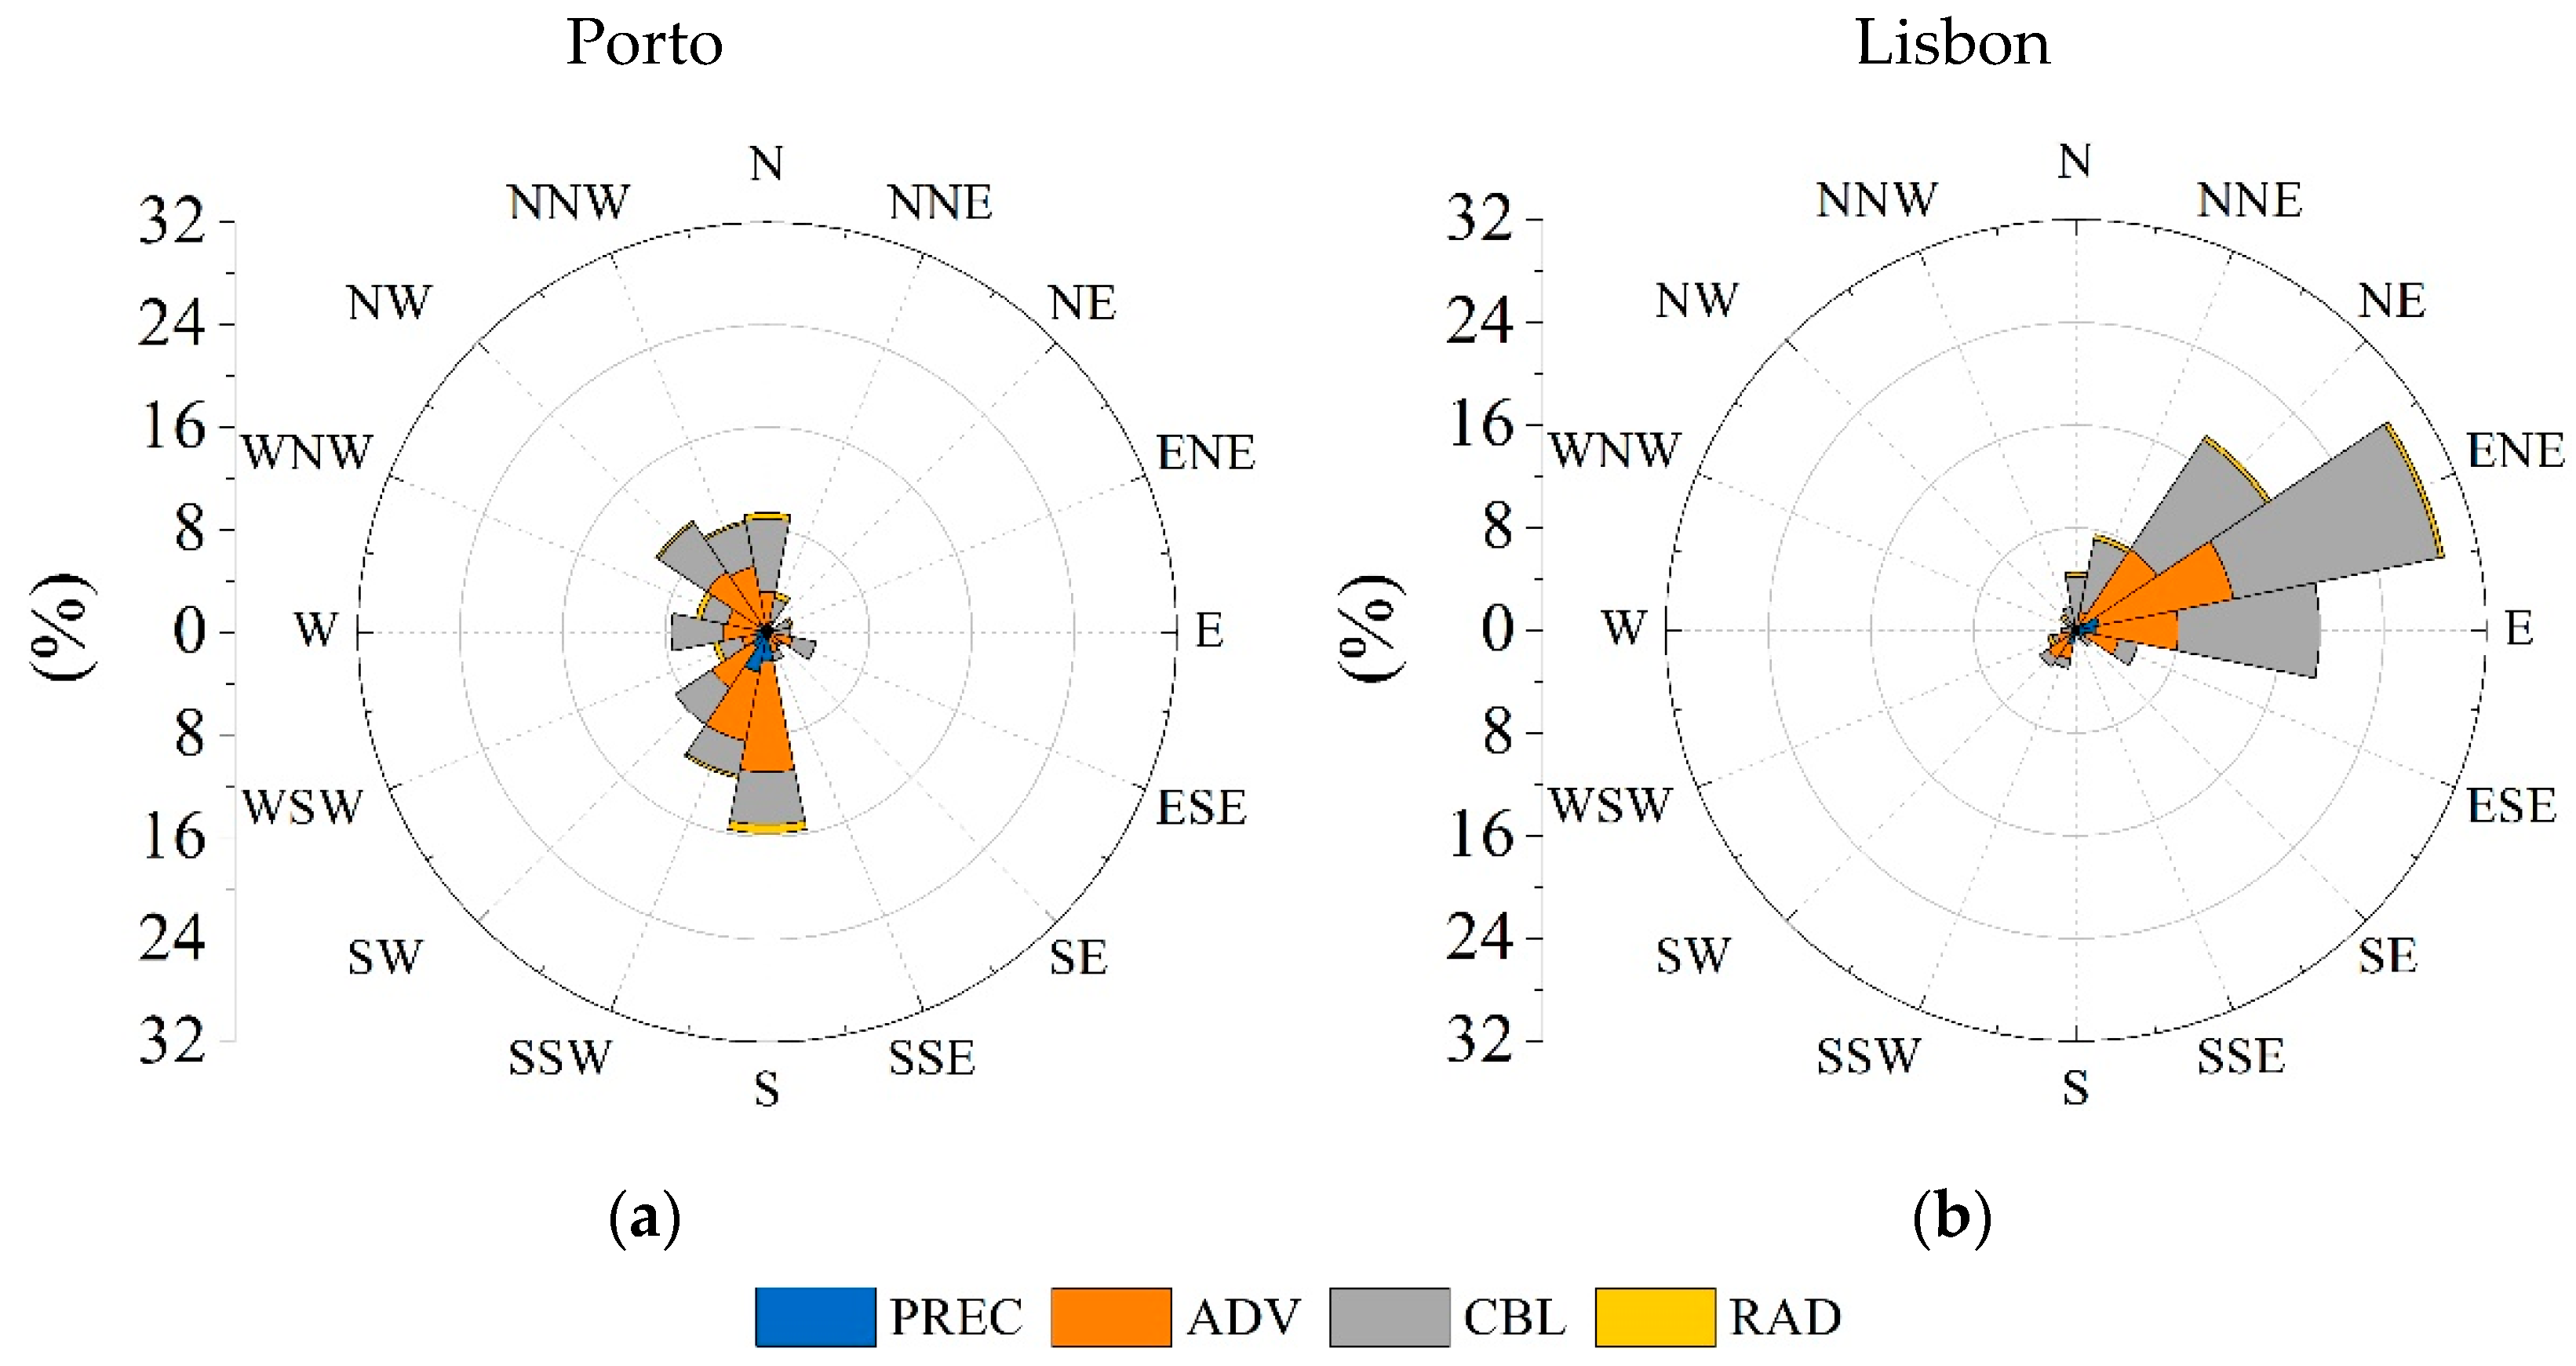
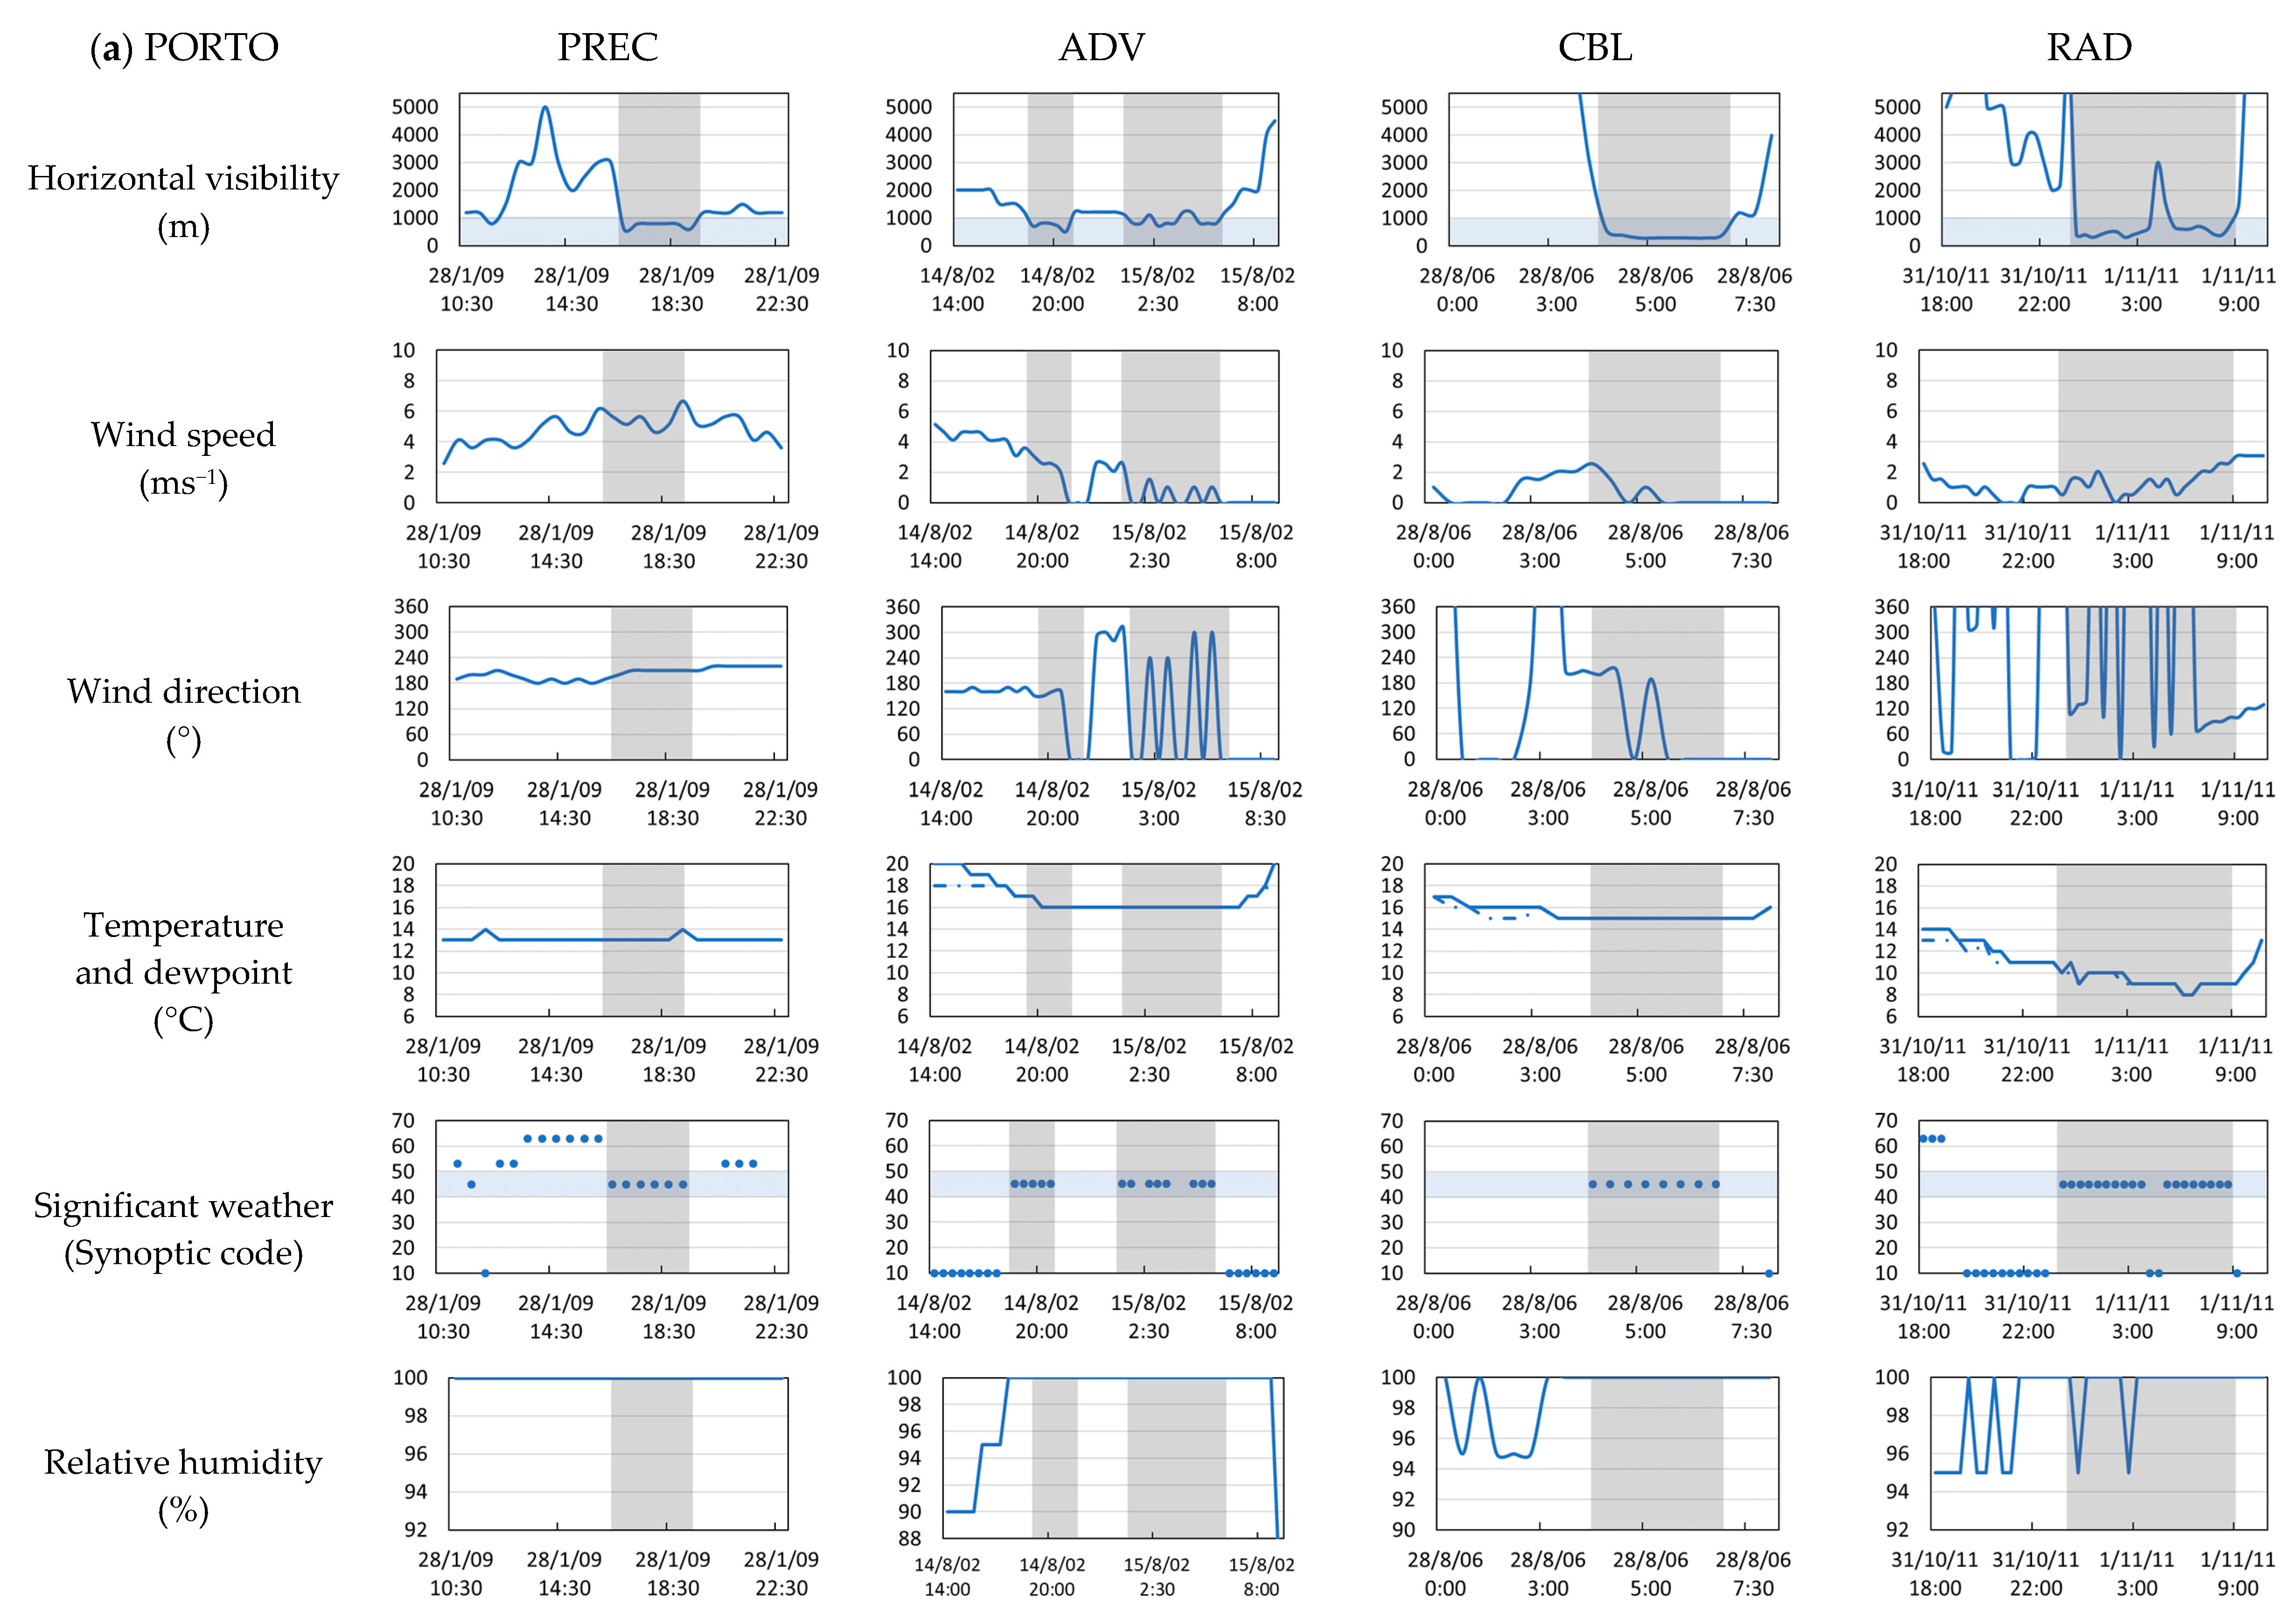
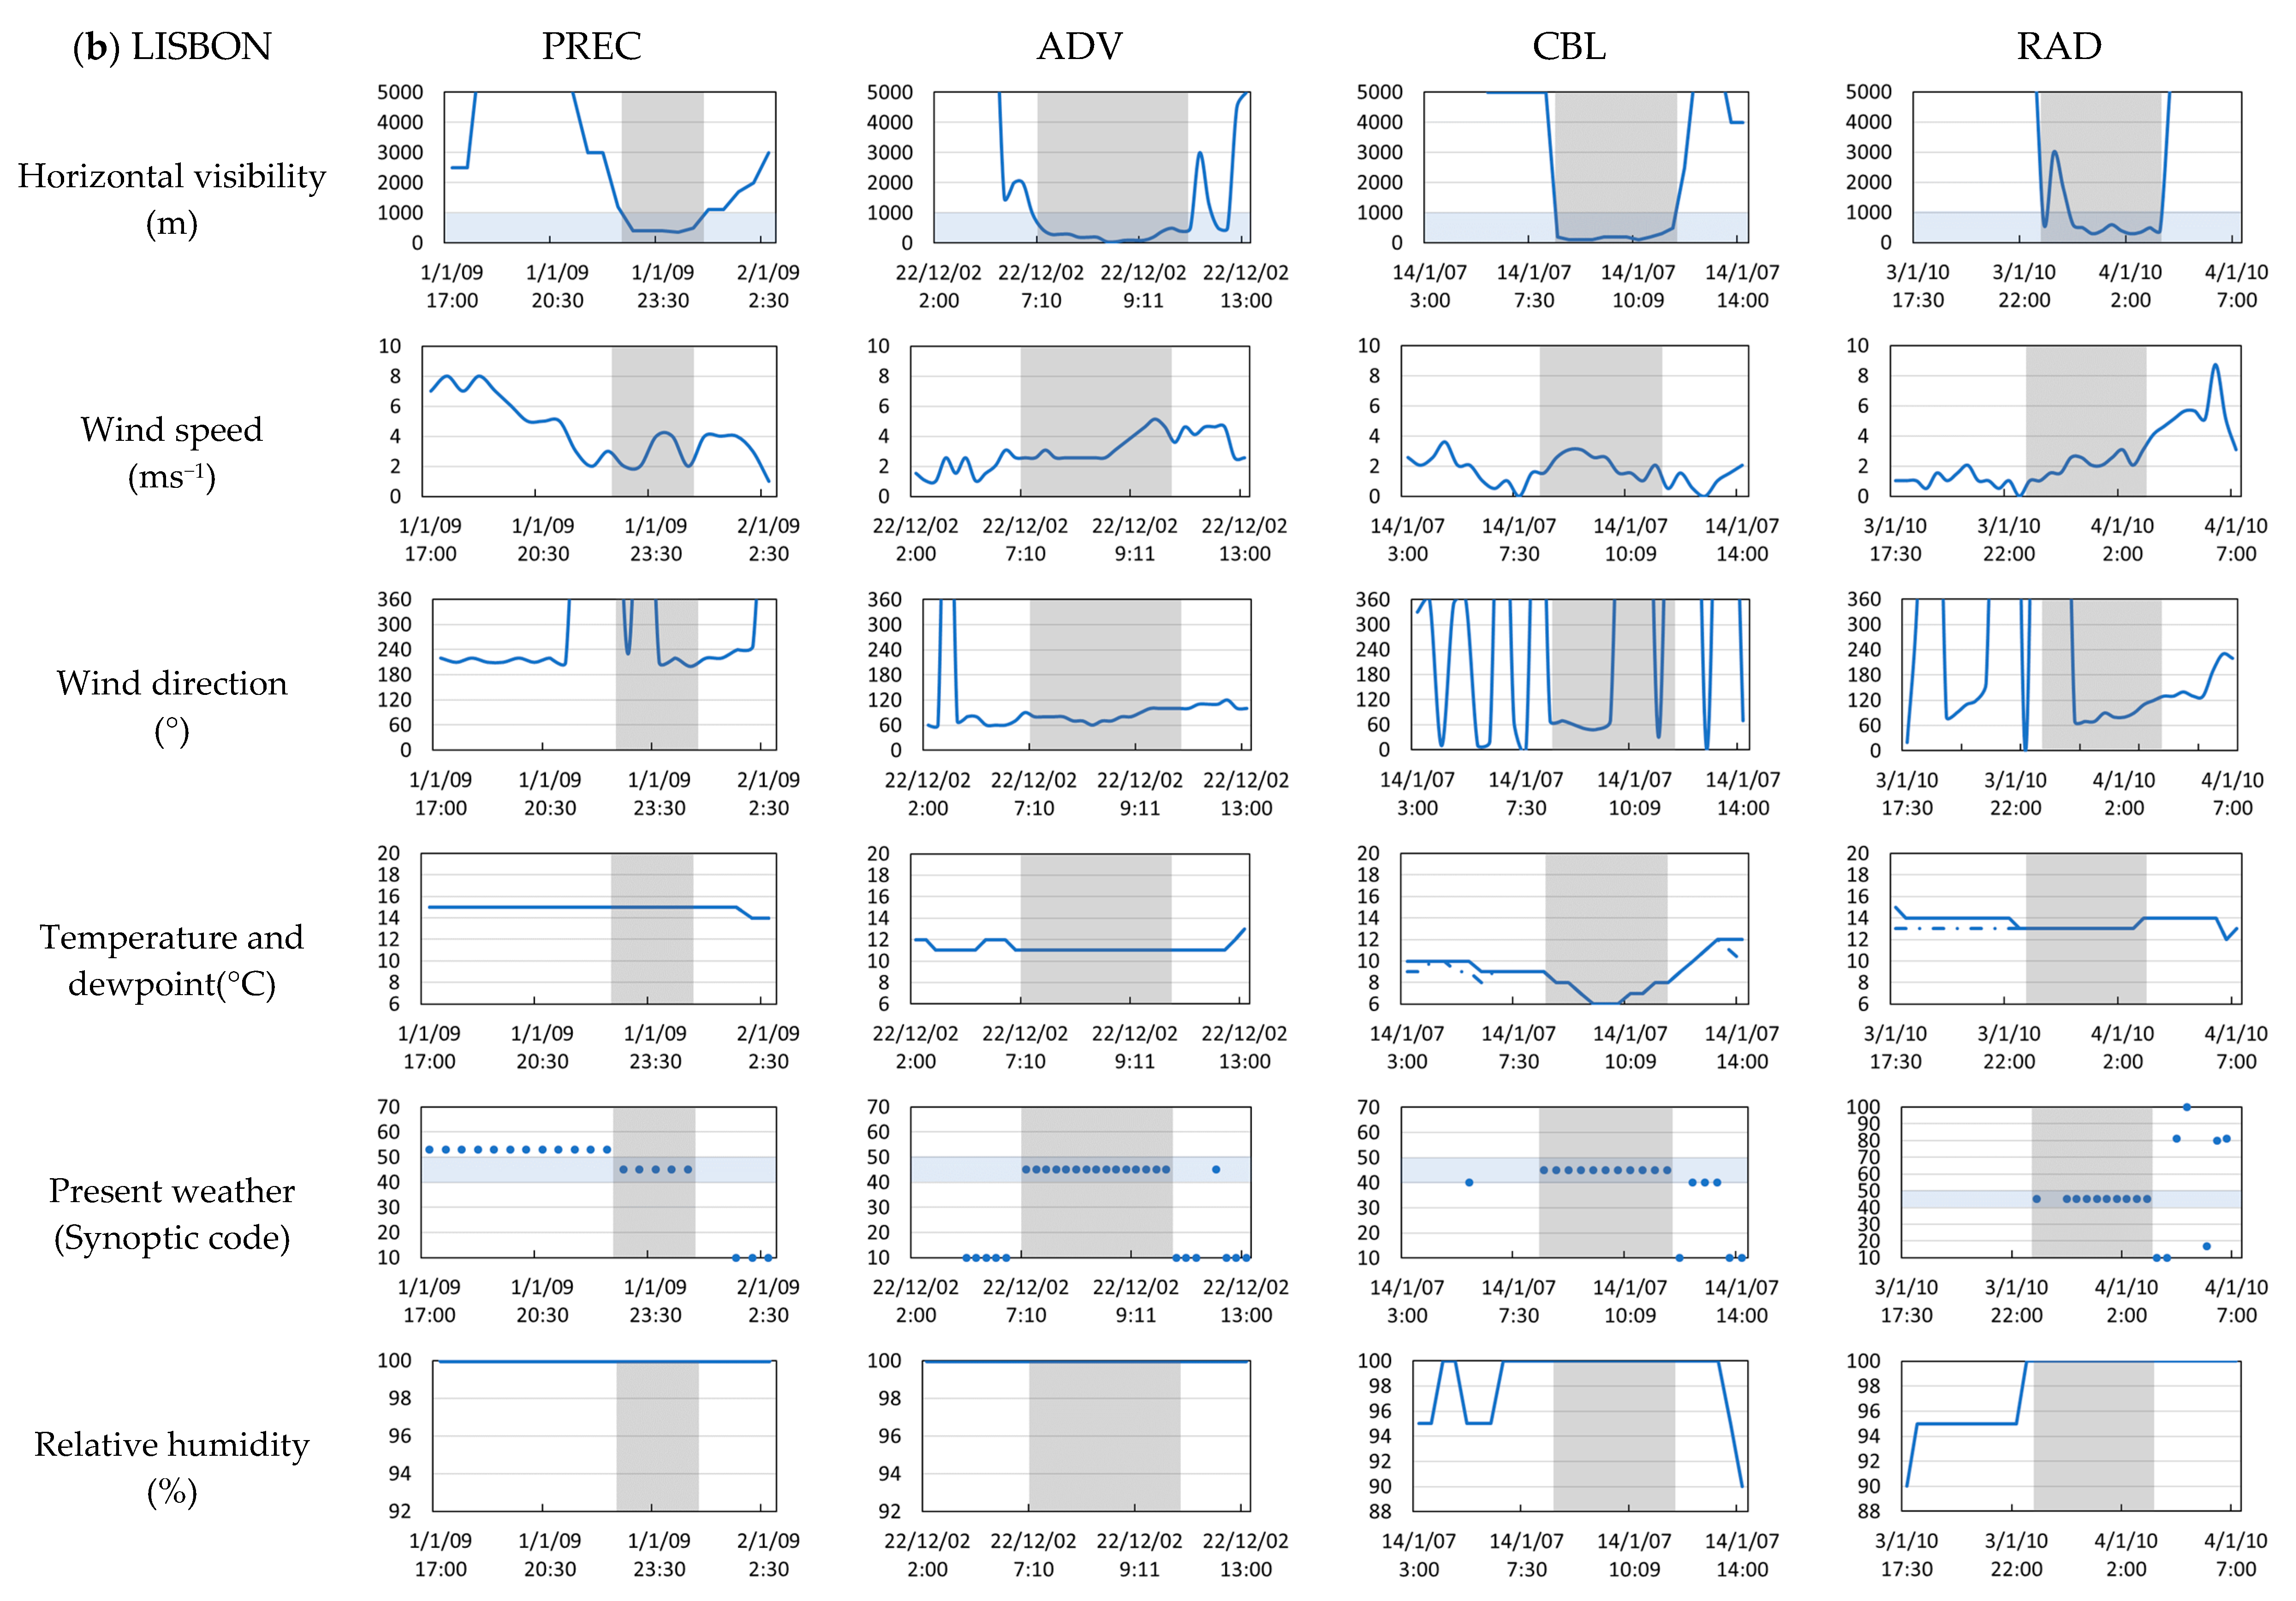
3.4. Large to Local Scale Circulation Analysis

In this section, the fog results are analysed in the context of the large to local scale atmospheric circulation. Local advection is represented by the observed wind at the airports of Porto and Lisbon, whereas the large atmospheric circulation is defined, in each case, by one of the 10 circulation weather types presented in Section 2.2.
Figure 8 shows that fog at Porto and Lisbon is favoured by different weather types. Fog at Porto is favoured in N flows and anticyclonic conditions, and clearly disfavoured in E, SE, S, SW, W, and cyclonic flows. Among the types of fog, the CBL type reveals an expressive occurrence associated to both NE flow and anticyclonic conditions as well. The NE flow is driven by a pressure perturbation (inverted trough) over the Iberian Peninsula under similar stable conditions as the anticyclonic weather type. At Lisbon, the more favoured flow regimes are anticyclonic and SW, where the CBL type stands out as well from the other types of fog. The anticyclonic pattern is not only associated to stable conditions and light winds, but also is characterized by a slight pressure perturbation giving to the circulation a smooth easterly component, favouring the advection from the Tagus estuary. The SW flow is also responsible for the moist air advection driven by the valley, from the sea towards to the airport plateau. As a simple point, 33.5% of the global fog occurrences at Faro were favoured in NE flow and anticyclonic conditions (not shown). However, since no statistics were further developed, the fog type classification was not performed at Faro airport.
After analysing the large-scale setting favourable for fog, it is important to regard the local flow properties that lead to fog in both airports. The local advection analysis is based on the observed wind intensity and direction during fog, as shown in Figure 9. The wind intensity is divided into six classes according to the characterization of the wind in the Section 2.3.
At Porto (Figure 9a), fog is more frequent in low-speed winds between 1 and 2 ms−1 from NW, and from the south between 2 and 3 ms−1. In Lisbon (Figure 9b), fog occurs mostly under low speed NE wind, the wind sector linked to the air advection from the Tagus estuary, which is very infrequent in summer and somewhat frequent in winter. At Porto, fog may arise at higher wind speed than in Lisbon, especially when it is associated with local SW and southerly wind. These local evidences are in line with the large-scale atmospheric flow given by the weather types S and SW, in the northern region of Portugal.
The wind roses shown in Figure 10 combine the wind direction with the frequency of occurrence of each fog type, which clearly indicates that fog is strongly constrained by local circulation. The fog types CBL and ADV are firmly present in the prevailing wind directions at both airports, slightly above 43% and 66% of the fog events at Porto and Lisbon, respectively. Despite the predominance of the CBL type in the fog events, the ADV is the most common fog type in the predominant wind directions at Porto, whereas at Lisbon the CBL remains as the typical fog type. Another interesting feature at Porto is the occurrence of the PREC type bounded to the S-SW quadrant while the RAD type is spread through several wind directions, and at Lisbon the RAD type is aligned to the prevalent direction of the CBL and ADV types (ENE). The PREC type is inexpressive to any wind direction.
In addition to the previous results, observed meteorological parameters are plotted to represent the behaviour of each fog type at both airports. One event of all fog types was selected for each location based on the visual inspection of the differences between the meteorological variables, as evidence of the primary mechanism. The selected criteria were the seasonal occurrence at each location, the weather type associated to the day of occurrence and the fog event must be consistent in terms of persistence (duration longer than two hours) and intensity (marked visibility reduction below 1000 m). Figure 11 allows a detailed analysis of these fog cases, concerning the horizontal visibility, the wind speed and direction, the temperature, the dewpoint, the present weather, and the relative humidity. The horizontal visibility plot is highlighted below 1000 m and the present weather plot indicates the synoptic code form between 40 and 49 (WMO, 2011) [16] reported before and during the fog events. At Porto, the fog event of 2.5 h on 28 January 2009 is classified as PREC, the event of 14 August 2002 was ADV and 2 h long, the 2.65 h-long event of 28 August 2006 was CBL type and the event of 1 November 2011 was RAD type and 9.2 h long. At Lisbon, the two-hour fog event of 1 January 2009 was chosen as an example of the PREC type. The event of 22 February 2002, which was 4.8 h long is as an example of the ADV type, the event of 3.4 h on 14 January 2007 was CBL and the event of 3 January 2010 was RAD type and 3.8 h long.
The present weather plots for PREC type show that the fog is preceded by drizzle during the five hours prior to the onset at both locations. At Porto, the precipitation changes to rain three hours before the onset, increasing the liquid water at surface available to evaporate. Precipitation before onset is a distinct feature of the PREC type. Simultaneously, in both locations, the duration of the PREC event is shorter than the other types. The ADV type plots show evidence of two different mechanisms favouring the formation of fog. Mist is reported before the onset at Porto and at Lisbon, however, steady southerly wind at Porto along with the cooling and increase of relative humidity followed by saturation leads to local condensation and results in fog formation. At Lisbon, the saturated northeast inflow from the Tagus estuary and the unchanged temperature suggests a distant formation of fog and further advection. The CBL type is characterized by a sudden reduction of the horizontal visibility after four hours of mild wind conditions before the onset. Regarding the RAD type, the horizontal visibility reduces steeply though the wind is lighter, even almost calm.
The behaviour of each fog type may be interpreted by the deviation of the onset and dissipation from the sunrise and sunset, respectively, and from the duration, the horizontal visibility, and the intensity (minimum visibility). These are listed in Table 4. In general, the formation of fog occurs before sunrise, where the RAD type forms earlier than the other types and dissipates after the sunrise alongside with the CBL type. Although less frequent than the CBL and the ADV types, the RAD type lasts longer in both locations: 3.6 h long at Porto and 3.8 h at Lisbon. According to the horizontal visibility values, the fog events at Lisbon are denser, except those associated to the PREC type. At Lisbon, the visibility median associated to the ADV type is 388.5 m against the 586.5 m at Porto. The CBL and RAD types reduces the visibility by 200 m more in half of the events than at Porto, roughly to 300 m, and the intensity of 25% of the CBL and the RAD events reduces the visibility to 150 m, against the 300 m of the visibility’s first quartile at Porto.
At Porto, the CBL type produces the stronger fog events with an average of 217.8 m of minimum visibility. At Lisbon, the minimum visibility average associated to the CBL type is 232.5 m.
In short, the results are as expected: fog requires weak winds, both synoptic and local, as observed in anticyclonic weather, and moist air is also present over the estuary or coastal region and persistent cooling, as at the end of the night.

4. Conclusions

Fog is a difficult problem for weather forecasts due to its dependency on small scale processes and disproportionate impact in open air activities, especially in aviation but also in all forms of traffic. In a small country such as Portugal, which can be characterized by a Mediterranean climate, the occurrence of fog varies greatly. In the present work, METAR datasets from the airports of Porto, Lisbon and Faro were used to characterize fog events. The fog phenomena reveal distinct characteristics among the three airports. The frequency of fog occurrence decreases from north to south, with an annual average of 35.4 foggy days at Porto and 18.8 days at Lisbon in the period 2002 to 2018. The fog at Faro is a very rare phenomenon, with only 60 daily events in the same period; thus, it was not analysed in this study. Fog is a predominant winter phenomenon at Porto and a summer one at Lisbon. However, fog events at Lisbon are more daily recurrent rather than Porto.
In the case of Lisbon, fog was often associated to a conceptual model of fog formation in the Tagus estuary followed by its slow advection towards the airport [7]. In the case of Porto, no such information existed, but reports pointed out to the highly selective local wind distribution required for fog, as an indication of the dominant role of local advection.
The synoptic setting favourable for fog at two locations is unsurprising. In both locations and all seasons, fog is favoured by anticyclonic weather, where low wind speeds are seen. At Porto, in summer, fog events also occur under synoptic prevailing N-NE flows, when local winds blow from NW or SE. Large and local scales reveal that N and NW regimes are responsible for the moisture advection from the Ocean that favours the fog formation. At Lisbon, in winter, fog is also frequent under synoptic SW flow, but only when local winds favour advection from the NE, where the Tagus estuary is located. The channelling effects of the advection from the sea, by the orography at SW, are the link between the fog formation and the SW flow.
On average, the fog events are no longer than 3 h, in both airports. Of all events, 10.4% last more than 6 h at Lisbon, while at Porto these events are 6%.
To feature the underlying processes of the fog formation, the classification algorithm proposed by Tardif and Rasmussen [1] was applied. Based on the observed wind statistics, at both airports, the wind intensity threshold was set to 1.5 ms−1 as a key parameter of the classification algorithm. In this way, the separation of windy events from the calm ones as a first criteria of the primary mechanism diagnosis is followed. The primary mechanisms are classified into five types (PREC, ADV, CBL, RAD and EVP). Whenever the primary mechanism was inconclusive, the fog event was classified as UNK. A locally adapted classification algorithm allowed us to identify a fog formation primary mechanism for 96.9% and 98.9% of the fog events at Porto and Lisbon, respectively. Cloud-base lowering was the most frequent, with 57.7% of the events at Porto and 66.9% at Lisbon, followed by advection (27.8% and 24%), precipitation (6.7% and 5.3%) and radiation (4.7% and 2.7%). No event of the evaporation type was detected, and the unknown type corresponded to 3.5% of the fog events at Porto and 1.1% at Lisbon.
Concerning the local factors that favour the fog formation, local winds play a major role in the delicate equilibrium between the turbulent mixture and the dispersion of water droplets in suspension, given the presence of moisture and near surface cooling. The CBL and the ADV fog types gather 43% and 66% of the wind reported among all fog events at Porto and Lisbon, respectively. The PREC fog type emerges in the S-SW quadrant as the third fog type at Porto whereas the RAD type is linked to several wind directions. At Lisbon, the local wind associated with the RAD fog type follows the predominant flow associated with the CBL and ADV types (ENE), while the PREC type is barely inexistent.
The minimum horizontal visibility was used as metric of fog intensity for all fog types. At Porto, the lowest minimum visibility is associated to the CBL fog type, and the strongest fog type event at Lisbon is the CBL. In general, the fog events at Lisbon are stronger than Porto, except the fog events associated to the PREC type which are similar in both locations.
This study focused on the international airports of Porto and Lisbon and has shown the importance of better understanding the local mechanisms that contribute to the formation of fog. The detailed analysis of meteorological variables enables a reliable diagnosis of the local atmosphere conditions prior to the formation of different types of fog. Therefore, this study shows promising results for a numerical weather model leveraging local fog forecasts.
The conceptual model applied by Teixeira and Miranda [7] at Lisbon airport has proved to be skilful in fog prediction, however the prediction relies on 19% of the fog events. To better understand the main physical mechanisms driving the diverse types of fog in Lisbon and Porto, it is of paramount relevance to perform high resolution regional earth system modelling simulations. These would allow us to represent at km-scale the local to regional atmospheric flow and the highly relevant coupling processes between the atmosphere, ocean/lake and land that are important in the locations here studied.

Author Contributions

Conceptualization, P.M.P.G., P.M.M.S., R.M.C. and A.M.R.; software, P.M.P.G.; analysis, P.M.P.G., P.M.M.S. R.M.C. and A.M.R.; writing—original draft preparation, P.M.P.G. and P.M.M.S.; writing—review and editing, P.M.P.G., P.M.M.S. R.M.C. and A.M.R.; supervision, P.M.M.S., R.M.C. and A.M.R. All authors have read and agreed to the published version of the manuscript.

Funding

This research received no external funding.

Acknowledgments

The authors would like to thank to Pedro Viterbo and Paulo Narciso (Portuguese Institute for Sea and Atmosphere) for providing METAR and SPECI datasets from Porto, Lisbon, and Faro airports. Pedro M.M. Soares and Rita M. Cardoso wish to acknowledge the projects LEADING and Instituto Dom Luiz (UIDB/50019/2020), both financed by the Fundação para a Ciência e Tecnologia. A.M. Ramos was supported by the Scientific Employment Stimulus 2017 from Fundação para a Ciência e a Tecnologia (FCT, CEECIND/00027/2017).

Conflicts of Interest

The authors declare no conflict of interest.

References

  1. Tardif, R.; Rasmussen, R.M. Event-based climatology and typology of fog in the New York City region. J. Appl. Meteorol. Climatol. 2007, 46, 1141–1168. [Google Scholar] [CrossRef] [Green Version]
  2. World Meteorological Oranization. WMO Guide to Meteorological Instruments and Methods of Observation; WMO: Geneva, Switzerland, 2017; Available online: www.wmo.int (accessed on 3 March 2020).
  3. Willett, H.C. Fog and Haze, Their Causes, Distribution, and Forecasting. Mon. Weather Rev. 1928, 56, 435–468. [Google Scholar] [CrossRef]
  4. Byers, H.R. General Meteorology, 3rd ed.; McGraw-Hill: New York, NY, USA, 1959; 481p. [Google Scholar]
  5. Houssos, E.E.; Lolis, C.J.; Gkikas, A.; Hatzianastassiou, N.; Bartzokas, A. On the atmospheric circulation characteristics associated with fog in Ioannina, north-western Greece. Int. J. Climatol. 2012, 32, 1847–1862. [Google Scholar] [CrossRef]
  6. Stolaki, S.N.; Kazadzis, S.A.; Foris, D.V.; Karacostas, T.S. Fog characteristics at the airport of Thessaloniki, Greece. Nat. Hazards Earth Syst. Sci. 2009, 9, 1541–1549. [Google Scholar] [CrossRef] [Green Version]
  7. Teixeira, J.; Miranda, P.M.A. Fog prediction at Lisbon airport using a one-dimensional boundary layer model. Meteorol. Appl. 2001, 8, 497–505. [Google Scholar] [CrossRef]
  8. Belo-Pereira, M.; Santos, J.A. A persistent wintertime fog episode at Lisbon airport (Portugal): Performance of ECMWF and AROME models. Meteorol. Appl. 2016, 233, 353–370. [Google Scholar] [CrossRef] [Green Version]
  9. Tardif, R.; Rasmussen, R.M. Process-oriented analysis of environmental conditions associated with precipitation fog events in the New York City region. J. Appl. Meteorol. Climatol. 2008, 47, 1681–1703. [Google Scholar] [CrossRef] [Green Version]
  10. Bergot, T. Quality assessment of the cobel-isba numerical forecast system of fog and low clouds. Pure Appl. Geophys. 2007, 164, 1265–1282. [Google Scholar] [CrossRef]
  11. Haeffelin, M.; Dupont, J.; Boyouk, N.; Baumgardner, D.; Gomes, L.; Roberts, G.; Elias, T. A Comparative Study of Radiation Fog and Quasi-Fog Formation Processes During the ParisFog Field Experiment 2007. Pure Appl. Geophys. 2013, 170, 2283–2303. [Google Scholar] [CrossRef]
  12. Terradellas, E.; Cano, D. Implementation of single-column model for fog and low cloud forecasting at central Spanish airports. Pure Appl. Geophys. 2007, 164, 1327–1345. [Google Scholar] [CrossRef]
  13. van Oldenborgh, G.J.; Yiou, P.; Vautard, R. On the roles of circulation and aerosols in the decline of mist and dense fog in Europe over the last 30 years. Atmos. Chem. Phys. 2010, 10, 4597–4609. [Google Scholar] [CrossRef] [Green Version]
  14. Policarpo, C.; Salgado, R.; Costa, M.J. Numerical simulations of fog events in southern Portugal. Adv. Meteorol. 2017. [Google Scholar] [CrossRef]
  15. Egli, S.; Thies, B.; Bendix, J. A spatially explicit and temporally highly resolved analysis of variations in fog occurrence over Europe. Q. J. R. Meteorol. Soc. 2019, 145, 1721–1740. [Google Scholar] [CrossRef]
  16. Vautard, R.; Yiou, P.; Van Oldenborgh, G.J. Decline of fog, mist and haze in Europe over the past 30 years. Nat. Geosci. 2009, 2, 115–119. [Google Scholar] [CrossRef]
  17. Akimoto, Y.; Kusaka, H. A climatological study of fog in Japan based on event data. Atmos. Res. 2015, 151, 200–211. [Google Scholar] [CrossRef]
  18. Belorid, M.; Lee, C.B.; Kim, J.C.; Cheon, T.H. Distribution and long-term trends in various fog types over South Korea. Theor. Appl. Climatol. 2015, 22, 699–710. [Google Scholar] [CrossRef]
  19. Gu, Y.; Kusaka, H.; Tan, J. Impacts of urban expansion on fog types in Shanghai, China: Numerical experiments by WRF model. Atmos. Res. 2019, 220, 57–74. [Google Scholar] [CrossRef]
  20. Trigo, R.M.; DaCamara, C.C. Circulation weather types y their influence on the precipitation regime in Portugal. Int. J. Climatol. 2000, 20, 1559–1581. [Google Scholar] [CrossRef]
  21. Ramos, A.M.; Ramos, R.; Sousa, P.; Trigo, R.M.; Janeira, M.; Prior, V. Cloud to ground lightning activity over Portugal and its association with circulation weather types. Atmos. Res. 2011, 101, 84–101. [Google Scholar] [CrossRef]
  22. WMO. Manual on Codes (WMO-No.306); Volume I, Anex 2, Part-A; WMO: Geneva, Switzerland, 2019. [Google Scholar]
  23. WMO. Meteorological service for international air navigation. In Technical Regulations (WMO-No. 49); WMO: Geneva, Switzerland, 2008; Volume II. [Google Scholar]
  24. Huth, R. A circulation classification scheme applicable in GCM studies. Theor. Appl. Climatol. 2000, 67, 1–18. [Google Scholar] [CrossRef]
  25. Ramos, A.M.; Pires, A.C.; Sousa, P.M.; Trigo, R.M. The use of circulation weather types to predict upwelling activity along the western Iberian Peninsula coast. Cont. Shelf Res. 2013, 69, 38–51. [Google Scholar] [CrossRef]
  26. Jones, P.D.; Osborn, T.J.; Harpham, C.; Briffa, K.R. The development of Lamb weather types: From subjective analysis of weather charts to objective approaches using reanalyses. Weather 2014, 69, 128–132. [Google Scholar] [CrossRef] [Green Version]
  27. Mellado-Cano, J.; Barriopedro, D.; García-Herrera, R.; Trigo, R.M.; Álvarez-Castro, M.C. Euro-Atlantic Atmospheric Circulation during the Late Maunder Minimum. J. Clim. 2018, 31, 3849–3863. [Google Scholar] [CrossRef]
  28. Mellado-Cano, J.; Barriopedro, D.; García-Herrera, R.; Trigo, R.M. New observational insights into the atmospheric circulation over the Euro-Atlantic sector since 1685. Clim. Dyn. 2020, 54, 823–841. [Google Scholar] [CrossRef] [Green Version]
  29. Lorenzo, M.N.; Ramos, A.M.; Taboada, J.J.; Gimeno, L. Changes in present and future circulation types frequency in northwest Iberian Peninsula. PLoS ONE 2011, 6, e16201. [Google Scholar] [CrossRef] [PubMed]
  30. Lamb, H.H. British Isles weather types and a register of the daily sequence of circulation patterns. Geophys. Mem. 1972, 116, 85. [Google Scholar]
  31. Jenkinson, A.F.; Collison, F.P. An Initial Climatology of Gales over the North Sea. In Synoptic Climatology Branch Memorandum; Meteorological Office: Bracknell, UK, 1977; p. 62. [Google Scholar]
  32. Hess, P.; Brezowsky, H. Katalog der Grosswetterlagen Europas (1881–1976). In Berichte Deutsche Wetterdienstes; Nr 113 Bd. 15; Selbstverlag des Deutschen Wetterdienstes: Offenbach am Main, Germany, 1977. [Google Scholar]
  33. Dee, D.P.; Uppala, S.M.; Simmons, A.J.; Berrisford, P.; Poli, P.; Kobayashi, S.; Andrae, U.; Balmaseda, M.A.; Balsamo, G.; Bauer, P.; et al. The ERA-Interim reanalysis: Configuration and performance of the data assimilation system. Q. J. R. Meteorol. Soc. 2011, 137, 553–597. [Google Scholar] [CrossRef]
  34. van Schalkwyk, L.; Dyson, L.L. Climatological characteristics of fog at cape town international airport. Weather Forecast. 2013, 28, 631–646. [Google Scholar] [CrossRef] [Green Version]
  35. Izett, J.G.; van Wiel, B.J.H.; Baas, P.; van Hooft, J.A.; Schulte, R.B. Dutch fog: On the observed spatio-temporal variability of fog in the Netherlands. Q. J. R. Meteorol. Soc. 2019, 145, 2817–2834. [Google Scholar] [CrossRef]
Figure 1. Location of the Portuguese international airports.
Atmosphere 11 01239 g001
Figure 2. The ERA-Interim mean sea level pressure for each of the 10 weather types in 1979–2011: (a) north (N), (b) northeast (NE), (c) east (E), (d) southeast (SE), (e) south (S), (f) southwest (SW), (g) west (W), (h) northwest (NW), (i) cyclonic (C) and (j) anticyclonic (A).
Atmosphere 11 01239 g002aAtmosphere 11 01239 g002b
Figure 3. Flowchart for type of fog classification. (Adapted from Tardif and Rasmussen (2007)).
Atmosphere 11 01239 g003
Figure 4. Monthly distribution of the fog at Porto and Lisbon airports in the period between 2002 and 2011: (a) daily fog occurrences and (b) whole period fog occurrences.
Atmosphere 11 01239 g004
Figure 5. Distribution of the fog onset in the diurnal cycle where the time of the sunrise and the sunset are represented by solid lines represented by the panels (a) and (b). The panels (c) and (d) show the duration of the fog events for each month, scaled by the number of occurrences.
Atmosphere 11 01239 g005
Figure 6. Relative frequency wind roses of the fog events duration at Lisbon (a) and Porto (b) airports.
Atmosphere 11 01239 g006
Figure 7. Monthly distribution of the event relative frequency according to the fog types at Porto (a) and Lisbon (b).
Atmosphere 11 01239 g007
Figure 8. Relative frequency of the fog event types associated to weather types at the airports of Porto (a) and Lisbon (b).
Atmosphere 11 01239 g008
Figure 9. Joint relative frequency of wind direction and wind speed associated to the fog events at Porto (a) and Lisbon (b).
Atmosphere 11 01239 g009
Figure 10. Wind roses associated to fog types’ relative frequency at Porto (a) and Lisbon (b).
Atmosphere 11 01239 g010
Figure 11. Surface observations of horizontal visibility at surface, 10 m wind speed and direction, 2 m temperature, 2 m dewpoint temperature, present weather and relative humidity associated to a fog event of each type, at the airports of Porto (a) and Lisbon (b). The fog event is indicated by the grey regions in the plots.
Atmosphere 11 01239 g011aAtmosphere 11 01239 g011b
Table 1. List of fog types and conditions prior to fog onset associated to primary mechanisms.
Fog TypesPreconditionPrimary MechanismsReferences
Precipitation (PREC)Precipitation at onset or hour prior.Evaporation of precipitation from surface.Baars et al. (2001)
Tardif and Rasmussen (2007)
Advection
(ADV)
Wind speed above 1.5 m/s, low clouds below 200 m in hour prior to onset or clear sky.Advection of temperature or moisture and condensation over a cold surface.Tardif and Rasmussen (2007)
Cloud-base lowering
(CBL)
Low clouds in hour prior to onset with gradual decreasing of base height.Radiative cooling of the stratus clouds top leading to cooled subsidence followed by water vapour condensation due to sub-layer turbulent mixing.Tardif and Rasmussen (2007)
Gultepe et al. (2007)
Dupont et al. (2012)
Radiation
(RAD)
Wind speed bellow 1.5 m/s, clear sky or low clouds in hour prior to onset and cooling in hour leading to onset or onset in the cooler period, between hour prior to sunset and before sunrise.Surface radiative cooling due to upward heat flux and turbulent mixing.Dyunkerke (1998)
Tardif and Rasmussen (2007)
Haeffelin et al. (2013)
Evaporation
(EVP)
Clear sky or onset one hour after sunrise followed by the rise of dewpoint greater than rise of temperatureIncreasing rate in surface evaporation due to early morning warming after sunrise followed by condensation into cold air and turbulent mixing.Arya (2001)
Tardif and Rasmussen (2007)
Table 2. Fog daily occurrences and relative frequency in the period 2002 to 2018, at the airports of Porto, Lisbon, and Faro.
PortoLisbonFaro
Daily occurrences601 (9.68%)320 (5.15%)60 (0.97%)
Table 3. Porto and Lisbon fog classification types: precipitation (PREC), advection (ADV), cloud-base lowering type (CBL), radiation (RAD), evaporation fog (EVP) and unknown (UNK). Absolute and percentage values.
EventsPRECADVCBLRADEVPUNK
Porto
%
699
100
47
6.7
194
27.8
403
57.7
33
4.7
0
0.0
22
3.5
Lisbon
%
375
100
20
5.3
90
24.0
251
66.9
10
2.7
0
0.0
4
1.1
Table 4. Porto and Lisbon types of fog events: onset and dissipation offset, duration, fog events visibility and minimum visibility.
Porto
TypeEventsOnset-Sunrise Hours Before(−) and After(+)Dissipatiuon-Sunrise Hours Before(−) and After(+)Duration (hours)Visibility (meters)Min. Visibility (meters)
AverageMedianAverageMedianAverageMedianAverageMedian25%50%75%AverageMedian
PREC47−0.6+1.0+1.1+2.02.20.7573.2600400600800554.3500
ADV194−2.2−2.0+0.3+1.02.11.0586.5600400600800546.6550
CBL403−2.8−2.0+0.1+1.02.51.5504.3500300500700217.8200
RAD33−3.1−2.0+0.6+1.03.62.5530.7500325500700312.9250
EVP0-------------
Lisbon
TypeEventsOnset-Sunrise Hours Before(−) and After(+)Dissipatiuon-Sunrise Hours Before(−) and After(+)Duration (hours)Visibility (meters)Min. Visibility (meters)
AverageMedianAverageMedianAverageMedianAverageMedian25%50%75%AverageMedian
PREC20−2.4−0.5−1.4+1.00.80.3616.4600500600800557.5500
ADV90−0.80.0+1.7+2.02.71.7388.5325200325500297.7200
CBL251−1.9−2.0+1.0+1.03.52.1328.0300150300500232.5150
RAD10−5.0−4.0+0.9+2.03.84.0291.2200150300600288.9150
EVP0-------------
Publisher’s Note: MDPI stays neutral with regard to jurisdictional claims in published maps and institutional affiliations.

