Article

Human Health and Economic Costs of Air Pollution in Utah: An Expert Assessment

by
Isabella M. Errigo
1,*,
Benjamin W. Abbott
1,*,
Daniel L. Mendoza
2,3,
Logan Mitchell
3,
Sayedeh Sara Sayedi
1,
Jeffrey Glenn
4,
Kerry E. Kelly
5,
John D. Beard
4,
Samuel Bratsman
1,
Thom Carter
6,
Robert A. Chaney
4,
Andrew Follett
7,
Andrew Freeman
2,
Rebecca J. Frei
8,
Mitchell Greenhalgh
1,
Heather A. Holmes
5,
Peter D. Howe
9,
James D. Johnston
4,
Leslie Lange
1,
Randal Martin
10,
Audrey Stacey
1,
Trang Tran
11 and
Derrek Wilson
12
add Show full author list remove Hide full author list
1
Plant & Wildlife Sciences, Brigham Young University, Provo, UT 84602, USA
2
Division of Pulmonary and Critical Care Medicine, School of Medicine, University of Utah, Salt Lake City, UT 84132, USA
3
Department of Atmospheric Sciences, University of Utah, Salt Lake City, UT 84112, USA
4
Public Health, Brigham Young University, Provo, UT 84602, USA
5
Department of Chemical Engineering, University of Utah, Salt Lake City, UT 84112, USA
6
Utah Clean Air Partnership (UCAIR), Salt Lake City, UT 84116, USA
7
Yale Law School, New Haven, CT 06511, USA
8
Renewable Resources, University of Alberta, Edmonton, AB T6G 2R3, Canada
9
Environment and Society, Utah State University, Logan, UT 84322, USA
10
Civil and Environmental Engineering, Utah State University, Logan, UT 84322, USA
11
Bingham Research Center, Utah State University, Vernal, UT 84078, USA
12
Law School, University of Colorado, Boulder, CO 80309, USA
*
Authors to whom correspondence should be addressed.
Atmosphere 2020, 11(11), 1238; https://doi.org/10.3390/atmos11111238
Submission received: 14 September 2020 / Revised: 11 October 2020 / Accepted: 10 November 2020 / Published: 18 November 2020

Abstract

:
Air pollution causes more damage to health and economy than previously understood, contributing to approximately one in six deaths globally. However, pollution reduction policies remain controversial even when proven effective and cost negative, partially because of misunderstanding and growing mistrust in science. We used an expert assessment to bridge these research–policy divides in the State of Utah, USA, combining quantitative estimates from 23 local researchers and specialists on the human health and economic costs of air pollution. Experts estimated that air pollution in Utah causes 2480 to 8000 premature deaths annually (90% confidence interval) and decreases the median life expectancy by 1.1 to 3.6 years. Economic costs of air pollution in Utah totaled $0.75 to $3.3 billion annually, up to 1.7% of the state’s gross domestic product. Though these results were generally in line with available estimates from downscaled national studies, they were met with surprise in the state legislature, where there had been an almost complete absence of quantitative health and economic cost estimates. We discuss the legislative and personal responses of Utah policy makers to these results and present a framework for increasing the assimilation of data into decision making via regional expert assessment. In conclusion, combining quantitative assessments from local experts is a responsive and cost-effective tool to increase trust and information uptake during time-sensitive policy windows.

1. Introduction

Research published in the past three years has revealed that environmental pollution causes much more damage to human health and the economy than previously understood [1,2,3]. The best longitudinal and cross-sectional studies now suggest that one in four deaths is attributable to environmental pollution—approximately 15.2 million premature deaths worldwide every year (Figure 1) [1,2,4]. This immense health burden amounts to 5 times more deaths than caused by tuberculosis, AIDS, and malaria combined; 10 times more deaths than from transportation accidents; 30 times more deaths than global malnutrition; and 90 times more deaths than caused by all wars and terrorism (Figure 1). Estimates of the health burden associated with outdoor (ambient) air pollution have increased the most due to the availability of high-resolution datasets and new analytical tools [1,4]. Consequently, many commonly cited estimates of pollution consequences are substantially underestimated. For example, the reported ambient air pollution deaths from the World Health Organization are 54% lower than current estimates (Figure 1) [5], and even the Lancet Commission on Pollution and Health is 41% lower than current estimates of overall deaths attributable to pollution [2,6].
Outdoor air pollution is the single largest contributor to pollution-related deaths, accounting for 61% of the loss of life from pollution worldwide (Figure 1). Outdoor air pollution accounts for even higher proportions of the pollution burden in developed countries, where water, soil, and indoor air pollution are typically less severe [1,2,6,9]. It is estimated that 80 to 90% of outdoor air pollution is produced by fossil fuel combustion (e.g., transportation, electricity, and heating) and biomass burning (e.g., heating, cooking, and fabrication) [2,9,10,11,12]. Fossil fuel and biomass burning produce primary and secondary combustion products, including particulate matter, ozone, and oxides of nitrogen, sulfur, and carbon [13,14,15,16].
The link between outdoor air pollution and health is well established for a wide range of health conditions, including cardiovascular and respiratory diseases, central nervous system disorders, psychological problems, metabolic conditions, and reproductive disfunction [17,18,19,20,21,22,23]. Exposure to polluted air triggers both acute effects (such as heart attacks, strokes, asthma attacks, miscarriages, and stillbirths) as well as chronic effects including cancer, neurological disorders, depression, suicide, and decreased cognition [2,4,16,24,25,26,27]. In addition to these well-constrained links between pollution and health, many other adverse health conditions are known to be associated with air pollution but are not yet sufficiently quantified to integrate into health risk models [2,3,28]. Consequently, current estimates of the health burden of air pollution should be considered conservative and liable to grow as more data become available [2,4,29].
Air pollution also has far reaching economic consequences. There are two main methods to estimate economic costs of pollution: 1. consideration of marketable transactions such as forgone labor output due to disability or death, and 2. broader consideration of “welfare losses” including the value of statistical life [30,31,32]. Both of these methods include direct and indirect pollution-related expenses and drags on economic development [30,32,33]. Direct effects, including premature deaths, health care costs, lost productivity, and damage of crops and infrastructure, account for the majority of air pollution costs [2,34,35,36,37,38,39]. The remaining costs come from indirect consequences of air pollution, including decreased immigration and increased emigration in urban areas, decreased tourism, decreased business investment, and regulatory costs [29,30,40,41,42,43]. The global economic damage of air pollution is estimated to exceed 5 trillion USD annually in welfare losses—approximately 7% of the global gross domestic product in 2016 [2,30]. As with the health burden from air pollution, current estimates of the economic costs almost certainly underestimate the actual effects of air pollution [2,24,32,37,44]. For example, the $5 trillion per year estimates cited here [2,30] do not include the recent doubling of estimated deaths from ambient air pollution [1,4].
At a global scale, the health and economic consequences of air pollution are getting worse, with a 20% increase in deaths attributable to outdoor air pollution between 1990 and 2015 [6]. This trend is due to both increases in air pollution in some areas and global demographic shifts such as urbanization [6]. However, there is substantial regional variability in long-term trends, with large air quality improvements in some of the most polluted countries and regions in recent decades [6,44,45,46,47]. This highlights one of the challenges to quantifying and solving air pollution: its extreme variability at multiple spatial and temporal scales. Air pollution shows large fluctuations at daily to seasonal timescales and high spatial variability over short distances (e.g., hundreds of meters) because of the location and timing of pollution sources such as road traffic, incinerators, power plants, and heating of buildings [48,49,50]. Consequently, it is difficult to reliably quantify improvements or deterioration in air quality in some regions due to sparse spatial and temporal coverage of pollution monitoring [51,52].
Despite the scientific, medical, and economic consensus that air pollution is one of the largest barriers to human flourishing [2,30,53], there is widespread ignorance and inaction among policy makers and the public from local to international levels [51,54,55,56,57]. For example, pollution control measures are often unenforced, insufficient, and underfunded, and pollution research and abatement measures receive a small fraction (e.g., 1 to 2% of health-related donations from the global community) of the funding invested in communicable diseases and other issues that cause substantially less mortality and morbidity [2,55,56,58,59]. Consequently, air pollution has been described as a forgotten, neglected, and even invisible crisis [55,56].
One potential contributor to air pollution inaction is that public perception is often uncorrelated with actual pollution conditions [60,61]. Instead, personal belief about the seriousness of air pollution often aligns with national identity, political affiliation, or age [54,62,63,64,65]. More generally, the human health impact of air pollution is inherently challenging for a non-specialist to understand. Unlike traffic accidents or acute diseases, where the cause of harm is immediately observable, many air pollutants are invisible to the naked eye and the risk factors can be spatially and temporally separated from the health or economic harm (e.g., the effects of exposure to dirty air may take years or decades to manifest) [2,16]. Because air pollution is rarely identified or listed as the proximal cause of death or disease, many people are simply unaware of the pervasive and personal consequences of air pollution exposure [65,66].
The lack of public understanding and the institutional apathy about air pollution contribute to a deep disconnect between environmental pollution science and policy [2,24,60]. Air pollution is a textbook example of a wicked or super-wicked problem, with interdisciplinary complexity, universal complicity, and no clear stopping rule to know when air quality is good enough [58,67,68]. In this public environment with high stakes and low information, the perception of air pollution science and mitigation efforts have become exceedingly politicized, despite multiple, independent lines of medical, scientific, and economic research. Taking the United States as an example, after decades of cost-effective and successful air quality legislation [31,44], there has been a recent resurgence in opposition to pollution control measures [57,69,70,71]. This opposition fits into a broader context of grassroots and institutional resistance to proven and often cost-negative interventions that could rapidly elevate human quality of life while stimulating economic development [24,44,72,73,74]. The popularity of proposals to loosen or remove air pollution protections [70,71,75] demonstrates a failure of science communication and a breakdown in the relationship between research, policy, and law [69,76,77].
In this context, we used an expert assessment [78,79,80] to generate estimates of the health and economic costs of air pollution in the state of Utah, USA. This approach of combining estimates from multiple, independent experts has long provided policy-relevant summaries of complex scientific issues to inform decision making [79,81,82,83,84]. We hypothesized that combining quantitative estimates from local experts would enhance the consideration of air pollution costs in the state legislature for two reasons. First, the involvement of local researchers with credibility and relationships in the state could counteract some of the growing erosion of public trust in science and environmental regulation [85,86,87,88,89,90]. Second, the expert assessment would generate state-level estimates of both health and economic costs in policy-relevant units (e.g., total number of premature deaths and economic damage per year), increasing understanding and consideration of air pollution at the legislative level [91,92,93,94]. For example, much of the available literature on regional costs of air pollution are expressed in damage per ton of emitted pollutant [10,32]. While this unit is effective in a permitting context, it is several steps removed from the annual budgetary decisions faced by state legislators. To test these hypotheses, we collected quantitative and qualitative input from 23 regional air pollution experts, which we diffused via newspaper articles, a public report, and presentations to the state legislature. In this paper, we report the results of this expert assessment and discuss the successes and ongoing challenges of the public and political outreach.

2. Methods

2.1. Physical and Societal Context of the Study Region

Utah is a large state covering 219,900 km2 in the Intermountain West region of the U.S. (Figure 2). Utah’s mean elevation is 1860 m, with a semi-arid climate, and strong seasonal swings in temperature and precipitation. It has a dense urban population residing along the Wasatch Mountains, where 79% of the state’s 3.3 million people live (Figure 2). The four “Wasatch Front” counties and three adjacent counties in northern Utah have long histories of nonattainment with National Ambient Air Quality Standards for fine particulate matter (PM2.5) on a 24 h basis and ozone (O3) [95,96]. An additional county in eastern Utah (Uinta County) is also in nonattainment for O3 associated with oil and gas extraction [96,97,98]. Other counties outside Utah’s Wasatch Front have better air quality, though there are various local air quality issues associated with the type and degree of business, domestic, and industrial activity in those areas as well as natural environmental differences [96,99,100,101]. Several factors contribute to Utah’s air pollution problems, including a quickly growing population, winter inversions trapping polluted air in valleys, and high levels of per-capita fossil fuel use [26,96,101,102]. Recent increases in wildfires due to climate change [103] have also added to Utah’s air pollution [46].
Despite an abundance of Utah air pollution research (see Section 2.2), we are aware of no Utah-specific studies estimating total air pollution deaths and economic costs for the state. Consequently, there is a wide range of numbers referenced in the public discourse, ranging from tens to tens of thousands of premature deaths and hundreds of thousands to hundreds of millions of USDs of economic damage [104,105,106,107,108]. The absence of direct, state-level estimates of pollution costs has created an information vacuum where specific numbers are avoided even in official reports and planning documents, which only cite community-level studies, often based on individual health conditions or pollutants [96,101,109].
Figure 2. Concentrations of ozone (O3) and 2.5 µm particulate matter (PM2.5) in Utah from 2009 to 2019. The yellow dots show the location of air monitoring stations where high-frequency observations were made. The size of the dot indicates the seasonal mean of the 97th percentile. Data from [110].
Atmosphere 11 01238 g002
Related to the lack of state-level cost estimates, there is little temporal and spatial context in the debate about air pollution in Utah [101]. While short-term exceedances of air quality standards dominate headlines(e.g., [111]), there have been large improvements in air quality over the past decades. In the 1970s and 1980s, the overall air pollution index in Utah dropped by half [96,112], attributable to federal legislation such as the Clean Air Act Amendments and the Air Quality Act, which required removal of sulfur and lead from fuels, as well as technological and behavioral changes [31,113]. More recently, some air pollutants have continued to improve thanks to local and state-level action, while other pollutants have stagnated or gotten mildly worse [46,96,102,114]. Specifically, acute and long-term concentrations of CO, NOx, and SOx have continued to decrease in recent years, while O3 and particulate matter (PM2.5 and PM10) show minor improvements or worsening, depending on the region within Utah [44,46,96,98,115]. At the state level, Utah has relatively good air quality compared to other regions in the U.S., largely because of low population density and limited industrial activity [10,44,46,116]. However, the visible nature of wintertime air pollution along the Wasatch Front (Figure 3) and the frequent nonattainment status of multiple counties have contributed to widespread support among Utahns to improve air quality [101,102,112,117]. Utahns ranked air quality as the 3rd most important issue in the state, after only water security and education, and 80% of Utahns said they would accept additional taxes and legislation to improve air quality [101,109].

2.2. History of Air Pollution Efforts and Research in Utah

Utah has struggled with air quality issues since before it became a state [117]. Early European settlers who moved to Utah with the Mormon migration [119,120] noticed the nuisance of “smoke” in the 1850s, which prompted municipal and regional efforts to improve behavior and technology to reduce pollution [121]. In the 1880s, newspapers began regularly publishing articles about air pollution causes, consequences, and solutions [121,122], helping pass Salt Lake City’s first air quality ordinance in 1891, five years before the state was established [117,123].
Since that time, Utah has been a hot spot of air pollution research, hosting a series of air-quality studies in the 1920s, including airborne sampling of thermally-stratified air [117,124,125], and pioneering work in the 1980s and 1990s to quantify and causally link air pollution with damage of health and economy [99,126,127,128]. More recent Utah-based studies have characterized the atmospheric chemistry of air pollutants, evaluated effectiveness of different mitigation measures, and linked a broad suite of negative health outcomes with long- and short-term exposure to air pollutants [20,97,100,102,112,129,130,131,132]. Additionally, several national- and global-scale studies have included Utah as a subregion, reporting estimates of mortality and morbidity and economic welfare losses associated with individual pollutants, though often in the supplementary information [10,36,44,114].
Since the 1960s, state-sponsored reports have outlined policies that could reduce air pollution to enhance the health and economy of Utah [96,101,109,117,133,134]. These recommendations align with proven measures taken in communities around the U.S. and the world [24,51]. While these air pollution control proposals have not been publicly challenged by most state legislators, allocation of state funds has been limited and few of the measures have been fully implemented [96,101,104,109,133].

2.3. Expert Assessment Methods

Expert assessment has long been used to combine multiple expert opinions to generate more robust estimates of possible system responses and risk of dangerous or undesired outcomes [79,81,82,83]. While expert assessment cannot definitively answer scientific or social questions, it complements modeling and empirical approaches by allowing the synthesis of all available formal and informal knowledge about the system to inform decision makers and researchers (Figure 4) [78,80,135]. The approach is based on the finding that multiple estimates built on different assumptions and data provide more robust and reliable numbers [136]. Because the experimental unit in an expert assessment is a single individual with diverse knowledge about a subject, each data point integrates multiple types of information available to that person; including evidence not yet formalized enough to integrate into traditional numerical models [137,138].
We began working on the expert assessment questionnaire used in this study in the fall of 2018. We first compiled peer-reviewed publications and agency reports on air pollution at global, national, and state levels. This allowed us to begin populating a list of potential participants based on authorship of peer-reviewed research (details below). We also synthesized this background information into a two-page “system status” document, which we included at the beginning of the questionnaire to provide context and facilitate integration of available peer-reviewed studies (Supplementary Information, SI; Section S4). We defined the scope of the assessment iteratively, which eventually included seven questions (details in Section 2.4 and SI Section S4). The questions asked for quantitative estimates of the loss of life (total disability-adjusted life-years and pollutant-specific effects), economic costs (direct and indirect marketable transactions), and efficacy of potential interventions.
To ensure a representative sample of experts, we invited all Utah-based experts in environmental health, air pollution, atmospheric chemistry, environmental economics, and environmental policy identified by the process described below. We populated a list of invitees who fulfilled any of the following three criteria: 1. contribution to the peer-reviewed literature (all authors of Utah-focused studies in our literature review were invited), 2. participation in air quality conferences, workshops, or reports (allowing input from non-academic experts), and 3. referral by another participant meeting criteria 1 or 2. Following our hypothesis that estimates from local experts would be more influential, we only invited Utah-based or Utah-focused experts to participate. In total, we invited 85 experts and received 14 completed responses, for a response rate of 16%, similar to previous expert assessments [78]. The primary areas of expertise among the participants were: air quality (29% of participants), public or environmental health (29%), policy or education (29%), and economics (21%; sum is greater than 100% because some experts listed two “central” disciplines). We received a mean of 10 responses per question because not all experts answered each question. In addition to the 14 questionnaire respondents, 9 experts gave input on the analysis and manuscript, and all 23 contributors are coauthors on this paper.

2.4. Questionnaire

The questionnaire consisted of seven questions (Table S1). The first two questions asked experts to estimate the loss of life associated with air pollution in two related ways. Question 1 asked for quantitative estimates of the number of disability-adjusted life-years (DALYs) lost due to air pollution in Utah. The DALY concept has the advantage of integrating information on mortality and disease into a single metric, which represents the number of years of life lost by the whole population (either premature death or substantial disability) because of air pollution [2,139]. For example, air pollution has been associated with both incidence of asthma [140]—a chronic health outcome—and occurrence of asthma attacks [141]—an acute health outcome. Because DALYs allow different health risks to be compared (e.g., malaria, suicide, and environmental pollution), this concept has been widely used at the global and national scales [30,142,143]. However, DALYs are rarely reported in local and regional studies, which may not have the necessary sample size and breadth of measurements to quantitatively estimate health outcomes [24,112]. Question 2 asked experts to estimate what percentage of Utah’s population was experiencing different categories of years of potential life lost. This complemented question 1 by providing insight into how the health effects of air pollution are distributed across the population—e.g., do a few, vulnerable individuals account for most of the loss of life or is the health burden distributed across groups. Question 3 asked what pollutants contributed most to the health burden estimated in questions 1 and 2—i.e., what percentage of the total air pollution health effects are associated with particulate matter, ozone, and other pollutants. Question 4 asked what health conditions were most associated with air pollution in Utah, providing information about the causes of costs identified in questions 1 and 2. Questions 5 and 6 asked for direct and indirect economic costs of air pollution, respectively (see introduction and SI Section S4 for more detail of direct and indirect costs). We asked experts to estimate market costs rather than welfare losses, providing a conservative and more easily understood estimate of the economic costs of air pollution [30]. Question 7 asked experts to list their recommendations for reducing air pollution in Utah. Experts identified the action, categorized its scale of implementation (e.g., primarily individual, community, state, or national), and estimated how much it could reduce the air-pollution-associated costs estimated in questions 1, 2, 5, and 6. Experts were encouraged to answer for the whole state of Utah, though there was an option of providing regional estimates if they had no expertise at the state level (all responses were for the state level).
We required experts to provide 90% confidence intervals around their central “best” estimate for each quantitative question. This process of estimating quantitative probabilities counteracts the tendency towards overconfidence and improves consideration of the compound assumptions inherent to this kind of assessment [135,137,144,145]. The “lower” and “upper” estimates were defined as a 95% chance that the actual value is greater or less than this estimate, respectively. The central estimate was defined as the “best” estimate given available knowledge. We did not collect confidence intervals for questions 3 and 4 because of the size and complexity of the response table (e.g., multiple pollutants, health conditions, and contributions; SI Section S4).
In addition to the quantitative estimates, we asked experts to rate their confidence and expertise levels (1 to 5 scales; SI Section S4; [78,80]) and describe how they generated their estimates (e.g., published studies, unpublished data, and professional opinion). We tested the questionnaire iteratively to ensure clarity and completeness by sending it out to six initial collaborators before circulating to the full list of identified experts.

2.5. Data Analysis and Calculations

We calculated summary statistics and created visualizations using the R statistical software package [146]. For each question with confidence intervals, we calculated the unweighted medians and means of central, upper, and lower estimates. For the questions without confidence intervals, we calculated the mean and standard error of the responses. We did not weight expert estimates based on years of experience or the self-ratings for several reasons. The question of weighting expert estimates based on level of confidence or expertise is an area of active research in the expert judgement discipline and there is not agreement on whether to use weighted or raw values [79,147]. The most common weighting methods implement a post-hoc analysis of the similarity of the responses [144]. However, two downsides of this approach are that minority opinions may be discounted, and estimates of expertise (either self-ratings or external evaluation) are inherently subjective [80,148]. Using median values reduces the influence of extreme outliers while not discarding any of the provided estimates [78]. Ultimately, the medians and means of the responses were similar across questions, and we presented both when practical.
In addition to reporting the raw DALYs and percentage of Utahns in different life-lost categories, we expressed the estimates of loss of life from questions 1 and 2 in three ways to improve interpretability of the results for non-technical audiences. First, we calculated the total number of lifetimes lost by dividing the estimates of DALYs with the mean life expectancy at birth for Utah, which was 79.4 years in 2018 [149]. Second, we calculated the number of premature deaths by dividing the estimates of DALYs lost by 5, following Utah’s definition of premature death as 5 years or more below the average life expectancy [149]. Third, we calculated the median per capita number of years lost by Utahns to air pollution by summing the product of the percentage of the population (3.3 million) in each category with the years of potential life lost in that category. We used these multiple, intuitive expressions of the costs of air pollution to test our hypothesis that simple, policy-relevant units would be more influential.
In addition to the expert assessment, we also performed a basic spatial analysis of O3 and PM2.5 in Utah (two of the most damaging pollutants in this region) using existing air pollution data [110]. Due to their sources and atmospheric chemistry, O3 and PM2.5 show generally opposite seasonal patterns, with O3 highest from May to October and PM2.5 highest from October to March (Figure 2). For the 36 stations in Utah with publicly-available data coverage since 2009 [110], we calculated the monthly 97th percentiles of the daily values of O3 (8 h daily maximum concentration) and PM2.5 (mean daily concentration). We averaged these monthly values within season across the eleven-year period (2009–2019). We then calculated the long-term (2009–2019), seasonal mean concentration of O3 (8 h daily maximum concentration) and PM2.5 (mean daily concentration) for each station. Finally, we used ArcGIS Pro (Esri) to interpolate between stations via the inverse-distance weighting function (see Figure 2).

2.6. Initial Report and Public Relations Efforts

Though a quantitative analysis of the policy and public opinion impacts of our expert assessment is beyond the scope of this study, we carried out several outreach and education efforts to assess our hypothesis that an expert assessment of local costs from local experts would be more convincing to policy makers and the public. We organized our efforts around the “policy window” [94] created by Utah’s legislative session, which lasts 45 days from late January to mid-March every year. In January of 2019, before the expert assessment was complete, we created a one-page air quality brief outlining basic statistics on air pollution, accompanied by a list of pertinent bills (Supplementary Materials Section S6). We solicited input from several legislators on an early draft of the brief, revising for brevity, pertinence, and understandability. We then sent the executive brief to all 75 Utah House members and 29 state Senators and requested to speak with them. We followed up with phone calls, which led to approximately 35 phone conversations and several in-person discussions with legislators (a detailed narrative can be found in the Supplementary Materials, Section S3). During these conversations, we explained how our estimates were derived (a literature review of studies published prior to January 2019), their relevance to Utah, and potential legislative actions to reduce air pollution costs.
For the 2020 legislative session we went through a similar process, this time including the results from the expert assessment. We created a non-technical report summarizing the literature review and expert assessment results (Supplementary Materials Section S5), which we distributed to all legislators, organized a press release, and wrote two articles in the state’s largest newspaper on the topic [104,150].
To assess the effectiveness of these measures, we used qualitative analysis and feedback from policy makers and the public. We asked supportive and antagonistic legislators to describe what they found accessible and what was difficult to understand or objectionable from their perspective. We also read the comments on the articles and social media posts associated with the report, utilizing them as qualitative metrics of public understanding and reception.

3. Results

3.1. Human Health Consequences of Air Pollution in Utah

In response to question 1, the median expert estimate was that 30,000 DALYs are lost each year in Utah (median 90% confidence interval = 12,400 to 40,000; Figure 5A). This represents 378 complete lifetimes (156 to 504) or 6000 premature deaths (2480 to 8000) per year. Besides two outlier estimates (one high and one low), the DALY estimates grouped relatively tightly (Figure 5A). For question 1, the mean self-rated confidence and expertise levels were 2.7 and 2.4, respectively, on a scale of 1 to 5 (SI Section S4).
In response to question 2, experts estimated that only 25% (15 to 45%) of Utahns experience less than 1 year of potential life lost because of air pollution (Figure 5B). The highest median percentage (30%) was estimated in the 1 year lost category (20 to 45%), with a gradual decline in percentage to 3% in the >10 years lost category (1 to 5%; Figure 5B). Together, these results suggested that the median per capita years lost to pollution was 2.09 years (1.10 to 3.60 years), with mean estimates suggesting 3.01 years (1.71 to 4.63 years). For question 2, the mean, self-rated confidence and expertise levels were both 1.7. The estimates from question 2 of potential years lost were substantially higher than the DALY estimates from question 1. Several experts noted that they relied only on published, and often pollutant specific DALYs for question 1, while they considered the entire air pollution burden more holistically though qualitatively in question 2.

3.2. Economic Costs of Air Pollution in Utah

The median expert estimate of the direct economic costs of air pollution in Utah was $1.0 billion per year ($0.35 to $1.65 billion per year). Individual estimates were distributed relatively evenly across a broad range from $0.2 to $10 billion per year (Figure 6). The median estimate of the indirect economic costs of air pollution was $0.9 billion per year ($0.4 to $1.65 billion per year), similar but slightly lower than estimates of the direct costs (Figure 6). Individual estimates were distributed widely, ranging from $0.1 to $5 billion per year (Figure 6). The self-rated expertise and confidence were generally lower for the economic questions than for the health questions, with mean expertise of 2.1 and 1.6, and mean confidence of 1.9 and 1.8, for the direct and indirect costs, respectively. Similarly, the individual 90% confidence intervals tended to be broader than for previous questions (Figure 5 and Figure 6).

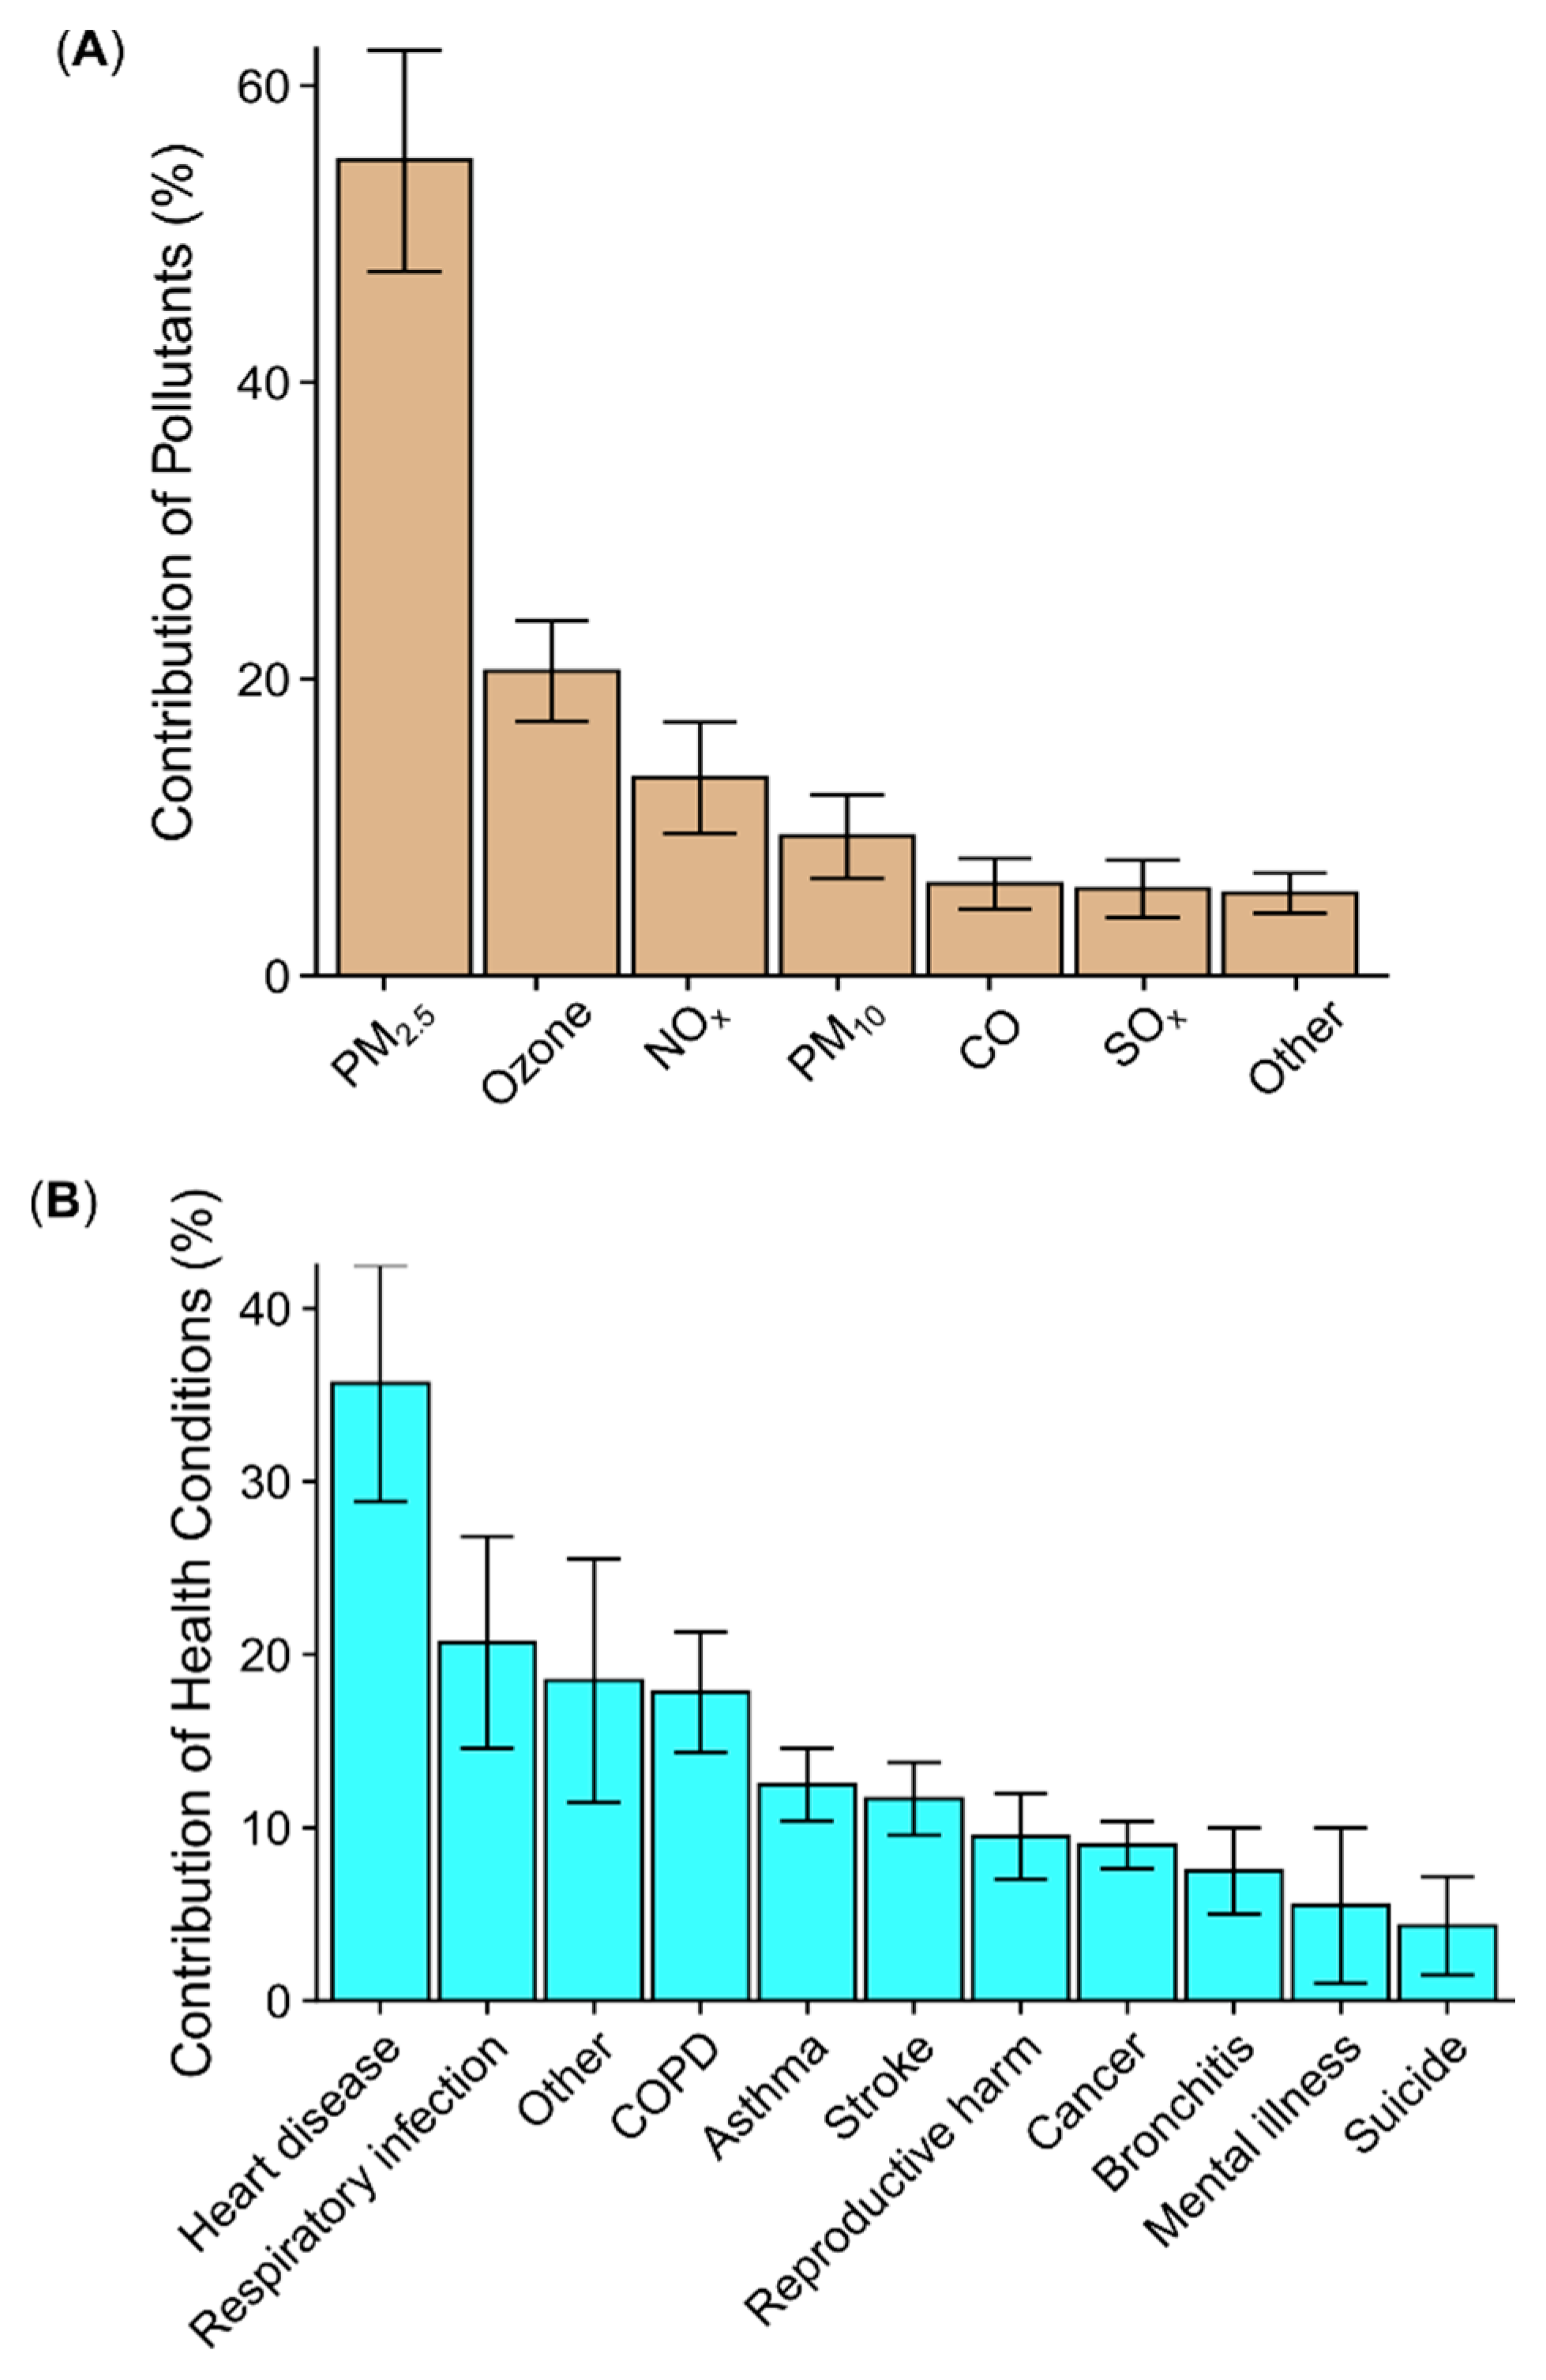
3.3. Attributing Losses to Specific Pollutants and Health Conditions

In response to question 3, experts attributed 55% (±7.5%, mean and standard error) of the health and economic costs from air pollution in Utah to PM2.5 (Figure 7A). Mean estimates of O3, and NOx each accounted for 10% or more of the health and economic burden, with the remaining pollutants (PM10, CO, SOx, and others) each contributing less than 10% of the total burden (Figure 7A; for information on the groupings refer to Supplementary Data). For question 3, the mean, self-rated confidence and expertise levels were 2.7 and 2.6, respectively.
Experts listed more than 30 health conditions in response to question 4, which asked for the relative contribution of different health problems to Utah’s air pollution costs. The listed conditions fell generally into 10 categories, plus an “other” grouping (Figure 7B; for information on the groupings refer to Supplementary Data, Question 4). Heart disease and respiratory infections were the two biggest air-pollution-caused contributors to the health and economic burden, accounting for 36% (±6.8%) (±6.1%) of the damage caused by air pollution (Figure 7B). The “Other” grouping, chronic obstructive pulmonary disease, asthma, and stroke each accounted for 10% or more of the health and economic burden (Figure 7B).

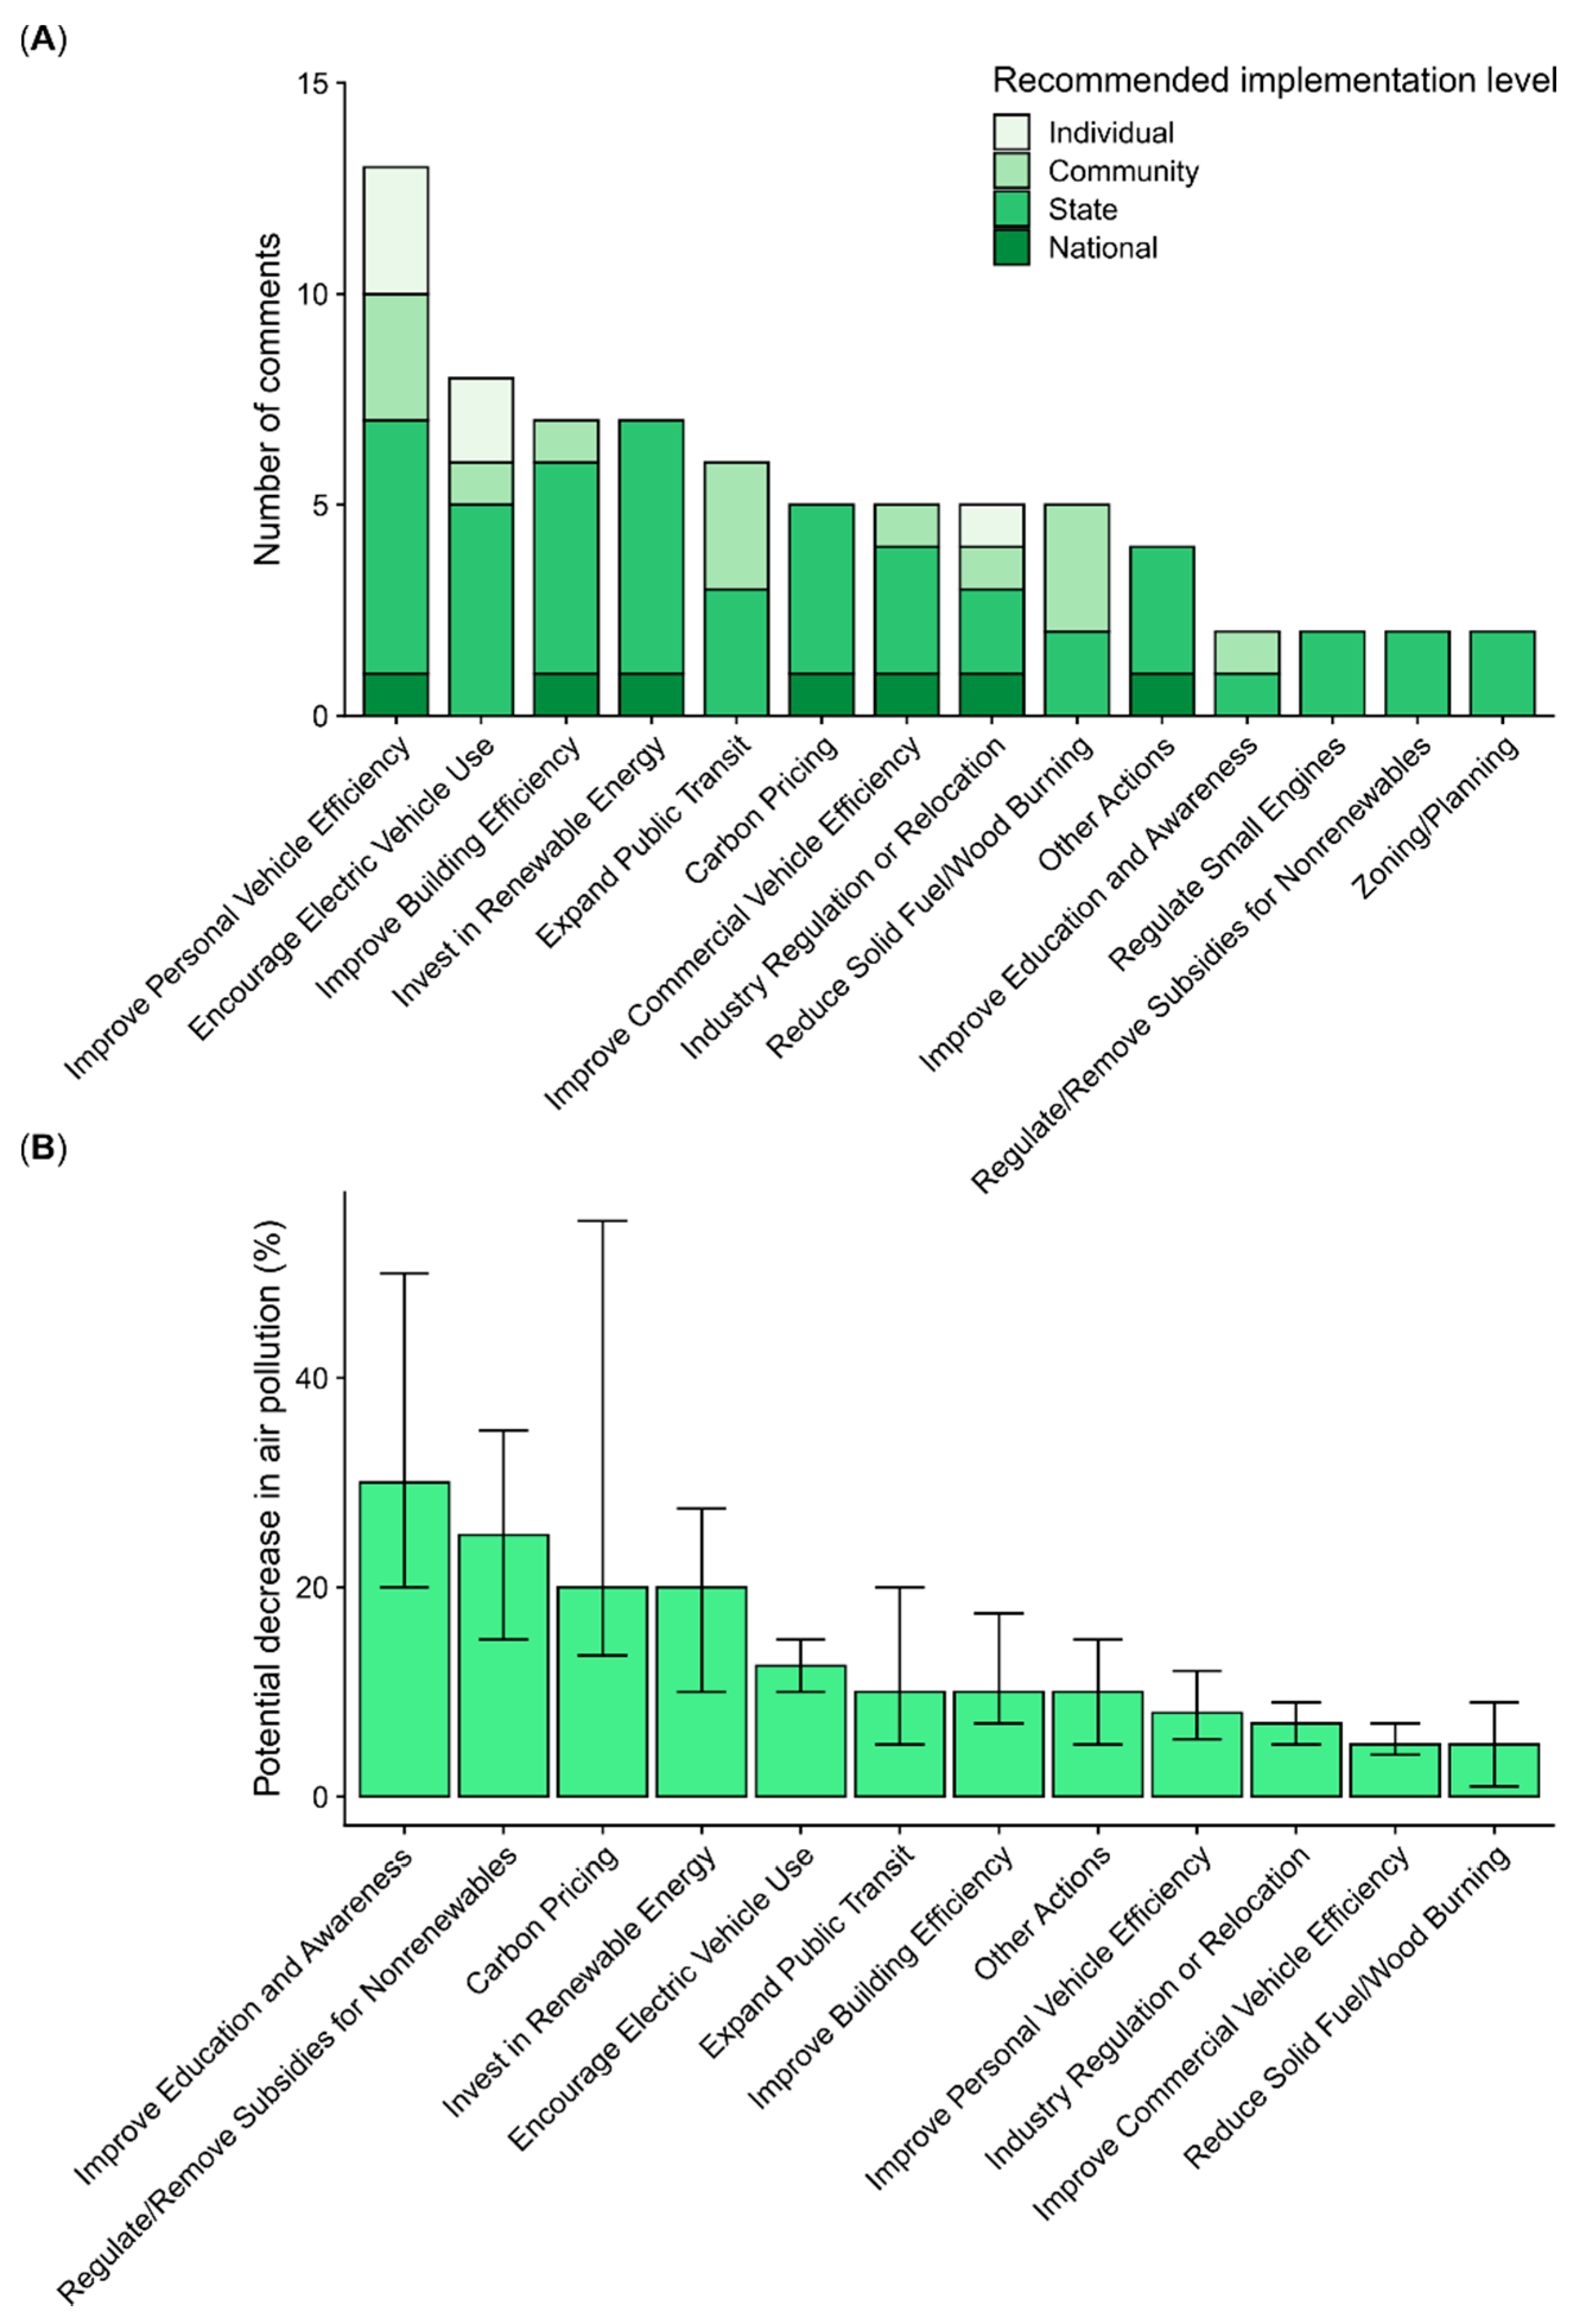
3.4. Recommendations for Improving Air Quality

Experts proposed more than 30 actions that could reduce air pollution when implemented at individual to national levels, which we summarized into 13 categories, plus an “other” grouping (Figure 8; for information on the groupings refer to Supplementary Data, Question 7). Increasing efficiency of vehicles was mentioned the most often (Figure 8A), corresponding with Utah’s known pollution sources. However, improving education and awareness of air pollution and removing subsidies for fossil fuels were considered the interventions with the largest potential to improve air quality (Figure 8B). Experts repeatedly commented that a combination of interventions was needed to improve air quality, rather than a single “stand alone” solution. The state level was the most recommended implementation level for the various actions, followed by community, national, and individual levels (Figure 8A).

3.5. Legislative and Public Response

Our initial contacts with legislators in January 2019 led to several outreach opportunities. In August 2019, we were invited by the Climate Action Campaign to participate in a press conference on the Clean Car Standards with the Clean Air Caucus, a bipartisan group of state legislators interested in improving air quality in Utah. The press conference took place on Utah’s Capitol Hill and was covered by approximately ten local news outlets. The coverage led to more than a dozen news articles and TV appearances, allowing us to present the literature review on human health and economic costs of air pollution applied to Utah (SI Section S3). Our additional efforts in late 2019 and early 2020 attracted substantial media attention and resulted in important relationships with the state legislature [111]. We participated in an additional press conference on the roll out of Tier-3 gasoline, which led to a similar amount of media coverage as the 2019 press conference. In May of 2020, we were invited to present the results of our study at the Clean Air Caucus’ monthly meeting, which involved approximately 25 representatives and senators.
Though the estimates from our expert assessment were in line with both regional and downscaled national studies (see Section 4.1), our findings were completely novel for legislators across the political spectrum. Even among the legislators most engaged in clean air efforts (i.e., those in the Clean Air Caucus), no one was familiar with the likely magnitude of the health and economic costs of air pollution in Utah. This disconnect between policy and science appeared to extend beyond the legislators and their staff to include state agencies. For example, when one legislator contacted staff within the Utah Department of Health to fact check our results, they received a reply that there were no quantitative estimates with which to compare our findings (i.e., they were not aware of the currently published or available research). While our results were not universally accepted (see Section 4.2), the consistent response of unfamiliarity and surprise supported our hypothesis that obstacles of understanding, trust, and relevance currently limit flow of policy-relevant air pollution information. As noted, our study does not seek to casually link legislative outcomes with our relatively short-term research and outreach efforts. However, we provide a brief analysis of the legislative outcomes of 2019 and 2020 related to air quality in the SI (Section S1; Table S2). Likewise, we describe our general interactions with the legislature and the public response to news coverage of our study in the SI (Sections S2 and S3).

4. Discussion

In this study, we used expert assessment to generate state-level estimates of the health and economic costs of air pollution for Utah. We hypothesized that one of the barriers to improving air quality in Utah was a lack of trust in and relevance of currently available estimates of air pollution costs. Estimates from our expert assessment indicated substantial loss of healthy life and economic output, in line with independent regional to national estimates of air pollution costs [9,10,36,44,114]. However, legislators and supporting staff were not familiar with any of these previous studies, and policy discussions and documents largely avoided comprehensive, state-level estimates of air pollution costs [96,101]. Consequently, our findings were met with surprise, suggesting that locally derived and policy-relevant summaries could be effective at improving integration of science in policy making. In the following sections, we compare our estimates with independent studies and explore the strengths and weaknesses of this and other approaches to improving integration among research, policy, and education.

4.1. Comparison of Expert Estimates with Downscaled National Data

Our estimates of the overall loss of life associated with air pollution were directly in line with medical and epidemiological studies done at local to global scales [2,10,44]. For example, estimates from the last decade suggest air pollution contributes to the premature deaths of 100,000 to 380,000 people annually in the USA, though individual estimates fall beyond that range depending on what pollutants and relative risk factors are considered [1,2,4,9,33,44,151]. Downscaled by population, these estimates suggest that air pollution causes ~1000 to 4000 premature deaths in Utah. This range overlaps with our somewhat higher estimates of 2480 to 8000, though the difference between the ranges can be attributed to error in the simplistic downscaling and the recent doubling in estimates of loss of life due to outdoor air pollution [1,4], which was considered by many of the expert respondents in our study. More generally, our state-level estimates reflect the robust evidence that exposure to air pollution affects all systems in the human body, including prenatal development, neurological function, cardiovascular health, respiratory function, mental health, and geriatric health [1,3,20,116,152,153,154]. Additionally, the distribution of the health burden across the population in our study (Figure 4), rather than just in “sensitive groups” (e.g., the elderly, young, and those with underlying health conditions), supports a growing consensus that there are no “insensitive groups” [4,116,155,156].
On the economic front, our estimates of the market cost of air pollution in Utah ($0.75 to $3.3 billion per year) were also in line with regional to national estimates of air pollution costs [9,10,30,31], though our estimates were presented as annual totals, while most regional studies report cost per ton of pollutant. As expected, our market costs were lower than estimates of welfare losses associated with air pollution (i.e., including the statistical value of lost life), which suggest losses of $600 to $900 billion annually due to air pollution damages in the US [2,9,10,30]. When downscaled to Utah based on the state’s population and GDP, these studies suggest that air pollution incurs $6.2 to 8.6 billion annually in damages to Utah’s economy when including welfare losses. From a policy perspective, it may be immaterial which estimate is considered, because both the market costs from this expert assessment (~$2 billion) and welfare costs from other studies (~$7 billion) dwarf the current level of funding invested in air quality in Utah [157]. The $10 million appropriated for clean air in 2020 (Table S2) represents 0.5% of the median air pollution costs to Utah’s economy estimated in this study and 0.1% of the welfare losses suffered by Utah [9,10]. The disconnect between economic estimates of air pollution costs and the current policy discussion in Utah is even more extreme. For example, the current, state-funded “roadmap” on air pollution in Utah mentions potential savings of $0.8 to $1.5 million a year if air pollution could be reduced [101]. This is three orders of magnitude below the “lower” estimates from this study (Figure 6). Were the roadmap’s pollution reduction targets to be met, our market cost estimates suggest that Utah would save $500 million per year by 2030 and $1.1 billion per year by 2050. On the other hand, a house resolution this year to publicly adopt the roadmap failed (Table S2), despite the roadmap’s relatively innocuous findings and modest recommendations (e.g., ~2% reduction in air pollution annually) [101]. This demonstrates how factors besides the accuracy of estimates of economic costs influence action on air pollution in Utah.

4.2. Are Local Estimates of Pollution Costs more Pertinent and Persuasive?

We hypothesized that a lack of trust in non-local science and differences in units currently slows progress towards clean air. Consequently, we predicted that policy-relevant estimates from local experts would more effectively communicate costs and potentially galvanize action in Utah. Our interactions with the state legislature and their staff support our hypothesis: none were familiar with the technical and non-locally derived research that is available on this subject. While our short-term experimental design is incapable of a definitive answer about whether the enhanced awareness of air pollution costs will spur action, previous studies and our interactions with policy makers provide some evidence for and against our hypothesis.
In support of our hypothesis, there is abundant evidence that the understanding and acceptance of new information depends strongly on personal relevance and relatability [91,92,93,94]. Likewise, collaborative relationships and reciprocal information flow between researchers and policy makers have been recommended as crucial factors for research-based policy making [85,86,87,88]. In line with this research, we found that legislators were much more willing to consider our evidence when they recognized the names of the participants in the expert assessment. We consistently found that legislators were as or more concerned with who was involved with the study as they were with the details of the scientific methods (though see the following paragraph for a contrary example). This observation is not meant as a criticism, as we recognize that policy makers and practitioners (e.g., lawyers, managers, and community representatives) must rely on heuristics and relationships to assess the large quantities of information required to resolve diverse issues with short timelines [76,77,90,158]. This hyperattention to the author list potentially increases the effectiveness of expert assessment as a tool for improving science-policy exchange (Figure 2) because expert assessment allows scholarly collaboration among large groups of researchers in an incredibly cost-effective way. For example, this project was funded by a $3000 undergraduate research grant awarded to the lead author. Though additional time commitment was necessary from all contributors, these activities did not require additional external support. This demonstrates how expert assessment can combine diverse knowledge while efficiently facilitating the creation of multi-party networks.
One common response to our study suggested that legislators and journalists do pay attention to some aspects of the scientific process. We were consistently asked whether the study had undergone peer review. For some legislators, this question could simply be a delaying tactic, allowing dismissal of new information despite direct policy relevance [159]. However, a less cynical interpretation of these concerns is that legislators recognize they are often not capable of evaluating the scientific rigor of primary research, and that they depend on the peer review process to gather more reliable technical knowledge. In this case, we will not know which is true until after we observe legislator’s responses to the publication of this article.
One important piece of evidence against our local relevance hypothesis is the persistence of air pollution issues in Utah despite state-level recommendations and information about air quality that date back more than a century [117]. Given its rich history of air pollution research (Section 2.2), we would expect Utah to be better situated to solve air pollution than similarly sized states or regions [160]. On the other hand, the frequent government reports on the state of Utah’s air have not contained quantitative information about state-level deaths and economic costs [125,133,134,161,162]. Alternatively, the relevant air pollution research that has been generated locally in Utah could be one of the reasons support for air pollution mitigation is so high in the state [101,109], despite the state’s relatively average long-term air pollution status (Section 2.1). Along these lines, Utah’s history of research could have counteracted the rapid acclimation of individuals and communities to current environmental conditions [163,164], in this case air pollution.

4.3. Building Community Networks to Accelerate Progress

Insights from political science, economics, and the natural sciences point out several approaches that increase the likelihood of rapid and durable resolution of socioecological issues such as Utah’s air pollution [67,77,88,165,166]. Community-based approaches can help overcome the high level of mutual ignorance that often exists among policy makers, researchers, and the public [76,87,167,168]. These participatory approaches collaboratively identify goals and develop strategies to meet them, increasing ownership or “buy in” and likelihood of long-term success [67,169,170]. For example, the West Oakland Environmental Indicators Project found that asthma rates in children in West Oakland were seven times the California state average [169]. Their partnership identified exhaust from diesel trucks as a potential contributor to the increased childhood asthma rates and then collaboratively conducted studies about the number, route, and duration of truck passages. These studies were influential in convincing the city council to pass an ordinance that identified a specific route diesel trucks should take through West Oakland, reducing the exposure of children to diesel exhaust and, consequently reducing incidence of asthma among children. One challenge to these approaches is difficulty in scaling to state or regional levels, where the number of stakeholders is larger, and the diversity of values and priorities is greater [166]. However, this is where participatory science and policy programs (e.g., expert assessment, citizen science, and other collaborative approaches) can create relationships and coalitions [77,171,172,173]. These types of integrated research–policy–public networks have contributed to solving regional to continental problems, including reducing acid rain and stratospheric ozone depletion [84].
There are also several technical and structural changes that could be made relatively easily to accelerate air quality improvements. Categorical air quality classification schemes (e.g., red, yellow, and green air quality) can undermine comprehension of the human response to pollution and slow progress towards cleaner air [51,156]. For example, in the US, the majority of the loss of life and economic damage caused by air pollution occurs in areas with “good” air quality that meets national standards [44]. Because the human response to air pollution is continuous for most pollutants (i.e., there is no “safe” level of pollution), these standards are inherently subjective, as evidenced by the wide range of standards at national and international levels [7,44,57,174]. These arbitrary air quality categories can also create perverse incentives for communities and regulatory agencies. In the current “threshold” framework of pollution control, many municipalities are disincentivized from better quantifying pollution, for fear of finding areas that are out of attainment [96,175]. This can result in decreased monitoring and the appearance of air quality improvement from selective decommissioning of stations in “dirty” areas and installation of stations in “clean” locations. Focusing on quantitative pollution levels and changes through time (i.e., trends) can overcome or at least mitigate this bias, because areas with the highest pollution levels are those with the greatest potential for improvement [6,44,51].
An obstacle to transformative action on air pollution is the influence of special interest groups on policy making [77]. While explicit misinformation campaigns and corporate overreach have been well documented for a variety of socioecological issues [176,177], implicit conflicts of interest are likely more pervasive [60,178,179]. Regarding this study, we were surprised at the level of intimacy between the legislature and corporate interests we observed during our outreach. For example, after we met with the Clean Air Caucus, the president of the Utah Petroleum Association gave the plenary presentation at the next monthly meeting. Participants in the meeting from industry, the legislature, and regulatory organizations openly discussed legal strategies to avoid federal consequences of ozone noncompliance and plans to ensure state-level support for fossil fuel production. More generally, we were surprised at the level of legislative ghostwriting associated with environmental issues, with many legislators disclosing that special interest groups had written the bills they put forward. While these behaviors are not illegal or necessarily unethical under current norms, the public and research communities should be aware of these tactics and adjust their approaches accordingly [77,180].
One final approach to accelerating action on air pollution is positive framing of this issue to emphasize socioeconomic opportunities [86,181]. There is abundant evidence that policy measures can simultaneously improve air quality, stimulate economic growth across sectors, while also addressing other environmental issues such as climate change [2,182]. For example, the Clean Air Act of 1970 was followed by a decrease of 68% in common air pollutants while the U.S. Gross Domestic Product grew by 212% between 1970–2011 [31]. More recently, the direct and indirect benefits of the 1990 Clean Air Act Amendment have added at least $2 trillion to the U.S. economy (an average of $65 billion each year), representing a return on investment of $32 for every $1 of cost [2,24,31]. The economic opportunity of solving air pollution is only growing, with the recent decline in the cost of renewable energy generation, advances in electric vehicles, and improvement in construction methods [101,183,184]. This global economic and energy revolution is creating opportunities for technology innovation and new jobs [183,185]. Current estimates of the economic consequences of transitioning to clean energy and transportation suggest it would create 25 million new jobs in the next 10 years, distributed across every region of the USA [186]. Regions such as Utah, which suffer from air pollution issues, have opportunities to take a leadership role in this new energy economy while securing the health and economic benefits of cleaner air. The economic recovery from the COVID-19 shutdown provides additional opportunities for transformative progress [94,150,186].

4.4. The Moral Imperative to Solve Air Pollution

Beyond the financial and practical reasons to solve air pollution, there is an overriding ethical responsibility to address this issue. Pollution is by definition human caused [2], and air pollution cuts across community, state, and national lines [187,188]. This transboundary movement of air pollution occurs on multiple scales, including at the community level, where historical patterns of discrimination in labor and housing exacerbate the issue. In Utah, the highest levels of PM2.5 are found along transportation corridors and in lower elevations of urban and suburban communities [117,132], while the highest levels of O3 occur in the Uintah and Ouray Indian Reservations [97,98]. Because of historical factors, including systemic racism, these areas have higher percentages of racial minorities and other underprivileged groups [132,189,190,191]. For example, financial institutions throughout the US, including in Utah, engaged in discriminatory lending known as redlining during and after the Great Depression, forcing people of color to live and work near refineries, industrial plants, and transportation corridors [192,193,194]. Spatial differences in the cost of living and differentials in political power have aggravated these inequalities, creating pervasive environmental injustice at a global scale [188,195,196]. Because of Utah’s complex and rich history, these environmental inequalities manifest along multiple dimensions, including race and religion [197]. Many communities remain effectively segregated along these lines, affecting environmental exposure to pollutants as well as amenities and institutions such as public schooling, utilities, and policing [190,197,198]. One study in Salt Lake City found that schools with higher minority populations had more extreme pollutant exposure, with a one standard deviation increase in the proportion of Hispanic students associated with a 2 to 12% increase in exposure to PM2.5 [132]. Deeper consideration of these moral implications across research, policy, and public perception could enhance our collective motivation to solve this defining crisis.

5. Conclusions

In a time of growing mistrust and misunderstanding of science, we need to develop reliable methods to integrate the best available information into policy making. We used a local assessment of air pollution experts to estimate the costs of air pollution in Utah. Experts estimated that air pollution in Utah causes 2480 to 8000 premature deaths annually and decreases the median life expectancy by 1.1 to 3.6 years. Estimates of the economic costs of air pollution in Utah totaled $0.75 to $3.3 billion annually, approximately 1.7% of the state’s gross domestic product. Though these results were generally in line with available estimates from downscaled national studies, they were met with surprise in the state legislature, where there had been an almost complete absence of quantitative health and economic cost estimates. These findings suggest that local expert assessments can summarize policy-relevant science about urgent issues in a way that is robust, credible, and comprehensible. While no single intervention will resolve the multiple breakdowns in communication and collaboration that our society is currently experiencing, we conclude that combining quantitative assessments from local experts is a responsive and cost-effective tool to increase trust and information uptake during time-sensitive policy windows.

Supplementary Materials

The following are available online at https://www.mdpi.com/2073-4433/11/11/1238/s1, Table S1: Expert Assessment Questions, Table S2: Air Quality State Bills—Utah Legislative Sessions 2019 and 2020, Table S3: Analysis of comments and reactions on three articles covering the air pollution report, Figure S1. Relationships among reaction types. Section S3: Narrative of interactions with the state legislature, Section S4: Expert assessment questionnaire, Section S5: Executive brief 2020, Section S6: Informational one-pager 2019.

Author Contributions

Conceptualization, I.M.E., B.W.A., S.B., R.J.F., and L.L.; methodology, I.M.E. and B.W.A.; validation, I.M.E. and B.W.A.; formal analysis, I.M.E., B.W.A., D.L.M., L.M., S.S.S., J.G., and K.E.K.; investigation, B.W.A., D.L.M., L.M., J.G., K.E.K., T.C., R.A.C., A.F. (Andrew Freeman), H.A.H., P.D.H., J.D.J., R.M., and T.T.; data curation, I.M.E.; writing—original draft preparation, I.M.E.; writing—review and editing, I.M.E., B.W.A., D.L.M., L.M., S.S.S., J.G., K.E.K., J.D.B., S.B., T.C., R.A.C., A.F. (Andrew Freeman), A.F. (Andrew Follett), R.J.F., M.G., H.A.H., P.D.H., J.D.J., L.L., R.M., A.S., T.T., and D.W.; visualization, I.M.E., B.W.A., and S.S.S.; outreach and communication, I.M.E., B.W.A., A.S., A.F. (Andrew Freeman) and D.W.; supervision, B.W.A.; funding acquisition, I.M.E. All authors have read and agreed to the published version of the manuscript.

Funding

This work was funded by a College Undergraduate Research Award (CURA) from Brigham Young University administered through the College of Life Sciences and Department of Plant and Wildlife Sciences.

Acknowledgments

We thank the Utah Clean Air Caucus for their input, introductions to multiple legislators, and opportunity to present the initial findings.

Conflicts of Interest

The authors declare no conflict of interest.

References

  1. Burnett, R.; Chen, H.; Szyszkowicz, M.; Fann, N.; Hubbell, B.; Pope, C.A.; Apte, J.S.; Brauer, M.; Cohen, A.; Weichenthal, S.; et al. Global estimates of mortality associated with long-term exposure to outdoor fine particulate matter. Proc. Natl. Acad. Sci. USA 2018, 115, 9592–9597. [Google Scholar] [CrossRef] [Green Version]
  2. Landrigan, P.J.; Fuller, R.; Acosta, N.J.R.; Adeyi, O.; Arnold, R.; Basu, N.; Baldé, A.B.; Bertollini, R.; Bose-O’Reilly, S.; Boufford, J.I.; et al. The Lancet Commission on pollution and health. Lancet 2017. [Google Scholar] [CrossRef] [Green Version]
  3. Schraufnagel, D.E.; Balmes, J.R.; Cowl, C.T.; Matteis, S.D.; Jung, S.-H.; Mortimer, K.; Perez-Padilla, R.; Rice, M.B.; Riojas-Rodriguez, H.; Sood, A.; et al. Air Pollution and Noncommunicable Diseases: A Review by the Forum of International Respiratory Societies’ Environmental Committee, Part 1: The Damaging Effects of Air Pollution. Chest 2019, 155, 409–416. [Google Scholar] [CrossRef] [PubMed] [Green Version]
  4. Lelieveld, J.; Klingmüller, K.; Pozzer, A.; Pöschl, U.; Fnais, M.; Daiber, A.; Münzel, T. Cardiovascular disease burden from ambient air pollution in Europe reassessed using novel hazard ratio functions. Eur. Heart J. 2019, 40, 1590–1596. [Google Scholar] [CrossRef] [PubMed] [Green Version]
  5. World Health Organization. Global Health Estimates 2016: Death by Cause, Age, Sex, by Country and by Region, 2000–2016; Global Health Estimates; World Health Organization: Geneva, Switzerland, 2018. [Google Scholar]
  6. Cohen, A.J.; Brauer, M.; Burnett, R.; Anderson, H.R.; Frostad, J.; Estep, K.; Balakrishnan, K.; Brunekreef, B.; Dandona, L.; Dandona, R.; et al. Estimates and 25-year trends of the global burden of disease attributable to ambient air pollution: An analysis of data from the Global Burden of Diseases Study 2015. Lancet 2017, 389, 1907–1918. [Google Scholar] [CrossRef] [Green Version]
  7. World Health Organization. World Health Statistics 2020: Monitoring Health for the SDGs, Sustainable Development Goals; World Health Statistics; World Health Organization: Geneva, Switzerland, 2020; p. 92. [Google Scholar]
  8. Our World in Data. Available online: https://ourworldindata.org (accessed on 19 May 2020).
  9. Caiazzo, F.; Ashok, A.; Waitz, I.A.; Yim, S.H.L.; Barrett, S.R.H. Air pollution and early deaths in the United States. Part I: Quantifying the impact of major sectors in 2005. Atmos. Environ. 2013, 79, 198–208. [Google Scholar] [CrossRef]
  10. Goodkind, A.L.; Tessum, C.W.; Coggins, J.S.; Hill, J.D.; Marshall, J.D. Fine-scale damage estimates of particulate matter air pollution reveal opportunities for location-specific mitigation of emissions. Proc. Natl. Acad. Sci. USA 2019, 116, 8775–8780. [Google Scholar] [CrossRef] [Green Version]
  11. Hill, J.; Goodkind, A.; Tessum, C.; Thakrar, S.; Tilman, D.; Polasky, S.; Smith, T.; Hunt, N.; Mullins, K.; Clark, M.; et al. Air-quality-related health damages of maize. Nat. Sustain. 2019, 2, 397–403. [Google Scholar] [CrossRef]
  12. Wang, M.; Aaron, C.P.; Madrigano, J.; Hoffman, E.A.; Angelini, E.; Yang, J.; Laine, A.; Vetterli, T.M.; Kinney, P.L.; Sampson, P.D.; et al. Association Between Long-term Exposure to Ambient Air Pollution and Change in Quantitatively Assessed Emphysema and Lung Function. JAMA 2019, 322, 546–556. [Google Scholar] [CrossRef]
  13. Bares, R.; Lin, J.C.; Hoch, S.W.; Baasandorj, M.; Mendoza, D.L.; Fasoli, B.; Mitchell, L.; Catharine, D.; Stephens, B.B. The Wintertime Covariation of CO2 and Criteria Pollutants in an Urban Valley of the Western United States. J. Geophys. Res. Atmos. 2018, 123, 2684–2703. [Google Scholar] [CrossRef]
  14. Womack, C.C.; McDuffie, E.E.; Edwards, P.M.; Bares, R.; Gouw, J.A.; Docherty, K.S.; Dubé, W.P.; Fibiger, D.L.; Franchin, A.; Gilman, J.B.; et al. An Odd Oxygen Framework for Wintertime Ammonium Nitrate Aerosol Pollution in Urban Areas: NOx and VOC Control as Mitigation Strategies. Geophys. Res. Lett. 2019, 46, 4971–4979. [Google Scholar] [CrossRef] [Green Version]
  15. Mukerjee, S.; Smith, L.; Long, R.; Lonneman, W.; Kaushik, S.; Colon, M.; Oliver, K.; Whitaker, D. Particulate matter, nitrogen oxides, ozone, and select volatile organic compounds during a winter sampling period in Logan, Utah, USA. J. Air Waste Manag. Assoc. 2019, 69, 778–788. [Google Scholar] [CrossRef] [PubMed]
  16. Orellano, P.; Reynoso, J.; Quaranta, N.; Bardach, A.; Ciapponi, A. Short-term exposure to particulate matter (PM10 and PM2.5), nitrogen dioxide (NO2), and ozone (O3) and all-cause and cause-specific mortality: Systematic review and meta-analysis. Environ. Int. 2020, 142, 105876. [Google Scholar] [CrossRef] [PubMed]
  17. Vert, C.; Sánchez-Benavides, G.; Martínez, D.; Gotsens, X.; Gramunt, N.; Cirach, M.; Molinuevo, J.L.; Sunyer, J.; Nieuwenhuijsen, M.J.; Crous-Bou, M.; et al. Effect of long-term exposure to air pollution on anxiety and depression in adults: A cross-sectional study. Int. J. Hyg. Environ. Health 2017, 220, 1074–1080. [Google Scholar] [CrossRef]
  18. An, R.; Ji, M.; Yan, H.; Guan, C. Impact of ambient air pollution on obesity: A systematic review. Int. J. Obes. 2018, 42, 1112–1126. [Google Scholar] [CrossRef]
  19. Gładka, A.; Rymaszewska, J.; Zatoński, T. Impact of air pollution on depression and suicide. Int. J. Occup. Med. Environ. Health 2018, 31, 711–721. [Google Scholar] [CrossRef]
  20. Leiser, C.L.; Hanson, H.A.; Sawyer, K.; Steenblik, J.; Al-Dulaimi, R.; Madsen, T.; Gibbins, K.; Hotaling, J.M.; Ibrahim, Y.O.; VanDerslice, J.A.; et al. Acute effects of air pollutants on spontaneous pregnancy loss: A case-crossover study. Fertil. Steril. 2019, 111, 341–347. [Google Scholar] [CrossRef]
  21. O’Donoghue, A.J. Doctors Group Says Studies Show Air Pollution Even More Damaging than We Thought. 2019. Available online: DeseretNews.com (accessed on 2 February 2019).
  22. Roberts, S.; Arseneault, L.; Barratt, B.; Beevers, S.; Danese, A.; Odgers, C.L.; Moffitt, T.E.; Reuben, A.; Kelly, F.J.; Fisher, H.L. Exploration of NO2 and PM2.5 air pollution and mental health problems using high-resolution data in London-based children from a UK longitudinal cohort study. Psychiatry Res. 2019, 272, 8–17. [Google Scholar] [CrossRef]
  23. Calderón-Garcidueñas, L.; González-Maciel, A.; Mukherjee, P.S.; Reynoso-Robles, R.; Pérez-Guillé, B.; Gayosso-Chávez, C.; Torres-Jardón, R.; Cross, J.V.; Ahmed, I.A.M.; Karloukovski, V.V.; et al. Combustion- and friction-derived magnetic air pollution nanoparticles in human hearts. Environ. Res. 2019, 108567. [Google Scholar] [CrossRef]
  24. Schraufnagel, D.E.; Balmes, J.R.; De Matteis, S.; Hoffman, B.; Kim, W.J.; Perez-Padilla, R.; Rice, M.; Sood, A.; Vanker, A.; Wuebbles, D.J. Health Benefits of Air Pollution Reduction. Ann. Am. Thorac. Soc. 2019, 16, 1478–1487. [Google Scholar] [CrossRef]
  25. US EPA National Center for Environmental Assessment, R.T.P.N.; Sacks, J. Integrated Science Assessment (ISA) for Particulate Matter; US Environmental Protection Agency: Washington, DC, USA, 2019.
  26. Beard, J.D.; Beck, C.; Graham, R.; Packham, S.C.; Traphagan, M.; Giles, R.T.; Morgan, J.G. Winter Temperature Inversions and Emergency Department Visits for Asthma in Salt Lake County, Utah, 2003–2008. Environ. Health Perspect. 2012, 120, 1385–1390. [Google Scholar] [CrossRef] [PubMed] [Green Version]
  27. Mendola, P.; Ha, S.; Pollack, A.Z.; Zhu, Y.; Seeni, I.; Kim, S.S.; Sherman, S.; Liu, D. Chronic and Acute Ozone Exposure in the Week Prior to Delivery Is Associated with the Risk of Stillbirth. Int. J. Environ. Res. Public Health 2017, 14, 731. [Google Scholar] [CrossRef] [PubMed]
  28. Lozano, R.; Naghavi, M.; Foreman, K.; Lim, S.; Shibuya, K.; Aboyans, V.; Abraham, J.; Adair, T.; Aggarwal, R.; Ahn, S.Y.; et al. Global and regional mortality from 235 causes of death for 20 age groups in 1990 and 2010: A systematic analysis for the Global Burden of Disease Study 2010. Lancet 2012, 380, 2095–2128. [Google Scholar] [CrossRef]
  29. Zivin, J.G.; Neidell, M. Air pollution’s hidden impacts. Science 2018, 359, 39–40. [Google Scholar] [CrossRef]
  30. World Bank. The Cost of Air Pollution: Strengthening the Economic Case for Action; The World Bank: Washington, DC, USA, 2016; pp. 1–122. [Google Scholar]
  31. US Environmental Protection Agency the Clean Air Act and the Economy|Overview of the Clean Air Act and Air Pollution|US EPA. Available online: https://www.epa.gov/clean-air-act-overview/clean-air-act-and-economy#_edn3 (accessed on 14 January 2020).
  32. Muller, N.Z.; Mendelsohn, R.; Nordhaus, W. Environmental Accounting for Pollution in the United States Economy. Am. Econ. Rev. 2011, 101, 1649–1675. [Google Scholar] [CrossRef] [Green Version]
  33. Gilmore, E.A.; Heo, J.; Muller, N.Z.; Tessum, C.W.; Hill, J.D.; Marshall, J.D.; Adams, P.J. An inter-comparison of the social costs of air quality from reduced-complexity models. Environ. Res. Lett. 2019, 14, 074016. [Google Scholar] [CrossRef]
  34. Archsmith, J.; Heyes, A.; Saberian, S. Air Quality and Error Quantity: Pollution and Performance in a High-Skilled, Quality-Focused Occupation. J. Assoc. Environ. Resour. Econ. 2018, 5, 827–863. [Google Scholar] [CrossRef]
  35. Avnery, S.; Mauzerall, D.L.; Liu, J.; Horowitz, L.W. Global crop yield reductions due to surface ozone exposure: 2. Year 2030 potential crop production losses and economic damage under two scenarios of O3 pollution. Atmos. Environ. 2011, 45, 2297–2309. [Google Scholar] [CrossRef]
  36. Ford, E.S.; Murphy, L.B.; Khavjou, O.; Giles, W.H.; Holt, J.B.; Croft, J.B. Total and state-specific medical and absenteeism costs of COPD among adults aged ≥18 years in the United States for 2010 and projections through 2020. Chest 2015, 147, 31–45. [Google Scholar] [CrossRef]
  37. OECD. The Economic Consequences of Outdoor Air Pollution; OECD Publishing: Paris, France, 2016. [Google Scholar]
  38. Tai, A.P.K.; Val Martin, M. Impacts of ozone air pollution and temperature extremes on crop yields: Spatial variability, adaptation and implications for future food security. Atmos. Environ. 2017, 169, 11–21. [Google Scholar] [CrossRef]
  39. Wei, Y.; Wang, Y.; Di, Q.; Choirat, C.; Wang, Y.; Koutrakis, P.; Zanobetti, A.; Dominici, F.; Schwartz, J.D. Short term exposure to fine particulate matter and hospital admission risks and costs in the Medicare population: Time stratified, case crossover study. BMJ 2019, 367. [Google Scholar] [CrossRef] [PubMed] [Green Version]
  40. Bollen, J.; van der Zwaan, B.; Brink, C.; Eerens, H. Local air pollution and global climate change: A combined cost-benefit analysis. Resour. Energy Econ. 2009, 31, 161–181. [Google Scholar] [CrossRef] [Green Version]
  41. Lanzi, E.; Dellink, R.; Chateau, J. The sectoral and regional economic consequences of outdoor air pollution to 2060. Energy Econ. 2018, 71, 89–113. [Google Scholar] [CrossRef]
  42. Rao, S.; Klimont, Z.; Smith, S.J.; Van Dingenen, R.; Dentener, F.; Bouwman, L.; Riahi, K.; Amann, M.; Bodirsky, B.L.; van Vuuren, D.P.; et al. Future air pollution in the Shared Socio-economic Pathways. Glob. Environ. Chang. 2017, 42, 346–358. [Google Scholar] [CrossRef]
  43. Ryan, S.P. The Costs of Environmental Regulation in a Concentrated Industry. Econometrica 2012, 80, 1019–1061. [Google Scholar] [CrossRef] [Green Version]
  44. Bennett, J.E.; Tamura-Wicks, H.; Parks, R.M.; Burnett, R.T.; Iii, C.A.P.; Bechle, M.J.; Marshall, J.D.; Danaei, G.; Ezzati, M. Particulate matter air pollution and national and county life expectancy loss in the USA: A spatiotemporal analysis. PLoS Med. 2019, 16, e1002856. [Google Scholar] [CrossRef] [Green Version]
  45. Huang, J.; Pan, X.; Guo, X.; Li, G. Health impact of China’s Air Pollution Prevention and Control Action Plan: An analysis of national air quality monitoring and mortality data. Lancet Planet. Health 2018, 2, e313–e323. [Google Scholar] [CrossRef] [Green Version]
  46. McClure, C.D.; Jaffe, D.A. US particulate matter air quality improves except in wildfire-prone areas. Proc. Natl. Acad. Sci. USA 2018, 115, 7901–7906. [Google Scholar] [CrossRef] [Green Version]
  47. Lamsal, L.N.; Duncan, B.N.; Yoshida, Y.; Krotkov, N.A.; Pickering, K.E.; Streets, D.G.; Lu, Z.U.S. NO2 trends (2005–2013): EPA Air Quality System (AQS) data versus improved observations from the Ozone Monitoring Instrument (OMI). Atmos. Environ. 2015, 110, 130–143. [Google Scholar] [CrossRef]
  48. Park, Y.M.; Kwan, M.-P. Individual exposure estimates may be erroneous when spatiotemporal variability of air pollution and human mobility are ignored. Health Place 2017, 43, 85–94. [Google Scholar] [CrossRef]
  49. Zhang, X.; Craft, E.; Zhang, K. Characterizing spatial variability of air pollution from vehicle traffic around the Houston Ship Channel area. Atmos. Environ. 2017, 161, 167–175. [Google Scholar] [CrossRef]
  50. Snyder, E.G.; Watkins, T.H.; Solomon, P.A.; Thoma, E.D.; Williams, R.W.; Hagler, G.S.W.; Shelow, D.; Hindin, D.A.; Kilaru, V.J.; Preuss, P.W. The Changing Paradigm of Air Pollution Monitoring. Environ. Sci. Technol. 2013, 47, 11369–11377. [Google Scholar] [CrossRef] [PubMed]
  51. Fuller, G.W.; Font, A. Keeping air pollution policies on track. Science 2019, 365, 322–323. [Google Scholar] [CrossRef] [PubMed] [Green Version]
  52. Krotkov, N.A.; McLinden, C.A.; Li, C.; Lamsal, L.N.; Celarier, E.A.; Marchenko, S.V.; Swartz, W.H.; Bucsela, E.J.; Joiner, J.; Duncan, B.N.; et al. Aura OMI observations of regional SO2 and NO2 pollution changes from 2005 to 2015. Atmos. Chem. Phys. 2016, 16, 4605–4629. [Google Scholar] [CrossRef] [Green Version]
  53. Al-Delaimy, W.K. Health of People, Health of Planet and Our Responsibility; Springer Nature: Cham, Switzerland, 2020; ISBN 978-3-030-31125-4. [Google Scholar]
  54. Huang, L.; Rao, C.; van der Kuijp, T.J.; Bi, J.; Liu, Y. A comparison of individual exposure, perception, and acceptable levels of PM2.5 with air pollution policy objectives in China. Environ. Res. 2017, 157, 78–86. [Google Scholar] [CrossRef]
  55. Suk, W.A.; Ahanchian, H.; Asante, K.A.; Carpenter, D.O.; Diaz-Barriga, F.; Ha, E.-H.; Huo, X.; King, M.; Ruchirawat, M.; Da Silva, E.R.; et al. Environmental Pollution: An Under-recognized Threat to Children’s Health, Especially in Low- and Middle-Income Countries. Environ. Health Perspect. 2016, 124, A41–A45. [Google Scholar] [CrossRef] [Green Version]
  56. Landrigan, P.J.; Fuller, R.B. Environmental pollution: An enormous and invisible burden on health systems in low- and middle-income counties. World Hosp. Health Serv. Off. J. Int. Hosp. Fed. 2014, 50, 35–40. [Google Scholar] [PubMed]
  57. Reilly, S. EPA Scientists Said U.S. Should Tighten Key Air Pollution Limit. The Agency’s Head Just Said No. E&E News. 14 April 2020. Available online: https://www.sciencemag.org/news/2020/04/epa-scientists-said-us-should-tighten-key-air-pollution-limit-agency-s-head-just-said (accessed on 9 October 2020).
  58. Greenberg, H.; Leeder, S.R.; Raymond, S.U. And Why So Great a “No?”: The Donor and Academic Communities’ Failure to Confront Global Chronic Disease. Glob. Heart 2016, 11, 381–385. [Google Scholar] [CrossRef]
  59. Nugent, R. A Chronology of Global Assistance Funding for NCD. Glob. Heart 2016, 11, 371–374. [Google Scholar] [CrossRef]
  60. Newmark, A.J.; Witko, C. Pollution, Politics, and Preferences for Environmental Spending in the States. Rev. Policy Res. 2007, 24, 291–308. [Google Scholar] [CrossRef] [Green Version]
  61. Oltra, C.; Sala, R. Perception of risk from air pollution and reported behaviors: A cross-sectional survey study in four cities. J. Risk Res. 2018, 21, 869–884. [Google Scholar] [CrossRef]
  62. Bickerstaff, K. Risk perception research: Socio-cultural perspectives on the public experience of air pollution. Environ. Int. 2004, 30, 827–840. [Google Scholar] [CrossRef] [PubMed]
  63. Bonaiuto, M.; Breakwell, G.M.; Cano, I. Identity Processes and Environmental Threat: The Effects of Nationalism and Local Identity upon Perception of Beach Pollution. J. Community Appl. Soc. Psychol. 1996, 6, 157–175. [Google Scholar] [CrossRef]
  64. Schumacher, I.; Zou, B. Pollution perception: A challenge for intergenerational equity. J. Environ. Econ. Manag. 2008, 55, 296–309. [Google Scholar] [CrossRef]
  65. Semenza, J.C.; Wilson, D.J.; Parra, J.; Bontempo, B.D.; Hart, M.; Sailor, D.J.; George, L.A. Public perception and behavior change in relationship to hot weather and air pollution. Environ. Res. 2008, 107, 401–411. [Google Scholar] [CrossRef]
  66. Bickerstaff, K.; Walker, G. Clearing the smog? Public responses to air-quality information. Local Environ. 1999, 4, 279–294. [Google Scholar] [CrossRef]
  67. Levin, K.; Cashore, B.; Bernstein, S.; Auld, G. Overcoming the tragedy of super wicked problems: Constraining our future selves to ameliorate global climate change. Policy Sci. 2012, 45, 123–152. [Google Scholar] [CrossRef]
  68. Rittel, H.W.J.; Webber, M.M. Dilemmas in a general theory of planning. Policy Sci. 1973, 4, 155–169. [Google Scholar] [CrossRef]
  69. Goldman, G.T.; Dominici, F. Don’t abandon evidence and process on air pollution policy. Science 2019, 363, 1398–1400. [Google Scholar] [CrossRef]
  70. Tollefson, J. Air pollution science under siege at US environment agency. Nature 2019, 568, 15–16. [Google Scholar] [CrossRef] [Green Version]
  71. Wagner, W.; Fisher, E.; Pascual, P. Whose science? A new era in regulatory “science wars”. Science 2018, 362, 636–639. [Google Scholar] [CrossRef] [PubMed]
  72. Oreskes, N.; Conway, E.M. Merchants of Doubt: How a Handful of Scientists Obscured the Truth on Issues from Tobacco Smoke to Global Warming; Bloomsbury Publishing: New York City, NY, USA, 2010; ISBN 978-1-60819-293-9. [Google Scholar]
  73. Dockery, D.W. Health Effects of Particulate Air Pollution. Ann. Epidemiol. 2009, 19, 257–263. [Google Scholar] [CrossRef] [PubMed] [Green Version]
  74. Morrey, S. Geneva to Counter Study by Pope. Dly. Her: Provo, UT, August 30, 1989, 26, 1. Available online: https://newspapers.lib.utah.edu/details?id=24081733&q=Lamm&rows=200&sort=date_tdt+asc%2Cparent_i+asc%2Cpage_i+asc&year_start=1987&year_end=1990&facet_paper=%22Provo+Daily+Herald%22 (accessed on 27 June 2020).
  75. Reilly, S. Trump’s EPA Scraps Air Pollution Science Review Panels. E&E News. 12 October 2018. Available online: https://www.sciencemag.org/news/2018/10/trump-s-epa-scraps-air-pollution-science-review-panels (accessed on 15 February 2020).
  76. Adler, R.W. Coevolution of Law and Science. Colombia Journal of Environmental Law. 2019, 44, 1–66. [Google Scholar] [CrossRef]
  77. Stokes, L.C. Short Circuiting Policy: Interest Groups and the Battle Over Clean Energy and Climate Policy in the American States; Oxford University Press: Oxford, UK, 2020; ISBN 978-0-19-007427-2. [Google Scholar]
  78. Abbott, B.W.; Jones, J.B.; Schuur, E.A.G.; Chapin, F.S.C., III; Bowden, W.B.; Bret-Harte, M.S.; Epstein, H.E.; Flannigan, M.D.; Harms, T.K.; Hollingsworth, T.N.; et al. Biomass offsets little or none of permafrost carbon release from soils, streams, and wildfire: An expert assessment. Environ. Res. Lett. 2016, 11, 034014. [Google Scholar] [CrossRef]
  79. Morgan, M.G. Use (and abuse) of expert elicitation in support of decision making for public policy. Proc. Natl. Acad. Sci. USA 2014, 111, 7176–7184. [Google Scholar] [CrossRef] [Green Version]
  80. Schuur, E.A.G.; Abbott, B.W.; Bowden, W.B.; Brovkin, V.; Camill, P.; Canadell, J.G.; Chanton, J.P.; Chapin, F.S.; Christensen, T.R.; Ciais, P.; et al. Expert assessment of vulnerability of permafrost carbon to climate change. Clim. Chang. 2013, 119, 359–374. [Google Scholar] [CrossRef] [Green Version]
  81. Aspinall, W.P. Structured elicitation of expert judgment for probabilistic hazard and risk assessment in volcanic eruptions. Stat. Volcanol. 2006, 1, 15–30. [Google Scholar]
  82. Bordley, R.F. Combining the Opinions of Experts Who Partition Events Differently. Decis. Anal. 2009, 6, 38–46. [Google Scholar] [CrossRef]
  83. Zickfeld, K.; Morgan, M.G.; Frame, D.J.; Keith, D.W. Expert judgments about transient climate response to alternative future trajectories of radiative forcing. Proc. Natl. Acad. Sci. USA 2010, 107, 12451–12456. [Google Scholar] [CrossRef] [Green Version]
  84. Oppenheimer, M.; Oreskes, N.; Jamieson, D.; O’Reilly, J.; Brysse, K.; Shindell, M.; Wazeck, M. Discerning Experts: The Practices of Scientific Assessment for Environmental Policy; University of Chicago Press: Chicago, IL, USA, 2019; ISBN 978-0-226-60201-1. [Google Scholar]
  85. Brownell, K.D.; Roberto, C.A. Strategic science with policy impact. Lancet 2015, 385, 2445–2446. [Google Scholar] [CrossRef]
  86. Nisbet, M.C.; Mooney, C. Framing Science. Science 2007, 316, 56. [Google Scholar] [CrossRef] [PubMed]
  87. Israel, B.A.; Schulz, A.J.; Parker, E.A.; Becker, A.B. Review of Community-Based Research: Assessing Partnership Approaches to Improve Public Health. Annu. Rev. Public Health 1998, 19, 173–202. [Google Scholar] [CrossRef] [PubMed] [Green Version]
  88. Schneider, F.; Giger, M.; Harari, N.; Moser, S.; Oberlack, C.; Providoli, I.; Schmid, L.; Tribaldos, T.; Zimmermann, A. Transdisciplinary co-production of knowledge and sustainability transformations: Three generic mechanisms of impact generation. Environ. Sci. Policy 2019, 102, 26–35. [Google Scholar] [CrossRef]
  89. Walter, N.; Murphy, S.T. How to unring the bell: A meta-analytic approach to correction of misinformation. Commun. Monogr. 2018, 85, 423–441. [Google Scholar] [CrossRef]
  90. Oreskes, N.; Edenhofer, O. Why Trust Science? Princeton University Press: Princeton, NJ, USA, 2019; ISBN 978-0-691-17900-1. [Google Scholar]
  91. Sleeth-Keppler, D. Seeing the World in Black and White: The Effects of Perceptually Induced Mind-Sets on Judgment. Available online: https://journals.sagepub.com/doi/full/10.1111/j.1467-9280.2007.01976.x (accessed on 26 June 2020).
  92. Leiserowitz, A. Communicating the risks of global warming: American risk perceptions, affective images, and interpretive communities. In Creating a Climate for Change: Communicating Climate Change and Facilitating Social Change; Dilling, L., Moser, S.C., Eds.; Cambridge University Press: Cambridge, UK, 2007; pp. 44–63. ISBN 978-0-521-04992-4. [Google Scholar]
  93. Scannell, L.; Gifford, R. Personally Relevant Climate Change: The Role of Place Attachment and Local Versus Global Message Framing in Engagement. Environ. Behav. 2011. [Google Scholar] [CrossRef] [Green Version]
  94. Rose, D.C.; Mukherjee, N.; Simmons, B.I.; Tew, E.R.; Robertson, R.J.; Vadrot, A.B.M.; Doubleday, R.; Sutherland, W.J. Policy windows for the environment: Tips for improving the uptake of scientific knowledge. Environ. Sci. Policy 2017. [Google Scholar] [CrossRef] [Green Version]
  95. US EPA. National Ambient Air Quality Standards (NAAQS) for PM; United States Environmental Protection Agency: Washington, DC, USA, 2020.
  96. Utah DAQ. Utah Division of Air Quality 2018 Annual Report; Salt Lake City, UT, USA, 2018. Available online: https://documents.deq.utah.gov/air-quality/annual-reports/DAQ-2019-000949.pdf (accessed on 10 November 2020).
  97. Matichuk, R.; Tonnesen, G.; Luecken, D.; Gilliam, R.; Napelenok, S.L.; Baker, K.R.; Schwede, D.; Murphy, B.; Helmig, D.; Lyman, S.N.; et al. Evaluation of the Community Multiscale Air Quality Model for Simulating Winter Ozone Formation in the Uinta Basin. J. Geophys. Res. Atmos. 2017, 122, 13545–13572. [Google Scholar] [CrossRef]
  98. Edwards, P.M.; Brown, S.S.; Roberts, J.M.; Ahmadov, R.; Banta, R.M.; deGouw, J.A.; Dubé, W.P.; Field, R.A.; Flynn, J.H.; Gilman, J.B.; et al. High winter ozone pollution from carbonyl photolysis in an oil and gas basin. Nature 2014, 514, 351–354. [Google Scholar] [CrossRef]
  99. Ransom, M.R.; Pope, C.A. Elementary school absences and PM10 pollution in Utah Valley. Environ. Res. 1992, 58, 204–219. [Google Scholar] [CrossRef]
  100. Franchin, A.; Fibiger, D.L.; Goldberger, L.; McDuffie, E.E.; Moravek, A.; Womack, C.C.; Crosman, E.T.; Docherty, K.S.; Dube, W.P.; Hoch, S.W.; et al. Airborne and ground-based observations of ammonium-nitrate-dominated aerosols in a shallow boundary layer during intense winter pollution episodes in northern Utah. Atmos. Chem. Phys. 2018, 18, 17259–17276. [Google Scholar] [CrossRef] [Green Version]
  101. Kem, C.; Gardner Policy Institute. The Utah Roadmap: Positive Solutions on Climate and Air Quality; Gardner Policy Institute: Salt Lake City, UT, USA, 2020. [Google Scholar]
  102. Mendoza, D.L.; Buchert, M.; Lin, J.C. Modeling net effects of transit operations on vehicle miles traveled, fuel consumption, carbon dioxide, and criteria air pollutant emissions in a mid-size U.S. metro area: Findings from Salt Lake City, UT. Environ. Res. Commun. 2019. [Google Scholar] [CrossRef]
  103. Abatzoglou, J.T.; Williams, A.P. Impact of anthropogenic climate change on wildfire across western US forests. Proc. Natl. Acad. Sci. USA 2016, 113, 11770–11775. [Google Scholar] [CrossRef] [PubMed] [Green Version]
  104. Abbott, B.W.; Errigo, I.M.; Jarvis, D.K. Commentary: Utah air pollution is literally killing us. The Salt Lake Tribune, 2 February 2020. [Google Scholar]
  105. Kauffman, G. Study shows rise in ozone-related deaths in Salt Lake City. KSL News, 22 May 2019. [Google Scholar]
  106. Miller, C. Doctor says Utah’s air pollution leading to premature death of thousands. KUTV, 15 February 2016. [Google Scholar]
  107. Penrod, E. Utah’s air quality is sickening, even killing locals year-round, new research suggests. The Salt Lake Tribune, 9 January 2018. [Google Scholar]
  108. UPHE. 2019 Report on Air Pollution and Health Research—Utah Physicians for Healthy Environment; Utah Physicians for a Healthy Environment: Salt Lake City, UT, USA, 2019. [Google Scholar]
  109. Envision Utah Envision Utah—Home. Available online: https://www.envisionutah.org/ (accessed on 16 April 2019).
  110. US EPA. Outdoor Air Quality Data. Available online: https://www.epa.gov/outdoor-air-quality-data/download-daily-data (accessed on 1 July 2020).
  111. Maffly, B. Salt Lake City’s air quality is nation’s 7th worst among large metro areas. The Salt Lake Tribune, 28 January 2020. [Google Scholar]
  112. Whiteman, C.D.; Hoch, S.W.; Horel, J.D.; Charland, A. Relationship between particulate air pollution and meteorological variables in Utah’s Salt Lake Valley. Atmos. Environ. 2014, 94, 742–753. [Google Scholar] [CrossRef]
  113. Daniels, B.; Follett, A.; Davis, J. The Making of the Clean Air Act; Hastings, L.J., Ed.; San Francisco, CA, USA, 2020; Available online: https://repository.uchastings.edu/hastings_law_journal/vol71/iss4/3 (accessed on 10 November 2020).
  114. Cromar, K.R.; Gladson, L.A.; Ewart, G. Trends in Excess Morbidity and Mortality Associated with Air Pollution Above American Thoracic Society–Recommended Standards, 2008–2017. Ann. ATS 2019, 16, 836–845. [Google Scholar] [CrossRef] [PubMed]
  115. Kim, S.-Y.; Bechle, M.; Hankey, S.; Sheppard, L.; Szpiro, A.A.; Marshall, J.D. Concentrations of criteria pollutants in the contiguous U.S., 1979 – 2015: Role of prediction model parsimony in integrated empirical geographic regression. PLoS ONE 2020, 15, e0228535. [Google Scholar] [CrossRef] [Green Version]
  116. Bowe, B.; Xie, Y.; Yan, Y.; Al-Aly, Z. Burden of Cause-Specific Mortality Associated with PM2.5 Air Pollution in the United States. JAMA Netw Open 2019, 2, e1915834. [Google Scholar] [CrossRef] [Green Version]
  117. Mitchell, L.E. History of Air Quality in Utah 2020. Presented at Air Quality Science for Solutions, 16 November 2020. [Google Scholar]
  118. Hindsley, G.; Johnston, M. Temperature Inversions, Utah, Provo Herald; Provo, UT, USA, 2019. Available online: https://deq.utah.gov/air-quality/inversions (accessed on 10 November 2020).
  119. Kay, J.; Brown, C.J. Mormon beliefs about land and natural resources, 1847–1877. J. Hist. Geogr. 1985, 11, 253–267. [Google Scholar] [CrossRef]
  120. Abbott, R.G. The Scandinavian Immigrant Experience in Utah, 1850–1920: Using Material Culture to Interpret Cultural Adaptation. Ph.D. Thesis, University of Alaska Fairbanks, Fairbanks, AK, USA, 2013. [Google Scholar]
  121. Deseret Evening News the Nuisance of Smoke. Deseret Evening News, 3 December 1881.
  122. Salt Lake Tribune the Smoke Nuisance. The Salt Lake Tribune, 22 February 1893.
  123. Deseret Evening News to Abate the Smoke Nuisance. Deseret Evening News, 21 December 1891.
  124. Perrott, G.S.J. Smoke Problem at Salt Lake City. Power Plant Eng. 1920, 24, 784–785. [Google Scholar]
  125. Monnett, O. Smoke Abatement; U.S. Government Printing Office: Washington, DC, USA, 1923.
  126. Henry, R.C.; Hidy, G.M. Multivariate analysis of particulate sulfate and other air quality variables by principal components—II. Salt Lake City, Utah and St. Louis, Missouri. Atmos. Environ. (1967) 1982, 16, 929–943. [Google Scholar] [CrossRef]
  127. Pope, C.A., III. Respiratory disease associated with community air pollution and a steel mill, Utah Valley. Am. J. Public Health 1989, 79, 623–628. [Google Scholar] [CrossRef] [Green Version]
  128. Pope, C.A., III; Schwartz, J.; Ransom, M.R. Daily mortality and PM10 pollution in Utah Valley. Arch. Environ. Health: Int. J. 1992, 47, 211–217. [Google Scholar] [CrossRef] [PubMed]
  129. Bakian, A.V.; Huber, R.S.; Coon, H.; Gray, D.; Wilson, P.; McMahon, W.M.; Renshaw, P.F. Acute air pollution exposure and risk of suicide completion. Am. J. Epidemiol. 2015, 181, 295–303. [Google Scholar] [CrossRef] [PubMed] [Green Version]
  130. Chaney, R.A.; Sloan, C.D.; Cooper, V.C.; Robinson, D.R.; Hendrickson, N.R.; McCord, T.A.; Johnston, J.D. Personal exposure to fine particulate air pollution while commuting: An examination of six transport modes on an urban arterial roadway. PLoS ONE 2017, 12, e0188053. [Google Scholar] [CrossRef] [PubMed]
  131. Ivey, C.E.; Balachandran, S.; Colgan, S.; Hu, Y.; Holmes, H.A. Investigating fine particulate matter sources in Salt Lake City during persistent cold air pool events. Atmos. Environ. 2019, 213, 568–578. [Google Scholar] [CrossRef]
  132. Mullen, C.; Grineski, S.; Collins, T.; Xing, W.; Whitaker, R.; Sayahi, T.; Becnel, T.; Goffin, P.; Gaillardon, P.-E.; Meyer, M.; et al. Patterns of distributive environmental inequity under different PM2.5 air pollution scenarios for Salt Lake County public schools. Environ. Res. 2020, 186, 109543. [Google Scholar] [CrossRef]
  133. Utah, G.C.A.C. Governor’s Clean Air Commission: Summary of Recommendations; All Five Work Group Reports; Utah State Publications; Governor’s Clean Air Commission: Salt Lake City, UT, USA, 1990; p. 543.
  134. Heaney, R.J.; Winn, G.S.; Thorne, W.; Lloyd, L.H. Air Resources of Utah; Utah Legislative Council; Air Pollution Advisory Committee: Salt Lake City, UT, USA, 1962. [Google Scholar]
  135. Aspinall, W. A route to more tractable expert advice. Nature 2010, 463, 294–295. [Google Scholar] [CrossRef]
  136. Baker, L.; Ellison, D. The wisdom of crowds—Ensembles and modules in environmental modelling. Geoderma 2008, 147, 1–7. [Google Scholar] [CrossRef]
  137. Aarstad, J. Expert credibility and truth. Proc. Natl. Acad. Sci. USA 2010, 107, E176. [Google Scholar] [CrossRef] [Green Version]
  138. Cooke, R.M.; Wilson, A.M.; Tuomisto, J.T.; Morales, O.; Tainio, M.; Evans, J.S. A probabilistic characterization of the relationship between fine particulate matter and mortality: Elicitation of European experts. Environ. Sci. Technol. 2007, 41, 6598–6605. [Google Scholar] [CrossRef]
  139. Augustovski, F.; Colantonio, L.D.; Galante, J.; Bardach, A.; Caporale, J.E.; Zárate, V.; Chuang, L.H.; Pichon-Riviere, A.; Kind, P. Measuring the Benefits of Healthcare: DALYs and QALYs—Does the Choice of Measure Matter? A Case Study of Two Preventive Interventions. Int. J. Health Policy Manag. 2017, 7, 120–136. [Google Scholar] [CrossRef] [Green Version]
  140. Khreis, H.; Kelly, C.; Tate, J.; Parslow, R.; Lucas, K.; Nieuwenhuijsen, M. Exposure to traffic-related air pollution and risk of development of childhood asthma: A systematic review and meta-analysis. Environ. Int. 2017, 100, 1–31. [Google Scholar] [CrossRef] [PubMed] [Green Version]
  141. Orellano, P.; Quaranta, N.; Reynoso, J.; Balbi, B.; Vasquez, J. Effect of outdoor air pollution on asthma exacerbations in children and adults: Systematic review and multilevel meta-analysis. PLoS ONE 2017, 12, e0174050. [Google Scholar] [CrossRef] [PubMed]
  142. Global Burden of Disease and Risk Factors; Lopez, A.D.; Mathers, C.D.; Ezzati, M.; Jamison, D.T.; Murray, C.J.L. (Eds.) The World Bank: Washington, DC, USA, 2006; ISBN 978-0-8213-6262-4. [Google Scholar]
  143. Egunsola, O.; Raubenheimer, J.; Buckley, N. Variability in the burden of disease estimates with or without age weighting and discounting: A methodological study. BMJ Open 2019, 9, e027825. [Google Scholar] [CrossRef] [PubMed] [Green Version]
  144. Koksalmis, E.; Kabak, Ö. Deriving decision makers’ weights in group decision making: An overview of objective methods. Inf. Fusion 2019, 49, 146–160. [Google Scholar] [CrossRef]
  145. Sutherland, W.J.; Burgman, M. Policy advice: Use experts wisely. Nat. News 2015, 526, 317. [Google Scholar] [CrossRef] [Green Version]
  146. R Core Team. R: A Language and Environment for Statistical Computing; R Foundation for Statistical Computing: Vienna, Austria, 2013. [Google Scholar]
  147. Cooke, R.M.; ElSaadany, S.; Huang, X. On the performance of social network and likelihood-based expert weighting schemes. Reliab. Eng. Syst. Saf. 2008, 93, 745–756. [Google Scholar] [CrossRef]
  148. Burgman, M.A.; McBride, M.; Ashton, R.; Speirs-Bridge, A.; Flander, L.; Wintle, B.; Fidler, F.; Rumpff, L.; Twardy, C. Expert Status and Performance. PLoS ONE 2011, 6, e22998. [Google Scholar] [CrossRef]
  149. IBIS-Public Health IBIS-PH—Query Result—Years of Potential Life Lost (YPLL—Premature Mortality) Before Age 75 for Utah Counties—Rate of Potential Life Lost per 100,000 Population. Available online: https://ibis.health.utah.gov/ibisph-view/query/result/ypll/YPLLCntyICD10/CrudeRate.html (accessed on 5 June 2020).
  150. Abbott, B.W. Ben Abbott: Earth Day at 50 has never been so relevant. The Salt Lake Tribune, 21 April 2020. [Google Scholar]
  151. Eckelman, M.J.; Sherman, J. Environmental Impacts of the U.S. Health Care System and Effects on Public Health. PLoS ONE 2016, 11, e0157014. [Google Scholar] [CrossRef] [Green Version]
  152. Pagalan, L.; Bickford, C.; Weikum, W.; Lanphear, B.; Brauer, M.; Lanphear, N.; Hanley, G.E.; Oberlander, T.F.; Winters, M. Association of Prenatal Exposure to Air Pollution with Autism Spectrum Disorder. JAMA Pediatr. 2019, 173, 86–92. [Google Scholar] [CrossRef]
  153. Peters, R.; Ee, N.; Peters, J.; Booth, A.; Mudway, I.; Anstey, K.J. Air Pollution and Dementia: A Systematic Review. J. Alzheimer’s Dis. 2019, 70, S145–S163. [Google Scholar] [CrossRef] [Green Version]
  154. Hackmann, D.; Sjöberg, E. Ambient air pollution and pregnancy outcomes—a study of functional form and policy implications. Air Qual. Atmos. Health 2017, 10, 129–137. [Google Scholar] [CrossRef]
  155. Checa Vizcaíno, M.A.; González-Comadran, M.; Jacquemin, B. Outdoor air pollution and human infertility: A systematic review. Fertil. Steril. 2016, 106, 897–904.e1. [Google Scholar] [CrossRef] [PubMed] [Green Version]
  156. Di, Q.; Wang, Y.; Zanobetti, A.; Wang, Y.; Koutrakis, P.; Choirat, C.; Dominici, F.; Schwartz, J.D. Air Pollution and Mortality in the Medicare Population. N. Engl. J. Med. 2017, 376, 2513–2522. [Google Scholar] [CrossRef] [PubMed]
  157. Stevens, T. Legislature falls far short of governor’s goal of investing $100M to improve air quality. Advocates say it’s a good first step. The Salt Lake Tribune, 14 March 2019. [Google Scholar]
  158. Sörqvist, P.; Langeborg, L. Why People Harm the Environment Although They Try to Treat It Well: An Evolutionary-Cognitive Perspective on Climate Compensation. Front. Psychol. 2019, 10. [Google Scholar] [CrossRef] [PubMed]
  159. Ditto, P.H.; Liu, B.S.; Clark, C.J.; Wojcik, S.P.; Chen, E.E.; Grady, R.H.; Celniker, J.B.; Zinger, J.F. At Least Bias Is Bipartisan: A Meta-Analytic Comparison of Partisan Bias in Liberals and Conservatives. Perspect. Psychol. Sci. 2019, 14, 273–291. [Google Scholar] [CrossRef] [Green Version]
  160. MacGillivray, B.H.; Franklin, A. Place as a boundary device for the sustainability sciences: Concepts of place, their value in characterising sustainability problems, and their role in fostering integrative research and action. Environ. Sci. Policy 2015, 53, 1–7. [Google Scholar] [CrossRef]
  161. Gudmundsen, A. Nine Years of Smoke-Abatement Work at Salt Lake City; U.S. Department of Commerce, Bureau of Mines: Wasington, DC, USA, 1930.
  162. U.S. National Air Pollution Control Administration. Report for Consultation on the Wasatch Front Intrastate Air Quality Control Region (Utah); U.S. Department of Health, Education, and Welfare: Washington, DC, USA, 1970.
  163. Moore, F.C.; Obradovich, N.; Lehner, F.; Baylis, P. Rapidly declining remarkability of temperature anomalies may obscure public perception of climate change. Proc. Natl. Acad. Sci. USA 2019, 116, 4905–4910. [Google Scholar] [CrossRef] [Green Version]
  164. Muindi, K.; Egondi, T.; Kimani-Murage, E.; Rocklov, J.; Ng, N. “We are used to this”: A qualitative assessment of the perceptions of and attitudes towards air pollution amongst slum residents in Nairobi. BMC Public Health 2014, 14, 226. [Google Scholar] [CrossRef]
  165. Hoffmann, S.; Thompson Klein, J.; Pohl, C. Linking transdisciplinary research projects with science and practice at large: Introducing insights from knowledge utilization. Environ. Sci. Policy 2019, 102, 36–42. [Google Scholar] [CrossRef] [Green Version]
  166. Musch, A.-K.; von Streit, A. (Un)intended effects of participation in sustainability science: A criteria-guided comparative case study. Environ. Sci. Policy 2020, 104, 55–66. [Google Scholar] [CrossRef]
  167. Bowen, S.; Zwi, A.B. Pathways to “Evidence-Informed” Policy and Practice: A Framework for Action. PLoS Med. 2005, 2, e166. [Google Scholar] [CrossRef] [PubMed] [Green Version]
  168. Glasgow, R.E.; Emmons, K.M. How Can We Increase Translation of Research into Practice? Types of Evidence Needed. Annu. Rev. Public Health 2007, 28, 413–433. [Google Scholar] [CrossRef] [PubMed] [Green Version]
  169. Gonzalez, P.A.; Minkler, M.; Garcia, A.P.; Gordon, M.; Garzón, C.; Palaniappan, M.; Prakash, S.; Beveridge, B. Community-Based Participatory Research and Policy Advocacy to Reduce Diesel Exposure in West Oakland, California. Am. J. Public Health 2011, 101, S166–S175. [Google Scholar] [CrossRef] [PubMed]
  170. Van Bueren, E.M.; Klijn, E.; Koppenjan, J.F.M. Dealing with Wicked Problems in Networks: Analyzing an Environmental Debate from a Network Perspective. J. Public Adm. Res. Theory 2003, 13, 193–212. [Google Scholar] [CrossRef]
  171. Abbott, B.W.; Moatar, F.; Gauthier, O.; Fovet, O.; Antoine, V.; Ragueneau, O. Trends and seasonality of river nutrients in agricultural catchments: 18 years of weekly citizen science in France. Sci. Total Environ. 2018, 624, 845–858. [Google Scholar] [CrossRef] [PubMed]
  172. Bonney, R.; Phillips, T.B.; Ballard, H.L.; Enck, J.W. Can citizen science enhance public understanding of science? Public Underst. Sci. 2016, 25, 2–16. [Google Scholar] [CrossRef]
  173. Buytaert, W.; Zulkafli, Z.; Grainger, S.; Acosta, L.; Alemie, T.C.; Bastiaensen, J.; De Bièvre, B.; Bhusal, J.; Clark, J.; Dewulf, A.; et al. Citizen science in hydrology and water resources: Opportunities for knowledge generation, ecosystem service management, and sustainable development. Front. Earth Sci. 2014, 2. [Google Scholar] [CrossRef] [Green Version]
  174. Giannadaki, D.; Lelieveld, J.; Pozzer, A. Implementing the US air quality standard for PM2.5 worldwide can prevent millions of premature deaths per year. Environ Health 2016, 15, 88. [Google Scholar] [CrossRef] [Green Version]
  175. Le Moal, M.; Gascuel-Odoux, C.; Ménesguen, A.; Souchon, Y.; Étrillard, C.; Levain, A.; Moatar, F.; Pannard, A.; Souchu, P.; Lefebvre, A.; et al. Eutrophication: A new wine in an old bottle? Sci. Total Environ. 2019, 651, 1–11. [Google Scholar] [CrossRef] [Green Version]
  176. Oreskes, N.; Conway, E.M. Defeating the merchants of doubt. Nature 2010, 465, 686–687. [Google Scholar] [CrossRef]
  177. Hansen, A.; Cox, R. The Routledge Handbook of Environment and Communication; Routledge: New York City, NY, USA, 2015; ISBN 978-1-134-52131-9. [Google Scholar]
  178. Selin, H.; VanDeveer, S.D. Mapping Institutional Linkages in European Air Pollution Politics. Glob. Environ. Politics 2003, 3, 14–46. [Google Scholar] [CrossRef]
  179. Swift, B. How Environmental Laws Work: An Analysis of the Utility Sector’s Response to Regulation of Nitrogen Oxides and Sulfur Dioxide under the Clean Air Act. Tul. Envtl. L.J. 2000, 14, 309. [Google Scholar]
  180. Daniels, B.; Steele, M.; Sun, L.G. Just Environmentalism; Social Science Research Network: Rochester, NY, USA, 2018. [Google Scholar]
  181. Bhatnagar, N.; McKay-Nesbitt, J. Pro-environment advertising messages: The role of regulatory focus. Int. J. Advert. 2016, 35, 4–22. [Google Scholar] [CrossRef]
  182. Economists Opinion | Economists’ Statement on Carbon Dividends. Wall Str. J. 16 January 2019. Available online: https://www.wsj.com/articles/economists-statement-on-carbon-dividends-11547682910 (accessed on 10 November 2020).
  183. Wei, M.; Patadia, S.; Kammen, D.M. Putting renewables and energy efficiency to work: How many jobs can the clean energy industry generate in the US? Energy Policy 2010, 38, 919–931. [Google Scholar] [CrossRef]
  184. Jacobson, M.Z.; A Delucchi, M.; Bazouin, G.; Bauer, Z.A.F.; Heavey, C.C.; Fisher, E.; Morris, S.B.; Piekutowski, D.J.Y.; Vencill, T.A.; Yeskoo, T.W. 100% clean and renewable wind, water, and sunlight (WWS) all-sector energy roadmaps for the 50 United States. Energy Environ. Sci. 2015, 8, 2093–2117. [Google Scholar] [CrossRef]
  185. Lehr, U.; Lutz, C.; Edler, D. Green jobs? Economic impacts of renewable energy in Germany. Energy Policy 2012, 47, 358–364. [Google Scholar] [CrossRef] [Green Version]
  186. Griffith, S.; Calisch, S.; Fraser, L. Rewiring America: Online Blog. 2020. Available online: https://www.rewiringamerica.org/ (accessed on 10 November 2020).
  187. Zhang, Q.; Jiang, X.; Tong, D.; Davis, S.J.; Zhao, H.; Geng, G.; Feng, T.; Zheng, B.; Lu, Z.; Streets, D.G.; et al. Transboundary health impacts of transported global air pollution and international trade. Nature 2017, 543, 705–709. [Google Scholar] [CrossRef] [Green Version]
  188. Tessum, C.W.; Apte, J.S.; Goodkind, A.L.; Muller, N.Z.; Mullins, K.A.; Paolella, D.A.; Polasky, S.; Springer, N.P.; Thakrar, S.K.; Marshall, J.D.; et al. Inequity in consumption of goods and services adds to racial–ethnic disparities in air pollution exposure. Proc. Natl. Acad. Sci. USA 2019, 116, 6001–6006. [Google Scholar] [CrossRef] [Green Version]
  189. Kweon, B.-S.; Mohai, P.; Lee, S.; Sametshaw, A.M. Proximity of public schools to major highways and industrial facilities, and students’ school performance and health hazards. Environ. Plan. B Urban Anal. City Sci. 2018, 45, 312–329. [Google Scholar] [CrossRef]
  190. Chang, A. We Can Draw School Zones to Make Classrooms Less Segregated. This Is How Well Your District Does. Available online: https://www.vox.com/2018/1/8/16822374/school-segregation-gerrymander-map (accessed on 29 June 2020).
  191. Pastor, M.P.; Morello-Frosch, R.; Sadd, J.L. The Air Is Always Cleaner on the Other Side: Race, Space, and Ambient Air Toxics Exposures in California. J. Urban Aff. 2005, 27, 127–148. [Google Scholar] [CrossRef]
  192. Rothstein, R. The Color of Law: A Forgotten History of How Our Government Segregated America; Liveright Publishing: New York City, NY, USA, 2017; ISBN 978-1-63149-286-0. [Google Scholar]
  193. Domonoske, C. Interactive Redlining Map Zooms in On America’s History of Discrimination. Available online: https://www.npr.org/sections/thetwo-way/2016/10/19/498536077/interactive-redlining-map-zooms-in-on-americas-history-of-discrimination (accessed on 29 June 2020).
  194. Gross, T. A “Forgotten History” of How The U.S. Government Segregated America: NPR. Available online: https://www.npr.org/2017/05/03/526655831/a-forgotten-history-of-how-the-u-s-government-segregated-america (accessed on 29 June 2020).
  195. Cole, L.W. Remedies for Environmental Racism: A View from the Field. Mich. Law Rev. 1992, 90, 1991–1997. [Google Scholar] [CrossRef]
  196. Clark, L.P.; Millet, D.B.; Marshall, J.D. National Patterns in Environmental Injustice and Inequality: Outdoor NO2 Air Pollution in the United States. PLoS ONE 2014, 9, e94431. [Google Scholar] [CrossRef] [PubMed]
  197. Ward, C. Canaries on the Rim: Living Downwind in the West; Verso: New York City, NY, USA, 1999; ISBN 978-1-85984-750-3. [Google Scholar]
  198. Cooley, A. Socioeconomic outcomes of redlining in Salt Lake City, Utah 2019. Presented at American Association of Geographers, Salt Lake City, UT, USA, 14 October 2019. [Google Scholar]
Figure 1. Estimates of premature deaths caused by pollution and other causes and risk factors worldwide. Data for outdoor air pollution are from Burnett and others [1] and Lelieveld and others [4]. Data for other pollution deaths are from Landrigan and others [2]. Occupational pollution refers to exposure in the workplace. Data for other causes of death or risk factors are the average of values reported by the World Health Organization [7] and Our World in Data [8]. Deaths associated with COVID-19 were current on 9 October 2020. We note that each of these estimates has an uncertainty range, but because they are compiled from different studies with different metrics of variance (e.g., standard deviation and confidence intervals), we show only the central estimate.
Atmosphere 11 01238 g001
Figure 3. Photographs of particulate air pollution trapped in atmospheric temperature inversions in Utah valleys. Once the lower atmosphere stratifies thermally, air pollution from vehicles, buildings, and other sources can rapidly accumulate in the trapped layer. Images courtesy of the Provo Daily Herald [118].
Atmosphere 11 01238 g003
Figure 4. Conceptual diagram of the role of expert assessment in improving science-policy exchange, interactions among scientific research, policy making, and public perception.
Atmosphere 11 01238 g004
Figure 5. Estimates of the human health impact of air pollution in Utah. (A) The total number of healthy years lost by Utahns due to death or serious disability caused by air pollution. Experts were asked to estimate the disability-adjusted life-years (DALY), which integrates the years of healthy life lost to disease or premature death [2] for all air pollution in Utah (n = 10). Note the logarithmic scale on the y axis. (B) The distribution of the loss of life expectancy across the Utah population (the percentage of Utahns losing different numbers of years; n = 9). For both panels, the boxplots show the 1st, 2nd, and 3rd quartiles, with the whiskers indicating the most extreme points within 1.5 times the interquartile range. The horizontal blue lines show the median “lower” and “upper” estimates, representing the 90% confidence interval around the median of the “central” estimates. The yellow diamonds show the mean of the “central” estimates. The points and ranges show the estimates for each expert individually.
Atmosphere 11 01238 g005
Figure 6. Estimates of the direct and indirect economic costs of air pollution in Utah expressed in millions of US dollars per year (n = 9). Symbology follows Figure 4. Note the logarithmic scale on the y axis.
Atmosphere 11 01238 g006
Figure 7. Estimates of the relative contribution of various pollutants (A) and health conditions (B) to the loss of life in Utah from air pollution. Bars show the mean (±standard error) estimates from 11 and 9 experts, respectively.
Atmosphere 11 01238 g007
Figure 8. Recommendations to improve air quality. (A) Number of times each action was recommended and the most effective scale of implementation. (B) Potential decrease in air pollution possible for various actions. Bars show the mean (± standard error; n = 13).
Atmosphere 11 01238 g008
Publisher’s Note: MDPI stays neutral with regard to jurisdictional claims in published maps and institutional affiliations.

