Article

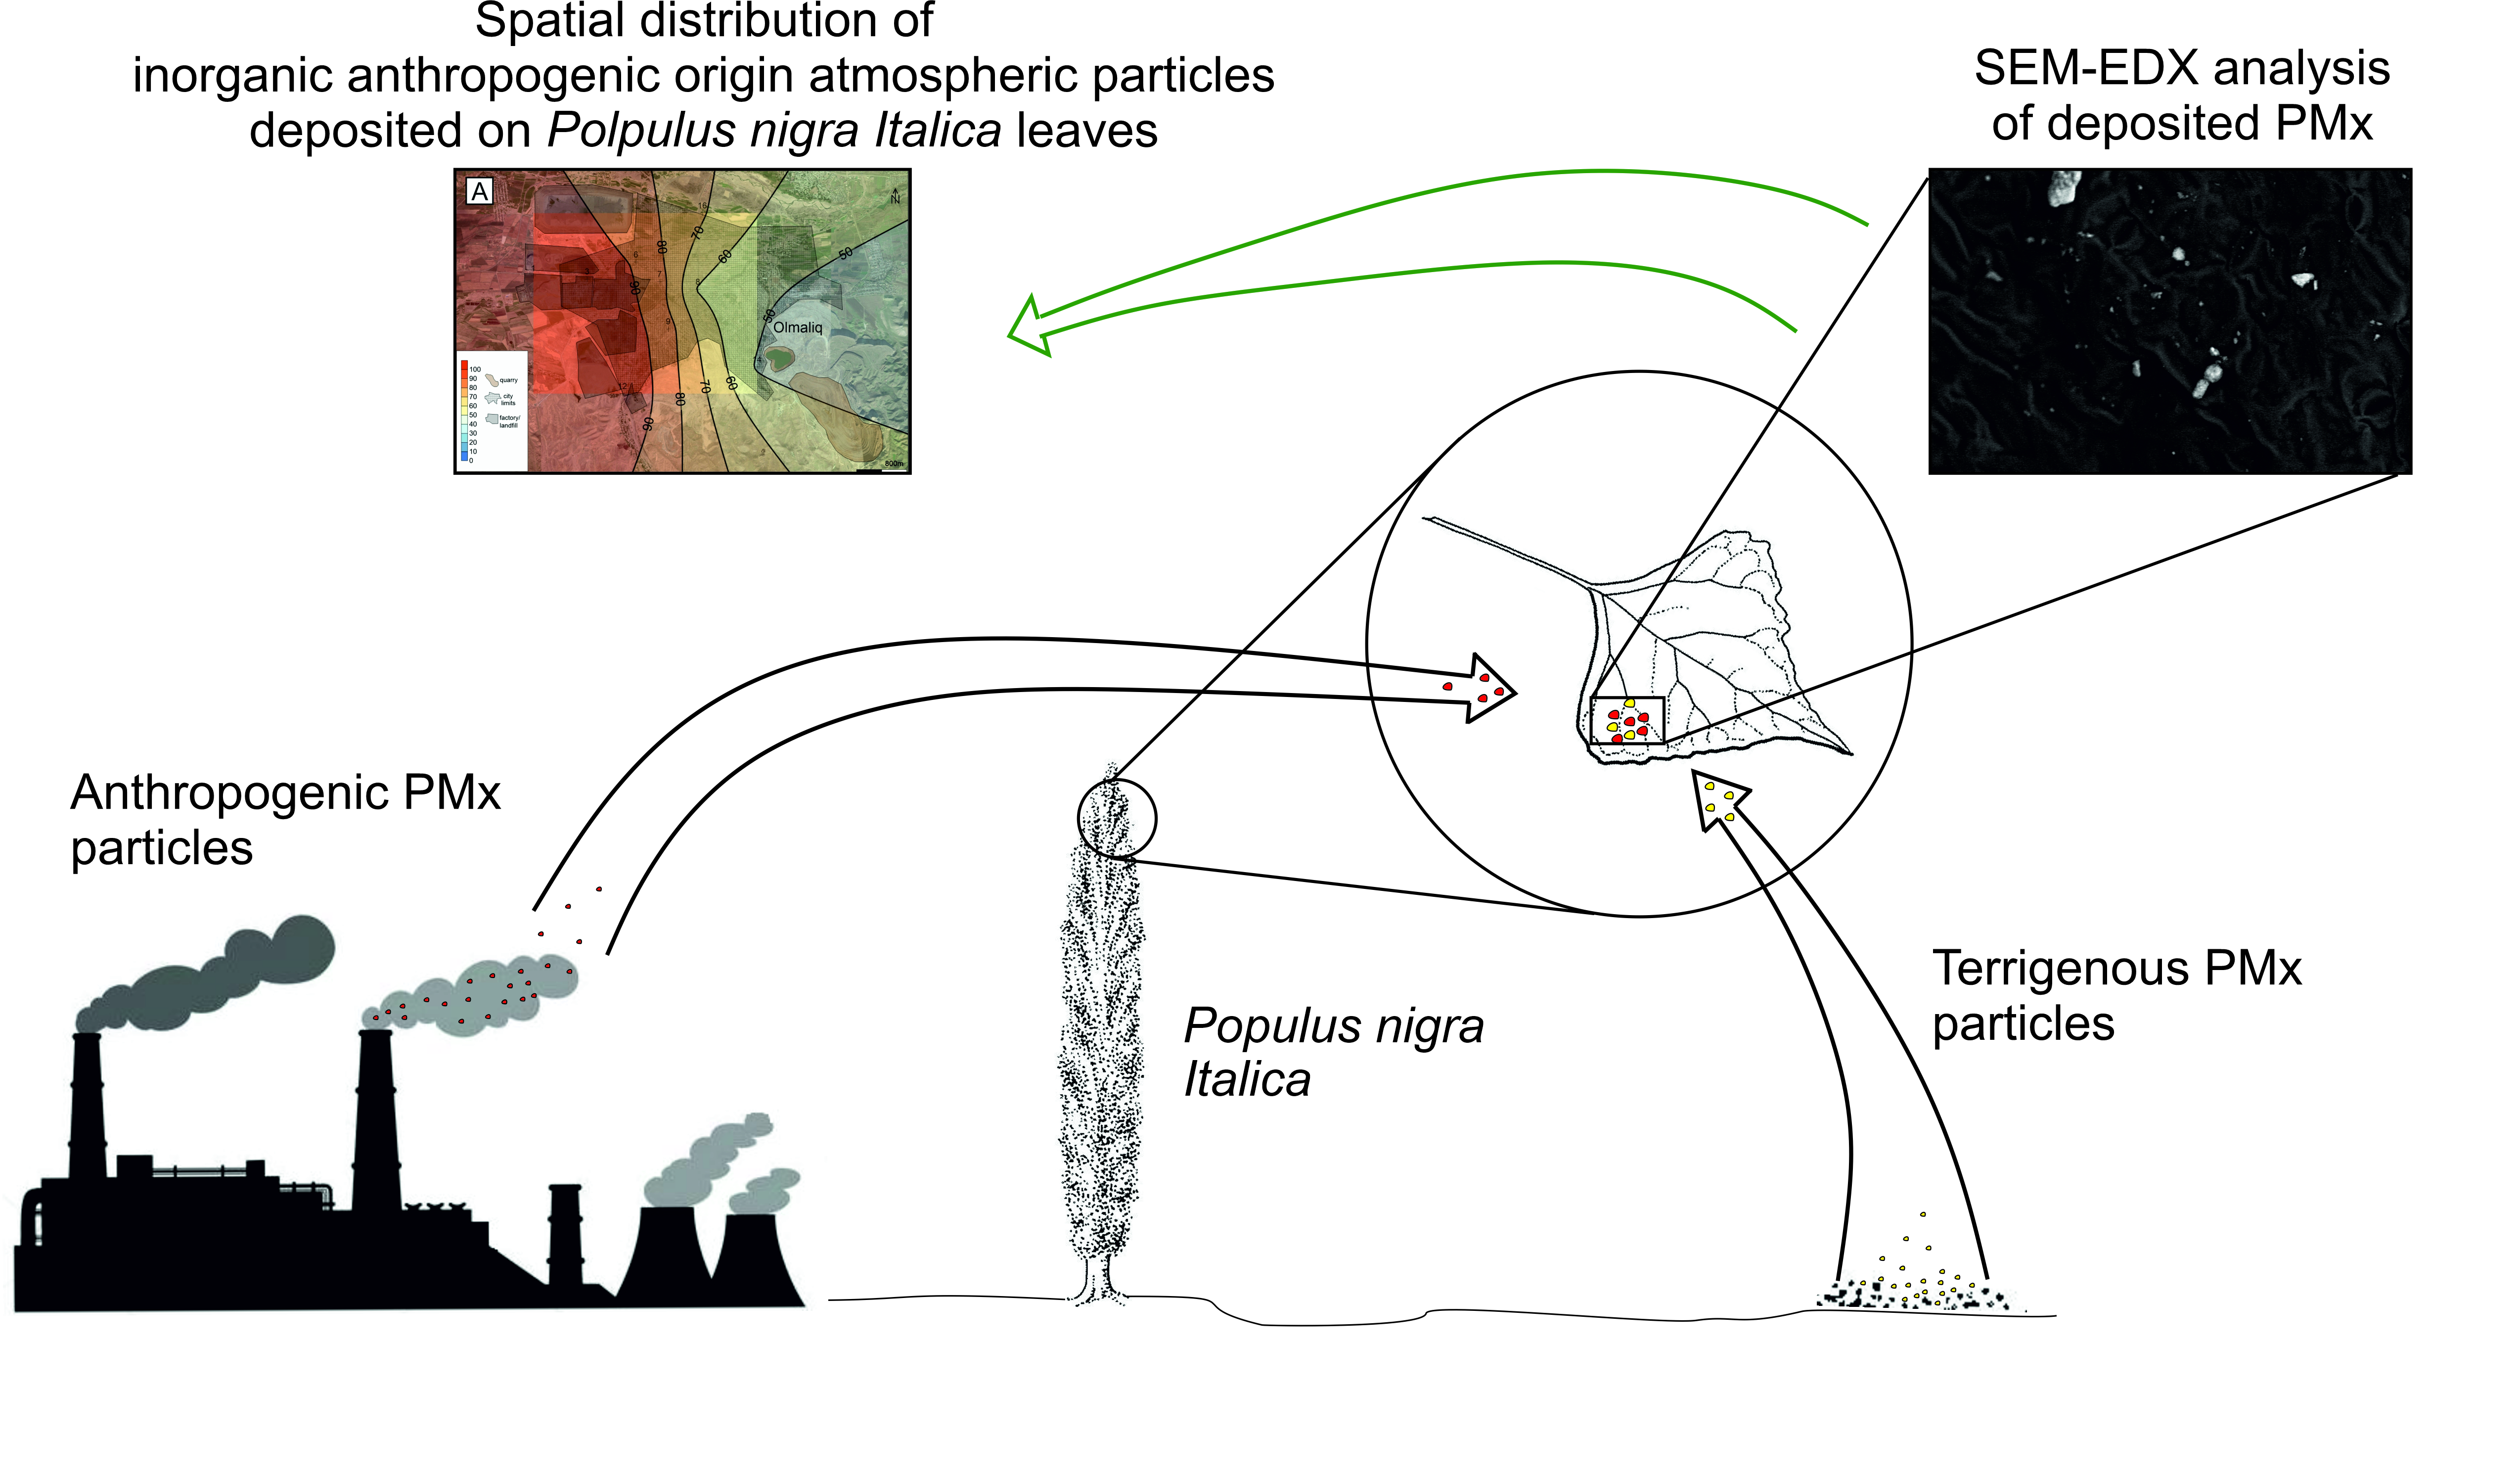
Populus nigra Italica Leaves as a Valuable Tool for Mineralogical and Geochemical Interpretation of Inorganic Atmospheric Aerosols’ Genesis

Faculty of Earth Science and Environmental Management, University of Wrocław, Cybulskiego 32, 50-205 Wrocław, Poland
*
Author to whom correspondence should be addressed.
Atmosphere 2020, 11(10), 1126; https://doi.org/10.3390/atmos11101126
Submission received: 9 September 2020 / Revised: 14 October 2020 / Accepted: 16 October 2020 / Published: 20 October 2020
(This article belongs to the Special Issue Metals in Ambient Particles: Sources and Effects on Human Health)

Abstract

:
The Olmaliq industrial area in Uzbekistan is believed to represent a risk to the environment and to human health due to the dispersal of contaminants into the air and soil. This study was undertaken to delineate the track of airborne contaminants’ migration and to assess the distribution of such particles deposited on Populus nigra L. cv Italica leaves and soils. Particles were identified using scanning electron microscopy–energy-dispersive X-ray spectroscopy (SEM-EDX), while bulk soil composition was quantified by applying inductively coupled plasma mass spectrometry (ICP-MS). The results of this study confirmed the research hypothesis, indicating the industrial center as a source of pollution and human exposure to metallic contaminants. The Olmaliq area in particular is strongly influenced by atmospheric pollutants from local industries. The spread of ultra-fine particles is mainly governed by the industrial output and the direction of prevailing winds.

Graphical Abstract

1. Introduction

The progressive development of societies is inherently linked with the proliferation of industrial sectors [1]. Every industrial sector unavoidably generates various kinds of waste and emissions [2]. Consequently, existing regulatory requirements impose specific criteria on industrial producers to limit pollutants, but some emissions are still transferred to the environment [3]. For this reason, industrial areas are recognized as having high contamination potential [4].
Of particular concern are air emissions, because these are known to be easily transported over great distances [5] and, as the result of deposition, they may reach other environmental components, including soil and water. Atmospheric aerosols are composed of various solid and liquid substances as a mixture of elemental and organic carbon, ammonium, nitrates, sulphates, mineral dust, trace elements, and water [6]. However, specific atmospheric aerosol pollutants depend on the branch of industry from which they are generated [7,8]. Atmospheric aerosols whose natural or anthropogenic origins can be revealed possess the following characteristics: submicron <1 μm particulate matter (PM1), fine fraction <2.5 μm (PM2.5), coarse fraction 2.5–10 μm (PM2.5–10) and fraction over 10 μm dispersed by transport and migration. Classification of atmospheric aerosols according to size (PM1 vs. over PM10) aims and chemical/mineralogical characters to indicate their potential to affect humans health [9].
The inorganic fraction of primary atmospheric aerosols is mainly composed of silicates, aluminosilicates, oxides, and carbonates associated with Earth’s crust and derived from specific anthropogenic sources—mining, metallurgy, electricity and heat generation, chemical industries, and others [10]. Secondary atmospheric aerosols generated in aforementioned processes consist of different salts, such as sulfates, nitrates, and chlorides. Finally, the inorganic fraction content of aerosols depends on the following conditions: (i) recent erosion of the rocks and soil, (ii) the traffic intensity in the area, (iii) wind intensity/direction, and (iv) the presence of industries generating specific chemical/mineralogical phases [10]. Industrial processes generate about 35% of the PM mass emitted globally into the atmosphere by human activities [11]. Mineralogical and geochemical studies focused on determining the sources of atmospheric particles have frequently used both an active method pumping air with aerosols [10,12,13,14,15,16] and a passive method where dust is gravitically collected [17,18] or a bio-passive method where dust is adsorbed on a bioindicator surface [19,20,21,22]. Due to the high cost of instrumental monitoring and the difficulties of carrying out extensive sampling, there has been increasing interest in the use of indirect atmospheric monitoring using biomonitors or bioindicators [23,24]. Furthermore, it has been reported that the mineral fraction identified on a bio-passive sampler is specific to the source of origin [22]. Thus, anthropogenic areas where smelting processes are carried out are expected to exhibit elevated metal concentrations, either adsorbed onto atmospheric particles or incorporated therein.
Recently, trees stand as among the most useful and effective bioindicators and biomonitoring tools for collecting atmospheric pollutants [25,26,27]. Populus spp. are commonly used as valuable bioindicators [22,28,29,30]. Previous research focused mainly on trace elements inbuilt in indicator structures to assess environmental changes rather than mineralogical/geochemical analysis of atmospheric particles deposited on bioindicators to assess the anthropogenic influence [31].
Environmental studies require the use of various analytical tools for the combined assessment of pollution. Scanning electron microscopy (SEM) is frequently used to analyze atmospheric particles as it provides chemical, mineralogical, and morphological information about specific aerosol and, as a consequence, enables differentiation between natural and anthropogenic atmospheric particles [32]. Moreover, this method provides a great array of data for the analysis of contaminants present in the soil [33]. Bulk soil composition, usually assessed by inductively coupled plasma atomic mass spectrometry (ICP-MS), provides only the total concentration of pollutants that were eventually deposited on surface soil, while the application of SEM provides more detailed information concerning the fraction of a specific metal deposited. This information is environmentally relevant because it is known that the susceptibility of each mineral to alteration and dissolution differs depending on its size. Hence, the potential risk for pollutant release also varies [34]. To consider a specific location as a whole system where pollutants can be present requires a combination of geochemical tools. Only then can a reliable assessment of pollution be assured.
The Olmaliq area in Uzbekistan is an industrial region associated with many industrial branches smelting non-ferrous metals [35,36]. According to the location of those smelting industries and the dominant wind direction—WSW (West-Southwest) in this area—[37], it is hypothesized that air pollutants are transported in an easterly direction. In this regard, the aim of this study was to track the range of migration of airborne contaminants in the Olmaliq area from the industrial smelting centers as well as from large local quarries, and finally to quantify the percent of anthropogenic pollutants. A combined geochemical approach was applied to consider the study area as a complex location. Soil contamination was assessed by ICP-MS and scanning electron microscopy–energy-dispersive X-ray spectroscopy (SEM-EDX), while atmospheric particles deposited on Populus nigra L. cv italica leaves were determined by SEM-EDX. The main novelty of this study is that it takes an advantage of the leaves as a samplers for tracking dispersal of atmospheric contaminants. A combined geochemical approach enabled us to determine the precise range (with a km precision) of distribution of pollutants of anthropogenic genesis. For this reason, this study is relevant not only for studied area, but its applicability can be a useful tool for contamination assessment at other areas where industrial activity takes place.

2. Material and Methods
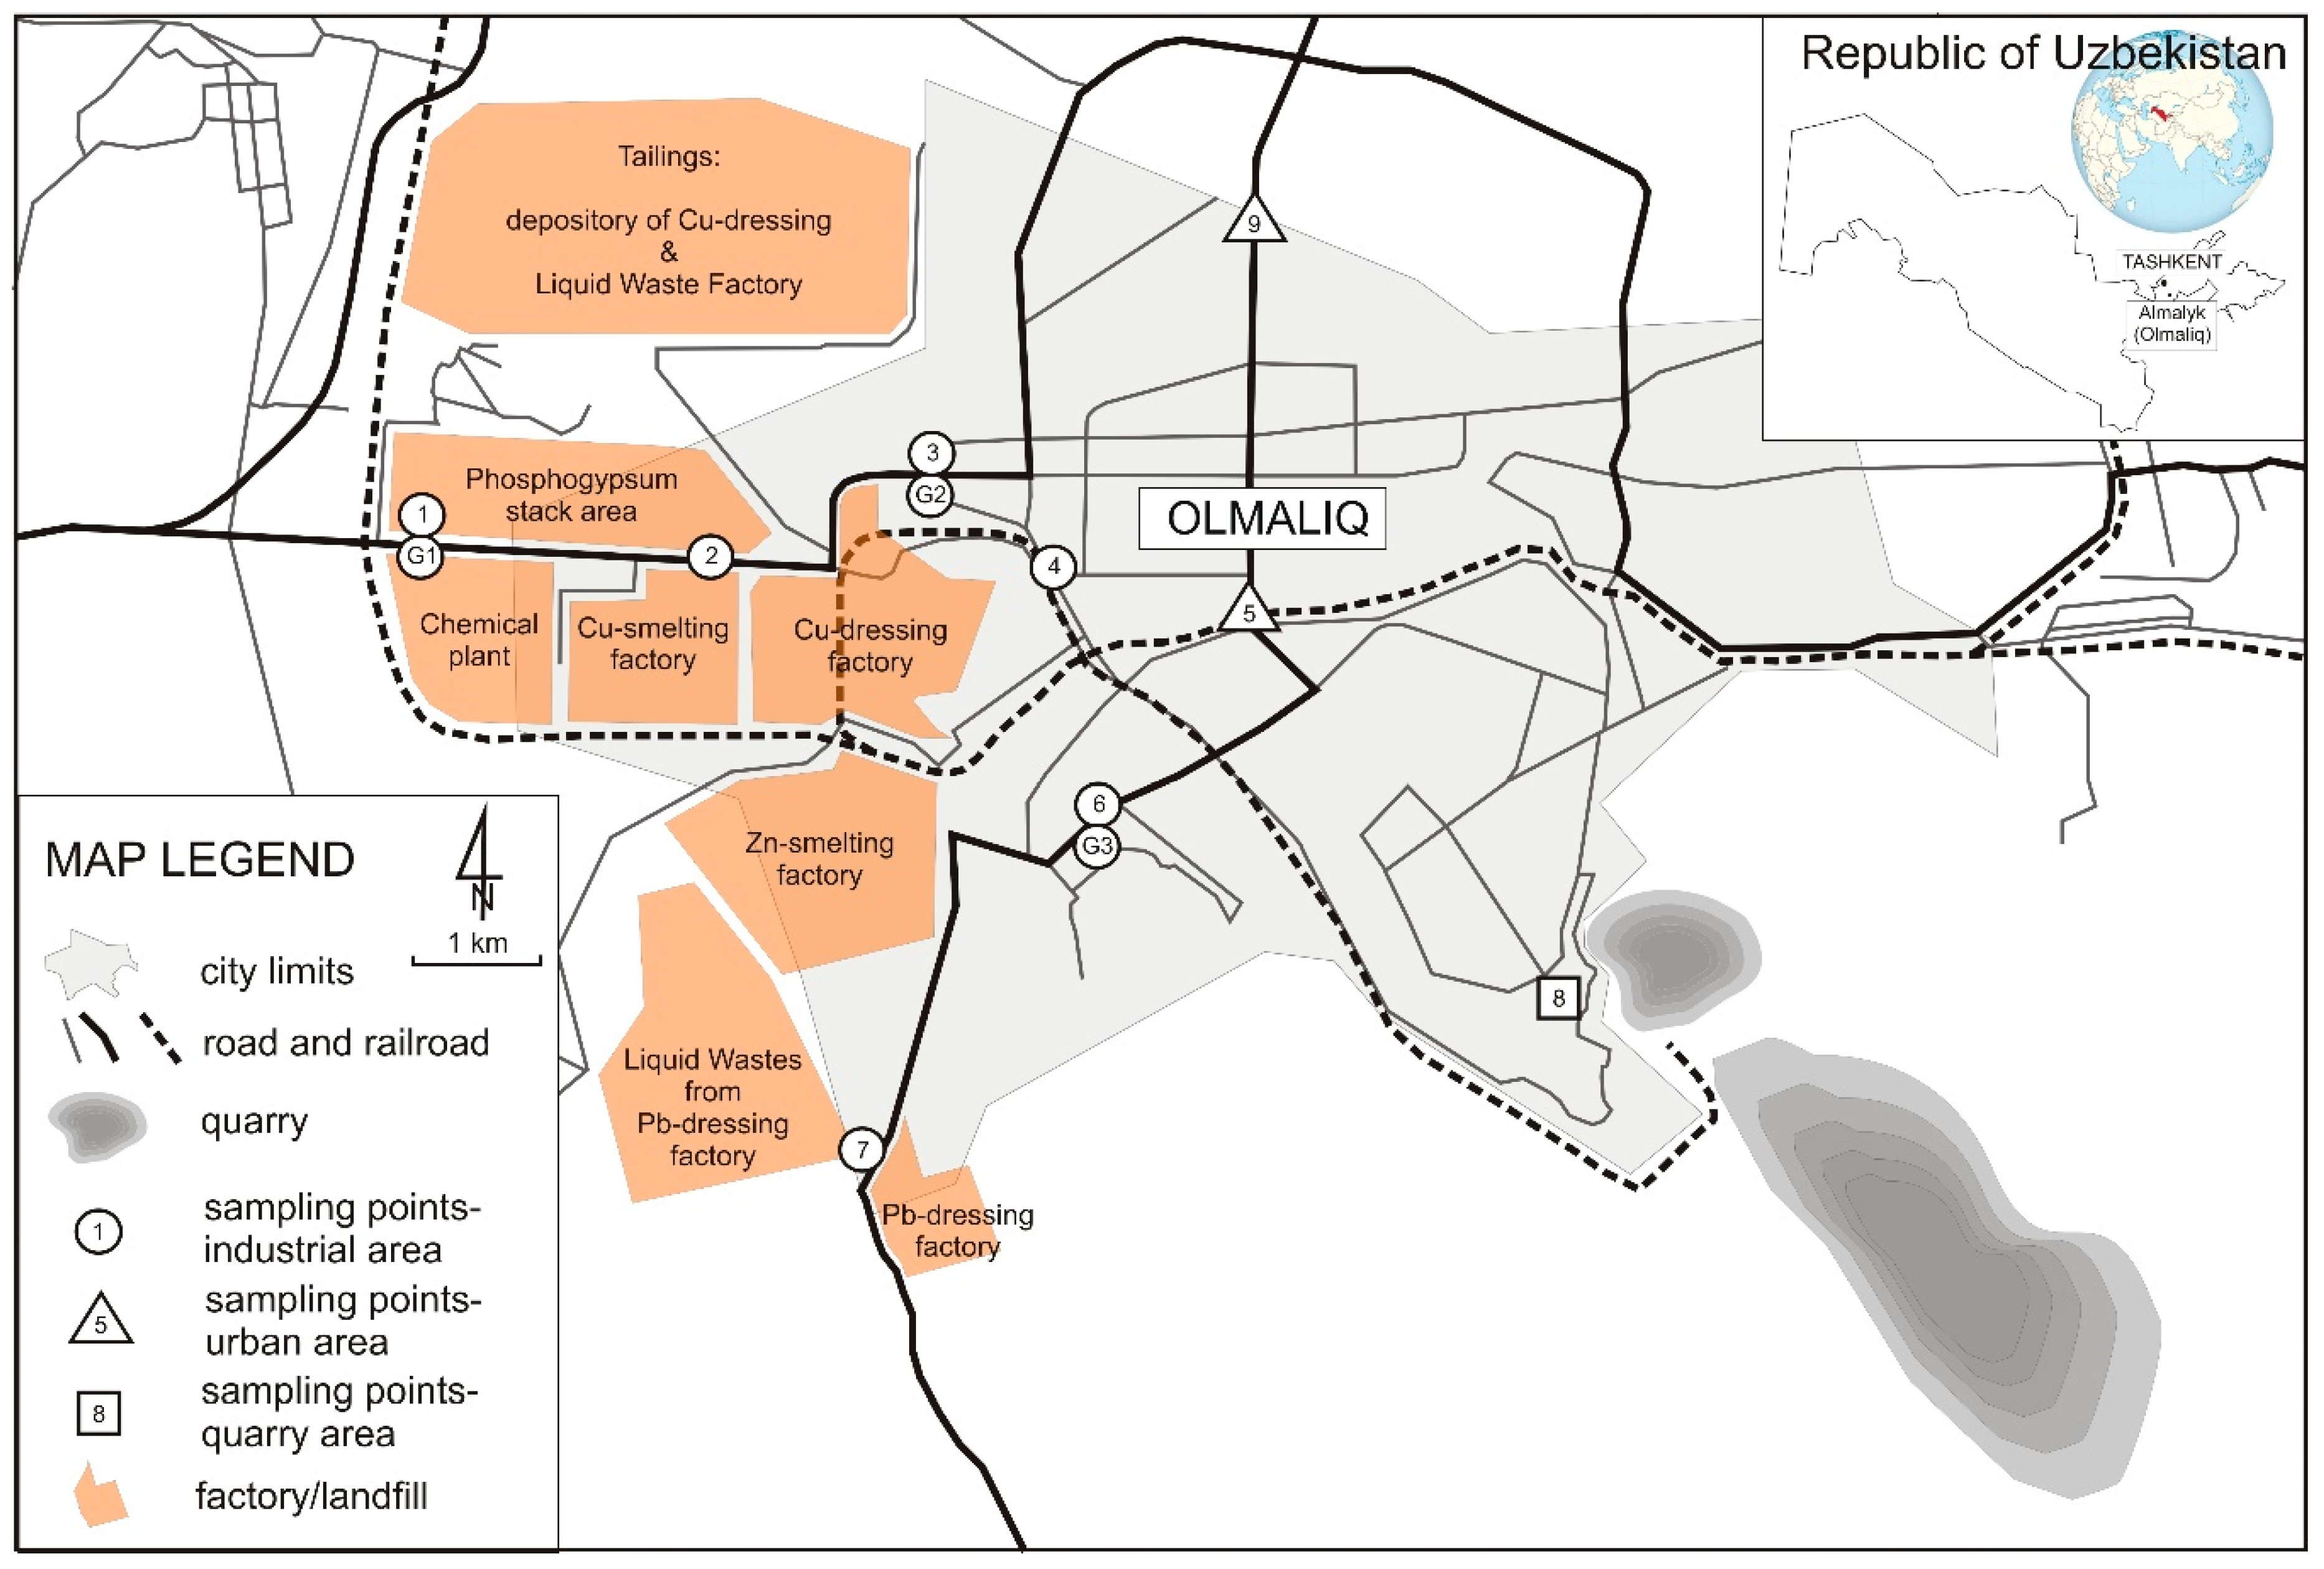
2.1. Study Site

The city of Olmaliq (c. 120,000 inhabitants) is located at 585 m altitude in a mountainous area 65 km south–southeast of Tashkent, the capital of Uzbekistan. The climate is continental in character with minimum temperatures ranging from −25 °C to −30 °C in January to maximum temperatures of 42 °C to 47 °C in July [37]. Average annual rainfall is between 100 and 200 mm [36]. The study area is surrounded by a chain of mountains (Chatkal and Quarama), which limits air circulation/ventilation influencing the spread of atmospheric pollutants. The JSC Almalyk Mining and Metallurgical Complex (AMMC) (Uzbekistan) is located at the foot of the Akhangaran River valley near the city of Olmaliq [37] (Figure 1). The JSC Almalyk MMC Mining and Metallurgical Complex is one of the largest industrial facilities in Uzbekistan. Its annual metal production in 2015 was around 100,000 metric tons of copper, 70,000 tons of zinc, and 40,000 tons of lead [38]. The JSC AMMC generates about 13% of all pollutants emitted into the atmosphere from stationary sources in Uzbekistan [36]. The prevailing wind at the study site is in a western and south-western direction [37], therefore, we focused on sampling the eastern side of AMMC as potentially more affected by industry pollutants. The soils in the Olmaliq vicinity are classified as lithosols [37].

2.2. Sample Collection

The collection of P. nigra leaves took place on 17 August 2018, from nine sampling points (Figure 1). For each study location, one sampling tree was selected and ten fully developed leaves were randomly sampled from P. nigra at 1.5 m above the ground level. Six samples (assigned to group 1: industry) of leaves were associated with the industrial area (sampling points: 1, 2, 3, 4, 6, and 7; Figure 1), two from an urban area (5 and 9, Figure 1, assigned to group 2: urban), and one (8; Figure 1, assigned as group 3: quarry) from an area influenced by a quarry. The collected leaves were placed in paper bags and stored at ambient temperature. Soil samples (c.a. 10 g) were collected on 24 August 2018 at the topsoil level (0–10 cm depth) from three sampling points (Figure 1). All three samples (G1, G2, G3) were attributed to an industrial area (Figure 1). Soil samples were kept in LDPE (low-density polyethene) zip bags, left open until dry at room temperature. Ultimately, the soil samples and leaves were carefully transported to the laboratory in hermetic LDPE zip bags to prevent further contamination (University of Wroclaw, Poland). Finally, the samples were kept in closed zip bags at ambient temperature for nine month prior to the analysis.

2.3. Sample Preparation

Samples of leaves were again dried in the laboratory for seven days at room temperature (covered to prevent contamination). Subsequently, they were carefully freeze-dried using Labconco model FreeZone 4.5 to remove residual water before SEM-EDX (scanning electron microscopy–energy-dispersive X-ray spectroscopy) analysis. Then, three (out of every ten) leaves were randomly chosen, cut between the leaf edge and midrib, to obtain two discs of area c.a. 0.5 mm2 each, one for the lower surface and the second one for the upper surface. Obtained fragments were mounted on a SEM aluminum stub with a double-sided sticky carbon tape. Soil samples were homogenized and sieved through a 2 mm sieve, and then each finer fraction was divided into two equal parts. The first part was sent for metal concentration analysis using ICP-MS (inductively coupled plasma-mass spectrometry). The second part of the sieved soil samples was prepared for SEM-EDX examination. It was carefully subdivided by quartering [39,40], and representative portions of each air-dried sample (G1, G2, G3) were placed in a separate plastic mold (open cylinder) and soaked with a low viscous epoxy resin (mixed with acetone) under low vacuum conditions to completely remove air bubbles. When polymerization was complete (after 24 h), the cylindrical mold and the embedded sample were cut with a diamond saw, and the sample was polished with progressively finer grades of abrasive (alumina at the first stage and diamond in later stages).

2.4. Analytical Procedures

2.4.1. Mineralogical Characterization of Leaves and Soils

The distribution and morphologic characterization of the particles on the leaves and the chemical composition of the soil and the particles on leaves were evaluated using scanning electronic microscopy equipped with energy dispersive X-ray spectrometer (SEM-EDX). Samples were studied with a Jeol JSM IT-100 scanning microscope (JEOL, Akishima City, Tokyo, Japan) equipped with an Oxford EDX system in back-scattered electrons (BSE) mode. Leaves were analyzed under low vacuum (~40 Pa) and at an acceleration voltage of 14 kV, without any conductive coating, following the procedure depicted by [41]. For SEM-EDX analysis, spots on the 0.5 cm2 sample were randomly chosen, and microphotographs with magnifications (500×, 1000×, 2000×) were taken for each sampling site. After an overall examination of the leaves, a spot of 10,000 μm2 per site was analyzed.
For soil samples, the instrument was operated at high vacuum and 16 kV acceleration voltage. The EDX microanalysis was performed with 60 s of capture time, 100 to 200 counts per second and 20% of dead time, recording the EDX analysis at the central part of the particles. The minimum detection limit of EDX analysis is 0.2 wt%. The Feret max (the longest Feret diameter, [42] accumulated on leaves was assessed using BSE images (at least 15 for each sample) and measured utilizing JMicroVision software [43]. Due to image resolution limitations, particles larger than 0.1 µm were counted. The obtained data were used to divide them into three groups depending on substitutive diameter: fine: <2.5 μm; coarse: 2.5–10 μm; over >10 μm. The groups were classified as PM2.5, PM2.5–10, and above PM10 in diameter. The chemical composition of each measured particle was then assigned, if possible, to the most similar mineralogical phase of the 15 mineralogically specific group. To distinguish naturally occurring mineral particles, we conducted an in-depth analysis of EDX spectra. Each one was carefully compared with reference mineral spectra presented by [44]. In doubtful cases, a result of EDX quantitative chemical analysis was compared to the typical chemical composition of rock-forming minerals [45]. All chemical analyzes of particles significantly deviating from the chemical composition of minerals were considered particles of anthropogenic origin. Finally, the mineralogical composition of measured atmospheric particles in relation to particle sizes were assessed for all studied samples. Likewise, the mineralogical composition of the measured soil grains were taken without dividing the fractions.

2.4.2. Chemical Composition of Soil

The chemical composition of the soil was determined by the certified laboratory Bureau Veritas Group Company (formerly ACME Labs, Vancouver, BC, Canada) using inductively coupled plasma mass spectrometry (ICP-MS) for major, minor, and trace elements. The detection limits were as follows: 0.1 ppm (Pb, Cu, Mo, Ag, Ni, Co, Sb), 0.5 ppm (As, Au) and 1 ppm (Zn, Ba, Cr). The analysis of blank as well as two standards was performed in order to ensure data accuracy and quality. Sample digestion was performed using LiBO2/Li2B4O7 fusion and further dissolution with nitric acid. The analytical reproducibility (2σ), as estimated from a replicate analysis of a sample (G1) and analyses of standard DS11, ranged from 0.1% (Cu) to 1% (Se) confidence limits.

2.5. Statistical Analysis

Differences among the sampling sites in contribution of anthropogenic atmospheric particles adsorbed on leaves were evaluated by one-way ANOVA (Analysis of variance). The normality of the analyzed features was determined using Shapiro–Wilk’s W test, and the homogeneity of variances was checked using Levene and Brown-Forsythe tests [46,47]. A post hoc HSD (honestly significant difference) Tukey test [48] was used to compare the contribution of anthropogenic atmospheric particles adsorbed on leaves among the three groups of industrial, urban, and quarry sites [49]. Spearman’s correlation coefficients were calculated [49] to examine the ρ of the percentage of contribution of mineralogical phases between analyzed soils and related atmospheric particle sites. Calculations were done with Statistica 13.1 software [50].

3. Results

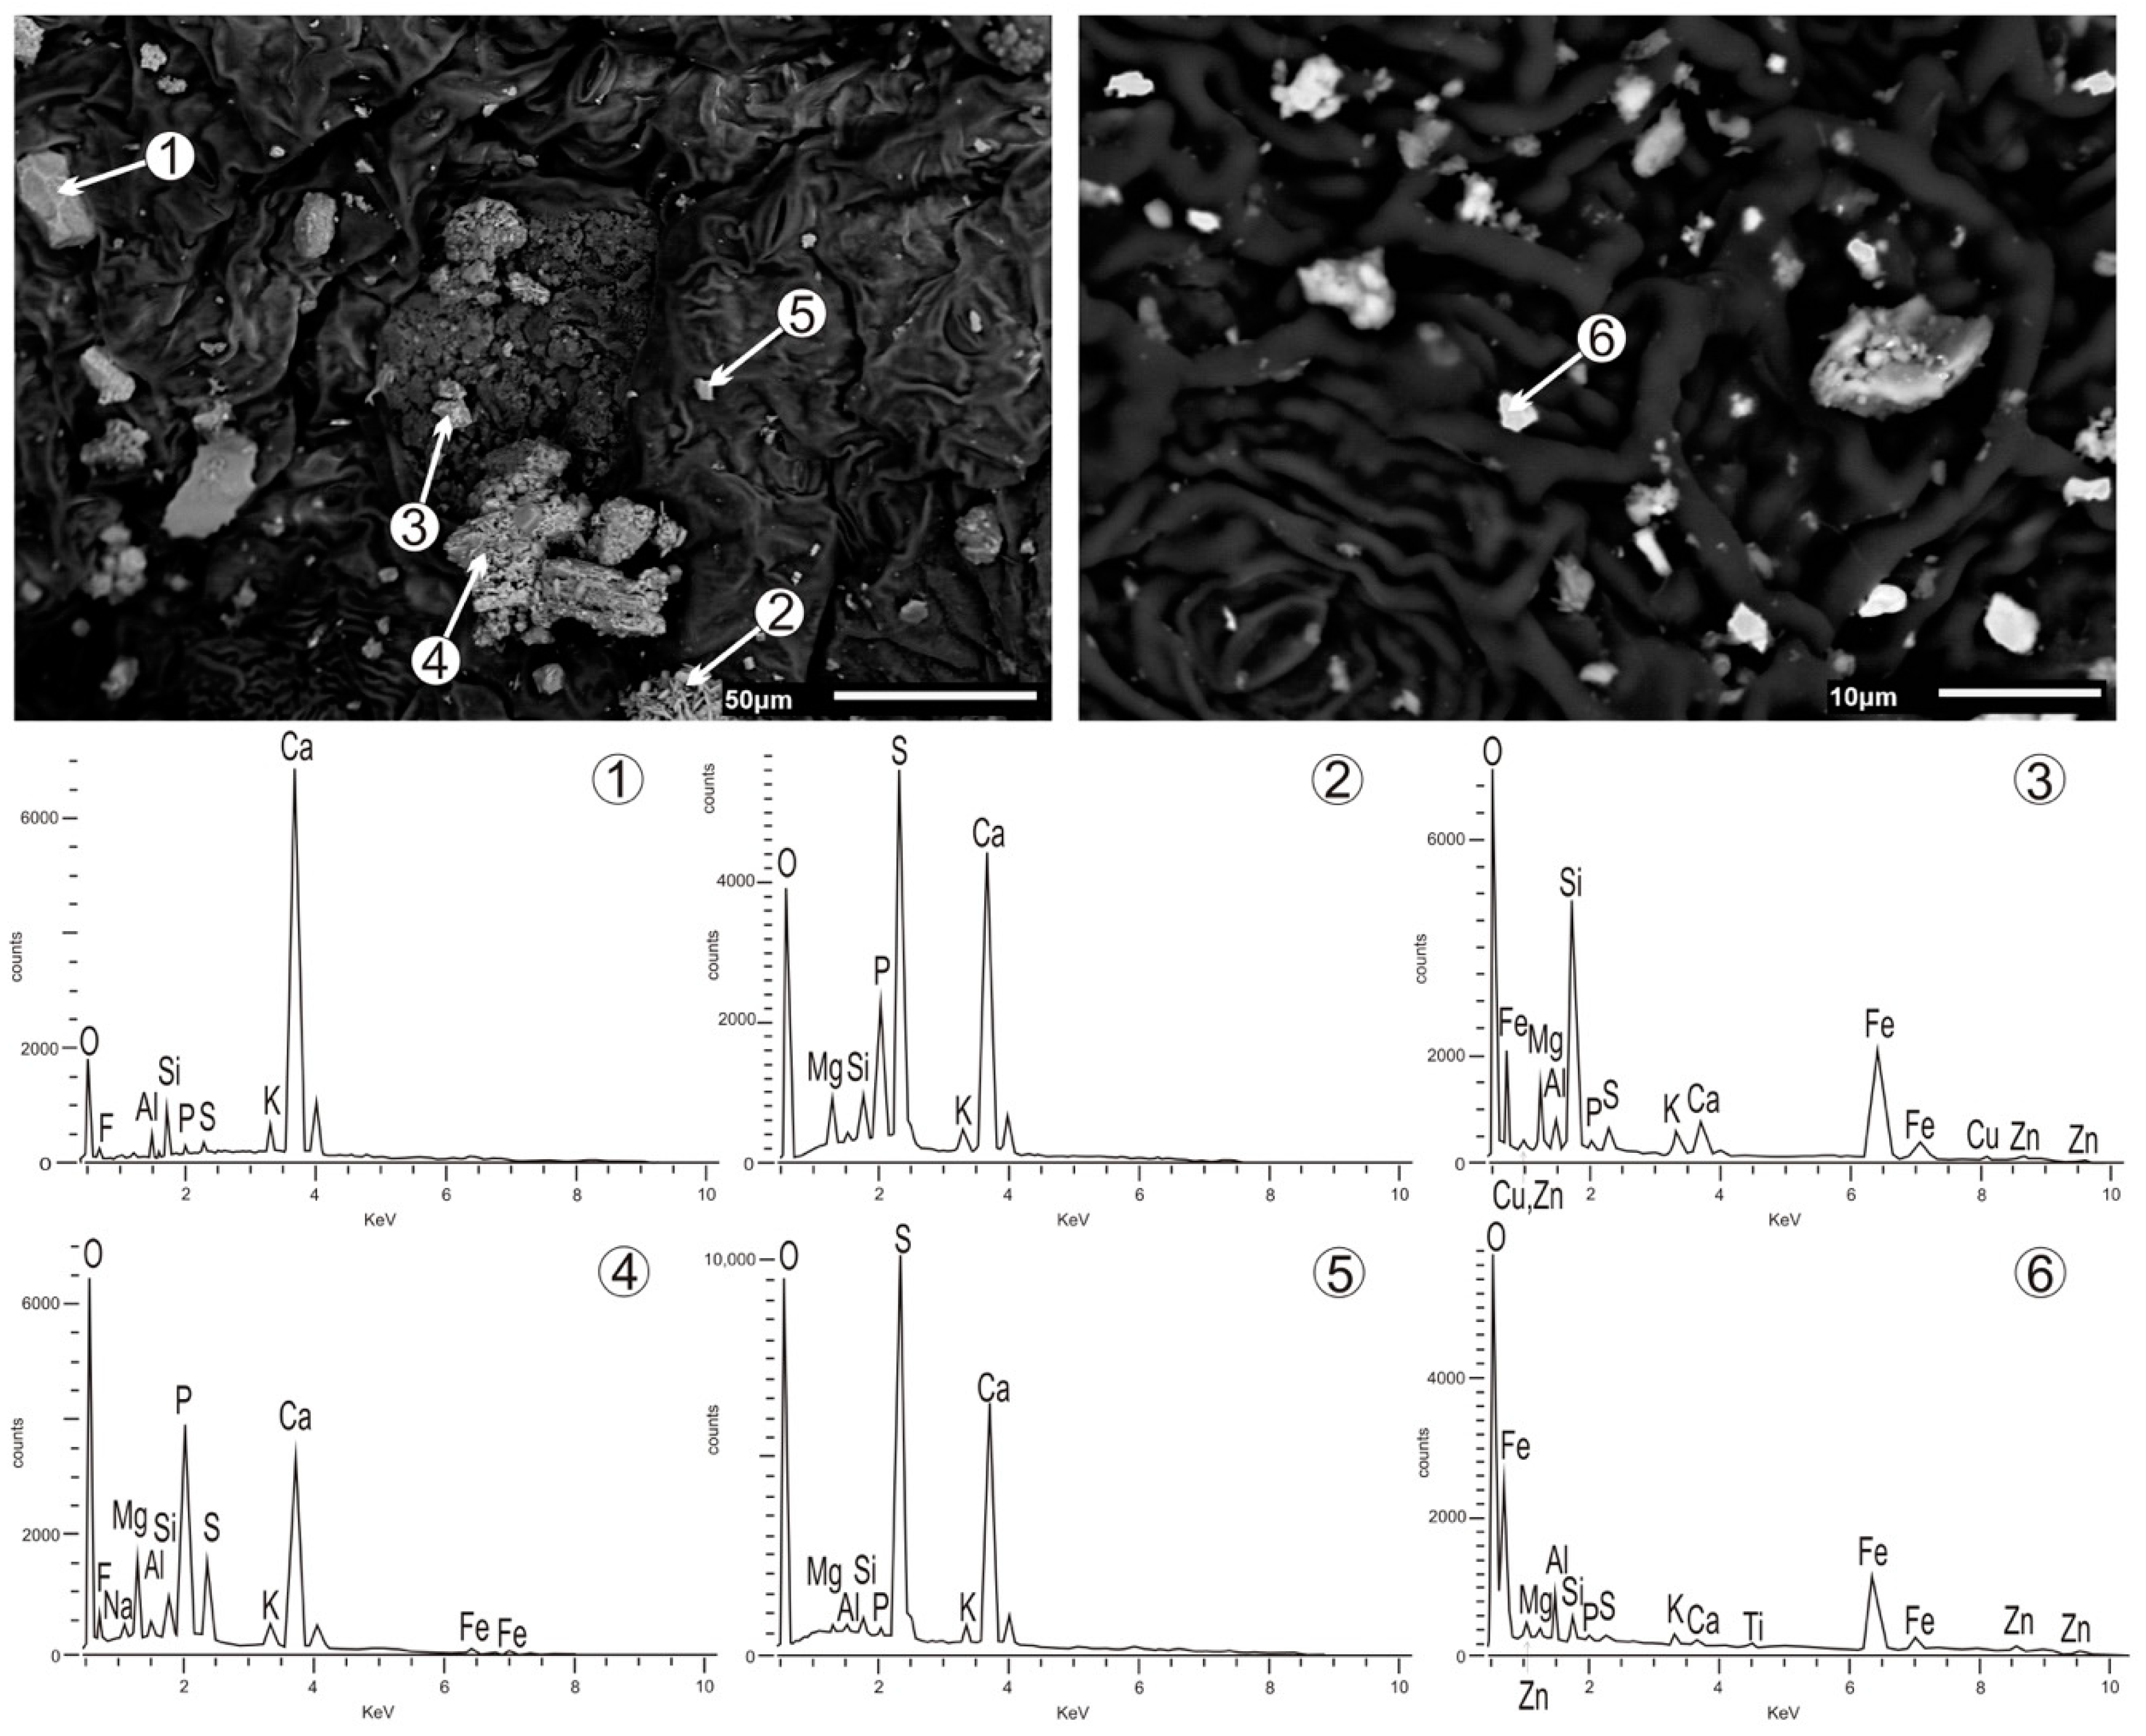
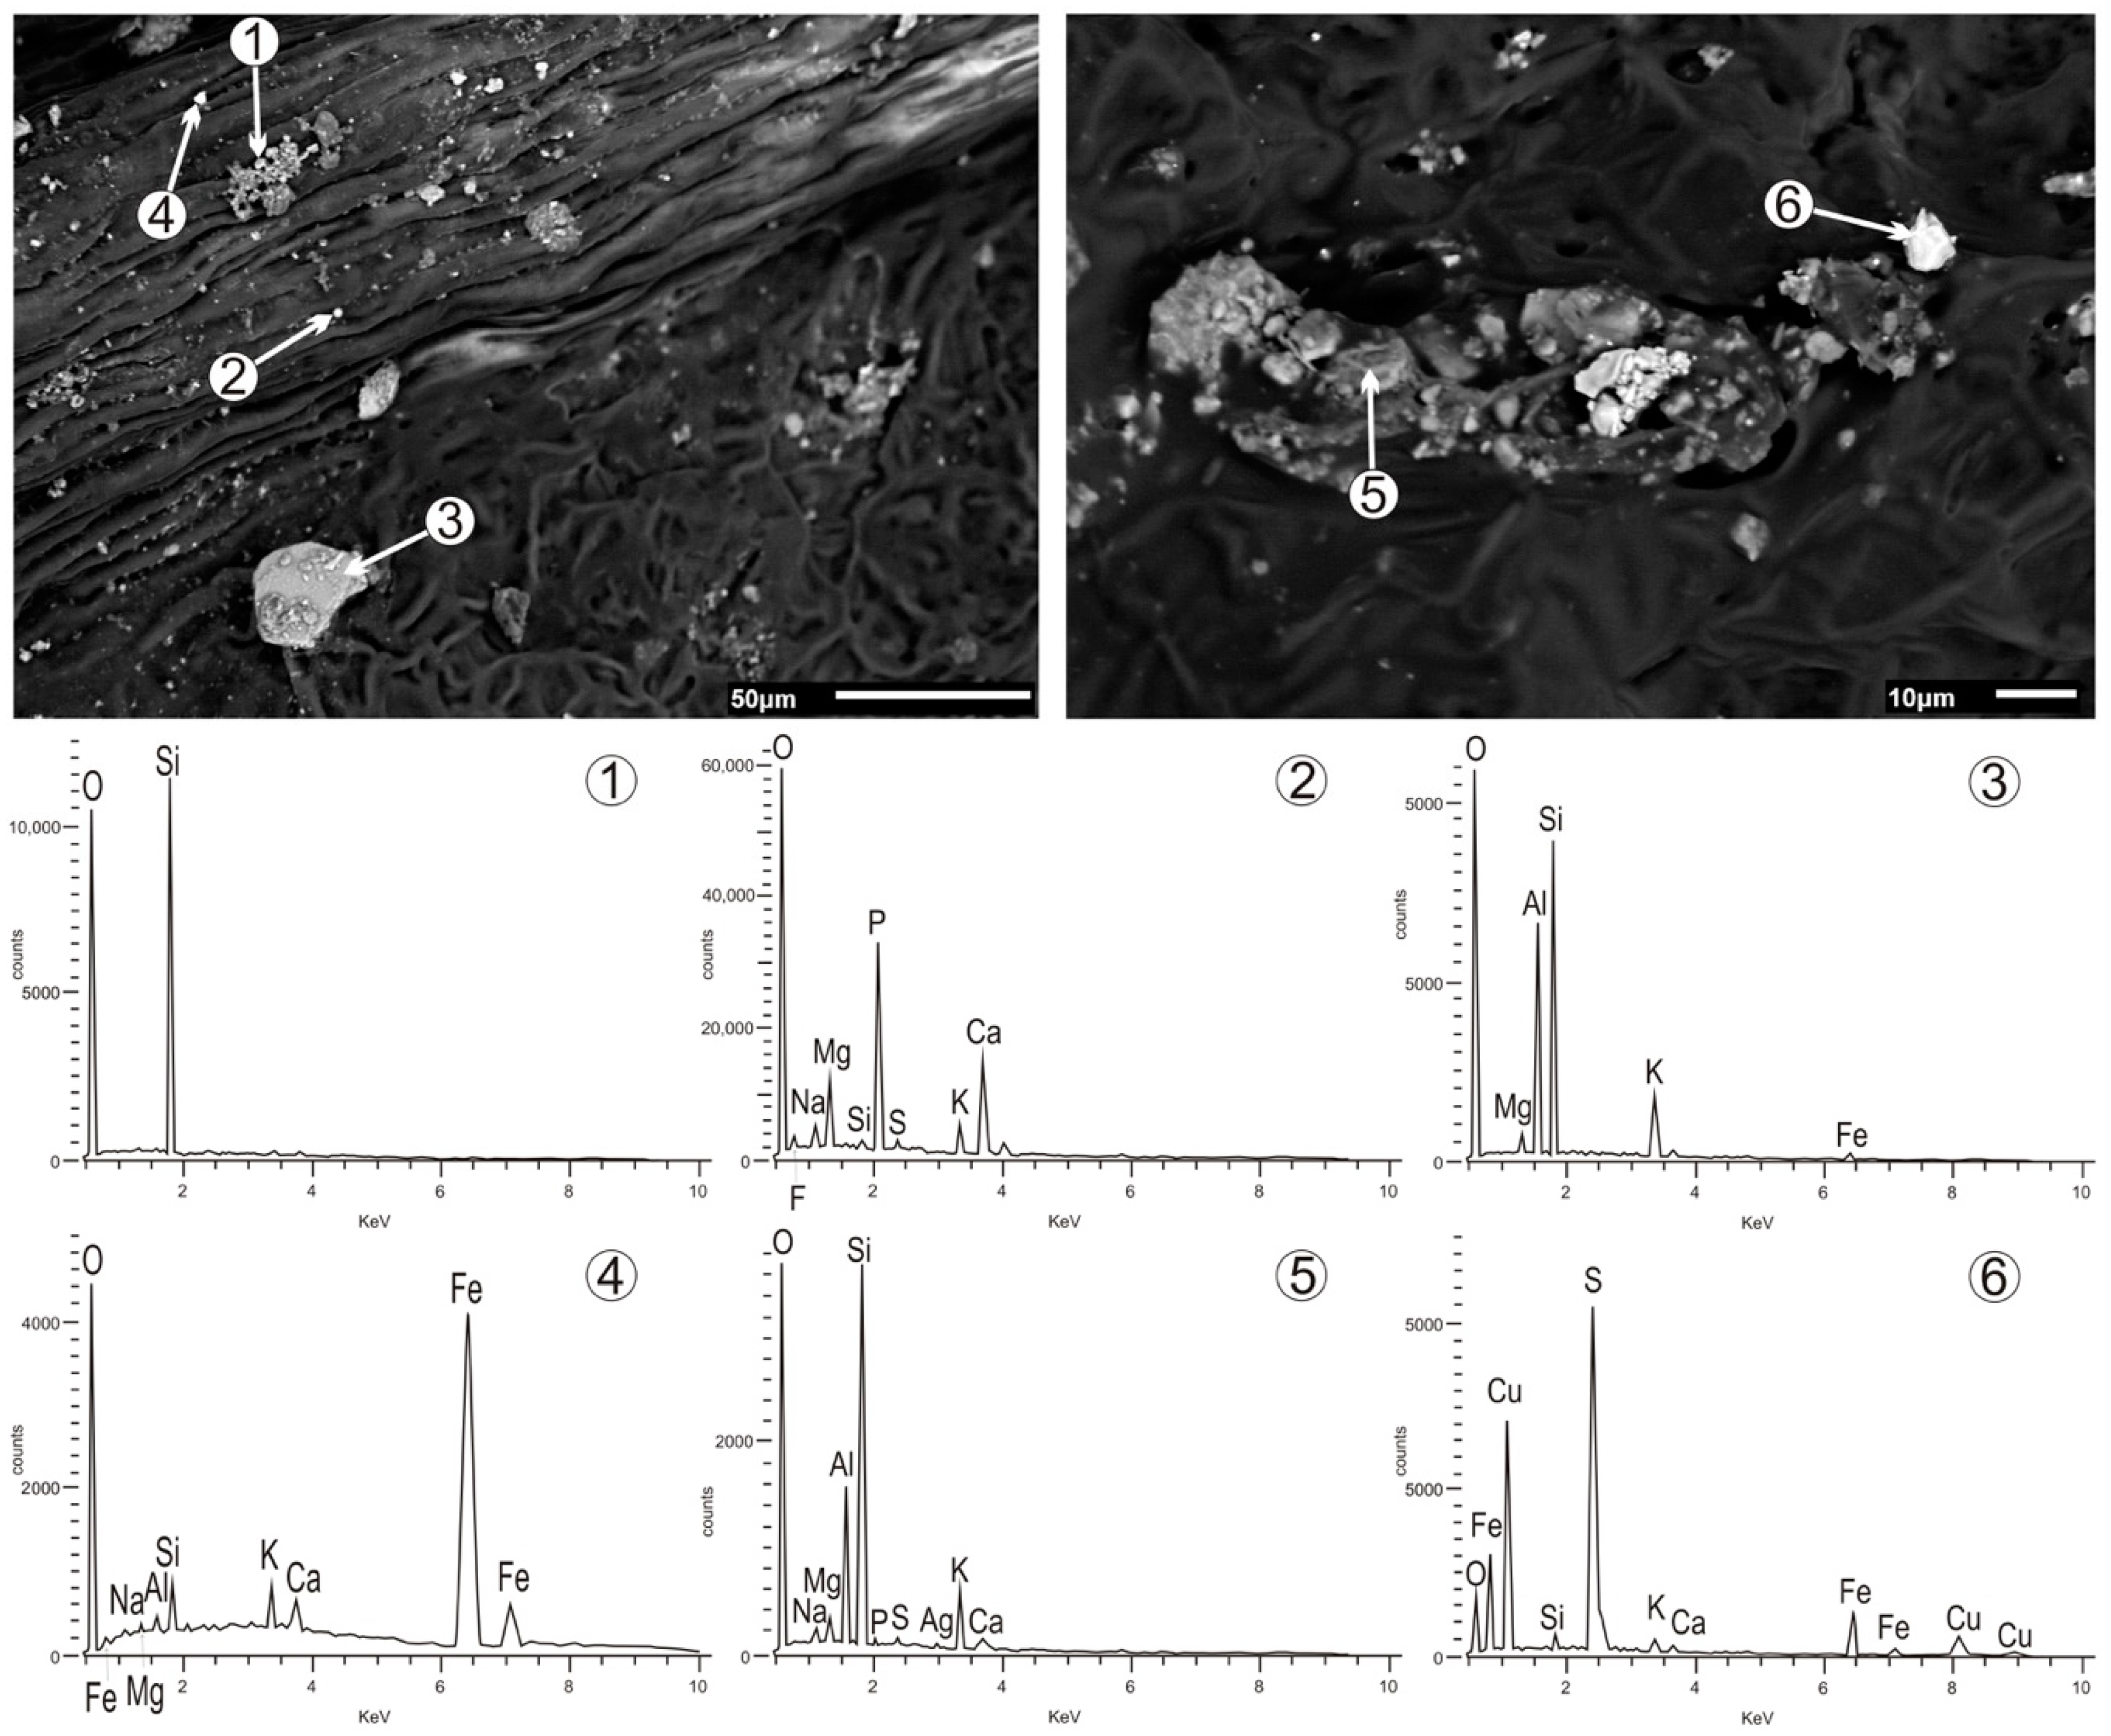
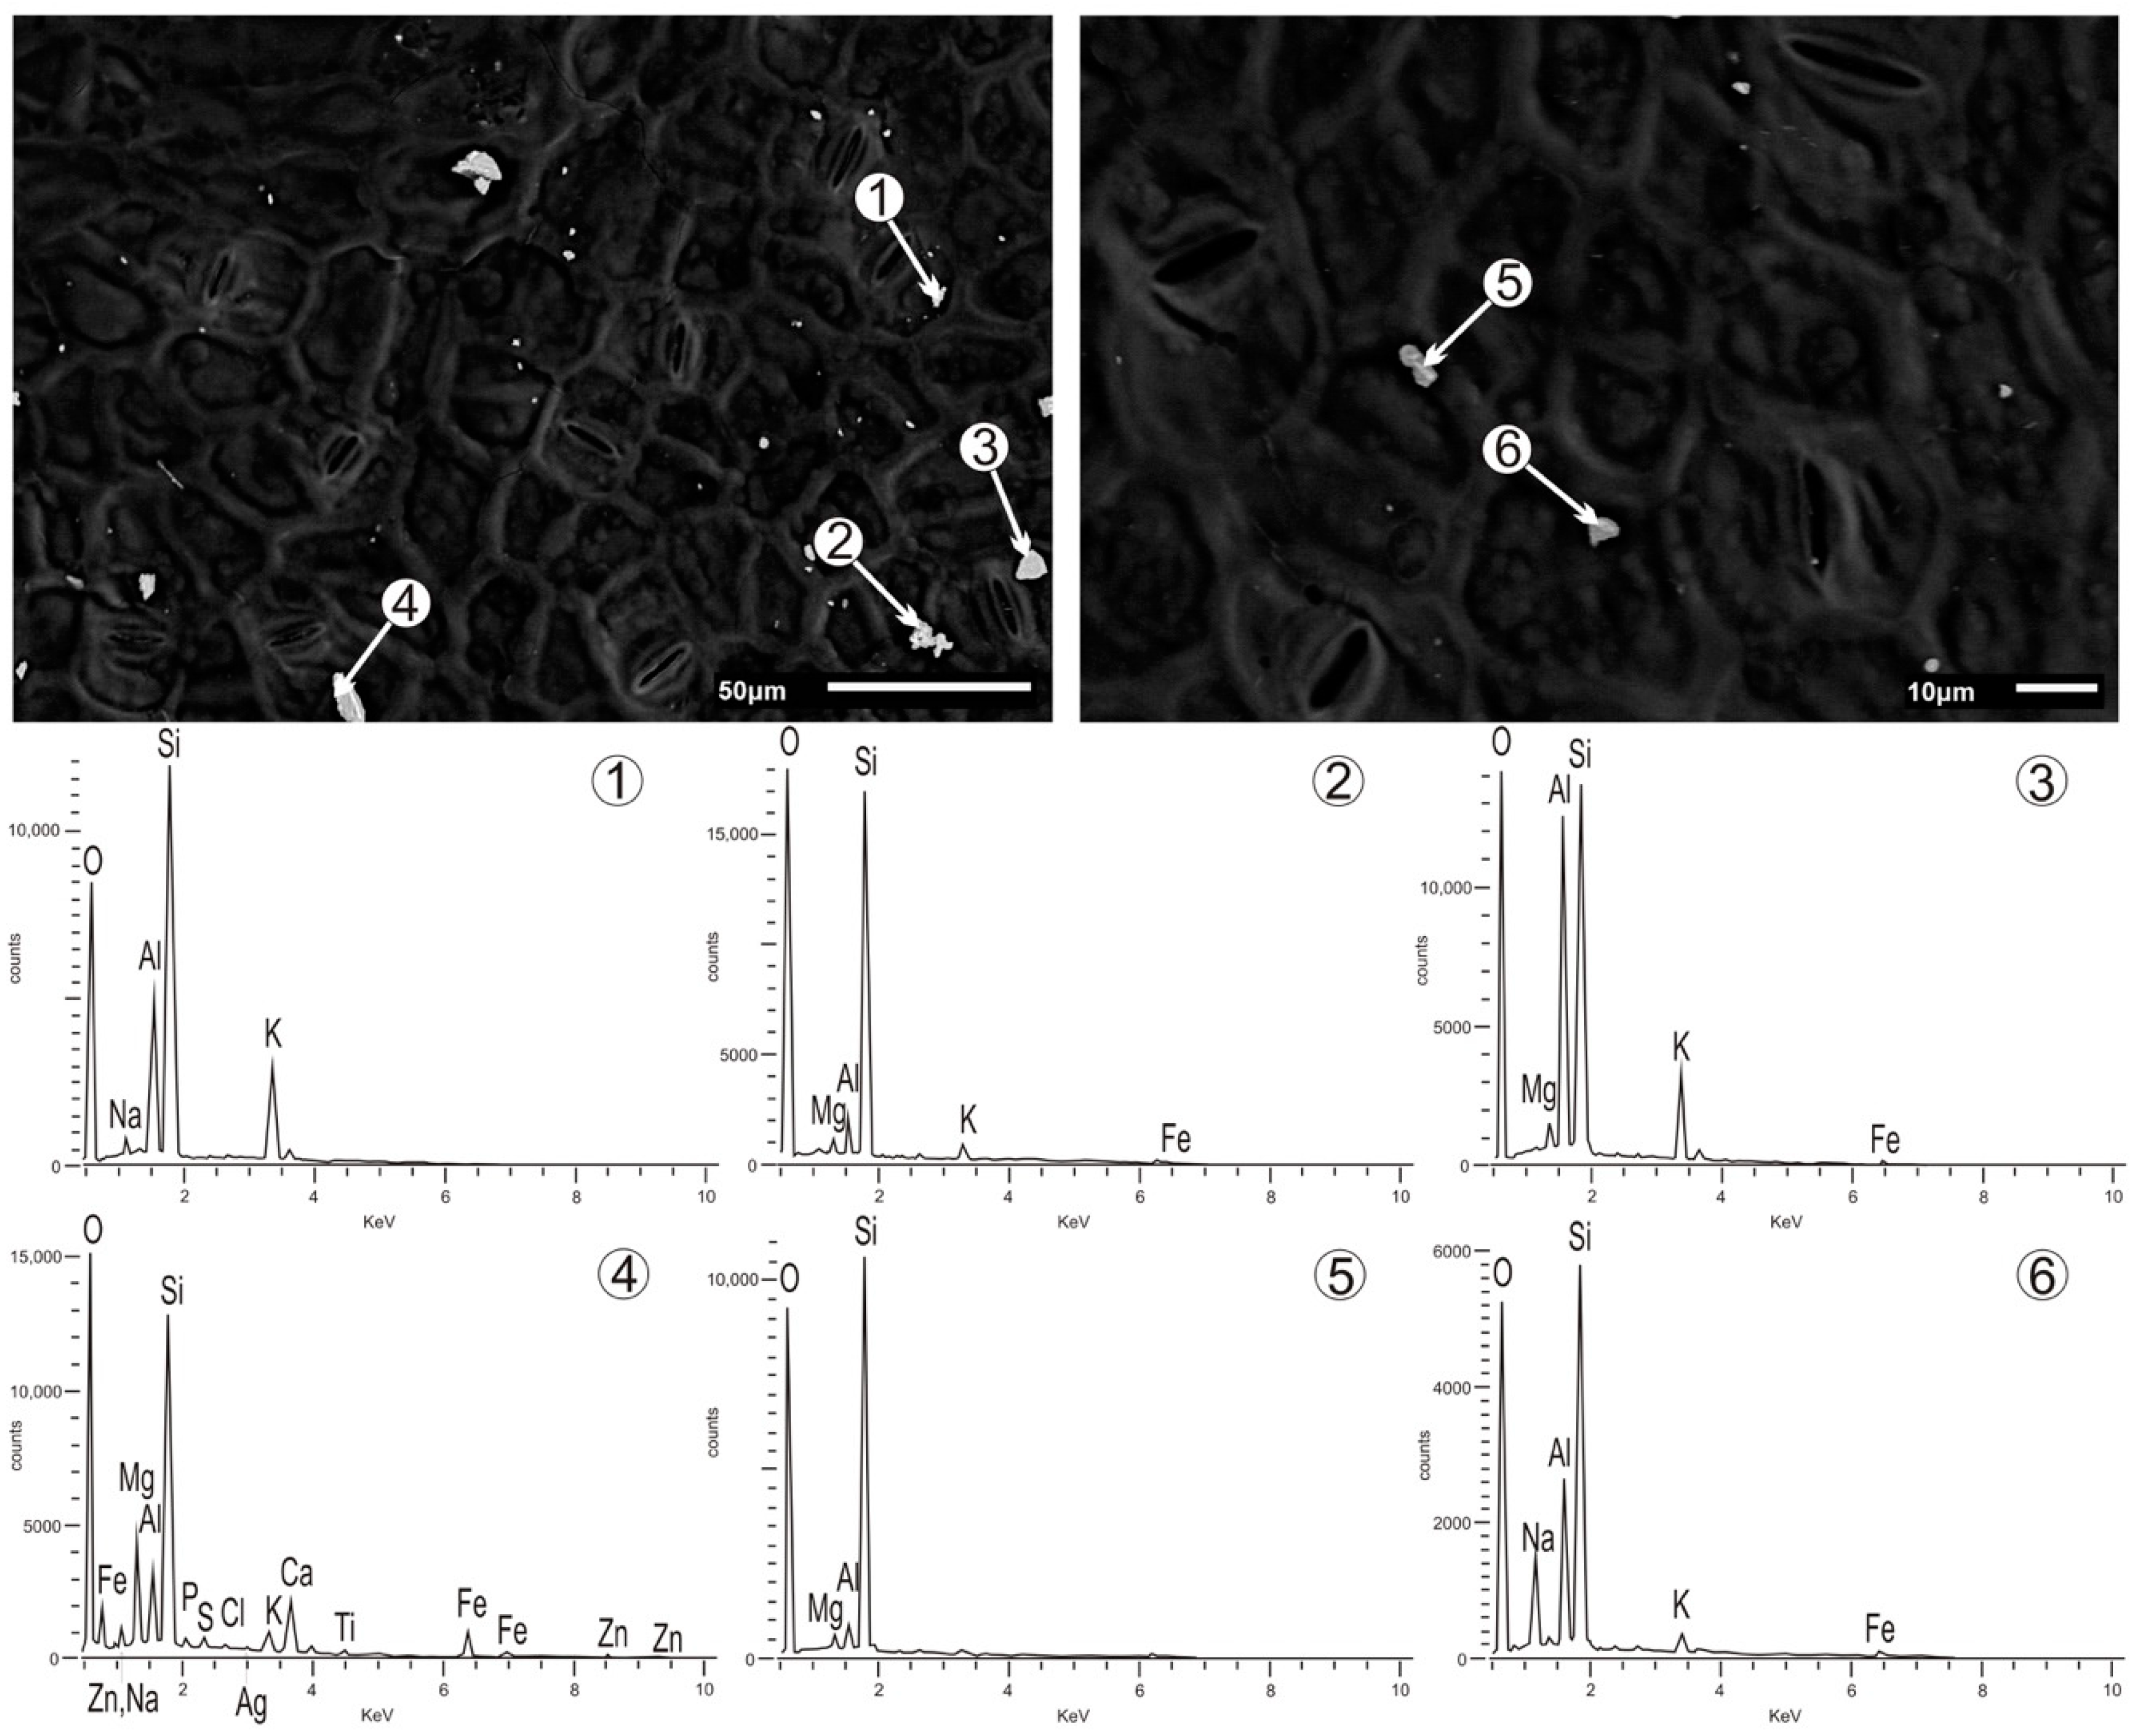
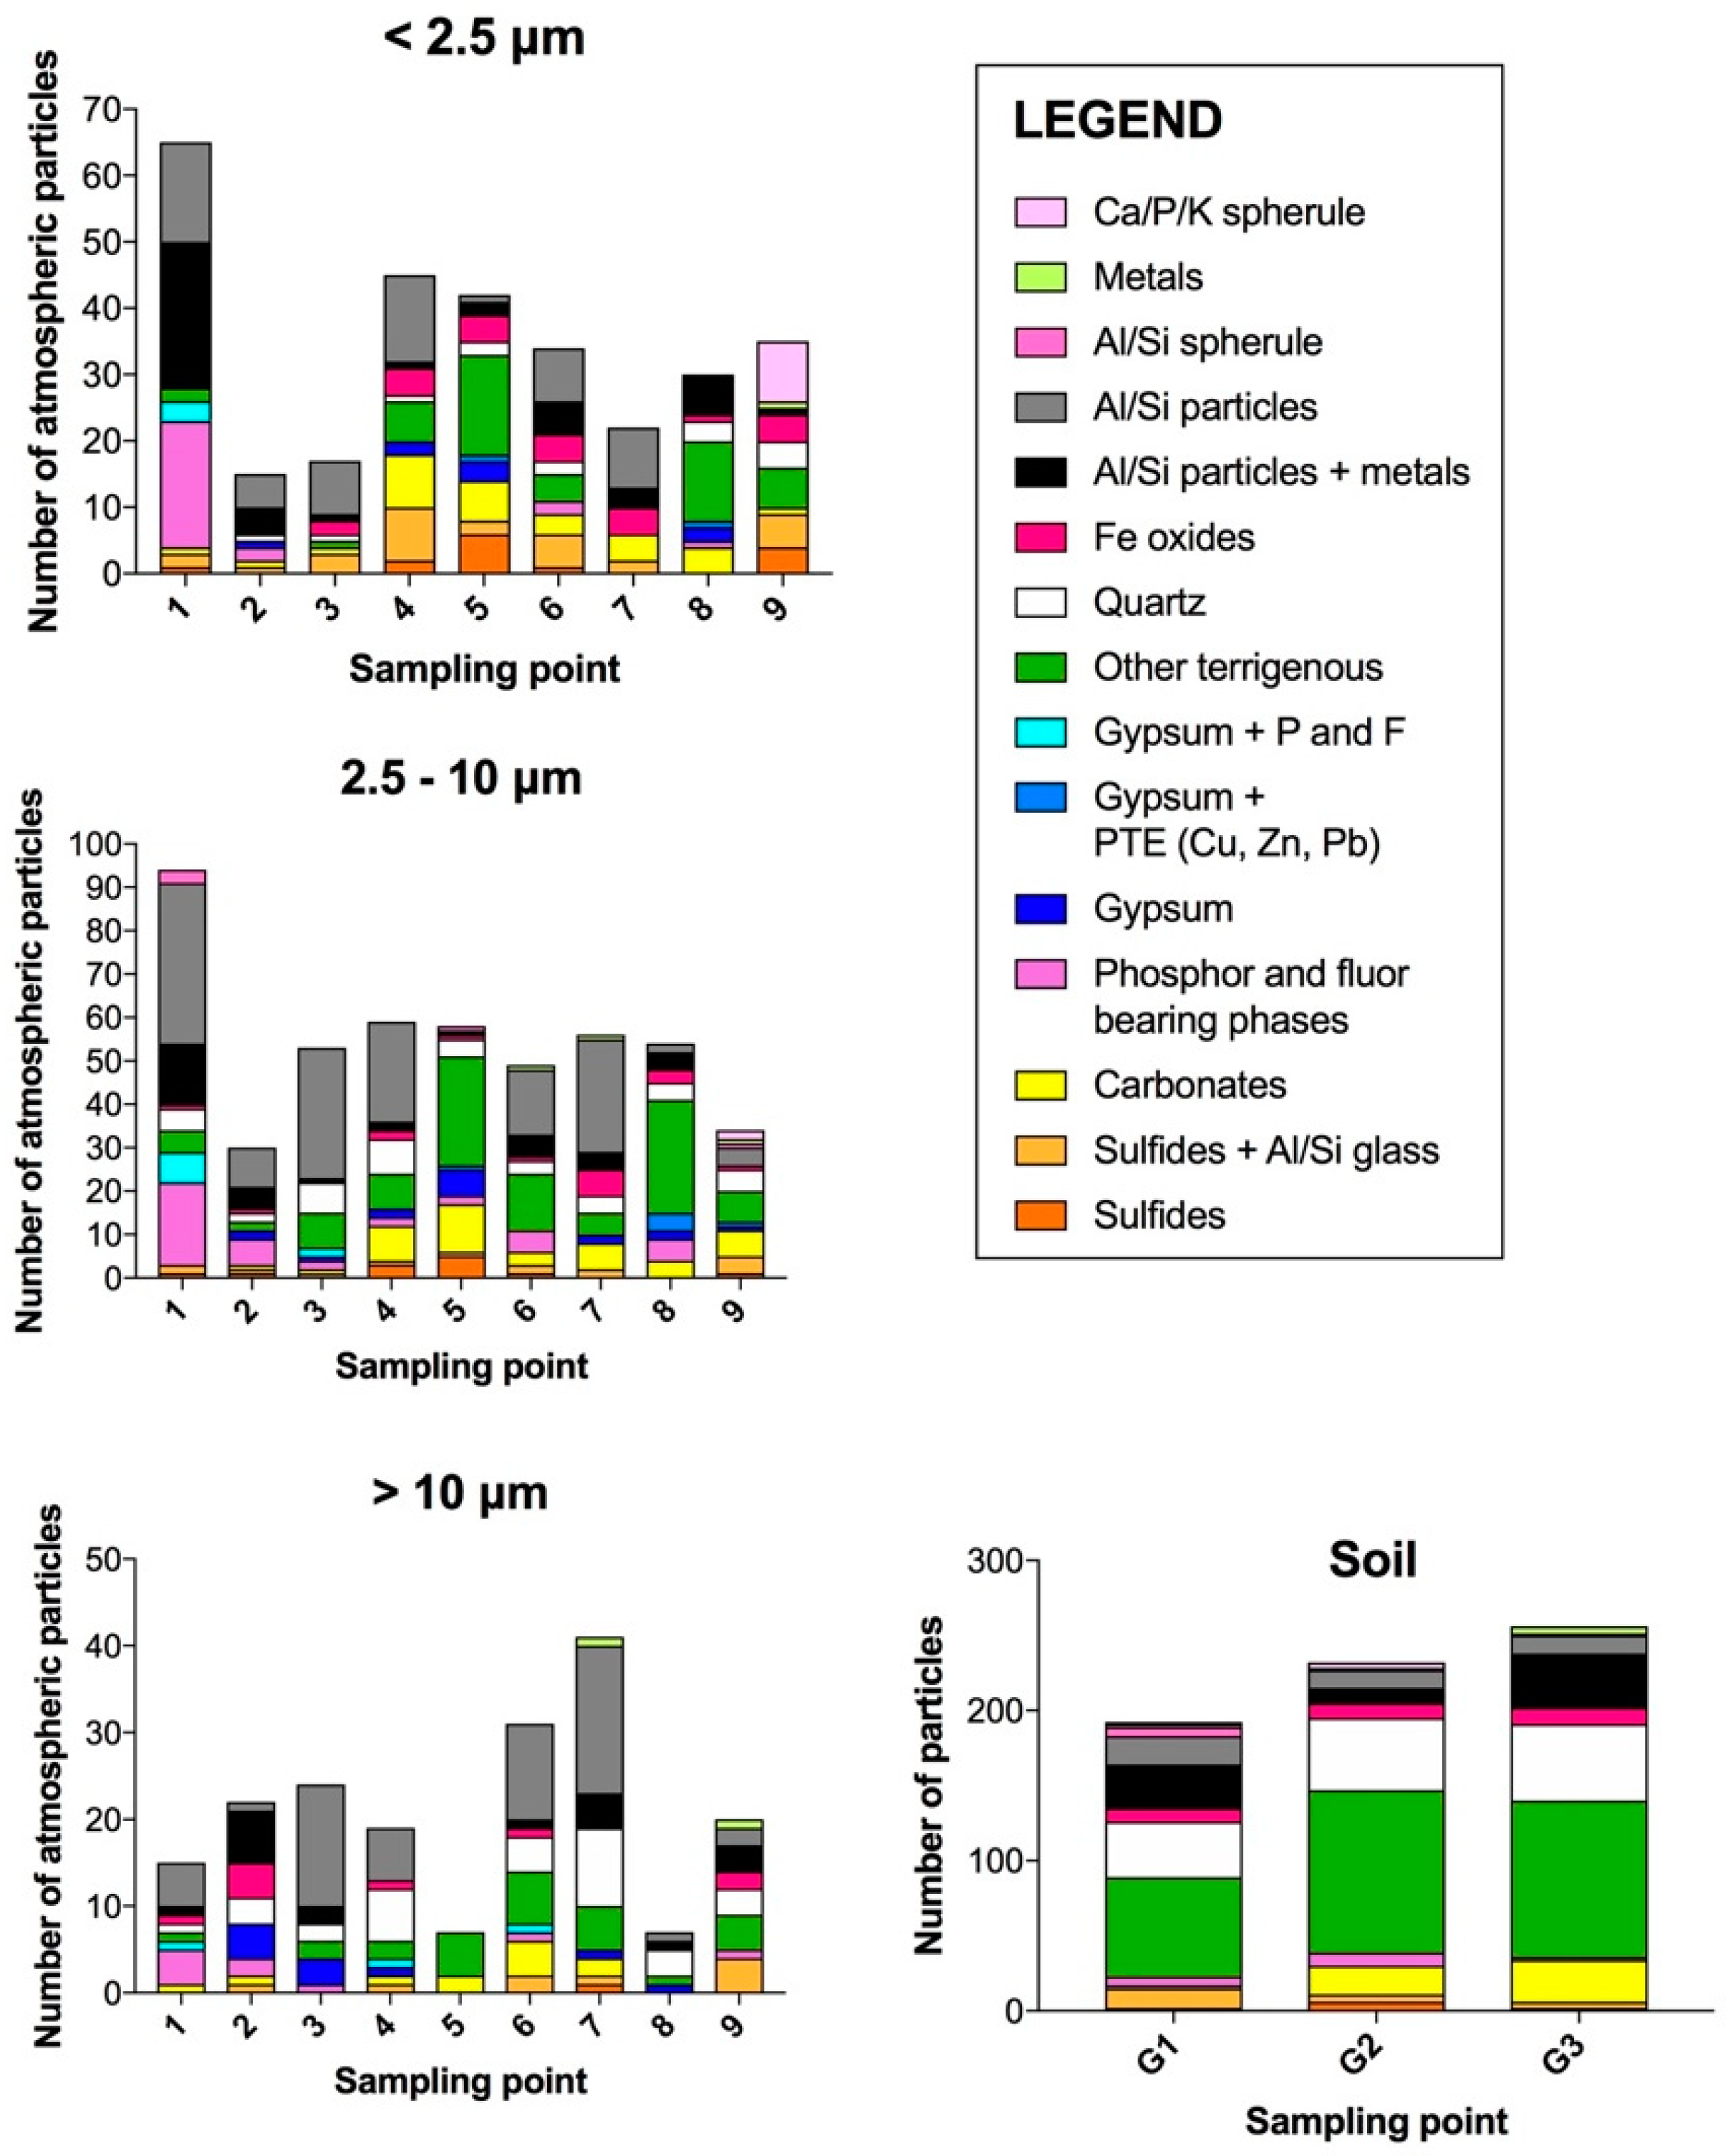
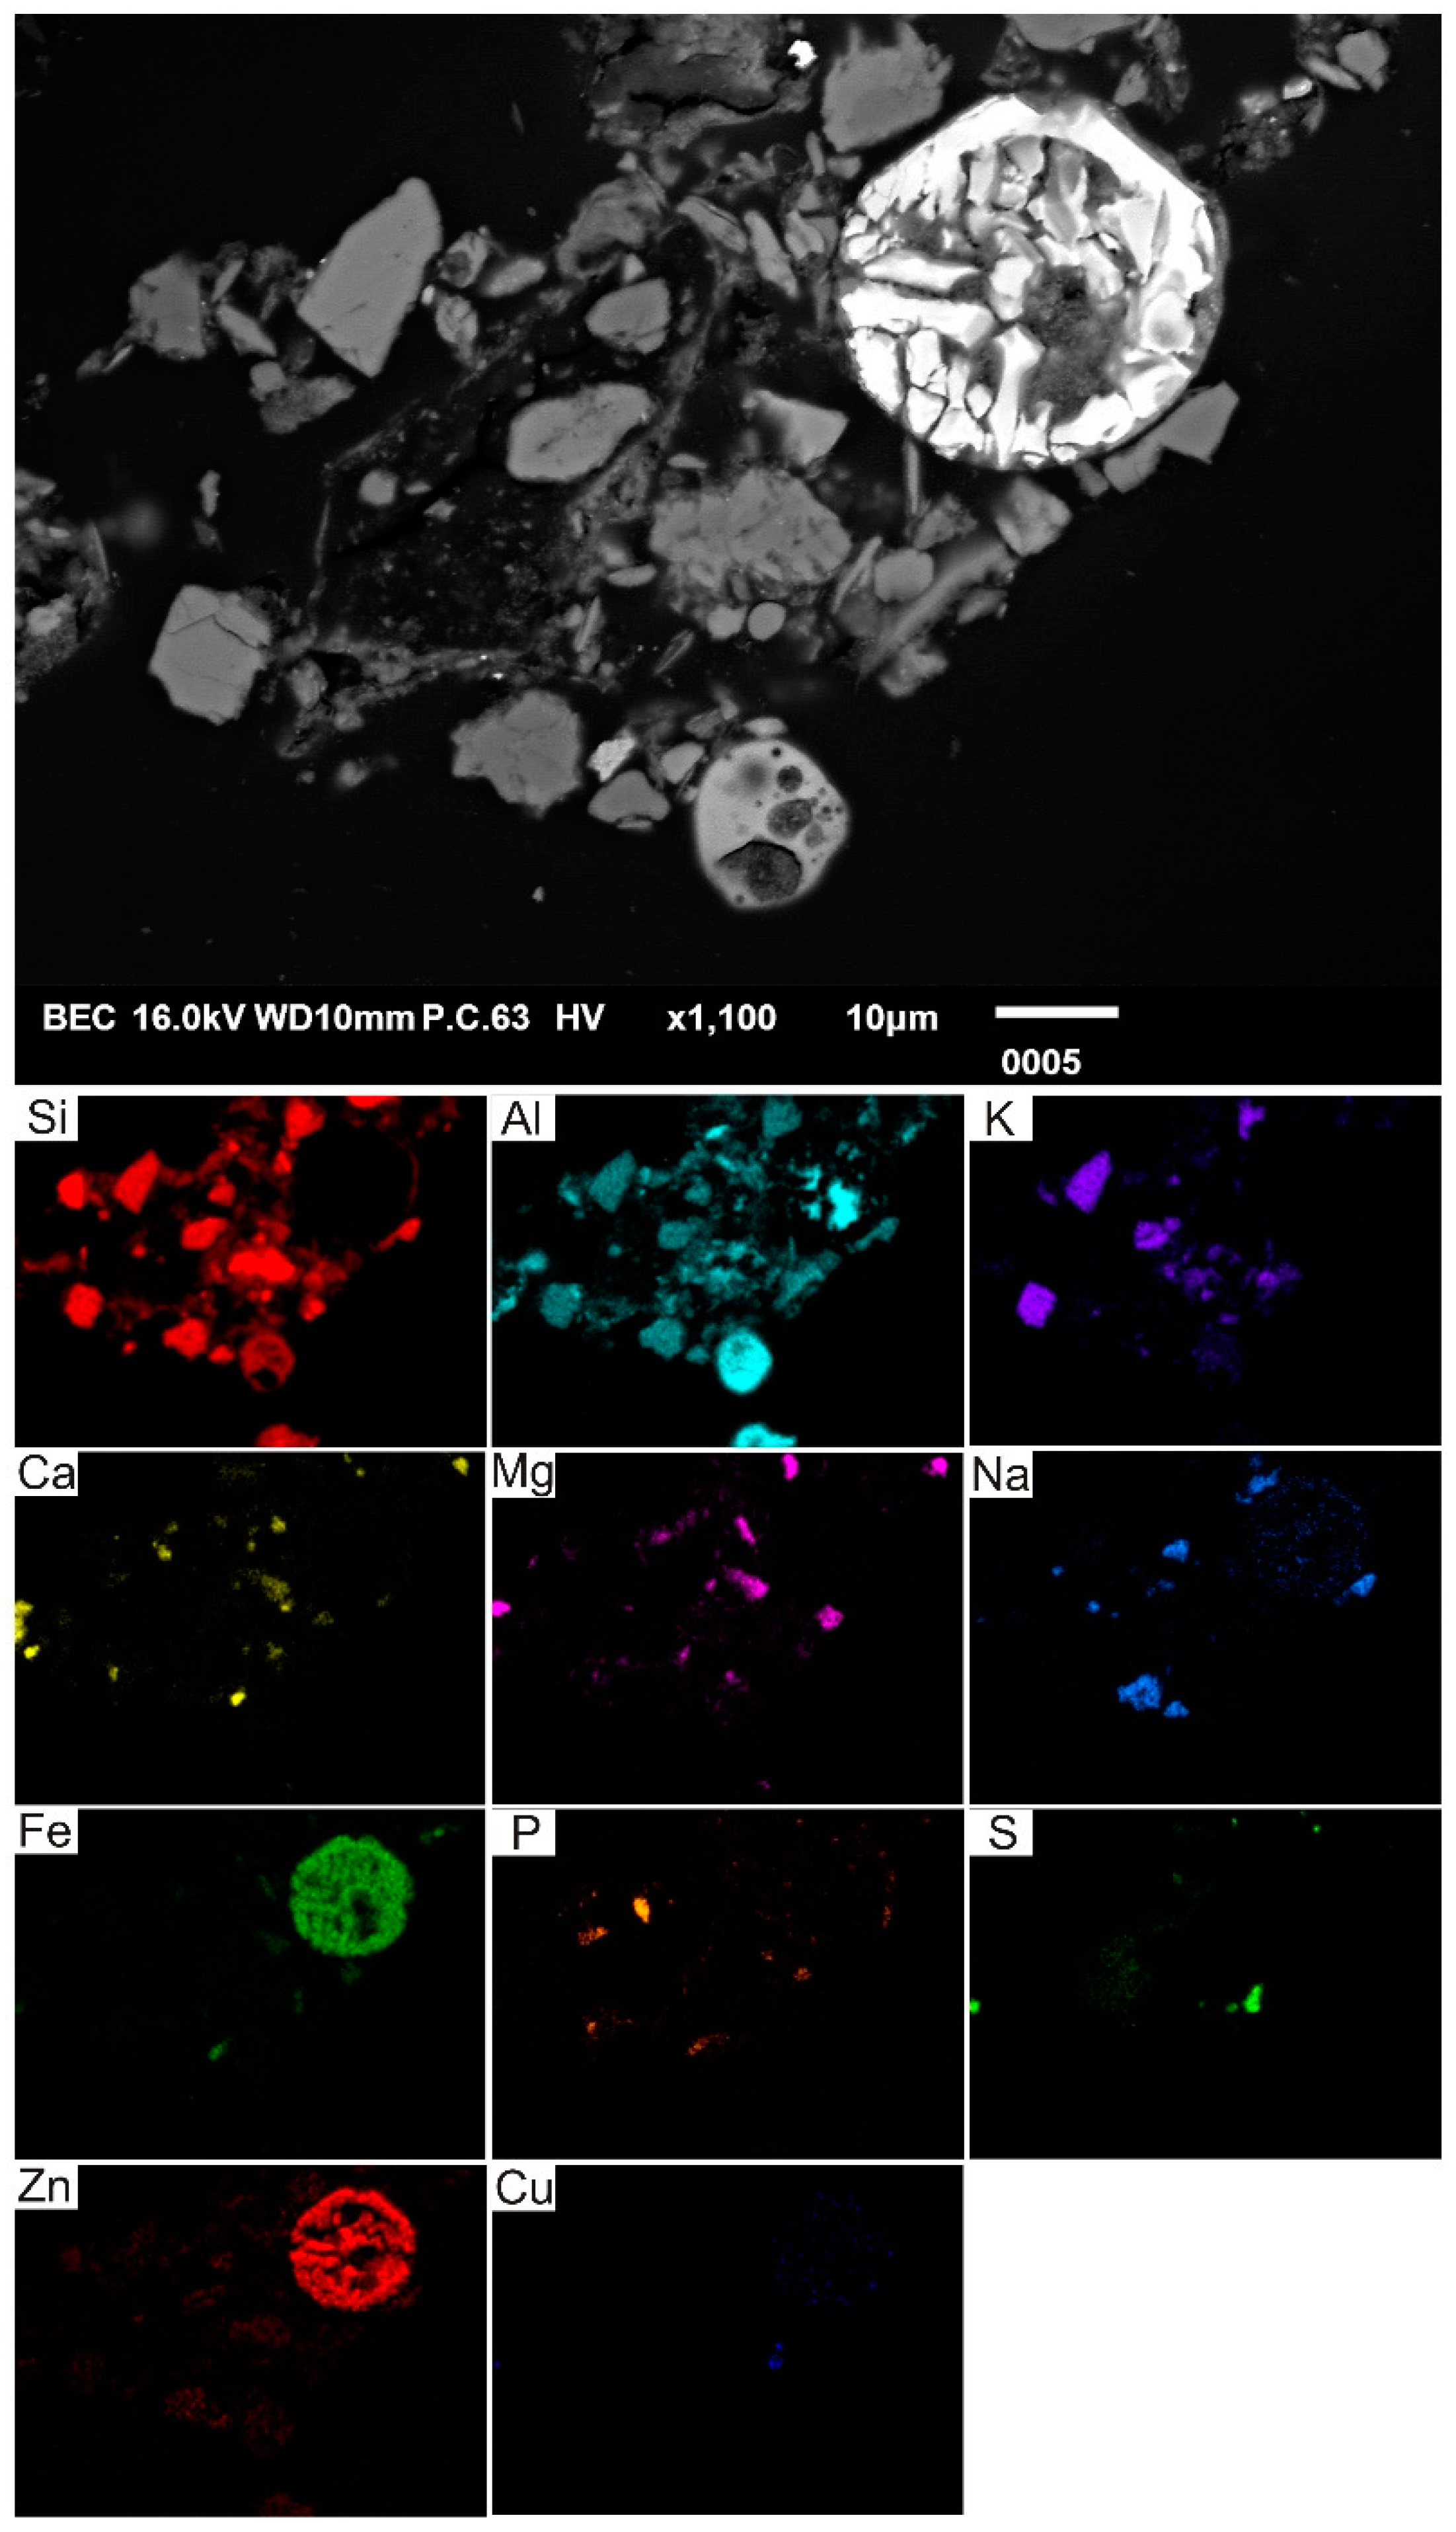
3.1. Size and Mineralogical Characteristics of Atmospheric Particles

The amount of adsorbed particles on P. nigra leaves, their size, and mineralogical composition varied greatly depending on location (Figure 1) and classified group (Table S1 and Figure 2, Figure 3 and Figure 4). At each sampling point, atmospheric particles were classified according to size into one of three distinct groups (<2.5 μm; <2.5–10 μm; >10 μm) and associated with one of the 15 mineralogical/phases categories (Table S1). Finally, for each leave and soil sampling point, a graph of the minerals/phases distribution was constructed (Table S1 and Figure 5).
The amount of particles (x) for each point and fraction was recalculated to percentage contribution (x) (Table S2) of specific phase/mineral in each sampling point, according to Equation (1):
%   contibution   of phase mineral ( x )   =   amount   of   phase / mineral   particles   ( x ) amount   of   all   particles   × 100 %
Group 1 (industry) is represented in all three sizes (from <2.5 µm to >10 µm) mainly by Si/Al (reaching 58.3%) and Si/Al particles containing other toxic metals (reaching 34.0%) (Table S2 and Figure 5) representing slag/ash/dust from the local industry. Other significant contributions in group 1 constitute P- and F-bearing phases (reaching 29.0%) associated with the nearest local pollutant hot spots (e.g., a phosphogypsum stack area, see Figure 1). Group 2, due to its urban character, is dominated by other terrigenous particles (reaching 43.1% in size groups fine fraction and coarse fraction and 71.4% in size over 10 µm) in all three size phases and others, like sulfides and Ca/P/K spherule, depending on local pollutant hot spots (e.g., a chemical plant and fertilizer from local agriculture, see Figure 1). Group 3 is dominated by terrigenous phases (quartz up to 42.9%, other terrigenous particles up to 48.1%) derived probably from the local Kalamkyr quarry (Figure 1) with admixtures of other minerals/phases. The amount of fine fraction (<2.5 µm) and coarse fraction (2.5–10 µm) dominated in the three analyzed groups (Table S1 and Figure 5).
The percentage contribution of inorganic anthropogenic origin particles (IAP) (Table S2) was calculated according to Equation (2):
%   contribution   of   IAP =   ( 100 % ( %   Q + %   OT ) )
where Q is represented by quartz and OT (other terrigenous) phases/minerals are represented by alkaline feldspar, plagioclase, muscovite, biotite, zircon, rutile, garnet, chlorite, and clay minerals (e.g., illite and kaolinite).
The discrimination of terrigenous/anthropogenic particles is similar to that reported by [14] but modified to the local character of industry (smelters/dressing factory/chemical plants).
The range of inorganic anthropogenic particles in each size and group is shown in Table 1. The normality in each particle size confirmed by Shapiro–Wilk’s W test allows us to test our hypothesis for differences in three groups—1, industry; 2, urban; and 3, quarry. The mean contribution of inorganic anthropogenic particles adsorbed on P. nigra leaves in the three groups tested differed significantly (ANOVA p < 0.05) (Table 1). Moreover, a very conservative post hoc HSD test confirmed statistically significant differences (p < 0.05) for fine fraction (<2.5 µm) between groups 1 and 2 and between groups 1 and 3, but without a significant link (p > 0.05) between groups 2 and 3 (Table 1).

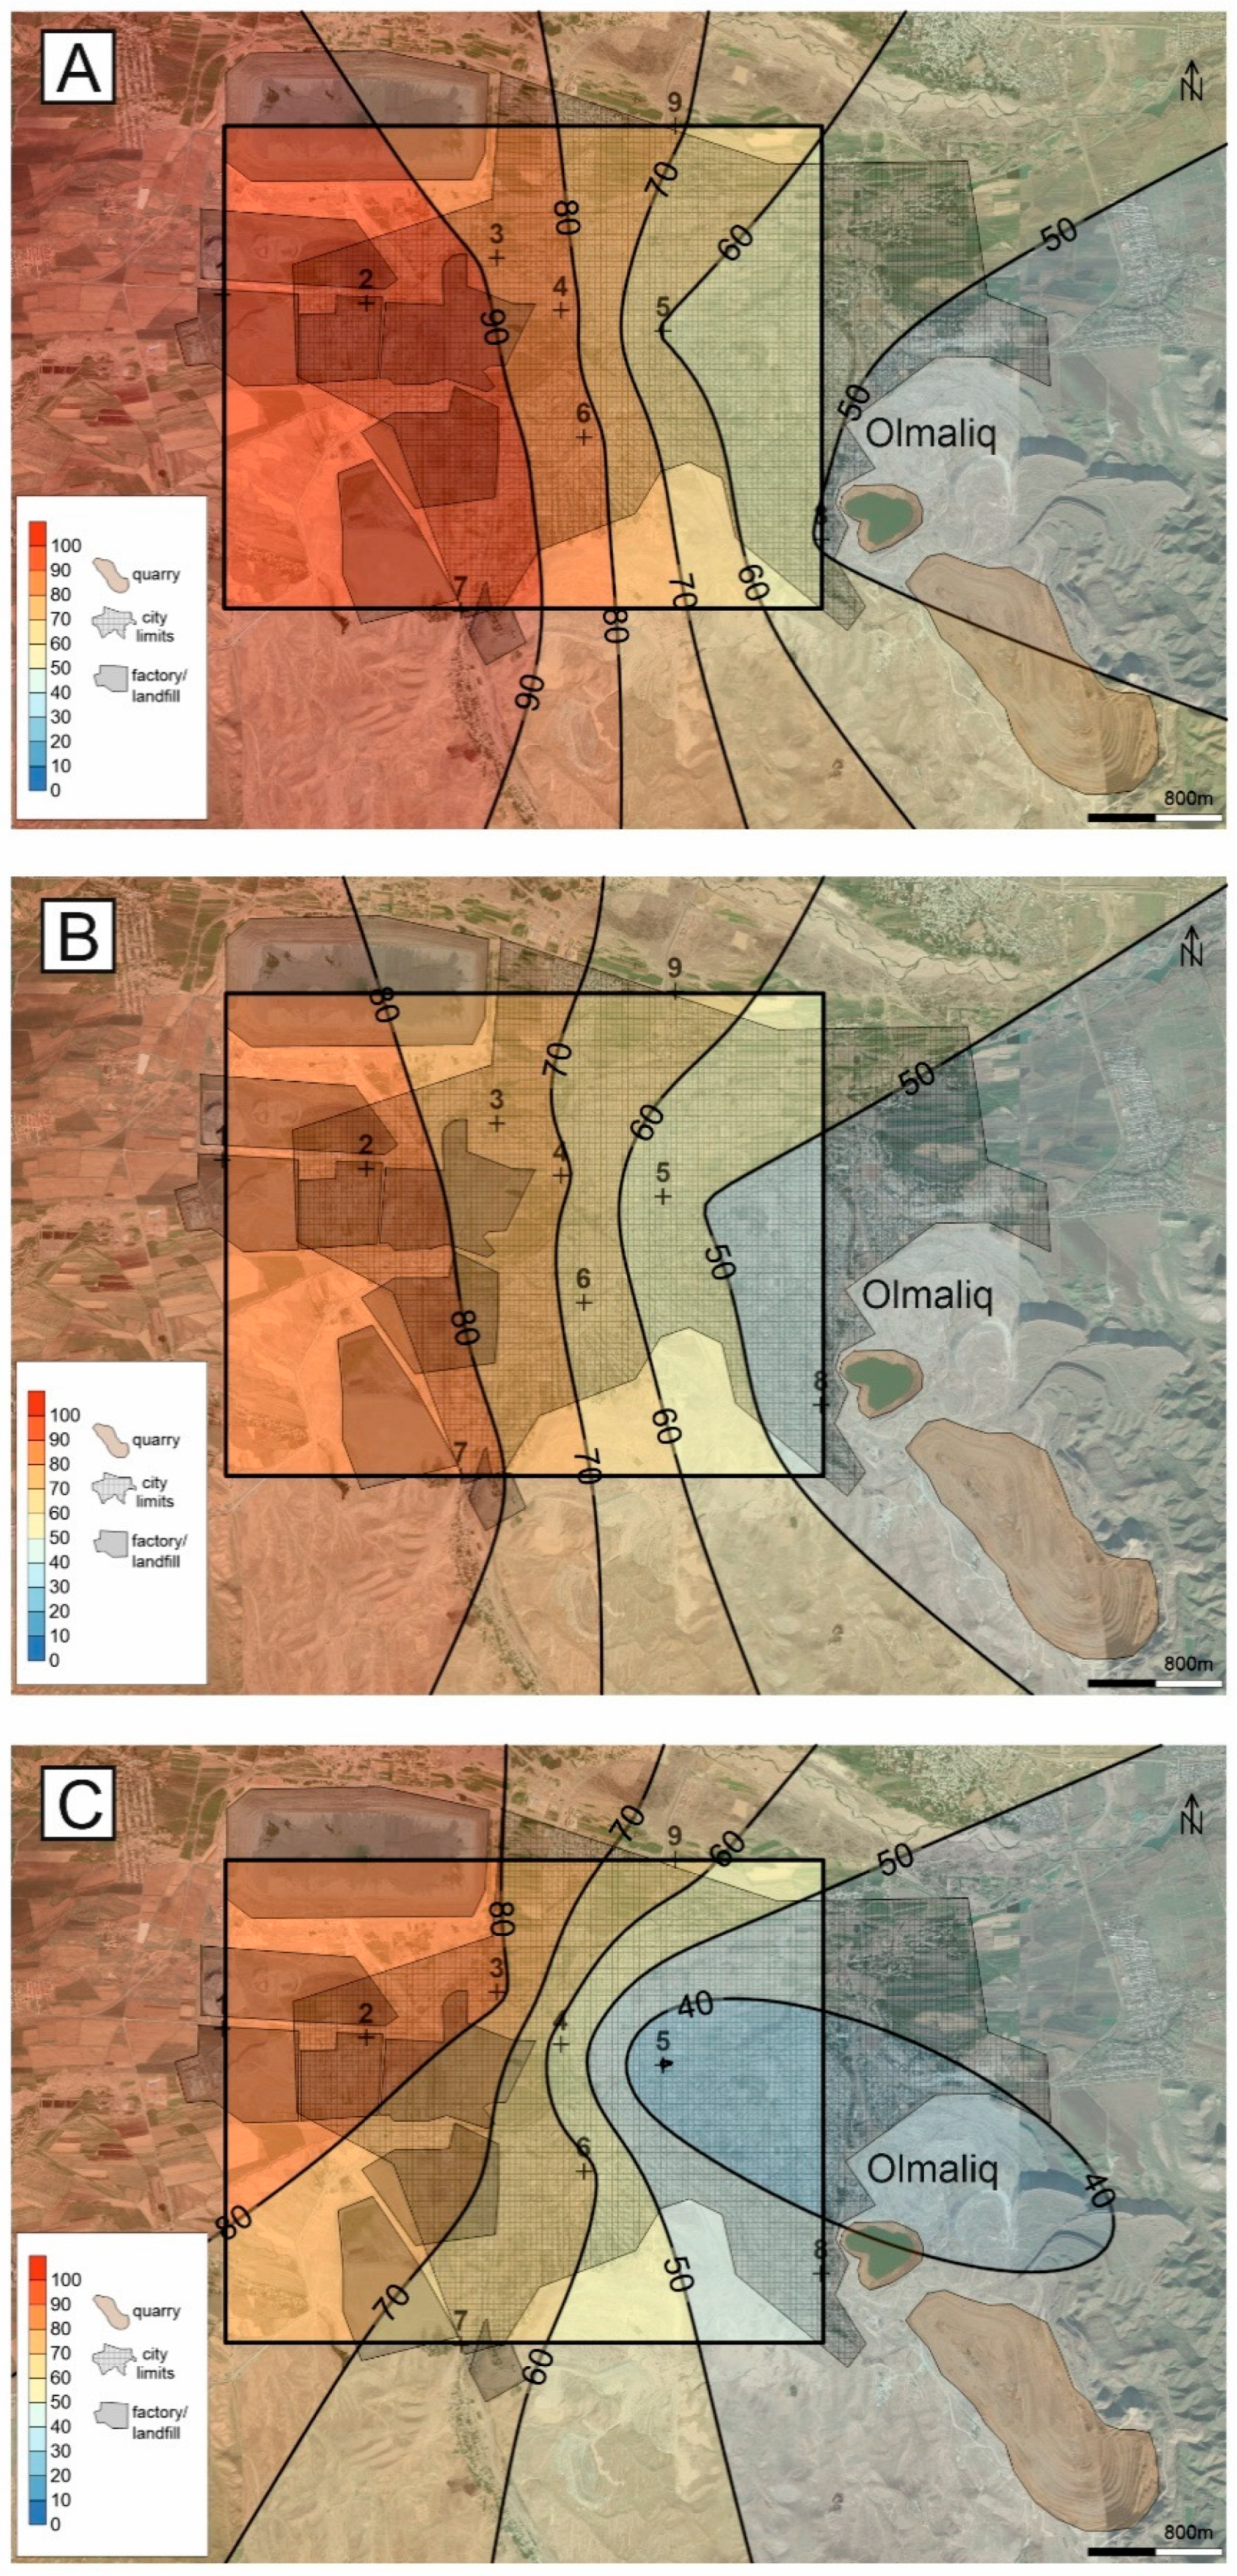
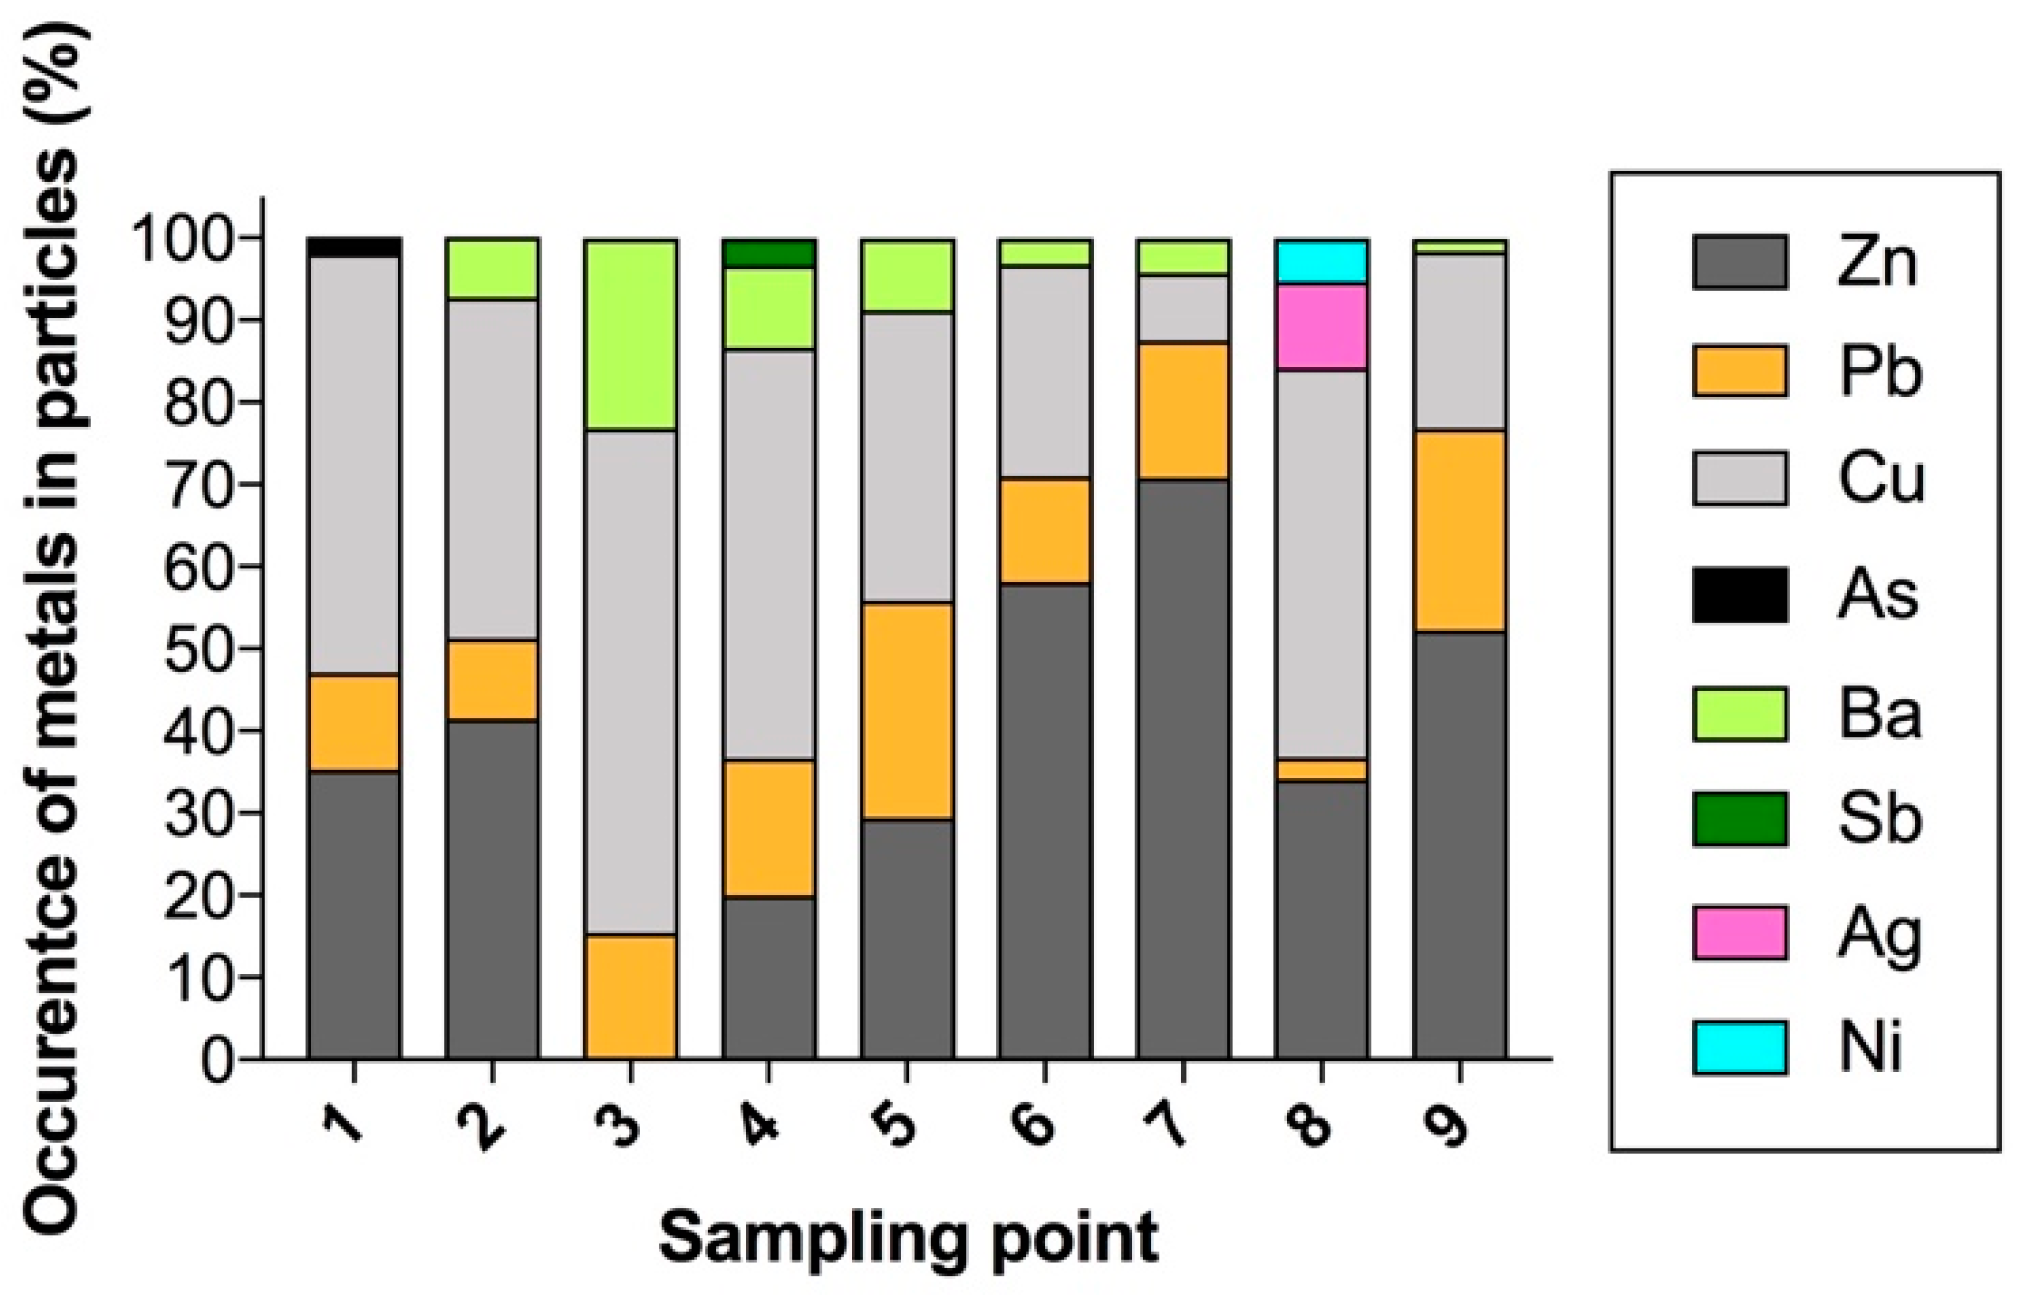
3.2. Spatial Distribution of Atmospheric Particles

Interpretation of data (Table S2) and the distribution of mineralogical phases (Figure 5) and confirmation of the lack of a statistical connection between groups 2 and 3 (statistically tested, Table 1) affirmed the dominant role of industry/smelting (group 1) as a local hot spot of atmospheric pollutants with dominant W/SW (West/Southwest) winds. This allowed us to prepare a spatial map (Surfer® from Golden Software, LLC, Golden, CO, USA, www.goldensoftware.com) of the distribution of inorganic anthropogenic atmospheric particles in the vicinity of Olmaliq city (Figure 6A–C). The range of inhalable (fine < 2.5 µm) inorganic anthropogenic particles reached the 90–60% level in about two-thirds of the area of Olmaliq city and spread about 7 km (Figure 6A) eastward from the industry/smelters center. The range of fine (2.5–10 µm) inorganic anthropogenic particles reached the 80–60% level in about half of the Olmaliq area and spread about 6 km (Figure 6B) eastward from the industry/smelters center. The range of coarse (>10 µm) inorganic anthropogenic particles reached the 80–60% level in about 40% of the Olmaliq area and spread about 4–5 km (Figure 6C) eastward from the industry/smelters center.

3.3. Mineralogical and Geochemical Characteristics of the Soil

The results of mineralogical analyses revealed the presence of a variety of mineral fractions in the studied soils (Table S3). The soil was dominated by terrigenous particles that accounted for 35%, 47%, and 41% (recalculated using Equation (1)) for locations G1, G2, and G3, respectively. A significant volume of soil was also made up of quartz (~20%) and anthropogenic Al/Si particles and Al/Si particles with some admixtures of metals. The amount of the latter particles varies from one sampling point to another—14.6% (G1), 14.2% (G3), and 4.1 (G2). Soil from location G1 was characterized by a higher amount of sulfides (sulfides + Al/Si and sulfides) (8.4%) compared to others (2.4–4.9% at locations G3 and G2). Likewise, Si/Al spherules dominated (3%) at location G1 over the other locations (up to 0.4%). In turn, soil from locations G1 and G2 exhibited a notable content of P/F phases (2.9–3.8%) whose content at location G3 did not exceed 0.8%. Location G3 is also associated with the highest amount of metals (up to 2%); the other locations studied reported up to 1%. Other particles detected in the soil samples included Fe-oxides up to 4.5% (Table S3).
The soil samples analyzed in this study were collected nearby industrial centers. Therefore, in order to decipher whether concentrations of contaminants can be assigned as anthropogenic input, our data have been compared with values reported by [35]. These authors collected samples far from our study area, thus, we considered them as background values. Bulk soil from our study contained remarkable concentrations of Cu, Zn, and Pb reaching 2202; 2052; and 957 mg kg−1, respectively (Table S4). Location G1 contained the highest quantities of these elements, with the exception of Zn that dominated in location G3 (Figure 7). Other metals, such as Ni (up to 27 mg kg−1), As (up to 46 mg kg−1), Cr (up to 31 mg kg−1), Ag (up to 4.1 mg kg−1), and Co (up to 9.8 mg kg−1), occurred at similar concentrations at all studied locations, whereas Mo (5.2 mg kg−1) and Sb (6.7 mg kg−1) were at least three times less concentrated in location G3 (up to 22 mg kg−1) compared to locations G1 and G2 (Tables S4 and S5). When all aforementioned values are compared to soils (samples collected at the far distance from industrial center) analyzed by [35], anthropogenic origin of these contaminants can be stated. For example, the authors reported background concentrations at the level of 46–53 mg kg−1 (Cu), 99–154 mg kg−1 (Zn), 28–49 mg kg−1 (Pb), 557–756 mg kg−1 (Ba), 10–18 mg kg−1 (Co). Concentrations reported in our study were clearly higher for Cu, Zn and Pb, indicating a trend of increased concentration when approaching the industrial center. In addition, values reported in our study were highly comparable with that reported in samples of [35] collected near the center.

4. Discussion

4.1. Atmospheric Particles

Populus nigra leaves have a good fine PM retention capability, but what is more significant is that it has a greater amount of adsorbed particles representing PM1 fraction in total PM10 load [26,51]. It is the most important when a bio-passive sampler (e.g., leaves) is applied to gather sub-micron and fine fraction, generated very often during industrial processes. Two different possible PM collection methods, V/F (vacuum filtration of dust washed from leaves and gravimetric analysis) and SEM-EDX (direct measuring of particles on leaves), can be applied, however, both have their own advantages and disadvantages [25,26,27,52]. The investigations made by [26] concerning evaluation of the V/F and SEM-EDX method on P. nigra reported a two-times higher value of PM10 load in V/F probably due to residual honeydew dissolute by F/V method. Thus, SEM/EDX is considered to be more appropriate than V/F for PM load analysis on leaves, and, additionally, it better distinguishes both PM diameter and chemical/mineralogical content and evaluates the overall PM amount to a greater extent [26].
This study demonstrated that the size and mineralogical distribution of the contribution of adsorbed particles on P. nigra leaves strongly depends on location (Figure 1) (Table S1 and Figure 2, Figure 3 and Figure 4). Similarly, Teper [19] noted that the weight of deposited atmospheric particles on Pinus sylvestris needles varied and did not always depend on exposure time (age of needles), but rather that specific localization was an important factor. Similarly, the authors of [52] and references therein studying transplanted mosses demonstrated significant input of industrial contaminants (e.g., iron, aluminum, lead smelters) occurring as metal-bearing (Fe, Al, Sb, Pb etc.) particles on bioindicator surfaces. Our investigation confirmed the important input of anthropogenic origin (Cu/Pb/Zn dressing factory and smelters, chemical plants, etc.) of atmospheric particles in the local Olmaliq atmosphere. The nearest industrial area points (group 1) reached about 90% anthropogenic hazardous fine particles (below PM2.5), whereas urban points (group 2) reached 65%, and the quarry point (group 3) only 49% (Table 1). We observed the spread of anthropogenic fine particles almost 7 km east of the city center from the industrial area (Figure 6A). Most of the smallest particles consisted of sulfides and other Si/Al metal-bearing phases/spherules (Figure 5A). Therefore, due to their size and chemical (heavy metal-bearing) character as an inhalable fraction, they are very hazardous to the local city population [53,54]. The range of fine (Figure 6B) and coarse (Figure 6C) particles of anthropogenic origin is lower but still important. Moreover, the mineralogical character of fine and coarse particles varied (the amount of terrigenous/quartz particles increased) depending on location (Figure 1 and Figure 5B,C) and size (Figure 5B,C and Figure 6B,C). However, the greater fraction aerosols can be easily removed from upper respiratory tracts and are not as dangerous as fine particles, which penetrate deeper in the upper respiratory tracts and lungs [16].
The connections between industry, urban, and quarry sampling points was tested statistically (Table 1), and differences between groups indicate only one hot spot of pollutants (the industrial area) located in the western part of Olmaliq. The influence of the Kalmakyr mine (quarry point) on atmospheric particles, especially in Olmaliq center (urban points, Figure 1), were excluded by a statistical test (Table 1) and mineralogical characteristics (Figure 5A–C and Figure 6A–C). Investigations made by [27,52] confirmed our observations and demonstrated that the biggest input of sub-micron and fine particles is associated with the industry area. For urban and rural/sub-urban areas, the proportion between particles has been changed in favor of the coarse over the 10 μm fraction. Furthermore, we hypothesized that local industry, similar to investigations from Kazakhstan described by [22], and local west-prevailing wind direction [36] are the most important factors influencing the distribution and composition of fine and coarse particles in the vicinity of Olmaliq. Therefore, coarse terrigenous particles generated by the Kalmakyr mine works and deflated by the atmosphere are probably transported eastward from the quarry locally rather than spreading north-westward to Olmaliq center.

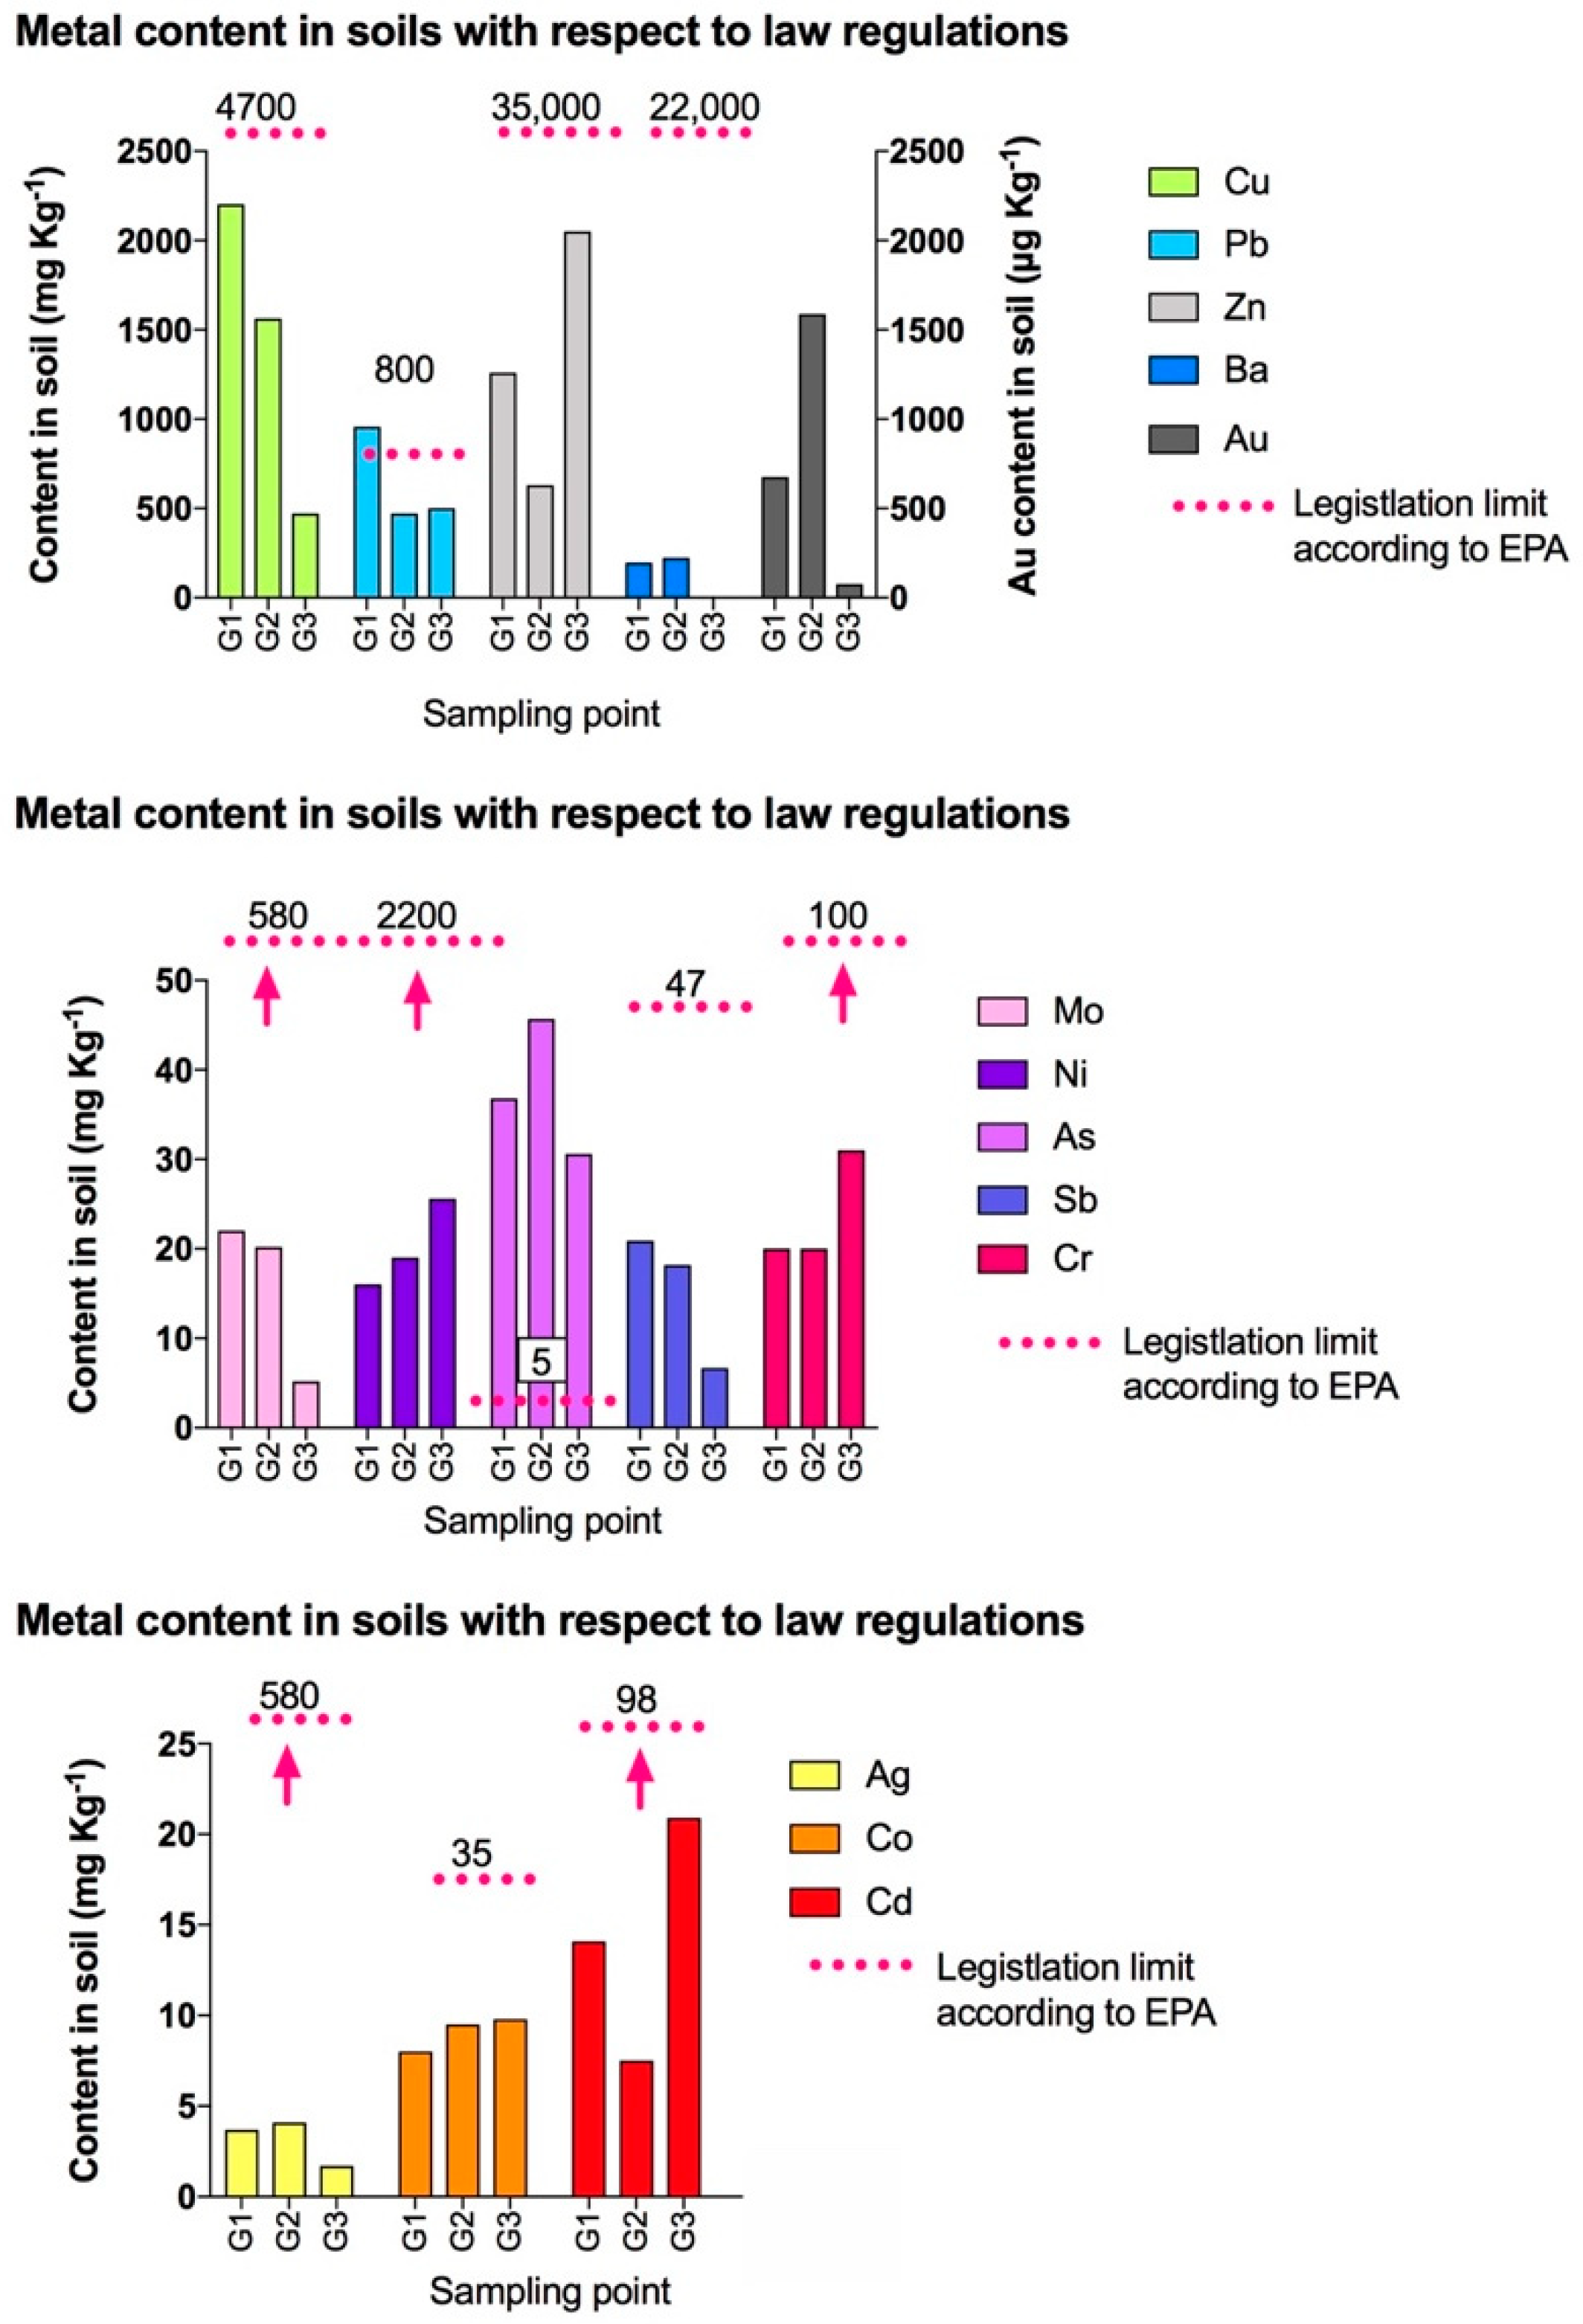
4.2. Soil Samples: Contamination and Reference to Regulation Limits

Soil contamination by metallic elements in the environs of rapidly expanding industrial areas is a critical issue. The problem has local implications because the problem of metal contamination in Olmaliq soils has already been reported [36]. However, it also applies at large as there are many other industrial locations endangered by metals in the world [55]. The reason for choosing near-surface soil layers for contamination assessment is that, according to reports in the literature, smelter-derived contaminants tend to accumulate near the surface despite possible downward migration in the soil profile [56].
The surface soil layers analyzed in our study were characterized by the highest content of Cu and Zn. However, soil closer to the Cu smelters is undoubtedly more vulnerable to accumulated Cu emissions compared to Zn, as the latter tended to accumulate near the Zn smelter (Figure 1). Another reason for higher Cu levels in G1 could be higher emissions from the Cu smelter than from the Cu dressing factory.
A comparison of the obtained data (Figure 8) with respect to the target hazard limits quotient of 0.1, according to the US EPA (United States Environmental Protection Agency) [57], indicated that some elements exceeded permissible norms. The element As was found to exceed the norm substantially (10–15 fold). Another element of high concern is Pb, which slightly exceeded the permissible concentration at location G1, whereas locations G2 and G3 were slightly below permissible limits, meaning that soils met the quality standards for industrial soils. With regard to Cr, no risk is expected provided that it occurs in insoluble salts form. However, according to SEM-EDX analysis, it may be present as various impurities, thus, special caution should be given to this element, even though it theoretically meets the standards. Other elements studied (e.g., Cu, Zn, and others) are shown in Figure 8.
When metal concentrations are compared with data on mineralogical soil composition, it becomes clear that a high connection exists between metal content and determined fractions. For example, location G1 exhibited the highest content of Cu and Pb, which can be connected with the highest presence of Al/Si particles and sulfides associated with these metals according to SEM-EDX analysis (Figure 7). In addition, Ag admixtures were detected in sulfides. Likewise, location G3 revealed a high content of Zn due to the presence of Fe/Zn-bearing droplets characterized by trace admixtures of Sb. Of great importance is the fact that these metals are associated with minerals known to be susceptible to weathering/dissolution, implying their mobility and potential for subsequent migration downward in the soil profile and thus their potential to become widespread. In particular, current forecasts concerning smelting processes worldwide expect Cu production to increase in the years ahead [58]. There are no specific minerals responsible for Co content in studied soils; Co is mainly associated with impurities present in sulfides (e.g., pyrite). Moreover, this element may enter the pyrite structure substituting Fe [45]. Ba occurs at relatively low concentrations in the studied soil, and yet it is mainly associated with feldspars, which is typical of this type of mineral [45]. Additionally, among feldspars studied, besides the typical K/Na/Ca feldspars, there were Ba-bearing feldspars present, such as celsian and hyalophane. Likewise, Mo does not occur in the typical Mo-bearing minerals, but rather occurs embedded in Al/Si particles, mainly the glassy parts.
It is important to note the considerable content of Au (up to 1600 μm) in the studied soils, which is high enough to consider it with respect to potential industrial processing.

4.3. Coupled Mineralogical/Geochemical Atmosphere–Soil Connection

Mineralogical and geochemical correlations between anthropogenic atmospheric particles and surrounding soils have been reported by other authors [22,35,37]. Therefore, we tested a possible relation between the percentage contribution of atmospheric anthropogenic particles (Table S2) and the percentage contribution of anthropogenic particles in the soils (Table S3). All soil–atmospheric particle pairs were connected with the group 1 (industrial) area (Figure 1). Due to a lack of normal distribution of analyzed parameters, Spearman’s correlation coefficient ρ was applied (Table 2). In other words, the coefficients reported in Table 2 indicate possible relations (positive or negative) between anthropogenic mineral particles on leaves and soils as well as between different sizes (fine/coarse/over 10 µm) of anthropogenic mineral particles adsorbed on leaves. Thus, we tested the hypothesis that atmospheric particles deposited on leaves mainly derived from the industrial center and were generally not deflated/re-suspended from the nearest local soils.
Each analyzed soil sample was similarly loaded by anthropogenic grains, as confirmed by statistically significant G1–G2–G3 soil relationships (Table 2). Any statistically significant links between soils and fine/coarse/over 10μm atmospheric particle fractions in the vicinity of P. nigra leaves were observed. This confirmed our hypothesis that inorganic particles deposited on leaves are not deflated from local soils and can be used for wider interpretation of local atmospheric pollutants.
An interesting trend was observed in atmospheric particles from sample No. 3, which revealed a relationship between coarse and over 10 μm fractions, but no relationship with the fine fraction (Table 2). Similar rule were observed by [6], where higher impact of coarse fraction were connected with re-suspended road dust and deflation/re-suspension of mechanically generated particles (e.g., tire wear and brake lining dust) to the total pool of PM. Moreover, other analyzed points (Nos. 1 and 6) had positive correlations between fine/coarse/over 10 μm fractions in each point; we also observed links between the coarse and over 10μm fractions of all three (Nos. 1, 3, and 6) points (Table 2). The lack of a relation of fine particles from point No. 3 was probably caused by local super input of specific pollutants and/or local conditions influencing the proportions between adsorbed minerals/phases (Figure 5A).
Further, we tested possible correlations between metal concentrations (Table S3) and percentage contributions of anthropogenic particles and/or only sulfides and metal-bearing phases in soils (Table S2), but no statistically confirmed correlations were found. This is probably caused by the fact that metals (concentration measured by ICP-MS) probably exist as dispersed phases and/or particles too small to be detected and analyzed by SEM-EDX.

4.4. The Importance of Our Study in the Context of Human Health

This study investigated inorganic atmospheric particles and their mineralogical composition. This study demonstrated that impact of smelters to the environment should not be neglected. It is important to note that not only composition of these particles, but their structures should also be examined in the assessment of the impact on human health. Human exposure to such particles may lead to their intake into the respiratory system and subsequently affect health conditions [59]. The particles investigated in our study contained elements including Cu, Zn, Pb, As, Ba, Sb, Ag, and Ni, all known for their potential impact on health and toxicity features. Among the aforementioned elements, Cu and Zn were found to be to most relevant in term of potential impact since as much as 70.8% (for Zn) and 61.5% (for Cu) particles contained these elements. Lead was found to occur in particles in a lower amount since maximally 26.5% particles contained this element. Likewise, Ba occurred in 23% particles. Other elements were less frequently found being identified in maximally 10.5% of particles. Nevertheless, no elements should be neglected in terms of their impact on inhabitants of resident population of Olmaliq city, because it generally indicated notable dose of pollutants in particles (Figure 9). However, it is important to point out that apart from amount of toxic elements incorporated in studied particles, also their shape should be considered, mainly because shape affects settling velocities [60]. We demonstrated that studied particles were spherical, round-shaped, eventually elongated, but nearly no needle-like particles were found. As pointed out by [61], elongated needle-like particles are more dangerous because they reveal a longer suspension time in the air and subsequently probability of their intake by human increases.

4.5. The Novelty of This Study with Respect to Other Studies

Our study demonstrated that a combined geochemical approach tracking the element concentrations in soils and identification of particles (in terms in size and quality) are relevant for elucidating anthropogenic input of contaminants. In addition, we took a deeper look at these contaminants and identified dispersal of atmospheric particles as well. Our study demonstrated that P. nigra can efficiently be used as a sampler for geochemical investigations and provides advanced insight into the distribution of contaminants. For this reason, more reliable conclusions concerning migration of inorganic atmospheric particles were drawn, reflecting the advantages of biotic samplers.

5. Conclusions

We postulated that SEM-EDX analysis of atmospheric particles adsorbed on P. nigra leaves can provide qualitative and quantitative information about local atmospheric pollutants, and it allowed us to access a range of atmospheric pollutants derived from hot spots, such as the smelters/industry center. Our investigation, supported by coupled mineralogical (SEM-EDX) and geochemical (ICP-MS) analyses, indicated the important (up to 90%, especially in fine inhalable fractions) and widespread (up to 7 km eastward from the industrial center) impact of smelters and industry on Olmaliq inhabitants.
Moreover, the results of this study suggested that the impact of Cu smelters on the surrounding environment should not be ignored. The diminished quality of soils caused by remarkably high content of metals was observed. In regard to mineral soil composition, sulfides and metallic droplets are of particular relevance due to the potential release of the metallic elements incorporated therein. Furthermore, inorganic particles originating from anthropogenic emissions should be considered as a potential source of undesirable intake by humans. The investigation of the presence of these particles closer to Olmaliq city as well as their acute and chronic impact of resident population will definitely be an interesting and relevant objective for further geochemical studies.

Supplementary Materials

The following are available online at https://www.mdpi.com/2073-4433/11/10/1126/s1. Table S1: Mineralogical phases of atmospheric particles deposited on Populus nigra Italica leaves gathered in August 2018 in the vicinity of Olmaliq city (Uzbekistan). Table S2: Percentage contribution (calculated according to Equation (1)) of mineralogical phases of atmospheric particles deposited on Populus nigra Italica leaves gathered in August 2018 in the vicinity of Olmaliq city (Uzbekistan). Percentage contribution of inorganic anthropogenic particles calculated according Equation (2). Table S3: Amount and percentage contribution (calculated according to Equation (1)) of mineralogical phases of grains in soil samples gathered in August 2018 in the vicinity of Olmaliq city (Uzbekistan). Percentage contribution of inorganic anthropogenic grains calculated according Equation (2). Table S4: Metal concentrations in soil samples gathered in August 2018 in the vicinity of Olmaliq city (Uzbekistan). Table S5: Metal concentrations in soil samples gathered in August 2018 in the vicinity of Olmaliq city (Uzbekistan).

Author Contributions

Conceptualization: M.G.; methodology: M.G., W.B., A.P. and A.S.; formal analysis: M.G.; investigation: M.G., W.B. and A.S.; data curation: M.G., W.B., A.P. and A.S.; writing—original draft preparation: M.G.; writing—review editing: A.P. and W.B.; project administration: M.G.; funding acquisition: M.G., W.B. and A.P. All authors have read and agreed to the published version of the manuscript.

Funding

This research was funded by the National Science Centre (NCN) in Poland in the frame of the SONATA program grant number [UMO-2018/31/D/ST10/00738]. The work was also funded by statutory grants: Subwencja-działalność badawcza (501) 0410/2988/20.

Acknowledgments

The authors would like to thank the Editors and the anonymous Reviewers for their comments that helped us to improve quality of our manuscript.

Conflicts of Interest

The authors declare no conflict of interest.

References

  1. Dahlman, C. Technology, globalization, and international competitiveness: Challenges for developing countries. In Industry Development 21st Century (Hyderabad Orient Longman, Zed Books United Nations); O’Connor, M.K., Ed.; United Nations: New York, NY, USA, 2007; pp. 29–83. [Google Scholar] [CrossRef]
  2. Jarošíková, A.; Ettler, V.; Mihaljevič, M.; Kříbek, B.; Mapani, B. The pH-dependent leaching behavior of slags from various stages of a copper smelting process: Environmental implications. J. Environ. Manag. 2017. [Google Scholar] [CrossRef] [PubMed]
  3. Bridge, G. The social regulation of resource access and environmental impact: Production, nature and contradiction in the US copper industry. Geoforum 2000. [Google Scholar] [CrossRef]
  4. Liu, Y.; Dong, F. How industrial transfer processes impact on haze pollution in China: An analysis from the perspective of spatial effects. Int. J. Environ. Res. Public Health 2019, 16, 423. [Google Scholar] [CrossRef] [Green Version]
  5. Csavina, J.; Field, J.; Taylor, M.P.; Gao, S.; Landázuri, A.; Betterton, E.A.; Sáez, A.E. A review on the importance of metals and metalloids in atmospheric dust and aerosol from mining operations. Sci. Total Environ. 2012, 433, 58–73. [Google Scholar] [PubMed] [Green Version]
  6. Hueglin, C.; Gehrig, R.; Baltensperger, U.; Gysel, M.; Monn, C.; Vonmont, H. Chemical characterisation of PM2.5, PM10 and coarse particles at urban, near-city and rural sites in Switzerland. Atmos. Environ. 2005. [Google Scholar] [CrossRef]
  7. Karagulian, F.; Belis, C.A.; Dora, C.F.C.; Prüss-Ustün, A.M.; Bonjour, S.; Adair-Rohani, H.; Amann, M. Contributions to cities’ ambient particulate matter (PM): A systematic review of local source contributions at global level. Atmos. Environ. 2015, 120, 475–483. [Google Scholar] [CrossRef]
  8. Belis, C.A.; Karagulian, F.; Larsen, B.R.; Hopke, P.K. Critical review and meta-analysis of ambient particulate matter source apportionment using receptor models in Europe. Atmos. Environ. 2013, 69, 94–108. [Google Scholar] [CrossRef]
  9. Pope, C.A.; Dockery, D.W. Health effects of fine particulate air pollution: Lines that connect. J. Air Waste Manag. Assoc. 2006. [Google Scholar] [CrossRef]
  10. Boev, I.; Sijakova-Ivanova, T.; Mirakovski, D. Scanning electron microprobe characterization of air filters from the Kavadarci town and Tikves valley. Geol. Maced. 2013, 27, 13–24. [Google Scholar]
  11. Grobéty, B.; Gieré, R.; Dietze, V.; Stille, P. Airborne particles in the urban environment. Elements 2010. [Google Scholar] [CrossRef] [Green Version]
  12. Campos-Ramos, A.; Aragón Piña, X.; Querol, A.A. Methodology for the characterization and identification by sem-eds of atmospheric particles from different pollutions emission. Microsc. Sci. Technol. Appl. Educ. 2010, 1, 329–333. [Google Scholar]
  13. Margiotta, S.; Lettino, A.; Speranza, A.; Summa, V. PM1 geochemical and mineralogical characterization using SEM-EDX to identify particle origin–Agri Valley pilot area (Basilicata, southern Italy). Nat. Hazards Earth Syst. Sci. 2015, 15, 1551–1561. [Google Scholar] [CrossRef] [Green Version]
  14. Pachauri, T.; Singla, V.; Satsangi, A.; Lakhani, A.; Maharaj Kumari, K. SEM-EDX characterization of individual coarse particles in Agra, India. Aerosol Air Qual. Res. 2013, 13, 523–536. [Google Scholar] [CrossRef]
  15. Widory, D.; Javoy, M. The carbon isotope composition of atmospheric CO2 in Paris. Earth Planet. Sci. Lett. 2003. [Google Scholar] [CrossRef]
  16. Rachwał, M.; Wawer, M.; Jabłońska, M.; Rogula-Kozłowska, W.; Rogula-Kopiec, P. Geochemical and Mineralogical Characteristics of Airborne Particulate Matter in Relation to Human Health Risk. Minerals 2020, 10, 866. [Google Scholar] [CrossRef]
  17. Górka, M.; Jędrysek, M.O. Mineralogical and oxygen isotope composition of inorganic dust-fall in Wrocław (SW Poland) urban area–test of a new monitoring tool. Geol. Q. 2011, 55, 71–80. [Google Scholar]
  18. Jiries, A.; El-Hasan, T.; Manasrah, W. Qualitative evaluation of the mineralogical and chemical composition of dry deposition in the central and southern highlands of Jordan. Chemosphere 2002. [Google Scholar] [CrossRef]
  19. Teper, E. Dust-particle migration around flotation tailings ponds: Pine needles as passive samplers. Environ. Monit. Assess. 2009. [Google Scholar] [CrossRef]
  20. Rybak, J.; Spówka, I.; Zwoździak, A.; Fortuna, M.; Trzepla-Nabagło, K. Evaluation Of The Usefulness Of Spider Webs As An Air Quality Monitoring Tool For Heavy Metals. Ecol. Chem. Eng. S 2015, 22, 389–400. [Google Scholar] [CrossRef] [Green Version]
  21. Górka, M.; Bartz, W.; Rybak, J. The mineralogical interpretation of particulate matter deposited on Agelenidae and Pholcidae spider webs in the city of Wrocław (SW Poland): A preliminary case study. J. Aerosol Sci. 2018. [Google Scholar] [CrossRef]
  22. Yalaltdinova, A.; Kim, J.; Baranovskaya, N.; Rikhvanov, L. Populus nigra L. as a bioindicator of atmospheric trace element pollution and potential toxic impacts on human and ecosystem. Ecol. Indic. 2018. [Google Scholar] [CrossRef]
  23. Alfani, A.; Maisto, G.; Iovieno, P.; Rutigliano, F.A.; Bartoli, G. Leaf contamination by atmospheric pollutants as assessed by elemental analysis of leaf tissue, leaf surface deposit and soil. J. Plant Physiol. 1996. [Google Scholar] [CrossRef]
  24. Tomasevic, M.; Anicic, M. Trace element content in urban tree leaves and SEM-EDAX characterization of deposited particles. Facta Univ. Ser. Phys. Chem. Technol. 2010. [Google Scholar] [CrossRef]
  25. Sgrigna, G.; Baldacchini, C.; Esposito, R.; Calandrelli, R.; Tiwary, A.; Calfapietra, C. Characterization of leaf-level particulate matter for an industrial city using electron microscopy and X-ray microanalysis. Sci. Total Environ. 2016. [Google Scholar] [CrossRef] [PubMed]
  26. Sgrigna, G.; Baldacchini, C.; Dreveck, S.; Cheng, Z.; Calfapietra, C. Relationships between air particulate matter capture efficiency and leaf traits in twelve tree species from an Italian urban-industrial environment. Sci. Total Environ. 2020. [Google Scholar] [CrossRef]
  27. Li, Y.; Wang, S.; Chen, Q. Potential of thirteen urban greening plants to capture particulate matter on leaf surfaces across three levels of ambient atmospheric pollution. Int. J. Environ. Res. Public Health 2019, 16, 402. [Google Scholar] [CrossRef] [Green Version]
  28. Barbeş, L.; Bărbulescu, A.; Rădulescu, C.; Stihi, C.; Chelarescu, E.D. Determination of heavy metals in leaves and bark of Populus Nigra L by atomic absorption spectrometry. Rom. Rep. Phys. 2014, 66, 877–886. [Google Scholar]
  29. Berlizov, A.N.; Blum, O.B.; Filby, R.H.; Malyuk, I.A.; Tryshyn, V.V. Testing applicability of black poplar (Populus nigra L.) bark to heavy metal air pollution monitoring in urban and industrial regions. Sci. Total Environ. 2007. [Google Scholar] [CrossRef] [PubMed]
  30. Djingova, R.; Ivanova, J.; Wagner, G.; Korhammer, S.; Markert, B. Distribution of lanthanoids, Be, Bi, Ga, Te, Tl, Th and U on the territory of Bulgaria using Populus nigra “Italica” as an indicator. Sci. Total Environ. 2001. [Google Scholar] [CrossRef]
  31. Jozwiak, M.A.; Jozwiak, M. Bioindication as challenge in modern environmental protection. Ecol. Chem. Eng. S 2015. [Google Scholar] [CrossRef] [Green Version]
  32. Worobiec, A.; Potgieter-Vermaak, S.; Brooker, A.; Darchuk, L.; Stefaniak, E.; Van Grieken, R. Interfaced SEM/EDX and micro-Raman Spectrometry for characterisation of heterogeneous environmental particles—Fundamental and practical challenges. Microchem. J. 2010. [Google Scholar] [CrossRef]
  33. Chae, Y.; An, Y.J. Current research trends on plastic pollution and ecological impacts on the soil ecosystem: A review. Environ. Pollut. 2018, 240, 387–395. [Google Scholar] [CrossRef]
  34. Drever, J.I.; Stillings, L.L. The role of organic acids in mineral weathering. Colloids Surf. A Physicochem. Eng. Asp. 1997, 120, 167–181. [Google Scholar] [CrossRef]
  35. Kodirov, O.; Shukurov, N. Heavy metal distribution in soils near the Almalyk mining and smelting industrial area, Uzbekistan. Acta Geol. Sin. 2009. [Google Scholar] [CrossRef]
  36. Shukurov, N.; Kodirov, O.; Peitzsch, M.; Kersten, M.; Pen-Mouratov, S.; Steinberger, Y. Coupling geochemical, mineralogical and microbiological approaches to assess the health of contaminated soil around the Almalyk mining and smelter complex, Uzbekistan. Sci. Total Environ. 2014. [Google Scholar] [CrossRef]
  37. Shukurov, N.; Pen-Mouratov, S.; Steinberger, Y. The impact of the Almalyk Industrial Complex on soil chemical and biological properties. Environ. Pollut. 2005. [Google Scholar] [CrossRef]
  38. U.S. Geological Survey. Mineral Commodity Summaries; U.S. Geological Survey: Reston, VA, USA, 2015.
  39. Campos-M., M.; Campos-C., R. Applications of quartering method in soils and foods. Int. J. Eng. Res. Appl. 2017. [Google Scholar] [CrossRef]
  40. Rubio, R.; Ure, A.M. Approaches to sampling and sample pretreatments for metal speclation in soils and sediments. Int. J. Environ. Anal. Chem. 1993. [Google Scholar] [CrossRef]
  41. Weerakkody, U.; Dover, J.W.; Mitchell, P.; Reiling, K. Particulate matter pollution capture by leaves of seventeen living wall species with special reference to rail-traffic at a metropolitan station. Urban For. Urban Green. 2017. [Google Scholar] [CrossRef]
  42. Merkus, H.G. Particle Size Measurements: Fundamentals, Practice, Quality; Springer Science & Business Media: New York, NY, USA, 2009. [Google Scholar]
  43. Roduit, N. JMicroVision: Un Logiciel D’analyse D’images Pétrographiques Polyvalent; Uiniversité de Genève: Geneva, Switzerland, 2007. [Google Scholar]
  44. Reed, S.J.B. Electron Microprobe Analysis and Scanning Electron Microscopy in Geology; Cambridge University Press: Cambridge, UK, 2005; ISBN 9780511610561. [Google Scholar]
  45. Deer, W.A.; Howie, R.A.; Zussman, J. An Introduction to the Rock-Forming Minerals; Mineralogical Association of Canada: Ottawa, ON, Canada, 2013. [Google Scholar]
  46. Brown, M.B.; Forsythe, A.B. Robust tests for the equality of variances. J. Am. Stat. Assoc. 1974. [Google Scholar] [CrossRef]
  47. Argaç, D. Testing for homogeneity in a general one-way classification with fixed effects: Power simulations and comparative study. Comput. Stat. Data Anal. 2004. [Google Scholar] [CrossRef]
  48. Zar, J. Biostatistical Analysis, 4th ed.; Prentice Hall: Englewood Cliffs, NJ, USA, 1999. [Google Scholar]
  49. Sokal, R.R.; Rohlf, F.J. Assumptions of analysis of variance. In Biometry: The Principles and Practice of Statistics in Biological Research; W.H. Freeman and Company: New York, NY, USA, 1995; ISBN 0716724111. [Google Scholar]
  50. Dell Inc. Dell Statistica (Data Analysis Software System) Version 13 Software; Dell Inc.: Round Rock, TX, USA, 2015. [Google Scholar]
  51. Beckett, K.P.; Freer-Smith, P.H.; Taylor, G. Particulate pollution capture by urban trees: Effect of species and windspeed. Glob. Chang. Biol. 2000. [Google Scholar] [CrossRef]
  52. Di Palma, A.; Capozzi, F.; Spagnuolo, V.; Giordano, S.; Adamo, P. Atmospheric particulate matter intercepted by moss-bags: Relations to moss trace element uptake and land use. Chemosphere 2017. [Google Scholar] [CrossRef] [PubMed]
  53. Keane, B.; Collier, M.H.; Shann, J.R.; Rogstad, S.H. Metal content of dandelion (Taraxacum officinale) leaves in relation to soil contamination and airborne particulate matter. Sci. Total Environ. 2001. [Google Scholar] [CrossRef]
  54. Chen, L.C.; Lippmann, M. Effects of metals within ambient air particulate matter (PM) on human health. Inhal. Toxicol. 2009, 21, 1–31. [Google Scholar] [CrossRef]
  55. Wuana, R.A.; Okieimen, F.E. Heavy Metals in Contaminated Soils: A Review of Sources, Chemistry, Risks and Best Available Strategies for Remediation. ISRN Ecol. 2011. [Google Scholar] [CrossRef] [Green Version]
  56. Ettler, V. Soil contamination near non-ferrous metal smelters: A review. Appl. Geochem. 2015, 64, 56–74. [Google Scholar] [CrossRef] [Green Version]
  57. U.S. Environmental Protection Agency (EPA). Regional Screening Levels; U.S. Environmental Protection Agency: Washington, DC, USA, 2015.
  58. The World Copper Factbook. The International Copper Study Group (ICSG); The World Copper Factbook: Lisbon, Protugal, 2019. [Google Scholar]
  59. Kampa, M.; Castanas, E. Human health effects of air pollution. Environ. Pollut. 2008, 151, 362–367. [Google Scholar] [CrossRef]
  60. Edwards, D.A. Delivery of biological agents by aerosols. AIChE J. 2002, 48, 2–6. [Google Scholar] [CrossRef]
  61. Larhrib, H.; Okpala, J. Drug Delivery Particles and Methods of Treating Particles to Improve their Drug Delivery Capabilities. U.S. Patent 20060057213A1, 16 March 2006. [Google Scholar]
Figure 1. Localization of Populus nigra leaves (No. 1–9) and soil (G1–G3) sampling points in Olmaliq (Uzbekistan).
Atmosphere 11 01126 g001
Figure 2. BSE image of P. nigra leaves taken from site 3 and representative energy-dispersive X-ray spectroscopy (EDX) spectra. Spectrum 1—calcite; spectrum 2—calcium sulphates with P (phospho-gypsum); spectrum 3—iron oxide; spectrum 4—relict of primary phosphorite phase (probably apatite); spectrum 5—calcium sulphate (gypsum/anhydrite); spectrum 6—iron oxide with Zn.
Atmosphere 11 01126 g002
Figure 3. Back-scattered electrons (BSE) image of P. nigra leaves taken from site 16 and representative EDX spectra. Spectrum 1—silica (quartz); spectrum 2—Ca/P/K spherule; spectrum 3—alkali feldspar (illitized); spectrum 4—iron oxide; spectrum 5—silicate slag/ash; spectrum 6—Cu-Fe sulfide.
Atmosphere 11 01126 g003
Figure 4. BSE image of P. nigra leaves taken from site 14 and representative EDX spectra. Spectrum 1—alkali feldspar; spectrum 2—silica (quartz); spectrum 3—illite; spectrum 4—silicate slag/ash with Zn; spectrum 5—silica (quartz); spectrum 6—sodium feldspar.
Atmosphere 11 01126 g004
Figure 5. Mineralogical phases reported for particles deposited on Populus nigra italica leaves and soils collected in August 2018 in the vicinity of Olmaliq city.
Atmosphere 11 01126 g005
Figure 6. Spatial distribution of atmospheric particles of inorganic anthropogenic origin deposited on Populus nigra Italica leaves collected in August 2018 in the vicinity of Olmaliq city. Percentage contribution of anthropogenic origin particles: (A) below 2.5 µm; (B) between 2.5 and 10 µm, and (C) above 10 µm. The bright colors presented in the drawn rectangle area are covered with sampling points/data, whereas the bleached area outside the rectangle shows extrapolated data only.
Atmosphere 11 01126 g006
Figure 7. Element distribution map (scanning electron microscopy–energy-dispersive X-ray spectroscopy, SEM-EDX) of soil taken from sampling point G1 in August 2018 in the vicinity of Olmaliq city.
Atmosphere 11 01126 g007
Figure 8. Metal concentrations in analyzed soil samples (G1–G3) collected in August 2018 in the vicinity of Olmaliq city. Dotted lines indicate the legislation limit (EPA) of elements in soils at industrial sites.
Atmosphere 11 01126 g008
Figure 9. Frequency of occurrence of individual metals in studied inorganic atmospheric particles.
Atmosphere 11 01126 g009
Table 1. Mean and standard deviation (SD) of contribution atmospheric particles (%) adsorbed on P. nigra leaves from three groups: 1 industry/smelters, 2 urban, 3 industry/quarry sites. N = 9; probability level (P) for homogeneity of variance in ANOVA and for post hoc test between groups.
GroupAnthropogenic Particles < 2.5 µm Mean ± SDAnthropogenic Particles 2.5–10 µm Mean ± SDAnthropogenic Particles > 10 µm Mean ± SDPost hoc HSD–Tukey Test Anth. Part. < 2.5 µm p < 0.05
Group 1Group 2
Group 1 (industry)91.5 ± 6.378.5 ± 8.173.0 ± 12.4
Group 2 (urban)65.0 ± 6.058.5 ± 7.547.0 ± 18.00.0099
Group 3 (quarry)49.0 ± 0.044.0 ± 0.042.0 ± 0.00.00390.2439
Table 2. Spearman’s correlation coefficient ρ of the percentage contribution of anthropogenic mineralogical phases between analyzed soils (G1, G2, G3) and related atmospheric particle sites (Nos. 1, 3, 6); (N = 12); the significant correlations (p < 0.05) are marked by bold font.
SampleSoil Sample G1Sample 1 <2.5 µmSample 1 2.5–10 µmSample 1 >10 µmSoil Sample G2Sample 3 <2.5 µmSample 3 2.5–10 µmSample 3 >10 µmSoil Sample G2Sample 6 <2.5 µmSample 6 2.5–10 µm
Sample 1 <2.5 µm0.143
Sample 1 2.5–10 µm−0.0620.758
Sample 1 >10 µm0.0550.6350.740
Soil sample G20.7620.1090.202−0.030
Sample 3 <2.5 µm−0.3880.3240.3620.499−0.481
Sample 3 2.5–10 µm0.3150.6130.7060.7470.1980.458
Sample 3 >10 µm0.1220.3530.5160.5150.0820.3260.729
Soil sample G30.8450.0850.080−0.0920.899−0.3550.2600.090
Sample 6 <2.5 µm−0.3510.6080.5410.607−0.4170.9100.5120.413−0.357
Sample 6 2.5–10 µm−0.0830.6560.6170.734−0.2210.6720.6800.574−0.2230.846
Sample 6 >10 µm0.0140.5470.6090.839−0.1370.7740.8340.491−0.0760.7700.812
Publisher’s Note: MDPI stays neutral with regard to jurisdictional claims in published maps and institutional affiliations.

