Article

Differentiation of the Athens Fine PM Profile during Economic Recession (March of 2008 Versus March of 2013): Impact of Changes in Anthropogenic Emissions and the Associated Health Effect

by
Styliani Pateraki
1,*,
Kyriaki-Maria Fameli
1,
Vasiliki Assimakopoulos
1,
Kyriaki Bairachtari
2,
Alexandros Zagkos
3,
Theodora Stavraka
4,
Aikaterini Bougiatioti
1,
Thomas Maggos
2 and
Nikolaos Mihalopoulos
1,5
1
Institute for Environmental Research and Sustainable Development, National Observatory of Athens, 152 36 Athens, Greece
2
Environmental Research Laboratory/ INT-RP, National Centre for Scientific Research Demokritos, 153 10 Athens, Greece
3
Department of Applied Physics, Faculty of Physics, University of Athens, 157 84 Athens, Greece
4
Center for Environmental Effects on Health, Biomedical Research Foundation of Academy of Athens, 106 80 Athens, Greece
5
Environmental Chemical Processes Laboratory, Chemistry Department, University of Crete, 700 13 Heraklion, Greece
*
Author to whom correspondence should be addressed.
Atmosphere 2020, 11(10), 1121; https://doi.org/10.3390/atmos11101121
Submission received: 31 August 2020 / Revised: 23 September 2020 / Accepted: 14 October 2020 / Published: 19 October 2020
(This article belongs to the Special Issue Sources and Composition of Ambient Particulate Matter)

Abstract

:
Despite the various reduction policies that have been implemented across Europe in the past few years, Particulate Matter (PM) exceedances continue to be recorded. Therefore, with the principal aim to clarify the complex association between emissions and fine particles levels, this work evaluates the impact of the anthropogenic contribution to the fine PM chemical profile. The fieldwork was conducted during March in 2008 and 2013 and covers the periods before and during the economic recession. The experimental data were analyzed in parallel with the emissions from the Flexible Emission Inventory for Greece and the Greater Athens Area (FEI-GREGAA). The differentiation of the mass closure results’ and the aerosols’ character is also discussed in combination with the calculated PM2.5-Air Quality Indexes. The peak in the PM load and the Particulate Organic Matter (POM) component was recorded in 2013, corresponding to the enhancement of the anthropogenic input. Although the monitoring location is traffic-impacted, the sector of heating, from both wood burning and fossil fuel, proved to be the driving force for the configuration of the obtained PM picture. Especially in 2013, its contribution was two times that of traffic. Finally, the low wind speed values led to the deterioration of the air quality, especially for the sensitive groups.

Graphical Abstract

1. Introduction

In Europe, atmospheric pollution is responsible for more than 400,000 premature deaths a year, with the largest share to the exposure of fine particulate matter (PM2.5, PM1) [1]. Fine particles have increased potential health risk being compared to the one of coarse particles, for many reasons: (i) they penetrate deeper in the lung (ii) they can penetrate more readily into indoor environments (iii) they have longer periods of suspension (iv) they may be transported over long distances (v) they carry higher concentrations of toxic compounds and (vi) they can absorb larger amounts of semi-volatile compounds [2].
The Particulate Matter (PM) control is a challenging problem, especially in urban areas where large populations are exposed to increased concentration levels [3]. They have simultaneous primary and secondary sources [4] and their toxicity is highly depended on their chemical composition which in turn is linked to the emission sources, the atmospheric chemical processes, and the long range transport effects [5]. Therefore, the parallel knowledge of the temporal evolution of (i) their profile, (ii) their emission sources and (iii) their potential health risk is very important for the health protection and the set-up of effective policy strategies. In the case of fine particles, various experimental and modeling studies have been conducted all over the world investigating the change, for at least a four years’ period, of the PM2.5 mass [6,7,8,9,10] and/or its chemical composition [11,12,13]. Jiang et al. [14] and Zhang et al. [15], using a combined field and numerical modeling approach, gave insight on the differentiation of the PM2.5 mass in connection with its health consequences for a 6 and 4 years’ period, respectively. However, the works assessing the effect of the emissions to the obtained chemical PM profile, during several years’ period, by combining experimental and emissions data are scarce [16,17]. To the best of our knowledge, information regarding the evolution of the PM1 fraction over time in conjunction with emission inventories does not exist at all even if this fraction is considered as a better indicator of the anthropogenic sources [2,4,18].
Based on the above, the principal aim of this study is to assess the changes that have occurred, in the Athenian PM2.5 and PM1 levels and their chemical profile due to the different apportionment of the anthropogenic sources. The information concerns the changes that have taken place within an urban location of the Athens Basin between the years 2008 and 2013. The specific years were selected owing to their distinct characteristics. 2008 marks the beginning of the Greek economic crisis. Consequently, the effects of the decline of the economy on the everyday life had not yet been recorded. On the other hand, 2013 is within the economic recession with well-defined impacts of the crisis on emission inventories [19]. The fieldwork took place in March, an intermediate month of the year with contributions from the two significant anthropogenic contributors of the PM levels, traffic and residential heating [19,20,21]. The specific sectors are strongly associated with the changes that occur in everyday life. Therefore, with the principal aim of this work to uncover the impact of the changes of the local input to the obtained PM chemical, the data analysis is focused on the days that do not favor the dispersion of the air pollutants (ws < 2.5 m/s; [22]). Besides the analysis of the carbonaceous and ionic PM2.5 and PM1 contents (mass closure, ionic balance), the results are compared with the emissions for the two mentioned sectors from the FEI-GREGAA emission inventory, the most updated emission inventory for the Greater Athens Area (GAA; [19]). Additionally, the differentiation of the potential health impact of the PM2.5 levels and its dependence on the prevailing (compositional, emissions, wind) conditions is also discussed.

2. Materials and Methods
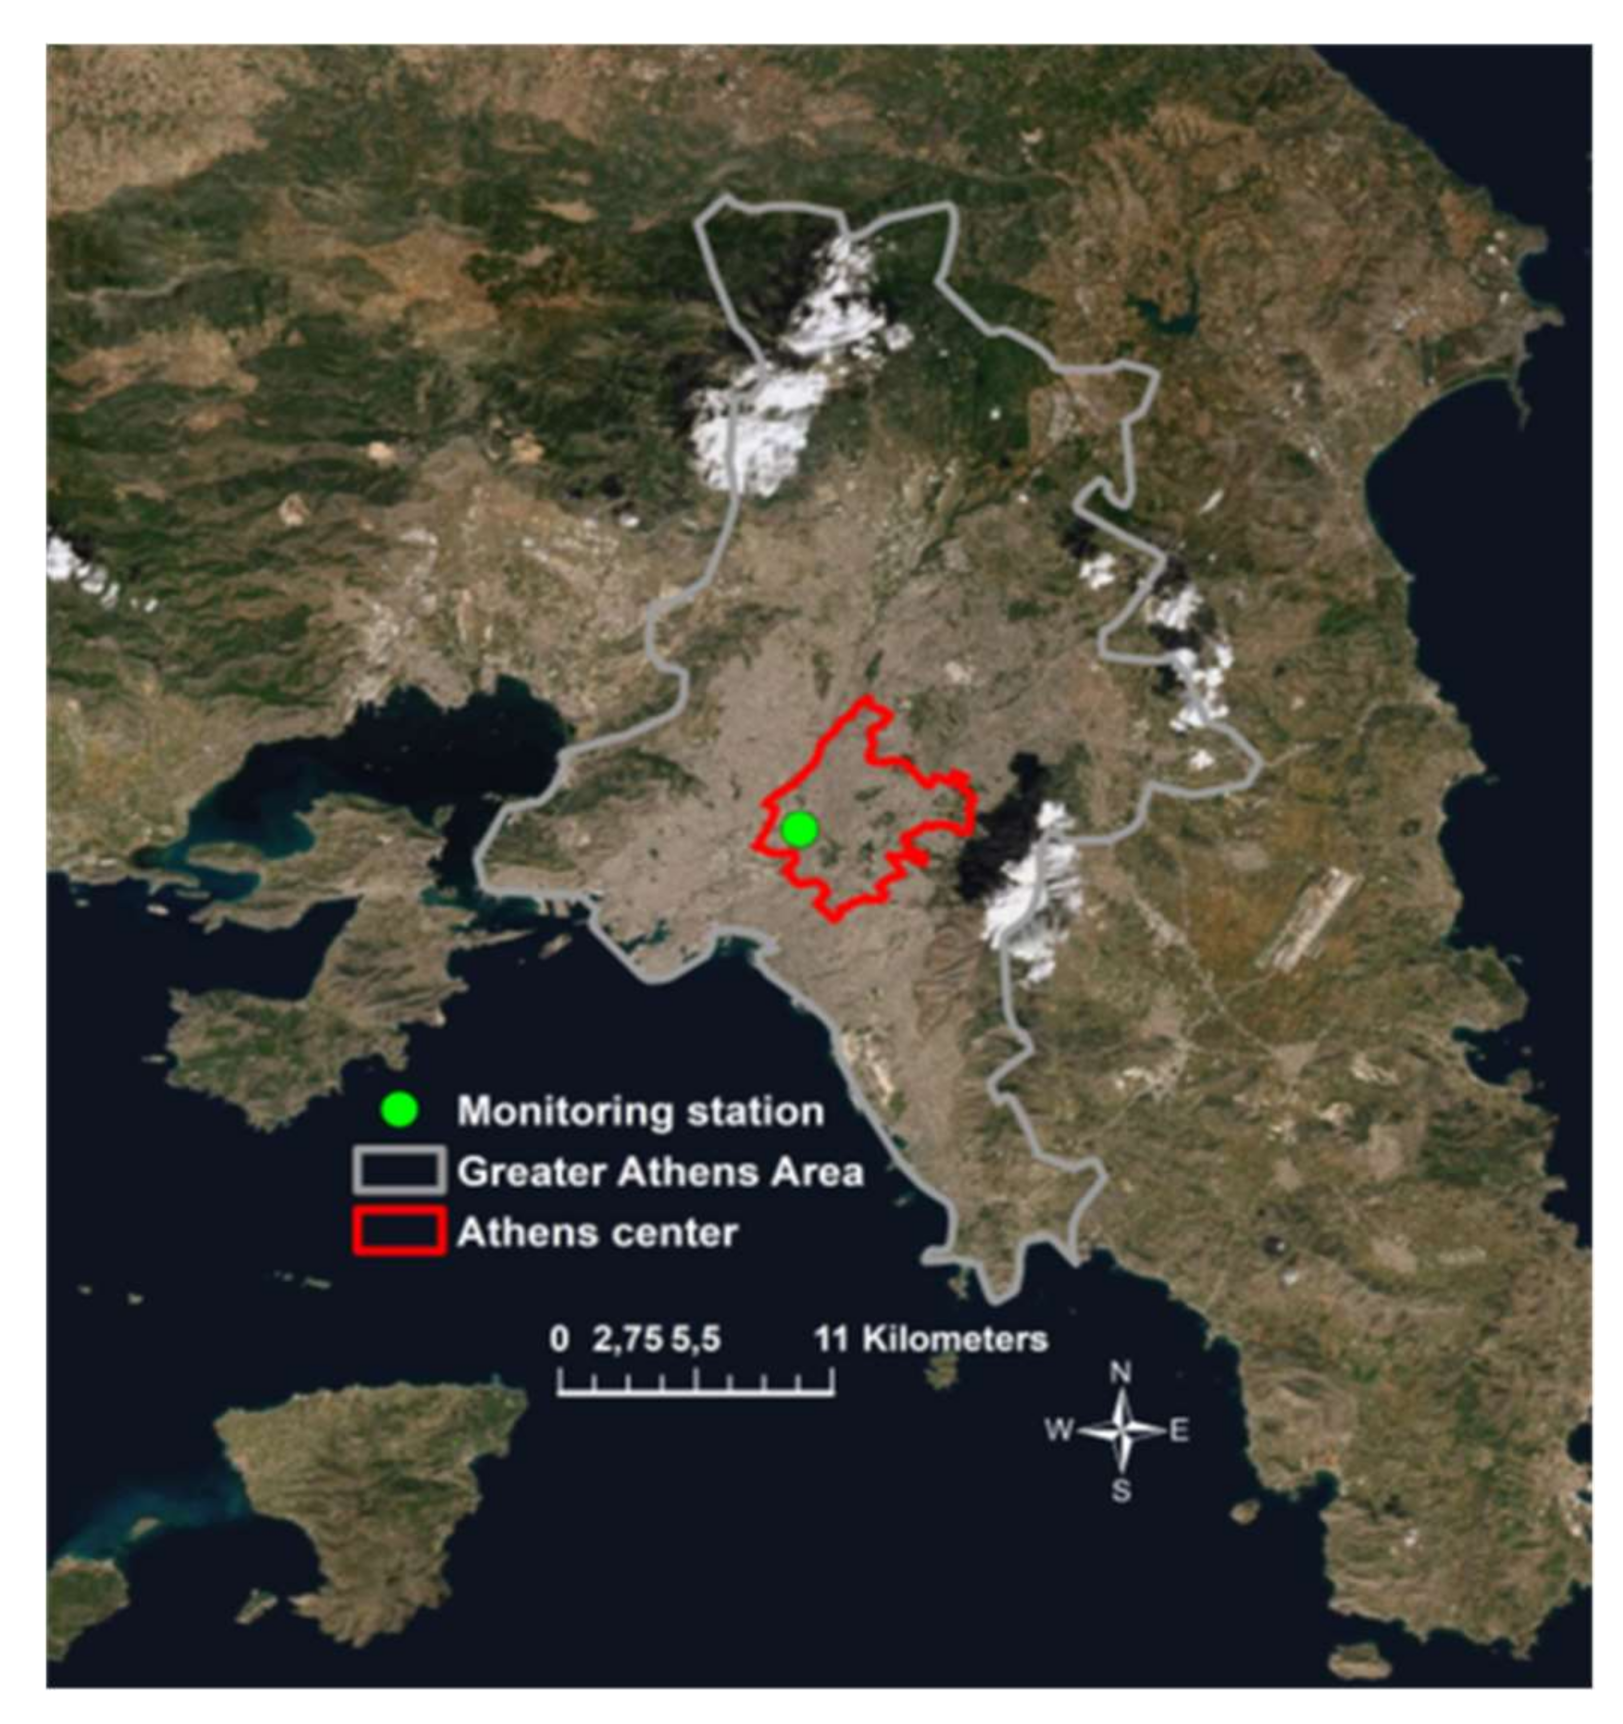
2.1. Field Campaign

The monitoring was performed at a suburban site, very close to the Athens center and five of the city’s main traffic avenues (Figure 1).
As a part of this study, a total of 40 and 50 PM samples were collected during March 2008 and 2013, respectively, by following the same methodology [23,24,25]. Two low-volume, controlled flow rate (2.3 m3/h) samplers were used simultaneously, during each sampling period, collecting particles on quartz filters with diameter of 47 and 50 mm. The filters were pre-baked before the use at 550 °C in order to reduce residual carbon levels associated with them while they were conditioned, in a weighing room under controlled temperature (20 ± 1 °C) and relative humidity (50 ± 5%) conditions. Daily sampling periods lasted 24 h (08:00 a.m.–08:00 p.m.) covering both the weekdays and the weekends. The determination of the concentration of the particle mass was conducted gravimetrically using an electronic microbalance with a resolution of 1 μg according to the European Standard EN 12341 [26]. The collected PM samples were chemically analyzed for their carbonaceous (Organic Carbon (OC), Elemental Carbon (EC)) and ionic components (Cl, NO3, SO42−, NH4+, K+, Mg2+, Ca2+). The chemical analysis for the period of 2008 was conducted at the Environmental Chemical Processes Laboratory of the University of Crete while for 2013, the Environmental Research Laboratory of the National Center of Scientific Research Demokritos has the responsibility. The water-soluble ions were detected using suppressed ion chromatography while the carbonaceous constituents were determined with the use of a carbon analyzer (Sunset Lab, Oregon, United States of America (USA); [18,26]). Note that at least for carbonaceous material (OC, EC) both laboratories participate to frequent inter-comparisons organized by the European Research Infrastructure for the observation of Aerosol, Clouds and Trace Gases (ACTRIS) network by using same procedure and with similar results.
With the principal aim to investigate the impact of the change of the share of the anthropogenic activities to the obtained fine PM chemical profile, the specific work focused on the two main sources of particulate pollution across the Greater Athens Area, the residential heating and the traffic. March was selected as a month with an intermediate contribution from both sectors. As it is well known, March belongs to the transition period and is characterized by intense dust intrusion from the Sahara Desert, a usual phenomenon for the Mediterranean basin [27,28]. Therefore, in order to focus on the impact of the local anthropogenic emissions and limit as much as possible the long range transport effects, only the days that were characterized by low wind speed conditions (ws ≤ 2.5 m/s) were taken into consideration. As it has been proven by Fourtziou et al. [22] and Liakakou et al. [29], wind values lower than 3 m/s favor the accumulation of the air pollutants within the mixing layer. Moreover, low winds trap the pollutants near their source and they provide sufficient time for the chemical reaction to form the secondary aerosols/constituents [12]. In March 2008, in 78.6% of the sampling days, the wind speed ranged between 1.40 m/s and 2.50 m/s while in the same month of 2013 it varied from 0.36 m/s to 2.38 m/s (90.3% of the sampling days).

2.2. Data Analysis

2.2.1. Mass Closure

For the purpose of mass closure, the detected chemical components were divided into five classes as follows: Elemental Carbon (EC), Particulate Organic Matter (POM; OC*1.6 (conversion factor for urban aerosols [30]), Secondary Inorganic aerosols (SIAs; sum of NO3, NH4+ and non-sea salt sulfates (nssSO42−)), Sea Salt (SS; sum of Na+, Cl, ssK+, ssMg2+, ssCa2+ and ssSO42−) and Unidentified Material (UM; the difference between the gravimetrically measured aerosol mass and the reconstructed one (the sum of quantified chemical components)). More details about the procedure that was followed are given in Pateraki et al. [31].
As it has previously been mentioned (Section 2.1), the days with wind speed values higher than 2.5 m/s have been excluded from the data analysis. During the March of 2008, the chemical compounds measured during this work explained in a range between 61% to 94% and 65% and 84% for PM2.5 and PM1 mass, respectively. As far as the March of 2013 is concerned, the rates of the reconstructed mass varied from 66% to 88% and from 65% to 95% for PM2.5 and PM1, respectively. The aerosol-bound water, the undetected chemical components like oxygen, minerals and trace elements, the volatilization losses, the errors that affect the mass and chemical measurements as well as the uncertainty of the conversion of OC to POM could account for the UM Pateraki et al. [31].

2.2.2. Emissions

Concerning FEI-GREGAA [19], the methodology proposed by the Environmental Monitoring, Evaluation and Protection/Environmental Protection Agency (EMEP/EAA) Emission Inventory Guidebook 2016 was followed. More specifically, for the road transport and small combustion sectors the Tier 3 and Tier 2 approaches were used for the calculation of the annual emissions for the Attica region. For the road transport sector PM2.5, PM10, OM and EC emissions were calculated while for the small combustion sector PM2.5, PM10 and BC emissions were produced. The respective energy consumption per fuel type for space heating was provided by the Odyssee-Mure project [32]. The annual values were afterwards spatially and temporarily disaggregated into gridded form and daily. The detailed methodology is described for both sectors in Fameli and Assimakopoulos [19] and [33]. It should be mentioned that for the road transport emissions local temporal coefficients, representative of the traffic counts profiles for the years 2008 and 2013, were used. As a result, different road emissions were calculated for each day of March 2008 and 2013. However, for the temporal allocation of residential heating emissions monthly and daily coefficients were used, provided by the TNO database [34], which were updated in order to correspond to the Greek temporal activity profiles. Moreover, for the needs of comparison with the measurements, the daily gridded emissions were supposed to represent a 1m cell height.

2.2.3. Health Risk

The Air Quality Index (AQI) of the US Environmental Protection Agency (US EPA) is a widely used index which gives details about the daily air quality status [35]. In the present work, with the principal aim to investigate the possible relationship between the configured PM burden (mass, chemical composition) and the corresponding health effects, the USEPA Air Quality Index (AQI) for PM2.5 was applied. Details about the specific methodology, the breakpoints for the PM2.5 concentrations, the ranges of the PM2.5-AQI categories and the possible health consequences are given in EPA 1999, [36] and Gorai et al. [35]. Dimitriou et al. [37] found that AQI in Athens is mainly affected by PM (by 72%) and only 28% by ozone with the contribution of other pollutants being negligible.
Finally, taking into consideration the extra adverse health effects of the acidic nature of fine particles [26,38] the differentiation of the aerosols’ character between March of 2008 and 2013 was investigated performing the ionic balance. The ionic balance is expressed by the ratio of the equivalent cation sum (sum of NH4+, K+, Na+, Mg2+, Ca2+ in neq/m3) to the equivalent anion sum (sum of Cl, NO3, SO42−, in neq/m3). Details about the procedure are given in Pateraki et al. [26] and [31].

3. Results and Discussion

3.1. Data Overview

A statistical summary of the primary PM2.5 and PM1 data (mass concentrations, chemical composition) is given on the Table S1.
The differentiation of the average obtained PM mass closure profile between the periods 2008 and 2013 is presented in Figure 2. Probably reflecting the changes in the prevailing emission sources, the PM burden appeared to be increased during March of 2013 compared to 2008. PM2.5 was higher by 85% while in the case of PM1 the rise was up to 29% compared to 2008. On a daily basis, the PM2.5 concentrations reached 37.7 and 80.4 μg/m3 in 2008 and 2013, respectively while the corresponding PM1 peaks were 29.7 and 54.9 μg/m3. Interestingly enough, the PM1/PM2.5 ratio in 2008 ranged between 0.73 and 0.97 while in 2013 it varied from 0.33 to 0.76. According to the findings, PM2.5 in 2008 was mainly composed of PM1 and influenced mainly by combustion and/or secondary sources. On the contrary, in 2013 the participation rate of PM1 in the PM2.5 mass was decreased indicating that the input from the natural sources and mechanical processes (e.g dust resuspension) was significant as well [39].
In full agreement with the literature [2,31,40,41,42], the particles were mainly composed by carbonaceous material signifying the importance of the anthropogenic activities. Therefore, POM was the main constituent of the particles’ mass being followed by SIA (PM2.5: POM > SIA > UM > EC > SS, PM1: POM > SIA ≈ UM > EC > SS). The more pronounced change between the two periods occurred for POM; its contribution was 7% and 5% higher in 2013 compared to 2008, for PM2.5 and PM1, respectively (in terms of mass is almost 59% and 37%, respectively). It is worth noting the different behavior of the other carbonaceous component, the EC. Its contribution to the PM2.5 and PM1 mass appeared to be decreased in 2013, at about 5% and 2%, respectively (in terms of mass is almost 11% and 15%, respectively). The different nature of the two carbonaceous constituents might be the explanation. EC is a primary pollutant formed during combustion of various fuels (coal, wood, fuel oil and motor fuel, especially diesel) whereas POM is a complex mixture composed of a primary (combustion derived) and a secondary material [43,44,45,46]. Therefore, the higher values of the POM/EC ratio in 2013, taking into consideration the previously mentioned lower EC levels, denote the decrease of the traffic input and the enhancement of the contribution from the heating sector. This temporal change was more evident for PM2.5 (2008: 3.02 and 3.82 as well as 2013: 8.12 and 7.02 for PM2.5 and PM1, respectively). The hypothesis of the enhancement of the emissions from the residential heating due to the intense use of biomass burning during 2013 is further supported by the calculation of the OC/EC and K+/EC ratios. The average OC/EC ratio was 1.98 and 2.56 in 2008 while in 2013 it was 4.68 and 4.27 for PM2.5 and PM1, respectively ([47]; coal combustion (0.3–7.6), vehicle emission (0.7–2.4), biomass burning (4.1–14.5)). In the case of the K+/EC ratio, its average values were 0.15 and 0.16 in 2008 as well as 0.24 and 0.24 in 2013 for PM2.5 and PM1, respectively ([47]; biomass burning (0.2–0.5) and fossil fuel combustion (0.03–0.09)).

3.2. Influence of the Emissions

According to the data produced by FEI-GREGAA [19], the total PM2.5 emissions, from both the traffic and the heating sector, were higher in March 2013 (Figure 3a). In general, the increasing trend of the produced emissions, is in compliance with the experimental data, highlighting the enhancement of the anthropogenic contribution to the configured PM burden. The diverse rates of differentiation between the experimental and the emissions data are due to the consideration of the input only from the domestic and the traffic sector in the emission inventory.
Analyzing further the emissions’ data, oil consumption for space heating decreased from 2008 to 2013 by 62.3% while wood consumption increased by 23%. As for the energy consumption by road transport, in Greece the majority of passenger cars use gasoline as fuel type. The gasoline consumption for the year 2008 was 4,046,516 metric tonnes and 1,453,481 metric tonnes in Greece and Attica respectively while for the year 2013 the respective consumption was 2,669,964 metric tonnes and 1,014,515 metric tonnes. The percentage decrease was 34.02% for Greece and 30.20% for Attica reflecting the impact of the economic crisis. In an attempt to analyze better the change on the share of the sources’ contribution, the PM10, EC and OM emissions are used where possible, from the two sectors. PM10, even with a less evident differentiation (8%), presented the same behavior. As far as the traffic related carbonaceous input is concerned, EC was almost similar between the two years (+0.5% higher in 2013) while OM was lower in 2013 by about 7%.
Since the emissions of the residential heating were higher than those of traffic, it seemed that the specific sector drove the changes to the configuration of the PM burden (Figure 3b,c). The corresponding input was almost 7 and 8 times higher for PM10 and PM2.5 in 2008, and at about 6 and 7 times for PM10 and PM2.5 respectively in 2013. This is due to the fact that particle emissions from residential heating are highly dependent on the fuel type and the technology of the combustion installation. They are related to the biomass burning from fireplaces and stoves to which higher emission factors are attributed compared to the oil used by boilers [19]. Moreover, the decrease of the residential heating/traffic ratio from 2008 to 2013 is associated with the increase of the percentage contribution of the Heavy Duty Trucks (HDT) to traffic PM emissions. Based on the emissions data, HDT are the main contributor to the Athenian PM emissions. Approximately 36% and 42% of PM10 and PM2.5 emissions originated from HDT in 2008 while the relevant percentages in 2013, were 39% and 46%. Even though the engine technology of passenger cars has improved and the withdrawal ratio of older passenger cars increased from 2008 to 2013 this was not the case for trucks the fleet of which remained rather stable during the above period (almost 53,000 HDT in 2008 and 52,000 in 2013). In 2013, it is worthy to note, the almost double EC input from the domestic heating than the one from traffic as well as the small decrease of the POM contribution from the traffic sector (7%).

3.3. Health Impact of the Aerosol Levels

The calculated PM2.5 EPA-indexes, the frequency of occurrence of the corresponding PM2.5-AQI health categories as well as the frequency of prevalence of the acidic PM nature during the two sampling periods are summarized in Figure 4.
The increasing trend of the AQIs from March, 2008, to March, 2013 Figure 4a (the blue and red dots are the values of the average AQI on March 2008 and March 2013, respectively), indicates the deterioration of the air quality within the GAA with time. For both periods, the “moderate pollution” days (People who are unusually sensitive to ozone or particle pollution may experience respiratory symptoms; [36]) was the category more often met with its frequency of occurrence reaching the 96% in 2008 and the 59% in 2013 (Figure 4a; the blue and red columns respectively).
In connection with the results of the ionic balance, for both fine PM fractions, the average cation/anion equivalent ratios were lower than unity indicating that the particles were acidic (2008: 0.74 and 0.63, 2013: 0.79 and 0.49 for PM2.5 and PM1, respectively). The frequency of prevalence of the acidic PM character is depicted in Figure 4b. The finding is consistent with other published works for the Mediterranean region [13,31]. Moreover, when the total cation equivalents were plotted against the total anion equivalents, the slope of the regression line was, in all the cases, lower than unity (Figure S1). The cation deficit (excess of anions) is commonly attributed to H+ which was not measured using the ion chromatography and is mainly associated with nssSO42− (Figure S2). In general, high levels of secondary inorganic ions are indicated to enhance the acidity of particles [48,49].
In an attempt to determine the key parameters for the potential health risk of the airborne particles, the average compositional characteristics of the configured PM profile were associated with the obtained PM2.5-AQI categories of the EPA and the prevailing wind speed/ temperature values. The results are summarized in Table S2. According to the data analysis, the lower the wind speed value, the more ‘polluted’ the investigated atmosphere is. The monitoring location was less polluted (‘good days’ category; Air quality is satisfactory and poses little or no health risk; [36]) when the average values of the wind speed and the temperature were 2.00 m/s and 15.2 °C, respectively while compositionally, the rates of the contribution of the total carbonaceous component to the PM2.5 mass varied from 26% to 30%. On the contrary, when the wind velocity and the temperature varied between lower values (0.36–0.39 m/s and 12.6–13.5 °C) and the contribution of the total carbonaceous content was enhanced (42–62%) the PM2.5 status led to more serious health problems (‘unhealthy days’ category; Members of sensitive groups may experience more serious health effects; [36]).

4. Conclusions

The specific work makes an attempt to elucidate the temporal evolution of the PM chemical profile owing to the change of the share of the anthropogenic input during the economic recession period. Measurements took place both in 2008; a year landmark for the global economic crisis and in 2013; five years within the economic recession.
The main conclusions from the parallel analysis of the experimental and FEI-GREGAA emissions data can be summarized as follows:
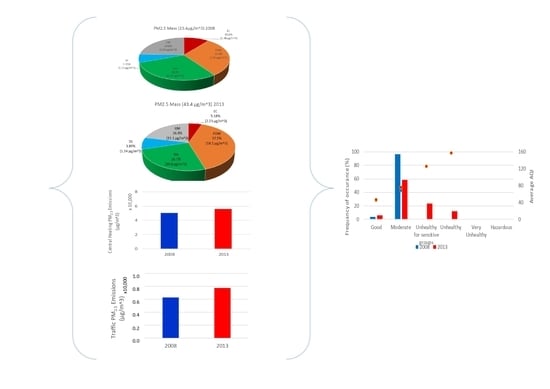
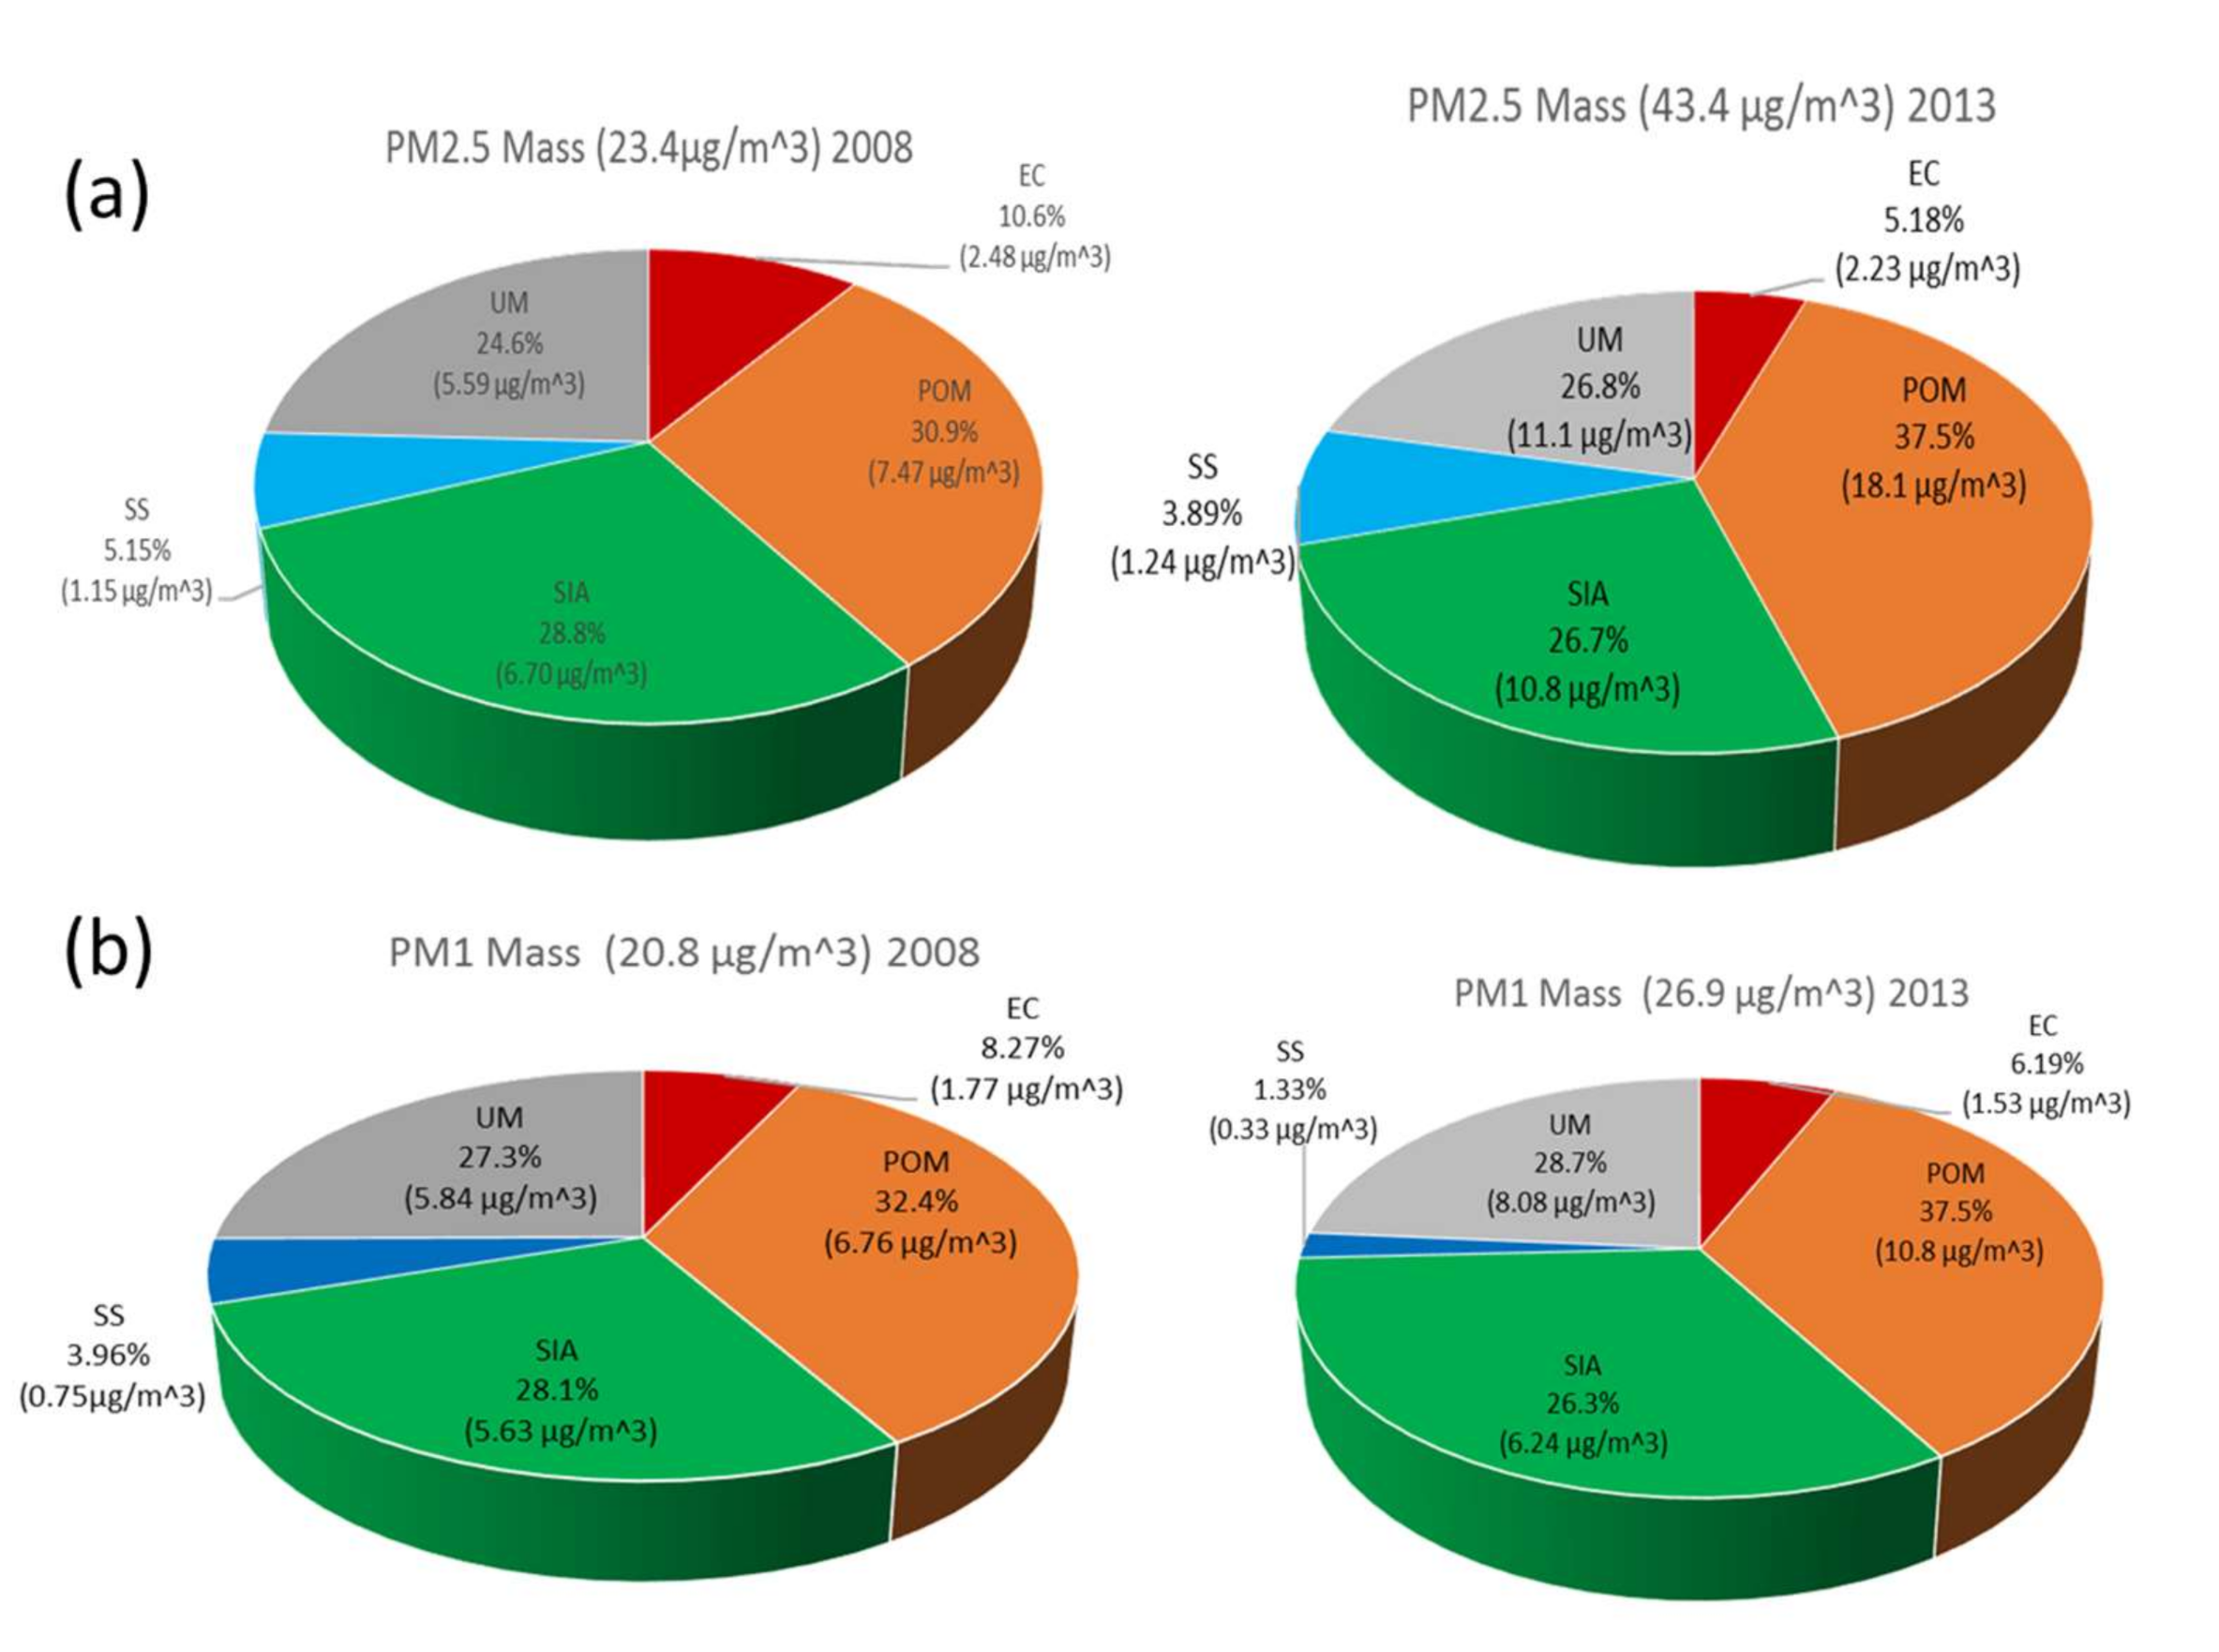
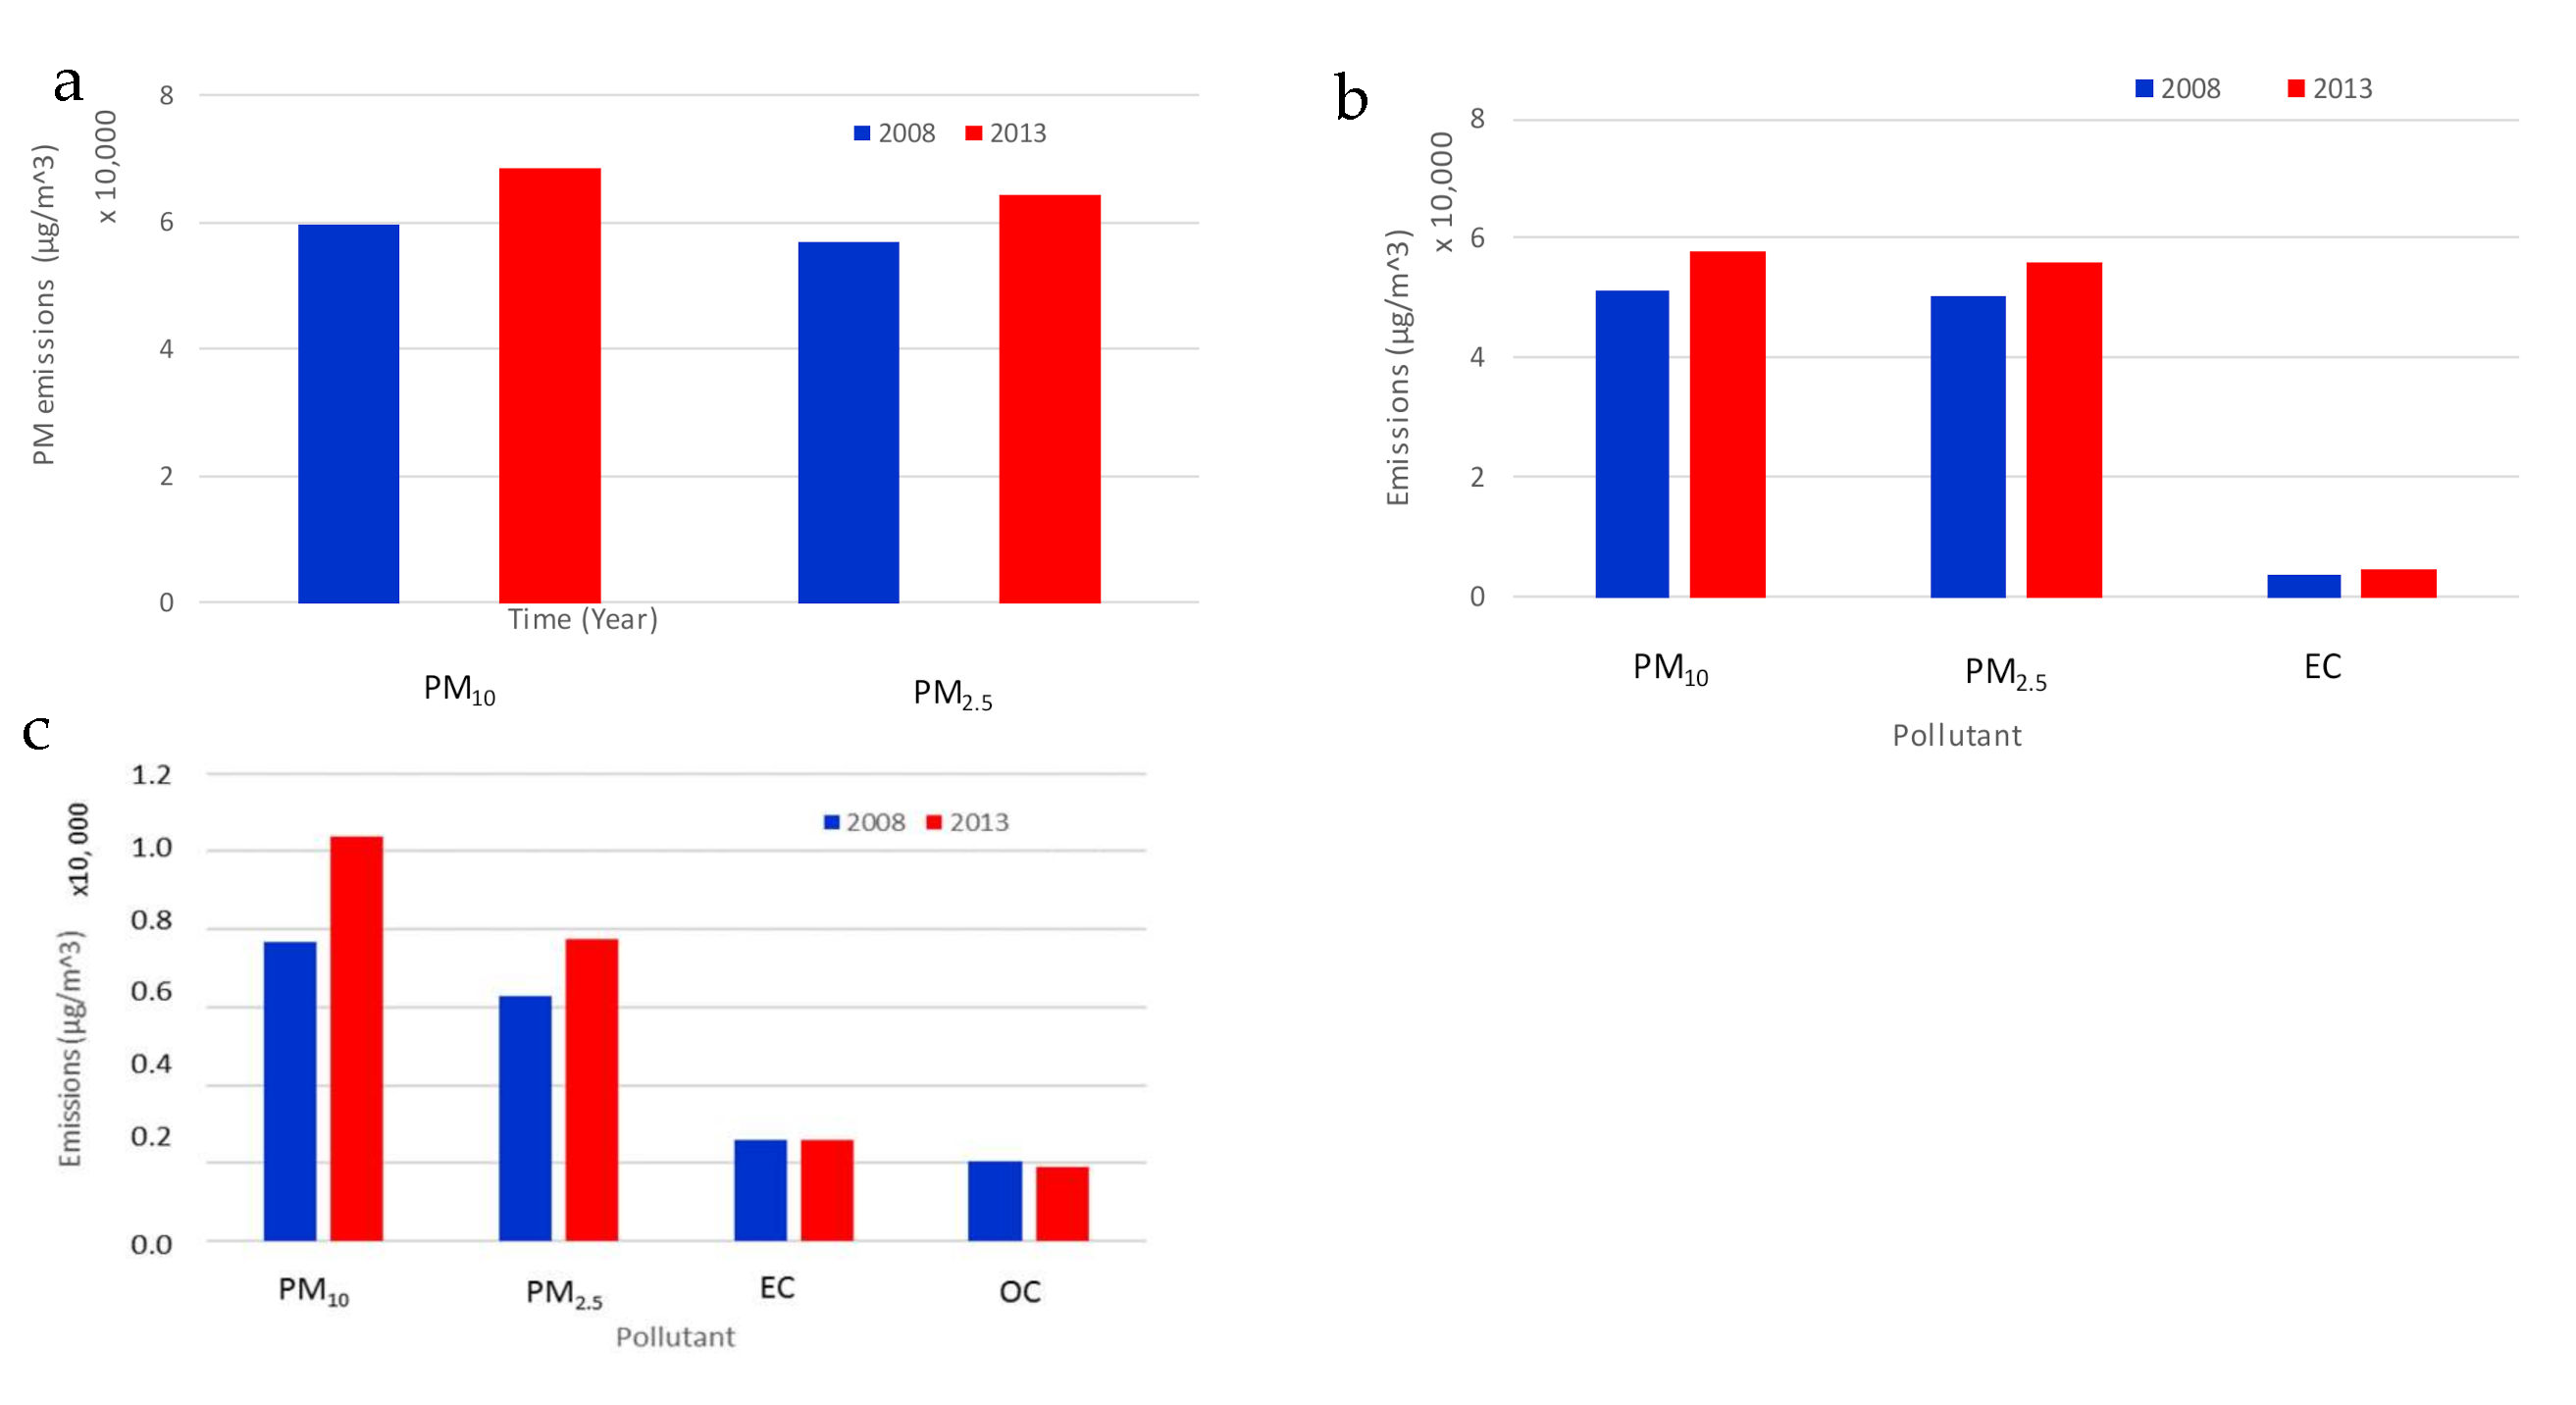
  • An enhanced input from the anthropogenic emissions and in full compliance with the emission data, was observed in 2013 for both the PM load and the POM component.
  • The obtained PM chemical profile scheme was the result of both local and regional sources with POM and SIA, being the main constituents of the particles’ mass.
  • When moving from 2008 to 2013, the sector of residential heating seemed to drive the changes to the configuration of the PM burden.
  • In 2013, the EC input from the domestic heating was almost double of the one from traffic while the POM contribution from the traffic sector was decreased at about 7%.
  • The changes to the air quality were mainly driven by PM2.5.
  • From the health perspective, the considerable deterioration of the air quality in 2013, appeared to coincide with low average wind values (avg ws ≤ 0.69 m/s).
  • Despite the position of the monitoring location next to the most trafficked avenues of the capital, the EC input from the heating sector was double compared to the traffic in 2013.
The parallel analysis of the profile of the airborne particles with experimental and emissions data is of great importance. Various (pollution, meteorological, health) parameters should be investigated simultaneously, to clarify the degree of the impact of the differentiation of the share of the anthropogenic sources to the PM chemical PM profile. An extensive field campaign including different diameter particles within different types of environments, with a more detailed chemical characterization and emissions from other sectors, could give a better understanding of the complex PM nature.

Supplementary Materials

The following are available online at https://www.mdpi.com/2073-4433/11/10/1121/s1, Table S1: A statistical summary of the primary PM2.5 and PM1 data (mass concentration, chemical composition), during the different sampling periods, Table S2: A summary of the temporal differentiation of the average compositional PM2.5 and PM1 characteristics, the wind speed and the temperature values, during the different EPA-Health categories, Figure S1: Sum of the anions vs sum of the cations regression analysis in (a) PM2.5 and (b) PM1 samples of 2008 and 2013, Figure S2: Differentiation of cation deficit versus the nssSO4 concentrations in (a) PM2.5 and (b) PM1 samples between 2008 and 2013.

Author Contributions

The study was completed with cooperation between all authors. Conceptualization, S.P.; Data curation, S.P., K.-M.F., T.S., A.Z., A.B.; Methodology, S.P., K.-M.F., T.S., A.Z., K.B., A.B. and T.M.; Software, K.-M.F. and V.A.; Validation, S.P., Supervision, V.A., and N.M.; Writing—original draft, S.P.and K.-M.F.; Writing—review & editing, S.P., K.-M.F. and N.M. All authors have read and agreed to the published version of the manuscript.

Funding

The study was partly supported by the project THESPIA II (MIS 5002517), EU NSRF 2014-2020 and partly by the Post-Doctoral Research project ‘Observatory of Air and Particulate Pollution over Greece (AirPaP)’. AirPaP has received funding from the Hellenic Foundation for Research and Innovation (HFRI) and the General Secretariat for Research and Technology (GSRT), under grant agreement No 409.

Acknowledgments

The authors would like to thank the National Observatory of Athens and the Hellenic National Meteorological Service for the provision of the meteorological data.

Conflicts of Interest

The authors declare no conflict of interest. The funder did not participate in any phase of the study, including the publication of data.

References

  1. Paglione, M.; Gilardoni, S.; Rinaldi, M.; Decesari, S.; Zanca, N.; Sandrini, S.; Giulianelli, L.; Bacco, D.; Ferrari, S.; Poluzzi, V.; et al. The impact of biomass burning and aqueous-phase processing on air quality: A multi-year source apportionment study in the Po Valley, Italy. Atmos. Chem. Phys. 2020, 20, 1233–1254. [Google Scholar] [CrossRef] [Green Version]
  2. Squizzato, S.; Masiol, M.; Agostini, C.; Visin, F.; Formenton, G.; Harrison, R.M.; Rampazzo, G. Factors, origin and sources affecting PM1 concentrations and composition at an urban background site. Atmos. Res. 2016, 180, 262–273. [Google Scholar] [CrossRef] [Green Version]
  3. Vecchi, R.; Chiari, M.; D’Alessandro, A.; Fermo, P.; Lucarelli, F.; Mazzei, F.; Navab, S.; Piazzalungac, A.; Pratie, P.; Silvania, F.; et al. A mass closure and PMF source apportionment study on the sub-micron sized aerosol fraction at urban sites in Italy. Atmos. Environ. 2008, 42, 2240–2253. [Google Scholar] [CrossRef]
  4. Galindo, N.; Gil-Molto, J.; Varea, M.; Chofre, C.; Yubero, E. Seasonal and interanual trends in PM levels and associated inorganic ions in southeastern Spain. Microchem. J. 2013, 110, 81–88. [Google Scholar] [CrossRef]
  5. Galindo, N.; Yubero, E.; Clemente, A.; Nicolas, J.F.; Varea, M.; Crespo, J. PM events and changes in the chemical composition of urban aerosols: A case study in the western Mediterranean. Chemosphere 2020, 244, 125520. [Google Scholar] [CrossRef]
  6. Barzeghar, V.; Sarbakhsh, P.; Hassanvand, M.S.; Faridi, S.; Gholampour, A. Long-term trend of ambient air PM10, PM2.5, and O3 and their health effects in Tabriz city, Iran, during 2006–2017. Sustain. Cities Soc. 2020, 54, 101988. [Google Scholar] [CrossRef]
  7. Dong, Z.; Wang, S.; Xing, J.; Chang, X.; Ding, D.; Zheng, H. Regional transport in Beijing-Tianjin-Hebei region and its changes during 2014–2017: The impacts of meteorology and emission reduction. Sci. Total Environ. 2020, 737, 139792. [Google Scholar] [CrossRef]
  8. Fan, Y.; Ding, X.; Hang, J.; Ge, J. Characteristics of urban air pollution in different regions of China between 2015 and 2019. Build. Environ. 2020, 180, 107048. [Google Scholar] [CrossRef]
  9. Zhang, X.; Gu, X.; Cheng, C.; Yang, D. Spatiotemporal heterogeneity of PM2.5 and its relationship with urbanization in North China from 2000 to 2017. Sci. Total Environ. 2020, 744, 140925. [Google Scholar] [CrossRef]
  10. Chen, L.; Zhu, J.; Liao, H.; Yang, Y.; Yue, X. Meteorological influences on PM2.5 and O3 trends and associated health burden since China’s clean air actions. Sci. Total Environ. 2020, 744, 140837. [Google Scholar] [CrossRef]
  11. Gao, M.; Carmichael, G.R.; Saide, P.E.; Lu, Z.; Yu, M.; Streets, D.G.; Wang, Z. Response of winter fine particulate matter concentrations to emission and meteorology changes in North China. Atmos. Chem. Phys. 2016, 16, 11837–11851. [Google Scholar] [CrossRef] [Green Version]
  12. Kim, Y.; Yi, S.-M.; Heo, J. Fifteen-year trends in carbon species and PM2.5 in Seoul, South Korea (2003–2017). Chemosphere 2020, 261, 127750. [Google Scholar] [CrossRef]
  13. Paraskevopoulou, D.; Liakakou, E.; Gerasopoulos, E.; Mihalopoulos, N. Sources of atmospheric aerosol from long-term measurements (5 years) of chemical composition in Athens, Greece. Sci. Total Environ. 2015, 527, 165–178. [Google Scholar] [CrossRef] [PubMed]
  14. Jiang, Z.; Jolleys, M.D.; Fu, T.-M.; Palmer, P.I.; Ma, Y.; Tian, H.; Li, J.; Yang, X. Spatiotemporal and probability variations of surface PM2.5 over China between 2013 and 2019 and the associated changes in health risks: An integrative observation and model analysis. Sci. Total Environ. 2020, 723, 137896. [Google Scholar] [CrossRef] [PubMed]
  15. Zhang, Q.; Zheng, Y.; Tong, D.; Shao, M.; Wang, S.; Zhang, Y.; Xu, X.; Wang, J.; He, H.; Liu, W.; et al. Drivers of improved PM2.5 air quality in China from 2013 to 2017. Proc. Natl. Acad. Sci. USA 2019, 116, 24463–24469. [Google Scholar] [CrossRef] [PubMed] [Green Version]
  16. Gao, M.; Liu, Z.; Zheng, B.; Ji, D.; Sherman, P.; Song, S.; Xin, J.; Liu, C.; Wang, Y.; Zhang, Q.; et al. China’s emission control strategies have suppressed unfavorable influences of climate on wintertime PM2.5 concentrations in Beijing since 2002. Atmos. Chem. Phys. 2020, 20, 1497–1505. [Google Scholar] [CrossRef] [Green Version]
  17. Querol, X.; Alastuey, A.; Pandolfi, M.; Reche, C.; Pérez, N.; Minguillón, M.C.; Moreno, T.; Viana, M.; Escudero, M.; Orio, A.; et al. 2001–2012 trends on air quality in Spain. Sci. Total Environ. 2014, 490, 957–969. [Google Scholar] [CrossRef] [Green Version]
  18. Pateraki, S.; Asimakopoulos, D.N.; Maggos, T.; Assimakopoulos, V.D.; Bougiatioti, A.; Bairachtari, K.; Vasilakos, C.; Mihalopoulos, N. Chemical characterization, sources and potential health risk of PM2.5 and PM1 pollution across the Greater Athens Area. Chemosphere 2020, 241, 125026. [Google Scholar] [CrossRef]
  19. Fameli, K.M.; Assimakopoulos, V.D. The new open Flexible Emission Inventory for Greece and the Greater Athens Area (FEI-GREGAA): Account of pollutant sources and their importance from 2006 to 2012. Atmos. Environ. 2016, 137, 17–37. [Google Scholar] [CrossRef]
  20. Crilley, L.R.; Bloss, W.J.; Yin, J.; Beddows, D.C.S.; Harrison, R.M.; Allan, J.D.; Young, D.E.; Flynn, M.; Williams, P.; Zotter, P.; et al. Sources and contributions of wood smoke during winter in London: Assessing local and regional influences. Atmos. Chem. Phys. 2015, 15, 3149–3171. [Google Scholar] [CrossRef] [Green Version]
  21. Mueller, W.; Loh, M.; Vardoulakis, S.; Johnston, H.J.; Steinle, S.; Precha, N.; Kliengchuay, W.; Tantrakarnapa, K.; Cherrie, J.W. Ambient particulate matter and biomass burning: An ecological time series study of respiratory and cardiovascular hospital visits in northern Thailand. Environ. Health 2020, 19, 77. [Google Scholar] [CrossRef]
  22. Fourtziou, L.; Liakakou, E.; Stavroulas, I.; Theodosi, C.; Zarmpas, P.; Psiloglou, B.; Sciare, J.; Maggos, T.; Bairachtari, K.; Bougiatioti, A.; et al. Multi-tracer approach to characterize domestic wood burning in Athens (Greece) during wintertime. Atmos. Environ. 2017, 148, 89–101. [Google Scholar] [CrossRef]
  23. Pateraki, S. Experimental and Arithmetic Study of the Particulate Matter (ΡΜ10, ΡΜ2.5, ΡΜ1) Concentrations and Their Chemical Composition (PAHs, Ions, Organic/Elemental Carbon) over the Greater Athens Area. Ph.D. Thesis, Department of Physics, National Kapodistrian of Athens, Athens, Greece, 2012. [Google Scholar]
  24. Stavraka, T. A Study of PM2.5 and PM1 in the Atmosphere of a Suburban Area within the Athens Basin. Bachelor’s Thesis, Department of Physics, National Kapodistrian of Athens, Athens, Greece, 2013. [Google Scholar]
  25. Zagkos, A. A Study of the Temporal Evolution of Particulate Pollution in Different Types of Environment across the Greater Athens Area: Concentrations, Chemical Composition and the Role of the Meteorology. Master’s Thesis, Department of Physics, National Kapodistrian of Athens, Athens, Greece, 2014. [Google Scholar]
  26. Pateraki, S.; Assimakopoulos, V.D.; Bougiatioti, A.; Kouvarakis, G.; Mihalopoulos, N.; Vasilakos, C. Carbonaceous and ionic compositional patterns of fine particles over an urban Mediterranean area. Sci. Total Environ. 2012, 424, 251–263. [Google Scholar] [CrossRef] [PubMed]
  27. Kocak, M.; Mihalopoulos, N.; Kubilay, N. Chemical composition of the fine and coarse fraction of aerosols in the northeastern Mediterranean. Atmos. Environ. 2007, 41, 7351–7368. [Google Scholar] [CrossRef]
  28. Theodosi, C.; Grivas, G.; Zarmpas, P.; Chaloulakou, A.; Mihalopoulos, N. Mass and chemical composition of size-segregated aerosols (PM1, PM2.5, PM10) over Athens, Greece: Local versus regional sources. Atmos. Chem. Phys. 2011, 11, 11895–11911. [Google Scholar] [CrossRef] [Green Version]
  29. Liakakou, E.; Stavroulas, I.; Kaskaoutis, D.G.; Grivas, G.; Paraskevopoulou, D.; Dumka, U.C.; Tsagkaraki, M.; Bougiatioti, A.; Oikonomou, K.; Sciare, J.; et al. Long-term variability, source apportionment and spectral properties of black carbon at an urban background site in Athens, Greece. Atmos. Environ. 2020, 222, 117137. [Google Scholar] [CrossRef]
  30. Terzi, E.; Argyropoulos, G.; Bougatioti, A.; Mihalopoulos, N.; Nikolaou, K.; Samara, C. Chemical composition and mass closure of ambient PM10 at urban sites. Atmos. Environ. 2010, 44, 2231–2239. [Google Scholar] [CrossRef]
  31. Pateraki, S.; Asimakopoulos, D.N.; Bougiatioti, A.; Maggos, T.; Vasilakos, C.; Mihalopoulos, N. Assessment of PM2.5 and PM1 Chemical Profile in a Multiple-Impacted Mediterranean Urban Area: Origin, Sources and Meteorological Dependence. Sci. Total Environ. 2014, 479, 210–220. [Google Scholar] [CrossRef]
  32. Odysseee Mure Project. Available online: https://www.odyssee-mure.eu/ (accessed on 15 March 2019).
  33. Fameli, K.M.; Assimakopoulos, V.D. Development of a road transport emission inventory for Greece and the Greater Athens Area: Effects of important parameters. Sci. Total Environ. 2015, 505, 770–786. [Google Scholar] [CrossRef] [Green Version]
  34. Schaap, M.; Roemer, M.; Sauter, F.; Boersen, G.; Timmermans, R.; Builtjes, P.J.H.; Vermeulen, A.T. Lotos-Euros: Documentation; TNO-Report B&O-A R 2005/297; TNO: Apeldoorn, The Netherlands, 2005. [Google Scholar]
  35. Gorai, A.K.; Tchounwou, P.B.; Biswal, S.S.; Francis Tuluri, F. Spatio-Temporal Variation of Particulate Matter (PM2.5) Concentrations and Its Health Impacts in a Mega City, Delhi in India. Environ. Health Insights 2018, 12, 1–9. [Google Scholar] [CrossRef] [Green Version]
  36. EPA. Guideline for Reporting of Daily Air Quality—Air Quality Index (AQI); EPA: Washington, DC, USA, 1999. [Google Scholar]
  37. Dimitriou, K.; Liakakou, E.; Lianou, M.; Psiloglou, B.; Kassomenos, P.; Mihalopoulos, N.; Gerasopoulos, E. Implementation of an aggregate index to elucidate the influence of atmospheric synoptic conditions on air quality in Athens, Greece. Air Qual. Atmos. Health 2020, 13, 447–458. [Google Scholar] [CrossRef]
  38. Wang, H.; Shooter, D. Coarse–fine and day–night differences of water-soluble ions in atmospheric aerosols collected in Christchurch and Auckland, New Zealand. Atmos. Environ. 2002, 36, 3519–3529. [Google Scholar] [CrossRef]
  39. Khan, J.Z.; Sun, L.; Tian, Y.; Shi, G.; Feng, Y. Chemical characterization and source apportionment of PM1 and PM2.5 in Tianjin, China: Impacts of biomass burning and primary biogenic sources. J. Environ. Sci. 2021, 99, 196–209. [Google Scholar] [CrossRef]
  40. Phairuang, W.; Inerb, M.; Furuuchi, M.; Hata, M.; Tekasakul, S.; Tekasakul, P. Size-fractionated carbonaceous aerosols down to PM0.1 in southern Thailand: Local and long-range transport effects. Environ. Pollut. 2020, 260, 114031. [Google Scholar] [CrossRef]
  41. Zhang, Y.-L.; Huang, R.-J.; El Haddad, I.; Ho, K.-F.; Cao, J.-J.; Han, Y.; Zotter, P.; Bozzetti, C.; Daellenbach, K.R.; Canonaco, F.; et al. Fossil vs. non-fossil sources of fine carbonaceous aerosols in four Chinese cities during the extreme winter haze episode of 2013. Atmos. Chem. Phys. 2015, 15, 1299–1312. [Google Scholar] [CrossRef] [Green Version]
  42. Zotter, P.; Herich, H.; Gysei, M.; El-Haddad, I.; Zhang, Y.; Mocnik, G.; Hüglin, C.; Baltensperger, U.; Szidat, S.; Prévôt, A.S.H. Evaluation of the absorption Ångström exponents for traffic and wood burning in the Aethalometer-based source apportionment using radiocarbon measurements of ambient aerosol. Atmos. Chem. Phys. 2017, 17, 4229–4249. [Google Scholar] [CrossRef] [Green Version]
  43. Lonati, G.; Giugliano, M.; Butelli, P.; Romele, L.; Tardivo, R. Major chemical components of PM2.5 in Milan (Italy). Atmos. Environ. 2005, 39, 1925–1934. [Google Scholar] [CrossRef]
  44. Sillanpaa, M.; Hillamoa, R.; Saarikoskia, S.; Frey, A.; Pennanen, A.; Makkonen, U.; Spolnik, Z.; Van Grieken, R.; Branis, M.; Brunekreef, B.; et al. Chemical composition and mass closure of particulate matter at six urban sites in Europe. Atmos. Environ. 2006, 40, S212–S223. [Google Scholar] [CrossRef]
  45. Rattigan, O.V.; Felton, H.D.; Bae, M.-S.; Schwab, J.J.; Demerjian, K.L. Multi-year hourly PM2.5 carbon measurements in New York: Diurnal, day of week and seasonal patterns. Atmos. Environ. 2010, 44, 2043–2053. [Google Scholar] [CrossRef]
  46. Hai, C.D.; Oanh, N.T.K. Effects of local, regional meteorology and emission sources on mass and compositions of particulate matter in Hanoi. Atmos. Environ. 2013, 78, 105–112. [Google Scholar] [CrossRef]
  47. Wang, Y.; Jia, C.; Tao, J.; Zhang, L.; Liang, X.; Ma, J.; Gao, H.; Huang, T.; Zhang, K. Chemical characterization and source apportionment of PM2.5 in a semi-arid and petrochemical-industrialized city, Northwest China. Sci. Total Environ. 2016, 573, 1031–1040. [Google Scholar] [CrossRef] [PubMed]
  48. Gao, J.; Tian, H.; Cheng, K.; Lu, L.; Zheng, M.; Wang, S.; Hao, J.; Wang, K.; Hua, S.; Zhu, C.; et al. The variation of chemical characteristics of PM2.5 and PM10 and formation causes during two haze pollution events in urban Beijing, China. Atmos. Environ. 2015, 107, 1–8. [Google Scholar] [CrossRef]
  49. Hassan, S.K.; Khoder, M.I. Chemical characteristics of atmospheric PM2.5 loads during air pollution episodes in Giza, Egypt. Atmos. Environ. 2017, 150, 346–355. [Google Scholar] [CrossRef]
Figure 1. The location of the sampling station.
Atmosphere 11 01121 g001
Figure 2. Differentiation of (a) the PM2.5 and (b) the PM1 mass closure profile in March 2008 and 2013.
Atmosphere 11 01121 g002
Figure 3. Differentiation of the average (a) total, (b) residential heating and (c) traffic PM10 and PM2.5 emissions between the March of 2008 and 2013.
Atmosphere 11 01121 g003
Figure 4. Frequency of occurrence (%) of (a) the health categories and the average AQI in connection with PM2.5 and (b) the prevalence of the acidic PM character during March of 2008 and 2013.
Atmosphere 11 01121 g004
Publisher’s Note: MDPI stays neutral with regard to jurisdictional claims in published maps and institutional affiliations.

