Article

SST Warming in Recent Decades in the Gulf Stream Extension Region and Its Impact on Atmospheric Rivers

1
College of Oceanic and Atmospheric Sciences, Ocean University of China, Qingdao 266100, China
2
Physical Oceanography Laboratory, Ocean University of China, Qingdao 266100, China
*
Author to whom correspondence should be addressed.
Atmosphere 2020, 11(10), 1109; https://doi.org/10.3390/atmos11101109
Submission received: 25 September 2020 / Revised: 9 October 2020 / Accepted: 13 October 2020 / Published: 16 October 2020
(This article belongs to the Section Meteorology)

Abstract

:
The sea surface temperature (SST) front in the Gulf Stream (GS) extension region is important to synoptic variations in atmosphere. In winter, large amounts of heat and moisture are released from the SST front, modulating the baroclinicity and humidity of the atmosphere, which is important for extratropical cyclones and atmospheric rivers (ARs). In this study, the variation of SST in the North Atlantic in winters since 1981 is investigated using satellite and reanalysis datasets, and a 23-year (1997 to 2019) warming trend of SST in the GS extension region is detected. The increase of SST is mainly distributed along the SST front, with more than 2 °C warming and a northward shift of the SST gradient from 1997 to 2019. Connected with the SST warming, significant increases in turbulent heat flux and moisture release into the atmosphere were found along the ocean front. As a result, baroclinic instability, upward water vapor flux and AR occurrence frequency increased in recent decades. Meanwhile, there was an increase in extreme rainfall along with the increase in AR landfalling on continental Western Europe (especially in the Iberian Peninsula and on the northern coast of the Mediterranean Sea).

1. Introduction

The Gulf Stream (GS) extension region is a strong mid-latitude western boundary current with a sharp ocean sea surface temperature (SST) front and active oceanic mesoscale eddies. In winter, the sharp ocean front releases large amounts of heat and moisture into the atmosphere, anchors surface wind convergence and precipitation bands, and affects the variation of extratropical cyclones (ECs) [1,2,3].
The change in SST fronts in the GS extension region includes a meridional shift of the path, adjustment of the SST gradient, and modification of the absolute SST values in the front region. The meridional shift of the front influences the synoptic atmospheric variability by modifying the low-level baroclinicity, poleward transport of moisture, and heat, resulting in a shift in storm tracks [4]. Comparative experiments on atmospheric models forced by high-resolution SST and smoothed SST suggest that the increase in the SST gradient influences upper-level latent heat release and enhances ECs [5]. The strength of the storm track was reported to be more sensitive to perturbations in absolute SST value [6]. This was further proved by Vries et al. [7] simulating storms passing through SST fronts. Their work suggests that the SST perturbation regulates surface latent heat flux, low-level baroclinicity, and upper-level diabatic heating to affect the strength of storms. SST variation north of the front can also change the land–sea contrast and air–sea stability, which is also important to surface storm track activities [8]. These works confirmed that a change in SST absolute value in the front region is more important to EC’s strength than the SST gradient.
Closely related to ECs, narrow and long water vapor transport bands, known as atmospheric rivers (ARs), are a major method of transporting water vapor and trigger of extreme precipitation in mid-latitudes [9]. ARs are often identified in the warm sector of ECs, and some studies specifically consider that ARs are portions of the EC system [10,11,12,13]. Due to their large amount of water vapor, ARs can cause precipitation and flooding when making landfall, especially if the moist air is forced to ascend in mountainous regions [14]. The north Atlantic ARs have a significant impact on severe rainfall in Western Europe—for example, in the UK [15,16,17], Norway [18,19], and the Iberian Peninsula [20,21]. As for the factors influencing ARs, references suggest that remote large-scale circulations such as ENSO, MJO, and NAO have a certain impact [20,21,22,23]. As for AR’s landfall and subsequent precipitation extremes in Europe, local large-scale circulation, such as blockings, and the Aleutian Low have more influence [24,25,26,27].
However, although many studies revealed the importance of ocean fronts on ECs, few referred to their impact on ARs. Matthews et al.’s work [28] found an extremely strong AR related to a higher SST than in other ARs assessed at their uptake locations. They also stressed that the warming in the North Atlantic SST since 1902 has increased the chance of high humidity in ARs. As ARs are closely related to ECs, we surmise that the change in GS fronts, which influences the storm track activity, will also have an impact on ARs.
As for the changes in GS SST fronts, their meridional shift was revealed to be a stimulator of the shift in storm tracks on an interannual time scale [4]. Another significant SST variation is the century-long accelerated warming (since 1900) in the western boundary region, at a rate that far exceeds the globally averaged surface ocean warming [29]. How about the status of the GS fronts in recent decades? Do these variations of SST in the GS front influence AR activity in the North Atlantic? Since 1981, high-resolution satellite data have increased the accuracy of SST observations. High-resolution and quality-enhanced reanalysis datasets enabled us to study the narrow water vapor transportation zone ARs. Using the NOAA OISST and ERA5 reanalysis datasets, we first evaluated the change in SST values and its gradient in the Gulf Stream since 1981. Then the corresponding variation in storm track and ARs was investigated. It is worth noting that as the main purpose of this paper is to assess the effect of SST warming in the Gulf Stream extension region on ARs, we focus on the increase of SST value in recent decades and its effect on atmosphere. This paper is laid out as follows: In Section 2, the data and methods are provided. In Section 3, we show the warming of SST in GS region over the past two decades. In Section 4, we investigate the increase in storm track and ARs. The precipitation and its trend caused by ARs by landfall onto the European continent will be discussed. We then examine vertical moisture transport, background instability, and moisture divergence as an attempt to assess the mechanism between the warming SST and the increased AR frequency. The discussion and conclusions are presented in Section 5.

2. Data and Methods

2.1. Data

In this paper, we use two sets of SST data, one from the NOAA OISST (Optimum Interpolation Sea Surface Temperature) blended product, Version 2 [30], and the other from ERA5 reanalysis [31]. OISST data are available from 1981, with a 0.25° × 0.25° spatial resolution and daily temporal interval. To compare with the OISST data, ERA5 reanalysis data were retrieved from the same period with same resolution but with 6 h time intervals. The meteorological variables used in this paper (velocity, precipitation, evaporation, surface latent and sensible heat flux, vertical integral of water vapor flux, and mean vertically integrated moisture divergence, and so on) are from the ERA5 reanalysis with the same resolution. A 2‒15-day bandpass filter was applied to get the anomalies of meteorological variables to calculate eddy kinetic energy (EKE) and upward water vapor flux <wQ> for synaptic variation.

2.2. AR Detection

ARs are defined as “a long, narrow, and transient corridor of strong horizontal water vapor transport that is typically associated with a low-level jet stream ahead of the cold front of an extratropical cyclone” [32,33]. Vertically integrated water vapor transport (IVT) is often used to capture ARs. Using vertical integral of eastward and northward water vapor flux from the ERA5 reanalysis, we calculated IVT using the following formula [32,34]:
IVT = ( 1 g 1000 300 qudp ) 2 + ( 1 g 1000 300 qvdp ) 2 ,
where q is the specific humidity in kg, u is the zonal wind in ms−1, v is the meridional wind in ms−1, and g is the acceleration due to gravity.
Then, IVT anomalies higher than 250 kg·m−1s−1, narrower than 1000 km, and longer than 2000 km are captured and defined as an AR following [34,35]. This threshold is also the weakest AR scale provided by Ralph et al. [36]. To concentrate on the ARs related to ECs in midlatitude, ARs whose center is located south of 20° N are not considered. The AR-related precipitation is defined as precipitation that occurred simultaneously and within the 20 km range of an AR.

2.3. Eady Growth Rate

According to the classic baroclinic theory, lower-level baroclinic instability can be effectively measured by the Eady growth rate, which depends on the ratio between vertical wind shear and Brunt-Väisälä frequency. This is a metric of ECs’ intensification potential [37]. We calculated the Eady growth rate from the ERA5 reanalysis according to the formula provided by Hoskins and Valdes and Shaman et al. [37,38].

2.4. Linear Trend and its Significance

The linear trends were calculated using a simple linear regression method, with the statistical significance assessed using a Student’s t-test [39].

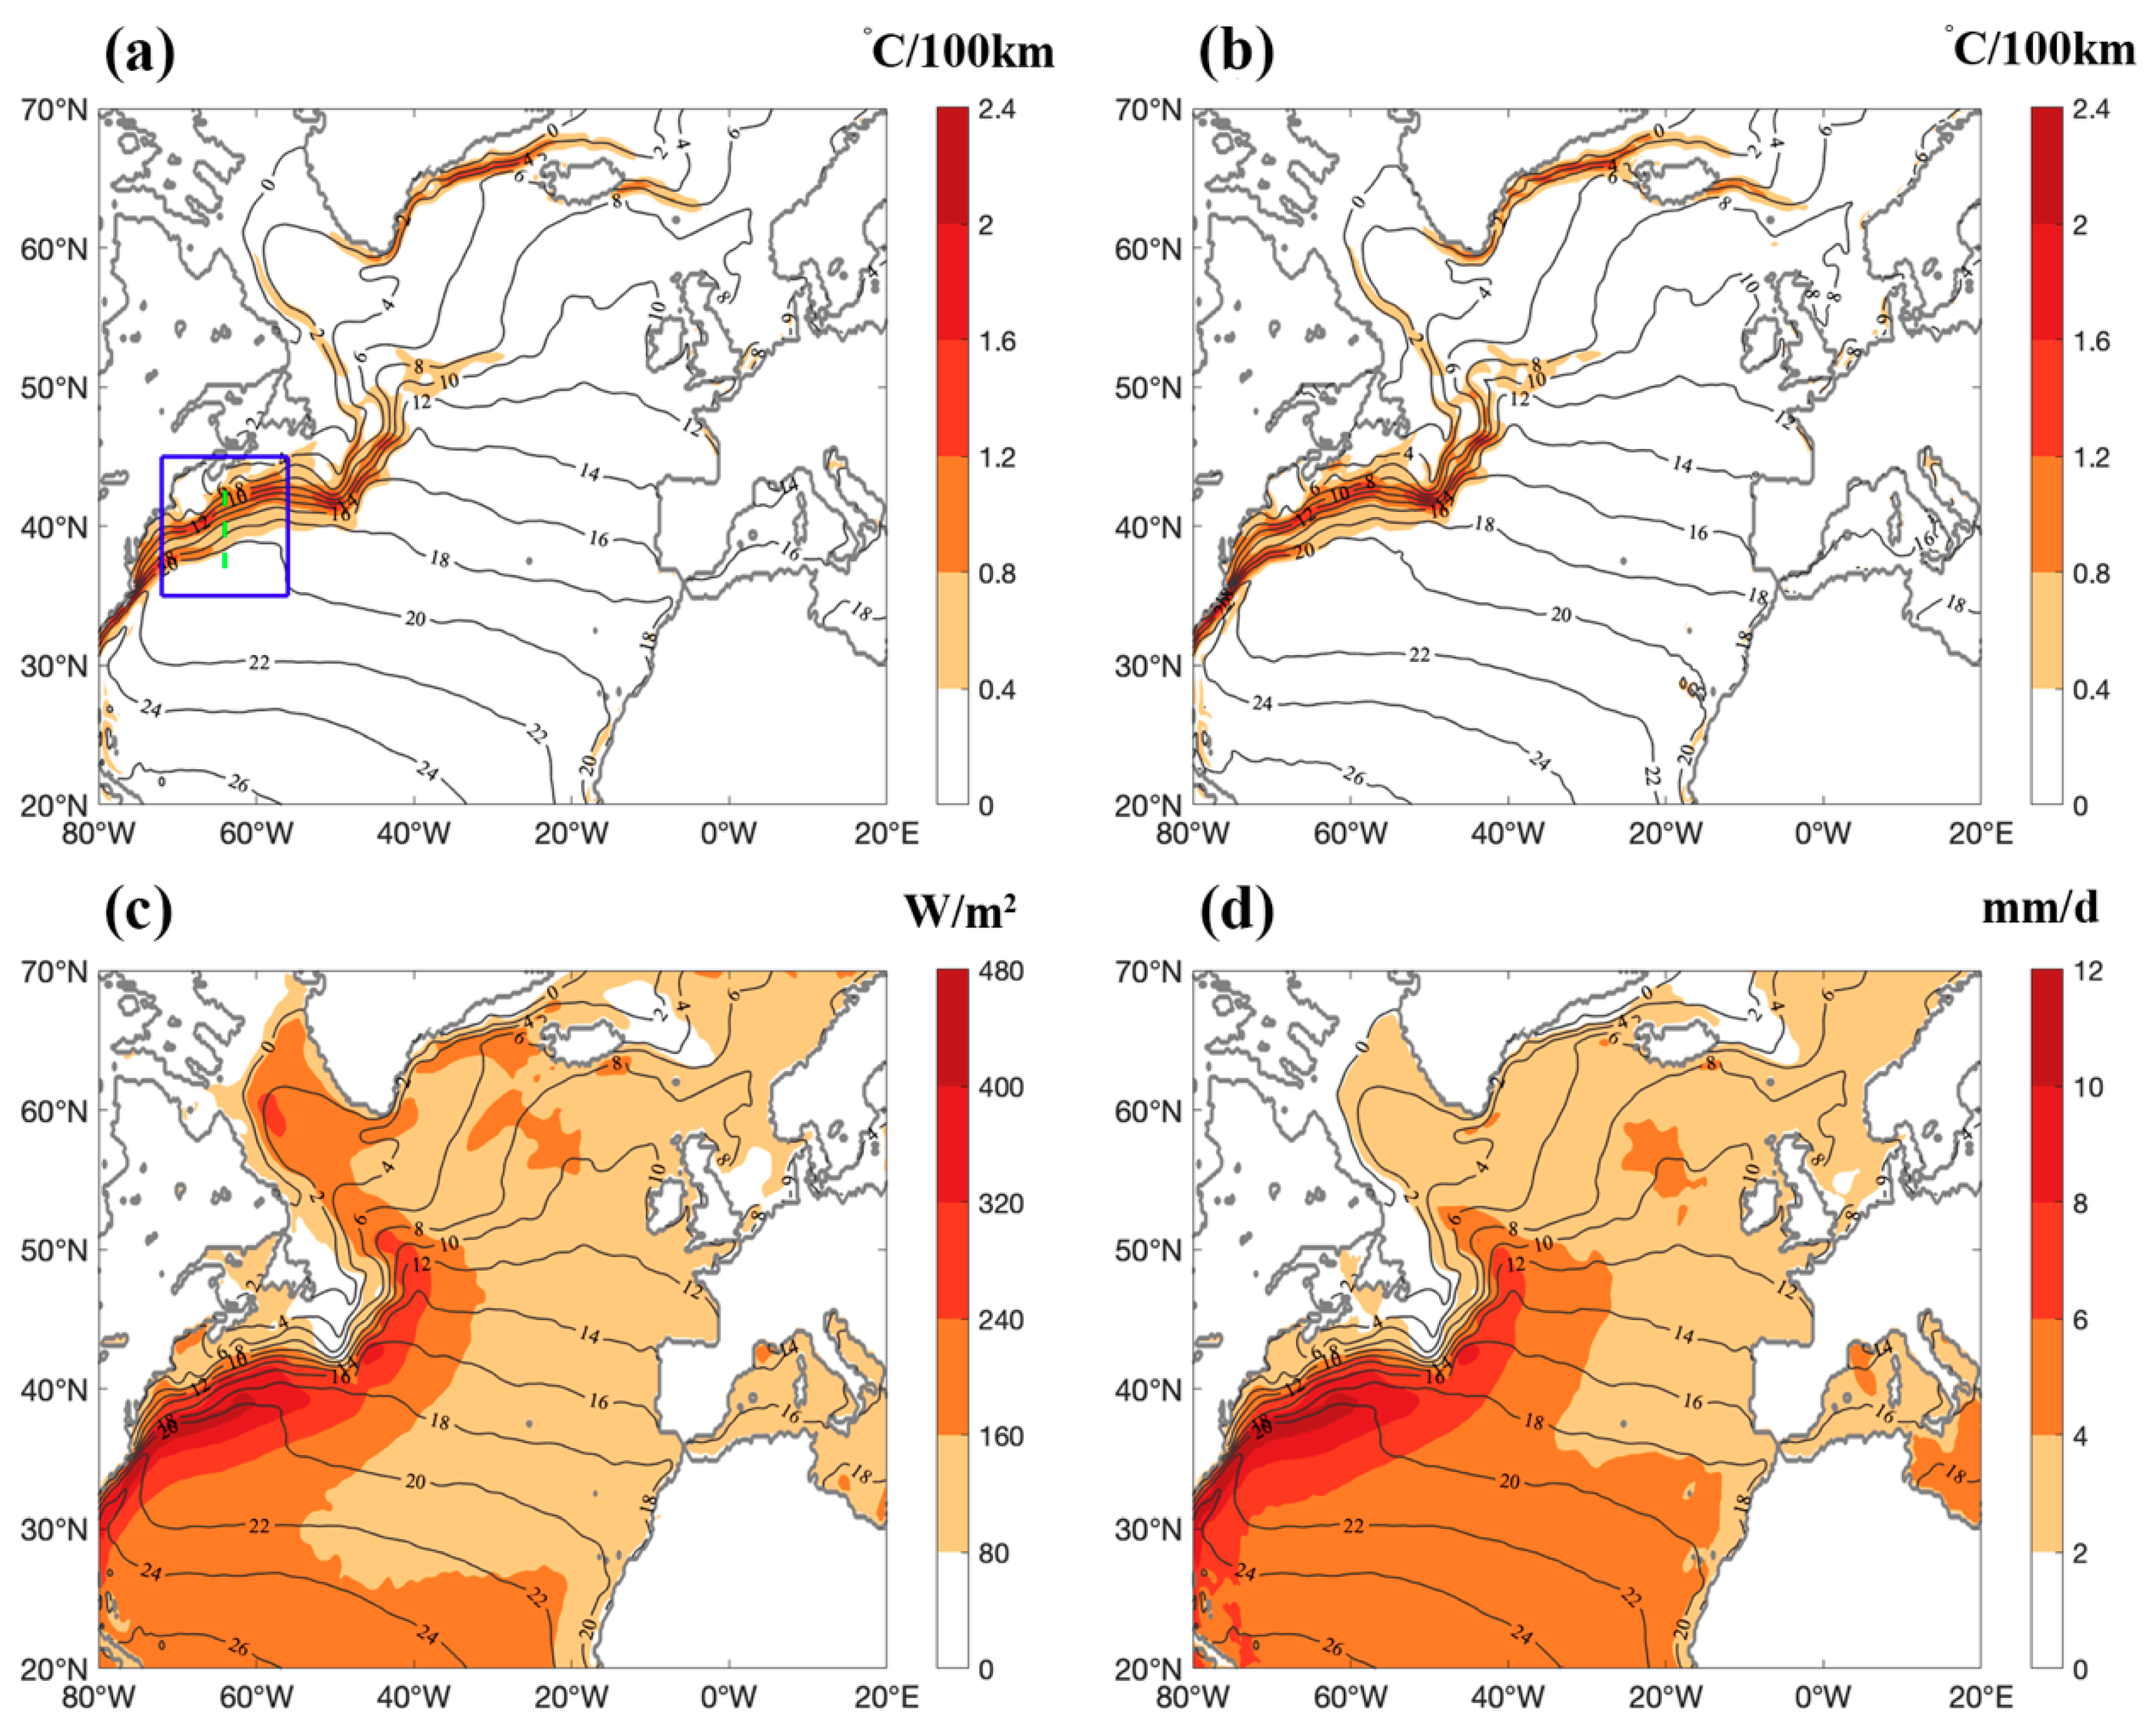
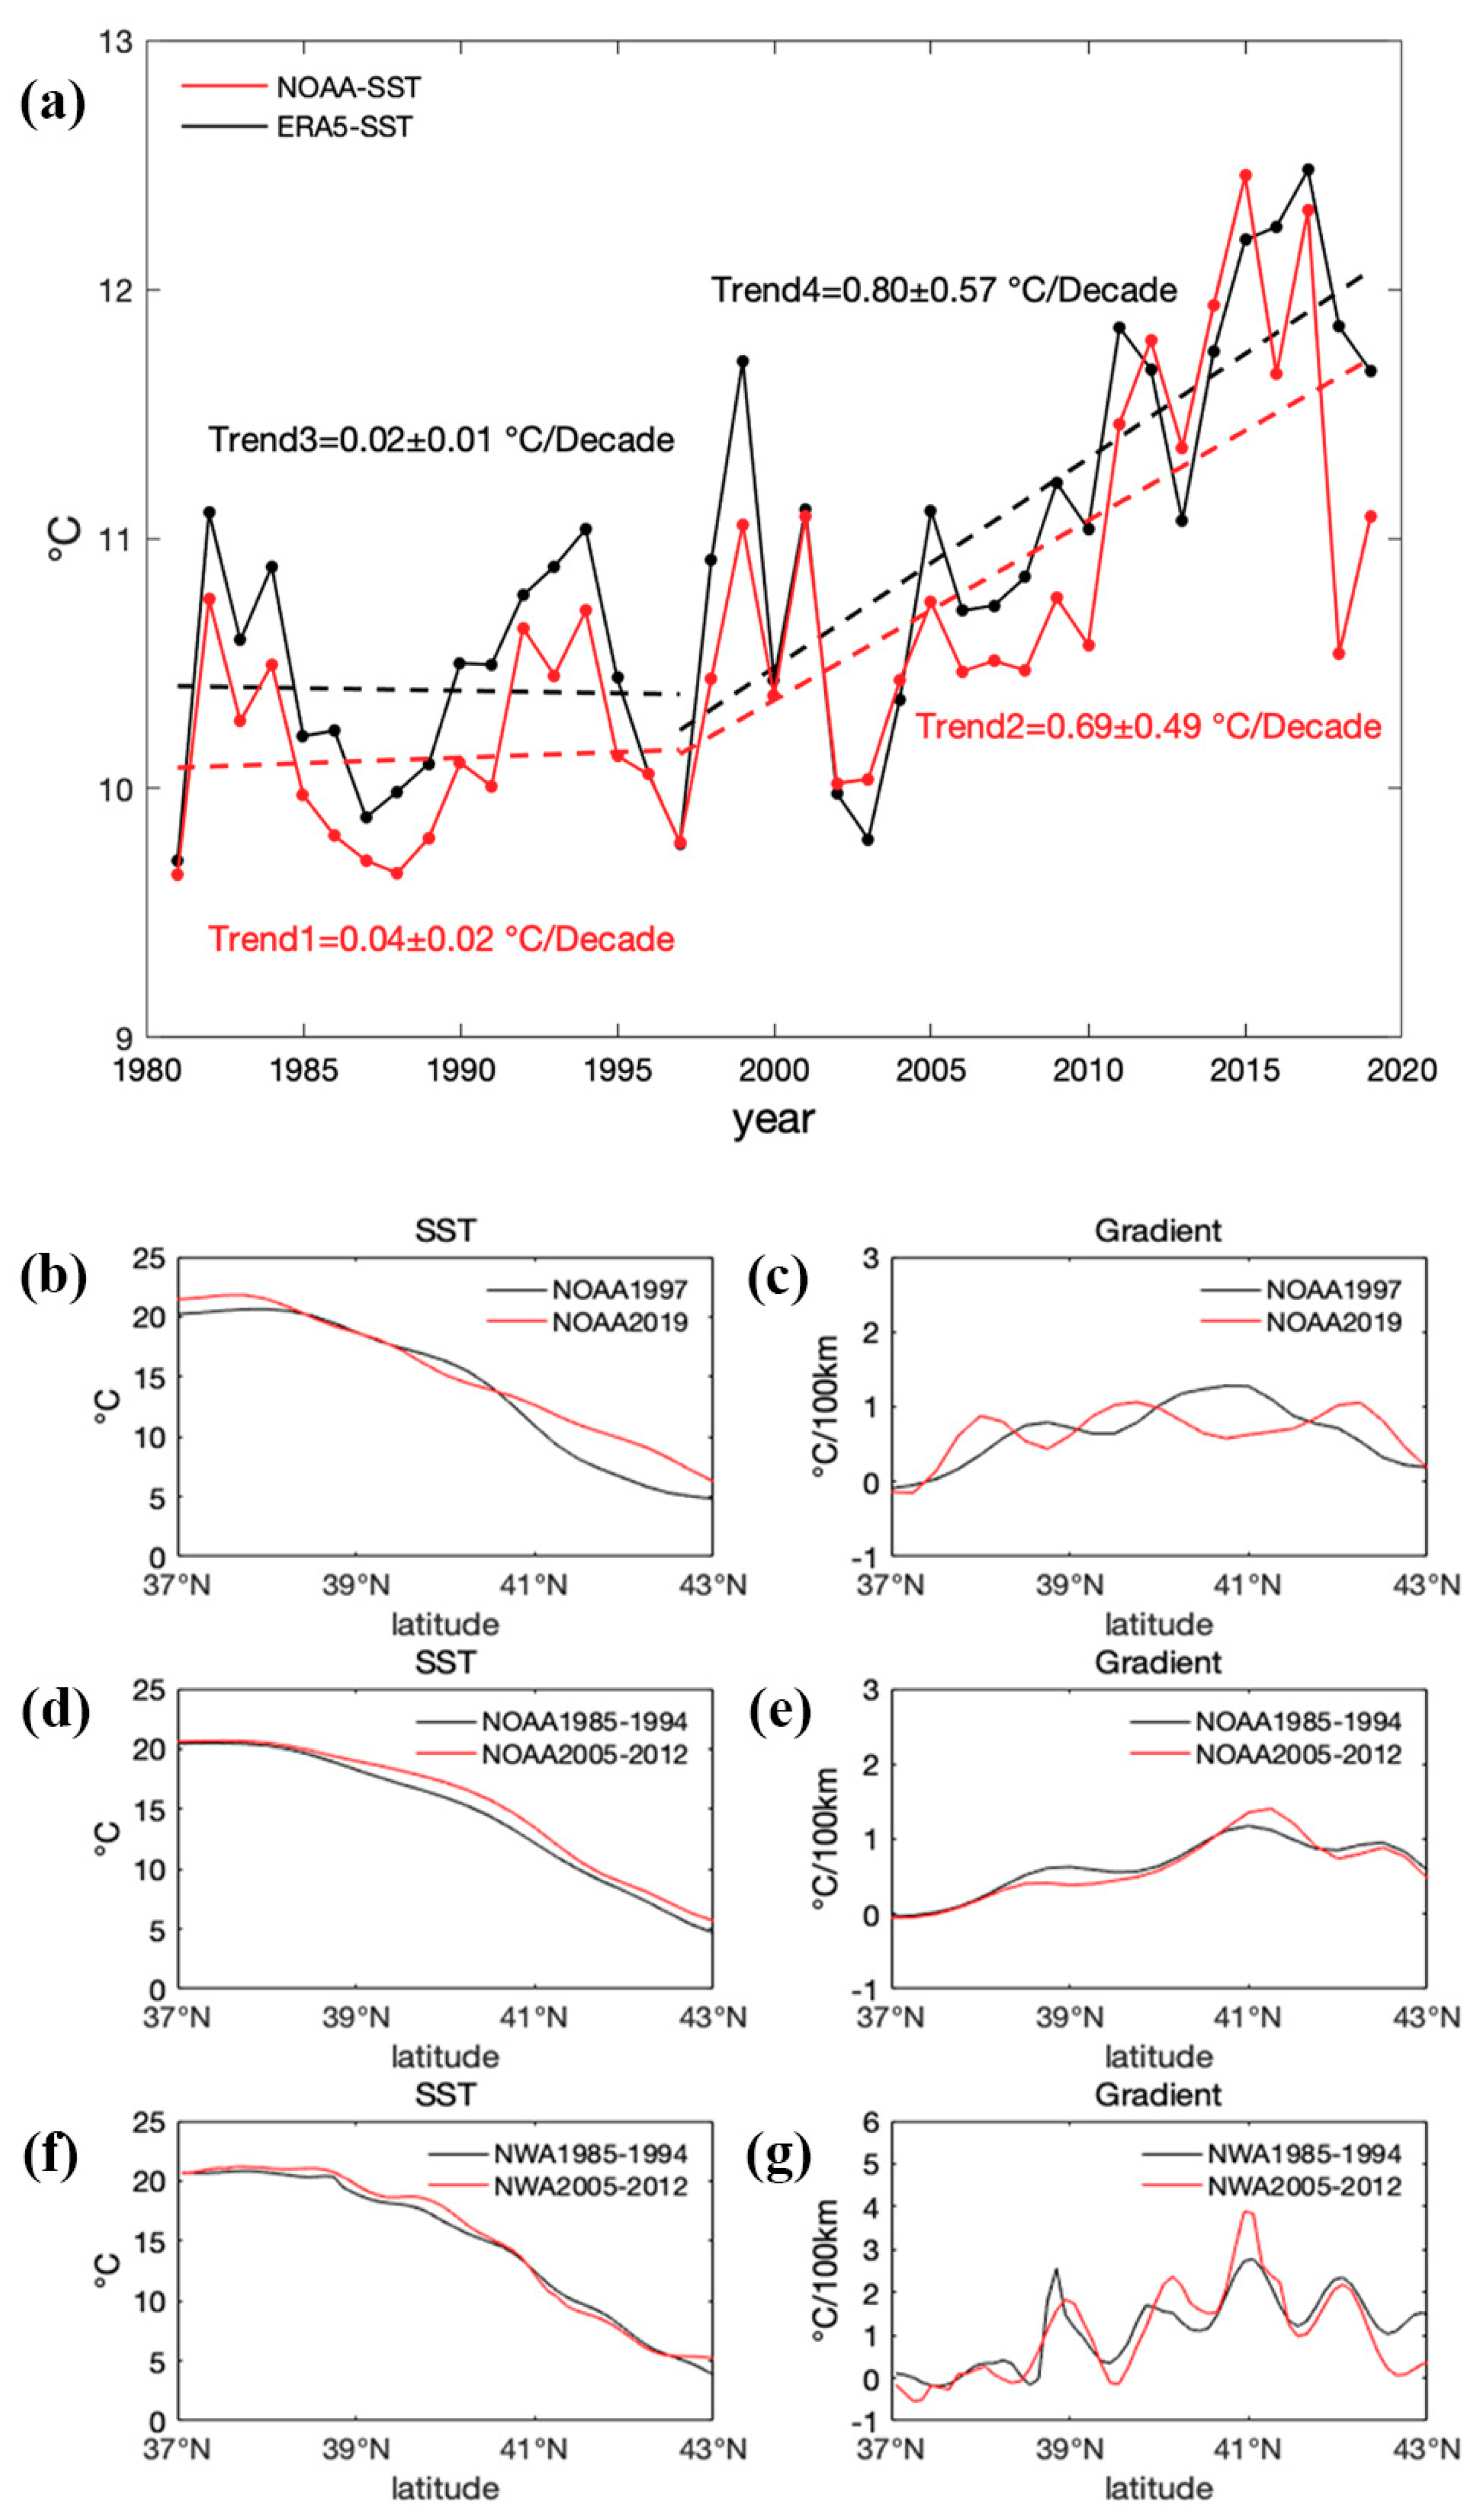
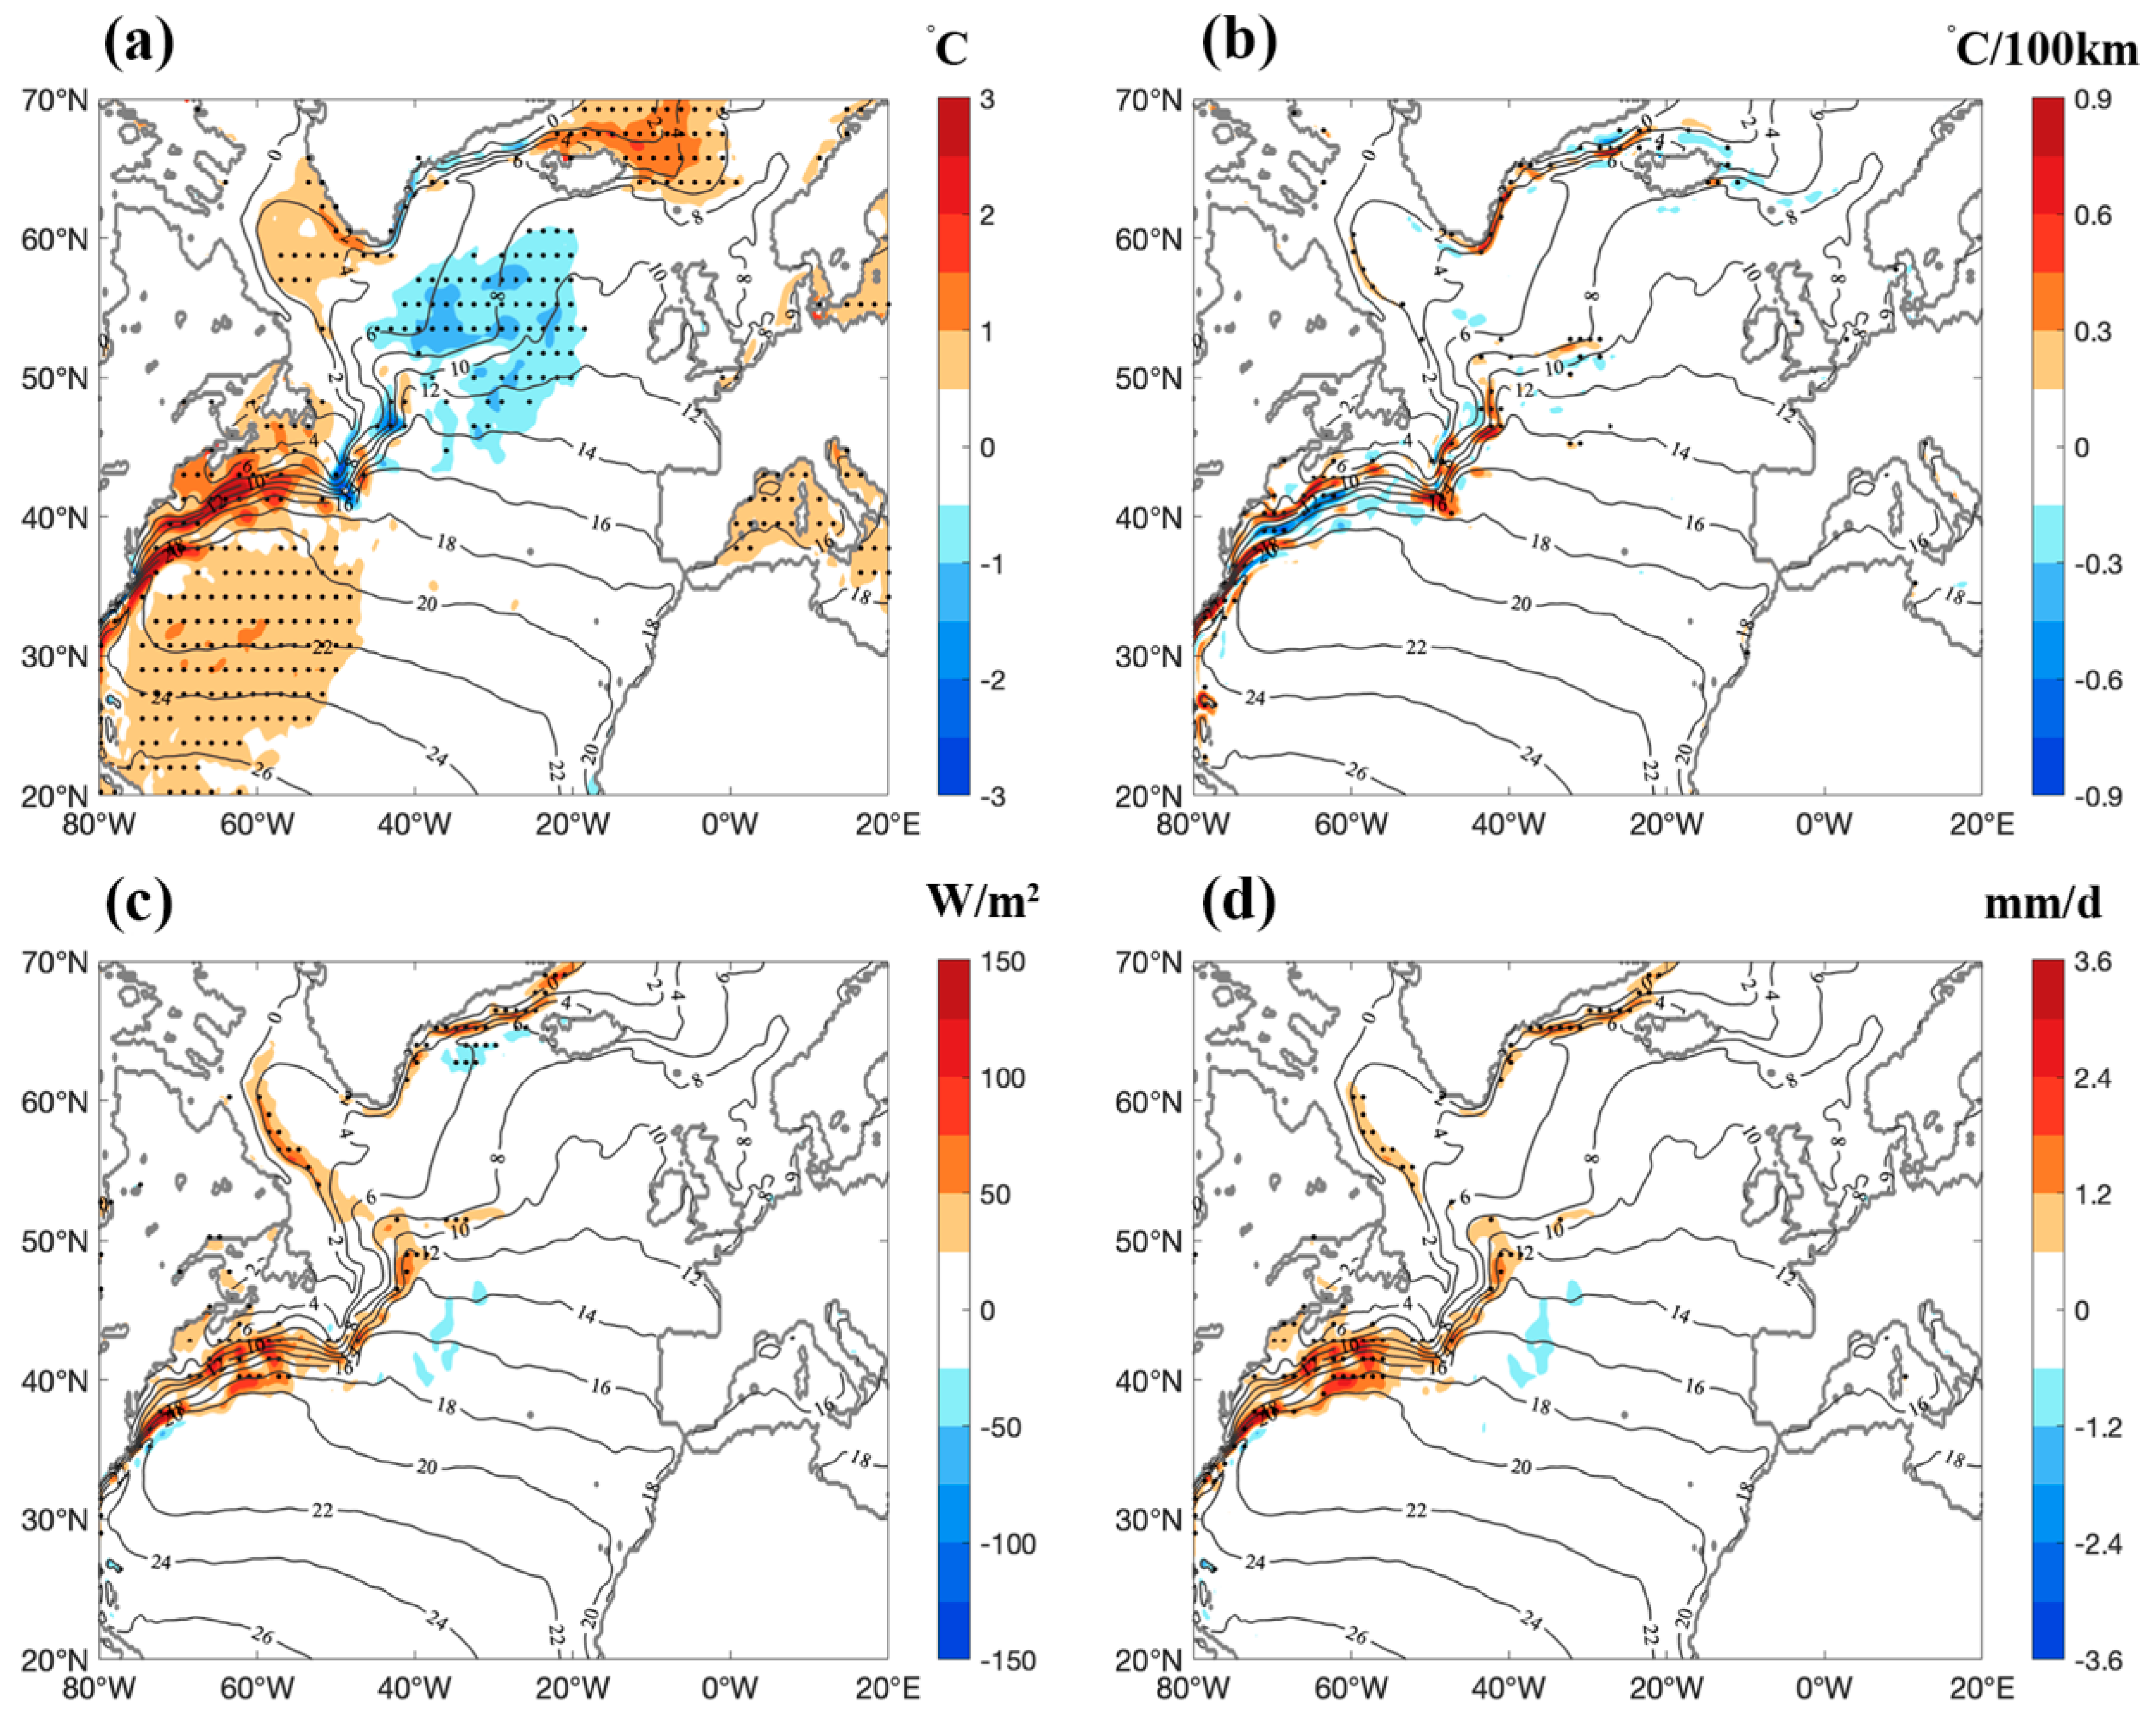
3. SST Warming in the GS Fronts

To examine the variation in SST in the GS front region in recent decades, both the OISST and ERA5 reanalysis datasets were used. As the influence of the SST front on the atmosphere is the strongest in winter in this region, we chose the months from November to March (NDJFM) to study. Mean SST and its gradient from OISST in winters from 1981 to 2019 are shown in Figure 1a, with a clear SST front (with a gradient about 1–2 °C/100 km) stretching from Cape Hatteras toward the Grand Banks, then turning north with the North Atlantic Current. The SST in ERA5 (Figure 1b) is identical to OISST; thus we discuss the results mainly from OISST in the following sections. A highly turbulent heat flux and evaporation zone was found along the warm sector of the ocean front (Figure 1c,d), suggesting that the ocean in winter provides large amounts of heat and moisture for the atmosphere. To further depict the variation of SST in recent decades, we chose the region in the blue box in Figure 1a (35° N–45° N, 72° W–56° W) to get the temporal variation of SST from 1981 to 2019. This region is characterized as having a high SST gradient and strong turbulent heat flux, which was reported to be important to the atmosphere [3]. To emphasize the decadal change in SST, the daily data were averaged in the winter months (NDJFM) to get the value of each year in Figure 2.
The variation of averaged SST in that region is shown in Figure 2a. With the help of linear regression, we noticed that the decadal trend after 1997 is much higher than before 1997. Between 1981 and 1997, the trend of SST from both datasets was near zero and failed to pass the 95% significance test. After 1997, the SST in both datasets showed a significant decadal increase, with a slope of about 0.8 ± 0.5 °C per decade. This accelerated warming trend after 1997 has far exceeded the centurial warming in the GS region since 1900 (1.02 ± 0.37 °C per century), which was revealed by Wu et al. [29] (see Table 1 in their study). The pattern of this SST trend from 1997 to 2019 is shown in Figure 3. The increase of SST is mainly distributed along the GS extension, with a maximum of over 2 °C in the 23 years in the ridge of the SST front. There were also weak SST warming in the south of the GS, and in the Labrador Sea, Norwegian Sea, and Mediterranean Sea. Northeast of the Grand Banks, a decrease of SST is located where one branch of the GS flows north-northeastward, and it is known as the North Atlantic Current. It is interesting that the positive-in-south and negative-in-northeast pattern of this trend resembles the SST tripole mode that appeared in the decadal time scale [40]. The difference is that the SST trend in this paper features significant maxima along the SST fronts.
For the post-1997 warming of SST in the GS front, there are also some clues in the northward shift of the Gulf Stream north wall (GSNW), using the 15 °C isotherm at 200 m depth as the definition. In Seidov et al.’s work [41], GSNW at individual longitude 65° W (the green line in their Figure 4c) has a northward migration trend after 1997, indicating a warming in this region. Similar northward migration can also be found in GSNW at longitudes west of 55° W, but not in those further east. To stress the warming in the GS front, and to evaluate the reliability of the OISST data, we compared the same temporal mean of OISST with NWARC (Northwest Atlantic Regional Climatology) SST from the high-resolution (1/10 degree) in situ data provided by Seidov et al. [42] (Figure 2d,f). Although they have coarser resolution, the OISST data agree with the NWARC SST in that the SST increased (mostly in the front region) in 2005–12 compared with 1985–94 along the section across the front on 64° W. The increase of gradients near 41° N in 2005–12 in the two datasets agree with each other, too (Figure 2e,g). This gives us confidence in both the OISST data and the recent warming in the front.
With the warming of the SST along the GS, the SST gradient increased in the north and decreased in the south of the front, showing a northward shift (Figure 3b). To show more clearly the shift of the gradient, we compared in Figure 2b the OISST in 1997 with that in 2019 along the section 64°W (where the largest SST trend is located). Compared with the SST in 1997, the SST in 2019 significantly increased north of 40° N (the increase is higher than 2 °C), with a northward shift of its gradient (Figure 2c). Considering the northward migration of the GSNW in recent years [41], we assume the increase of the SST in GS region is due to the northward shift of SST gradient in recent decades. Along with the warming along the GS front, a significant increase of surface turbulent heat flux and evaporation from 1997 to 2019 was observed, stretching along the GS and all the way to the Labrador Sea and the southern coast of Greenland (Figure 3c,d). The turbulent heat flux increased over 100 W/m2 during the 23 years, which accounts for one-third of its mean. This suggests that the SST warming has induced a large amount of heat and moisture into the atmosphere. According to the literature, this might induce an increase in the strength of the storm track [6,8]. In the next section, we will investigate the trend in storm track activity and AR frequency, to evaluate the effect of the warming SST on the atmosphere.

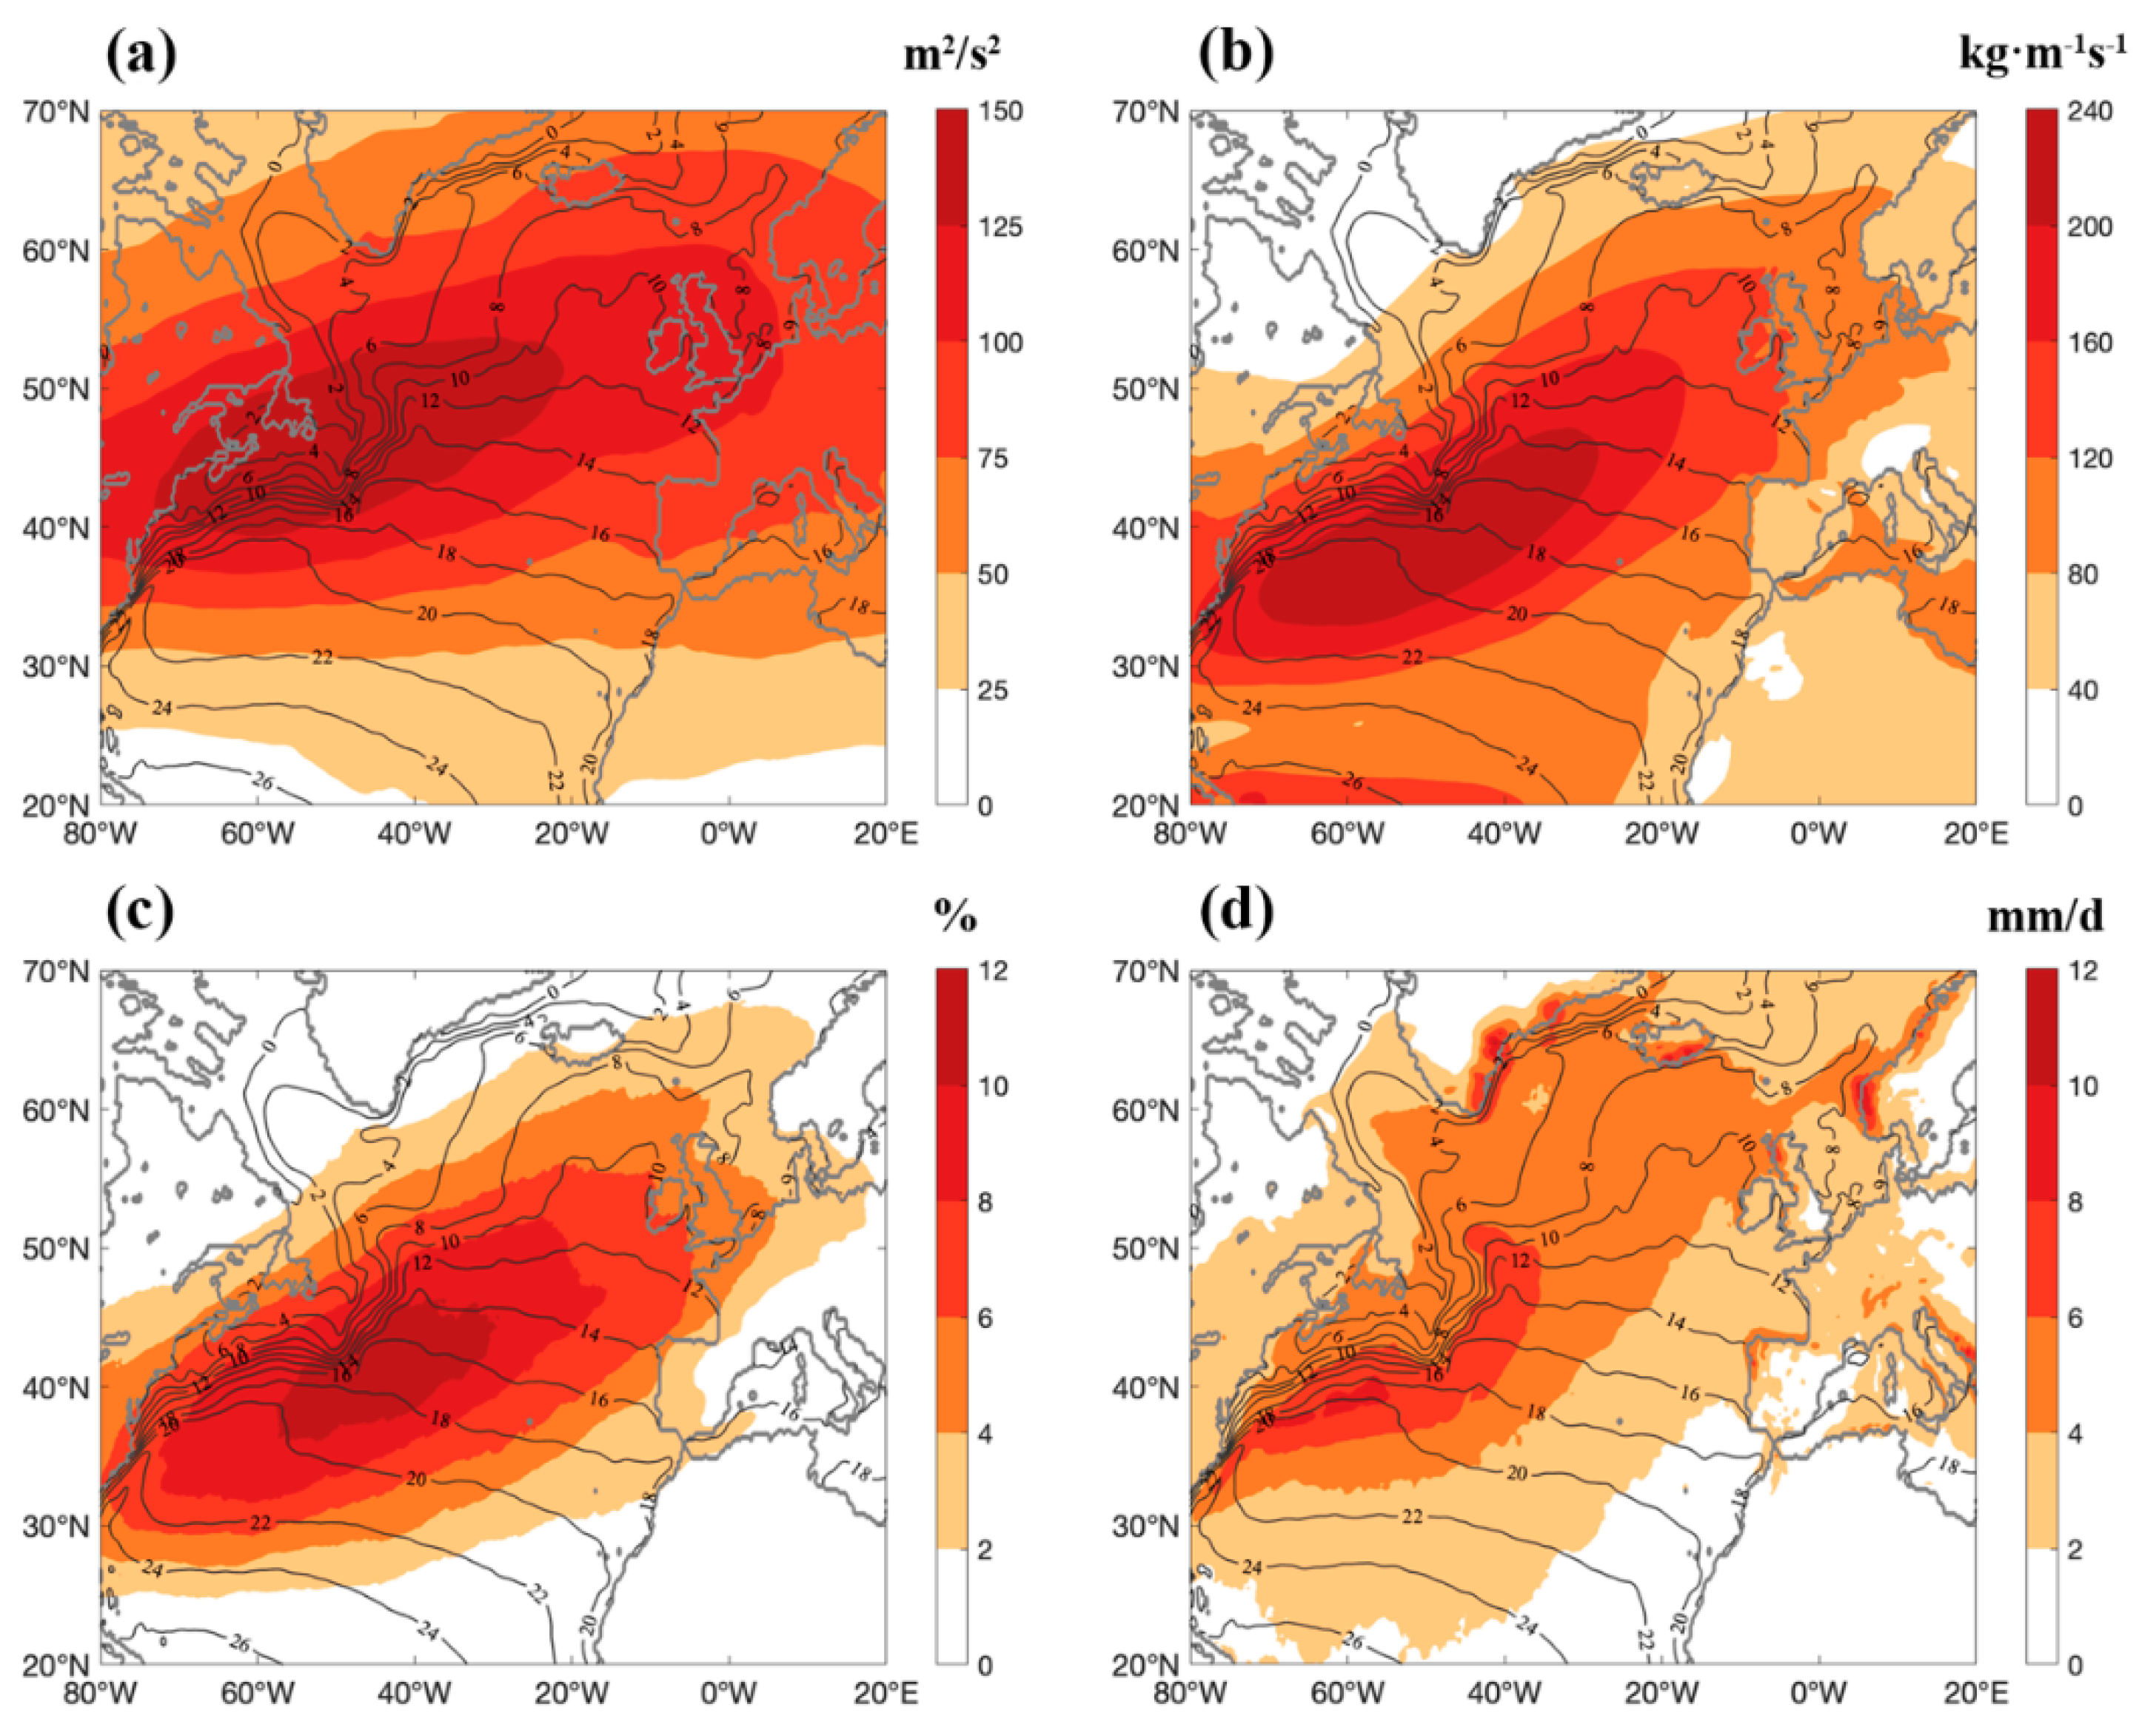
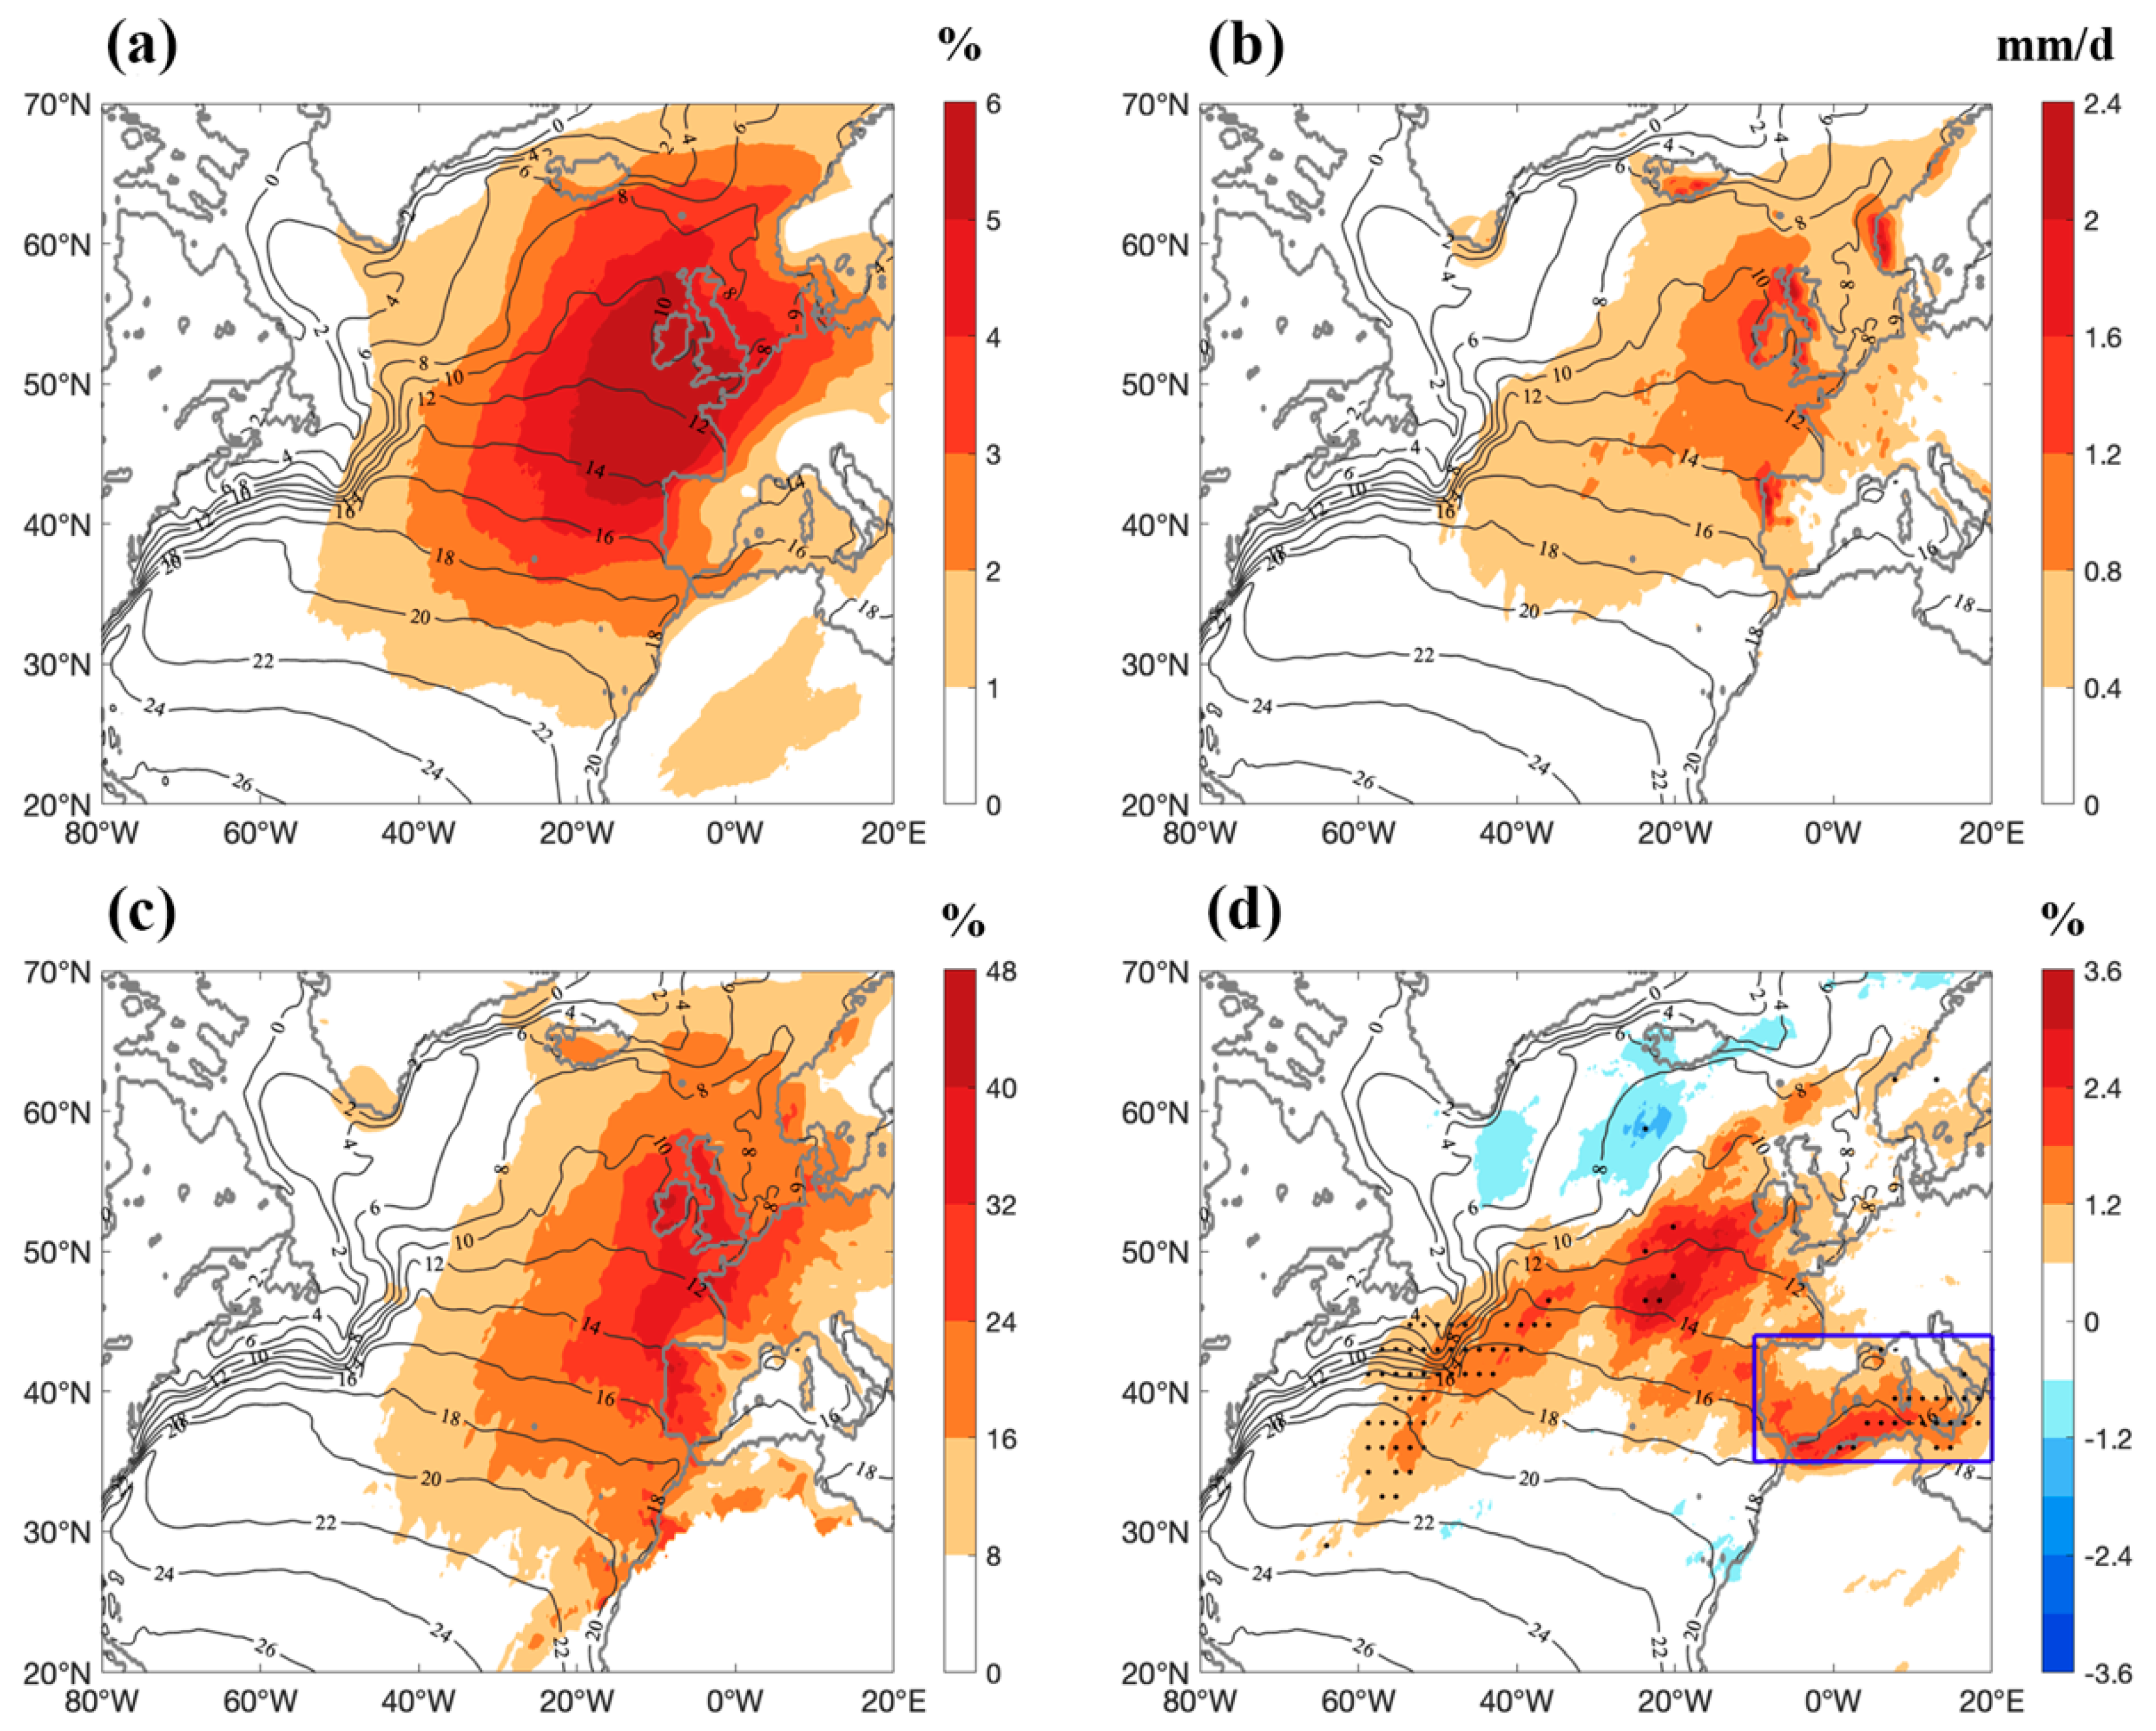
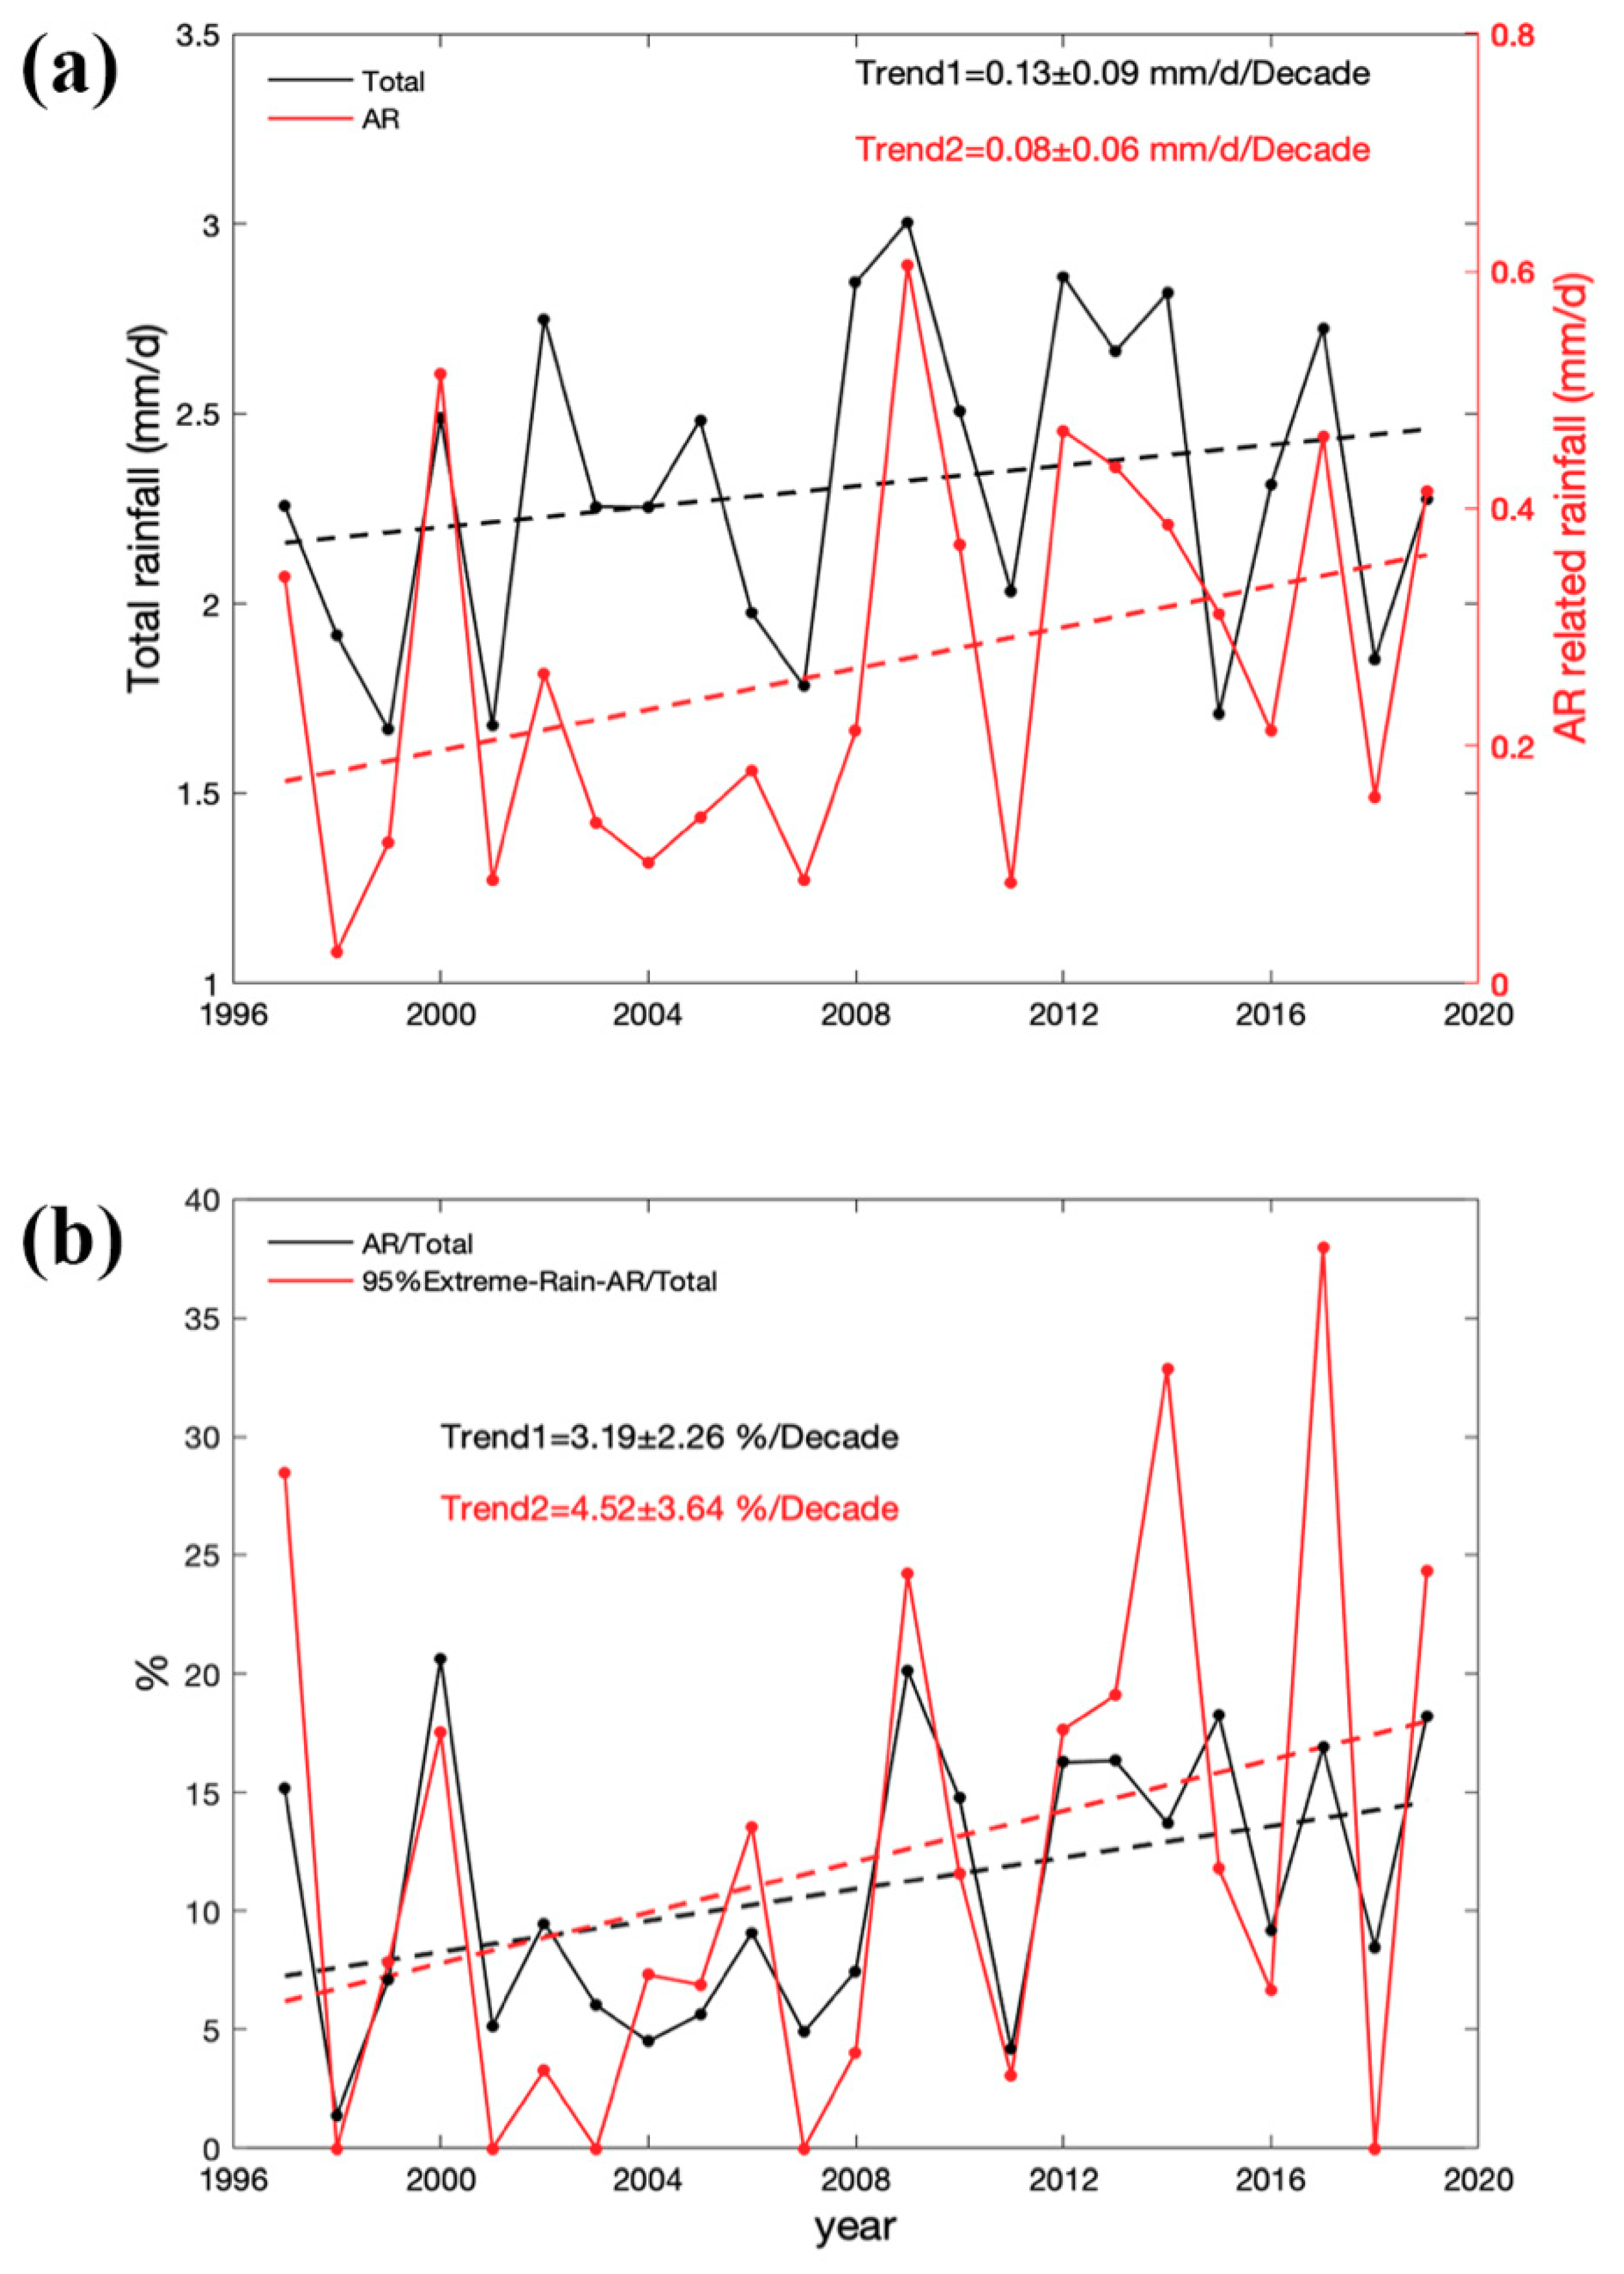
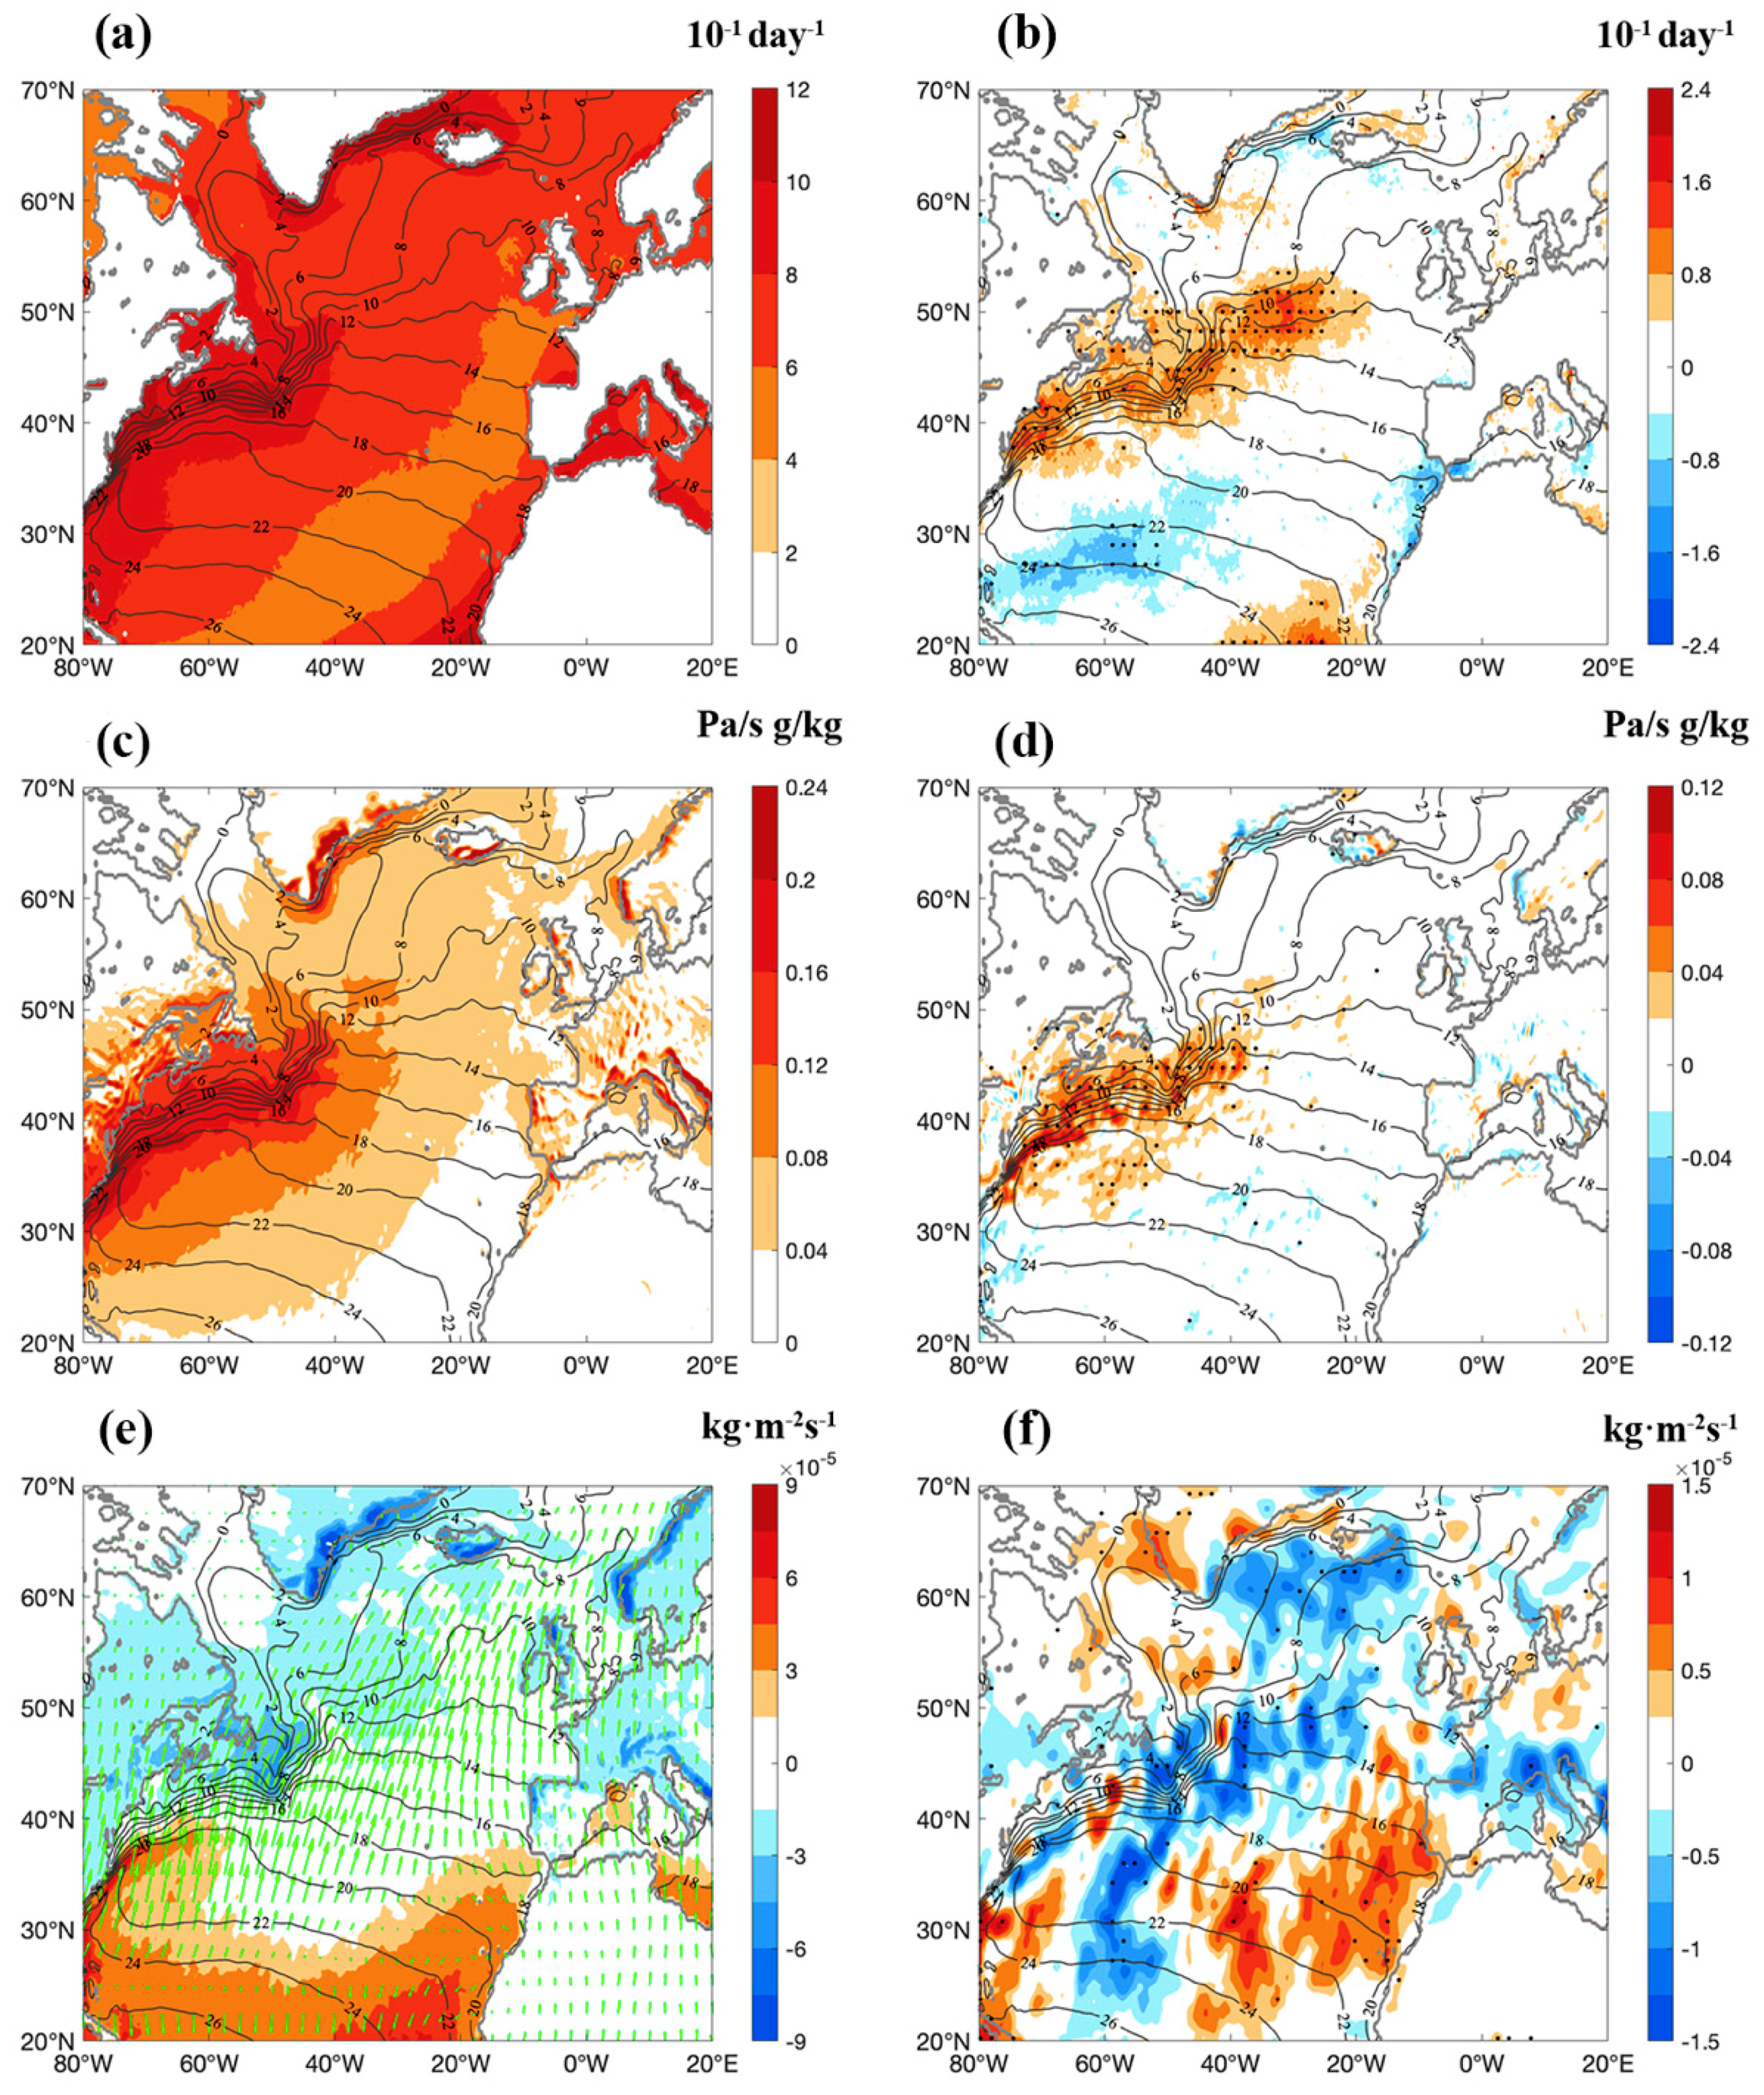
4. Increased Storm Track Activity and AR Frequency

To investigate the effect of the warming SST in the GS front on storm track and ARs, firstly we checked the mean state and the trend of EKE and IVT in the North Atlantic. We used the meridional wind component derived from 6-h ERA5 data after 2–15-d bandpass filtering to represent the EKE of synoptic variations. The maximum EKE region is distributed along the GS front, spread toward the eastern coast of the Atlantic (Figure 4). The mean value (about 150 m2s−2 on the GS front) and the pattern of EKE agree with former studies [24,43,44]. There is a significant positive EKE trend over the GS front and along the North Atlantic Current. The EKE increased about 20–30 m2s−2 in 23 years, which is over 10% of the mean, indicating the locally strengthened and eastward expansion of the storm track in the North Atlantic (Figure 5a). This local strengthening is consistent with the theory of Booth et al. and Small et al. [6,8] that the strength of the storm track is more sensitive to SST value. The eastward expansion of the storm track agrees with former results from numerical experiments with CESM1 in Ciasto et al. [45]. In their Figure 4, the VV200 response in RCP85 (2080–99) displays an increase in the downstream storm track in the experiment with SST difference (the pattern is positive south of 50° N and negative north of 50° N), similar to our SST trend.
The time mean IVT is mainly distributed south of the SST front, along the southern edge of the storm track (Figure 4b). This is reasonable because high IVT filaments (ARs) are mostly distributed at the southeastern part of an EC as they are generally related to the low-level jet stream ahead of the cold front [24,33]. From the 6 h vertical integral of eastward and northward water vapor flux, we calculated AR frequency using the AR detection method in Section 2. We detected a total of 13,000 + ARs (from the data with 6 h intervals) in the North Atlantic region in 1997–2019. The maximum AR frequency was over 10% of the total temporal period (Figure 4c). The maximum frequency was mainly in the south of the GS front and consistent with the IVT maximum. The pattern of AR frequency agrees with former studies [23,46,47,48]. The distribution of a large precipitation zone in mean state (spread along the warm sector of the front, Figure 4d) agrees with the maximum AR frequency, suggesting a close relationship between ARs and rainfall. We noted that there are high-precipitation regions spread along the northern and eastern boundaries of the North Atlantic (for example, the coast of Greenland, Iceland, and continental Western Europe), which might be related to the landfall of ARs in these regions.
The maximum increase of IVT and AR frequency are mainly located along the GS axis (Figure 5b,c), suggesting an increase in AR occurrence and strength. During the 23 years, IVT increased 60 kg·m−1s−1 at the maximum, which is one-quarter of the mean, while the AR frequency increased 6% at the maximum, which is half of the mean, suggesting a significant influence of the warming SST on IVT and AR occurrence. The precipitation is also very sensitive to SST warming (Figure 5d). The increased rainfall originates from the GS front, spreads along the AR migration pathway, and influences Western Europe and Greenland. A positive trend in extreme rainfall in Western Europe in winters from 1950 to 2008 was reported by Łupikasza [49] using precipitation records from meteorology stations. Is this increase of extreme rainfall related to the intensified landfall of ARs?
Landfalling is the main way for ARs to influence a continent. Most extreme precipitation events in Western Europe are reported to be related to landfalling ARs [17,21,46,50]. When a vapor-rich AR with lower-tropospheric moist neutrality and strong horizontal winds encounters mountainous terrain, the AR is forced upwards, at which point orographic enhancement of rainfall can occur, producing extreme precipitation events and catastrophic flooding [10]. In this work, we detected 6900+ landfalling Ars in 1997–2019, almost half of the total ARs detected in the North Atlantic. A high frequency of landfalling of ARs mainly occurs on the Western European continent, such as on the Scandinavian Peninsula and Iberian Peninsula (Figure 6a).
The landfalling AR-related rainfall is shown in Figure 6b. The heavy rainfall is mainly located on the western coast of Europe and southern coast of Iceland, in agreement with former studies (such as Waliser and Guan, and Mattingly et al. [46,51]). Compared with the total rainfall, AR-related precipitation contributes almost half of the total (Figure 6c), which agrees with the findings of Lavers and Villarini [52]. From Figure 6d, after 1997, the frequency of landfalling ARs increased, primarily in the Atlantic in 30–20° W and in Western Europe. We noticed a significant increase in landfalling AR occurrence in the Iberian Peninsula and the Mediterranean Sea over the 23 years. To inspect the relationship between total rainfall and AR-related rainfall, the variations of the two, averaged in the Iberian Peninsula and the Mediterranean Sea region (the blue box in Figure 6d), are plotted in Figure 7a. Although the averaged total rainfall does not have a significant trend between 1997 and 2019, the landfalling AR-related precipitation has a significant positive trend of 0.08 mm/d/decade in that region. From 1997 to 2019, with the increase in the landfalling AR frequency, the proportion of landfalling AR-related rainfall over the total increased about 5% (Figure 7b), while the AR-related extreme rainfall (higher than 95th percentile) increased even more (5–10%). This proved the importance of AR’s landfalling on extreme precipitation in Western Europe.
The former analysis demonstrates that the warming of SST in the GS front resulted in increased AR frequency along the front, triggering more landfalling ARs and more extreme precipitation on the Western European coast. By what mechanism did the increased SST in the GS region intensify the AR activity in the Atlantic?
From the literature, we know that the SST front releases heat and water vapor into the atmosphere and influences the surface convergence of wind, along with the baroclinicity in the lower atmosphere [1,3]. Evidence suggests that increased atmospheric moisture enhances the intensity of AR-related precipitation [53]. To investigate the effect of the increased SST on baroclinicity and atmospheric moisture, we examined the vertically integrated moisture divergence (VIMD), then calculated the Eady growth rate and upward water vapor flux (<wQ>) (Figure 8). The Eady growth rate (also called the Eady index) depends on the ratio between the vertical wind shear and Brunt-Väisälä frequency [38], which combines the wind shear and static stability into a single measure of lower-level baroclinic instability. Consistent with this theory, the maximum of the Eady growth rate is distributed along the SST front. From 1997 to 2019, the Eady growth rate also showed a positive trend along the GS front (Figure 8b), indicating the effect of the warming SST on baroclinic instability. This increased instability also explains the local strengthening of the storm track over the GS front (Figure 5a).
As the forming of ARs is related not only to ECs but also to moisture, we also checked the upward water vapor flux (<wQ>). From Figure 8c, we see that the water vapor flux maximum is distributed along the warm sector of the GS front, which is related to the strong evaporation, wind convergence, and vertical flow over the front. There is a significant positive trend of water vapor flux along the GS axis (Figure 8d), showing that the increased SST increases the baroclinic instability and the moisture content in the atmosphere (which agrees with Jia et al. [54]). VIMD is a parameter with a positive value for moisture diverging and a negative value for concentrating. In an AR, VIMD is mainly negative because of the convergence. The pattern of VIMD and its trend is shown in Figure 8e,f. The mean vertical integrated water vapor flux generally flows from southwest to northeast, with a divergence south of the GS front and convergence north of it. This is because of a larger air-sea temperature difference over the warm sector of the SST front, which enhances evaporation, while the cold sector of the front induces condensation. The negative VIMD along the continental coasts indicates rainfall in these regions, in agreement with the precipitation trends in Figure 4d. The trend of VIMD is negative along the GS front, which is a result of the increased AR occurrence. We also noticed negative VIMD in the Mediterranean Sea region, in agreement with the increased precipitation related to ARs.
Thus, with the increase in SST, baroclinic instability and vertical moisture transport increased along the front. The increased moisture release served as an increased source of water vapor for the ARs, which likely explains why warming in GS induces intensified AR frequency.

5. Discussion and Conclusions

The sea surface temperature (SST) front in the Gulf Stream (GS) extension region is important to synoptic variations in atmosphere. In winter, large amounts of heat and moisture are released from the SST front, modulating the baroclinicity and humidity in the atmosphere, which is important to extratropical cyclones and atmospheric rivers (ARs). Wu et al. [29] recovered a post-1900 surface ocean warming rate over the path of western boundary currents that is two to three times faster than the global mean surface ocean warming rate. In this study, even faster warming along ocean fronts in the GS extension region from 1997 to 2019 was revealed, based on the satellite and reanalysis datasets. The maximum of the warming trend was along the GS front, with an over 2 °C increase over the 23 years and an increased and northward-shifted SST gradient.
Connected with the SST warming trend, significant increases along the GS front were also found from 1997 to 2019 for turbulent heat flux, evaporation, precipitation, and vertical moisture flux fields. The increased heat and moisture in the atmosphere from the ocean front resulted in increased low-level baroclinicity and stronger water vapor transport, which enhanced storm activity and frequency of ARs in the North Atlantic. As a result, the frequency of landfalling ARs on the Western European coast was significantly increased and resulted in increased extreme precipitation events. Especially in the region of the Iberian Peninsula and on the northern coast of the Mediterranean Sea, AR-related extreme rainfall constituted 5–10% more of the total rain in the 23 years.
In this paper, the main purpose was to assess the effect of the increased SST in the GS extension region on atmosphere. What we were most concerned with was the increase in storm activity and AR occurrence frequency linked with the SST warming in the front region. We didn’t consider the patterns of decadal or climatology variation of large-scale SST in the North Atlantic. Our results can serve as proof of those numerical experiments that claim the sensitivity of storms track to SST fronts. To explain more clearly the mechanism by which the warming in the SST fronts can influence AR landfall and heavy rain in Western Europe, a detailed analysis based on numerical experiments is needed, which is beyond the scope of this paper.

Author Contributions

Conceptualization, Y.J. and Y.W.; processed raw data, conducted analysis and made figures, Y.W., Y.J., R.J., and J.Z.; formal analysis, Y.W. and Y.J.; investigation, Y.W. and Y.J.; methodology, Y.J. and Y.W.; supervision, Y.J.; writing—original draft, Y.J. and Y.W. All authors have read and agreed to the published version of the manuscript.

Funding

This research was funded by the National Key R&D Program of China (2017YFC1404101), the Shandong Natural Science Foundation Project (ZR2019ZD12), and the National Natural Science Foundation of China (41975065, 41176004).

Acknowledgments

We thank MDPI English language editing services. The ERA5 data is downloaded from https://cds.climate.copernicus.eu/. The OISST data is https://climatedataguide.ucar.edu/climate-data/sst-data-noaa-high-resolution-025x025-blended-analysis-daily-sst-and-ice-oisstv2. NWARC data can be viewed at https://www.nodc.noaa.gov/OC5/regional_climate/nwa-climate/. The authors are grateful to the three anonymous reviewers who provided insightful and constructive comments that helped to improve this manuscript.

Conflicts of Interest

The authors declare no conflict of interest.

References

  1. Minobe, S.; Kuwano-Yoshida, A.; Komori, N.; Xie, S.-P.; Small, R.J. Influence of the Gulf Stream on the troposphere. Nature 2008, 452, 206. [Google Scholar] [CrossRef]
  2. Minobe, S.; Miyashita, M.; Kuwano-Yoshida, A.; Tokinaga, H.; Xie, S.P. Atmospheric response to the Gulf Stream: Seasonal variations. J. Clim. 2010, 23, 3699–3719. [Google Scholar] [CrossRef] [Green Version]
  3. Kelly, K.A.; Small, R.J.; Samelson, R.M.; Qiu, B.; Joyce, T.M.; Kwon, Y.O.; Cronin, M.F. Western boundary currents and frontal air-sea interaction: Gulf stream and Kuroshio Extension. J. Clim. 2010, 23, 5644–5667. [Google Scholar] [CrossRef]
  4. Joyce, T.M.; Kwon, Y.O.; Yu, L. On the relationship between synoptic wintertime atmospheric variability and path shifts in the Gulf Stream and the Kuroshio Extension. J. Clim. 2009, 22, 3177–3192. [Google Scholar] [CrossRef]
  5. Kuwano-Yoshida, A.; Minobe, S. Storm-track response to SST fronts in the Northwestern Pacific Region in an AGCM. J. Clim. 2017, 30, 1081–1102. [Google Scholar] [CrossRef]
  6. Booth, J.F.; Thompson, L.; Patoux, J.; Kelly, K.A. Sensitivity of midlatitude storm intensification to perturbations in the sea surface temperature near the Gulf Stream. Mon Weather Rev. 2012, 140, 1241–1256. [Google Scholar] [CrossRef]
  7. de Vries, H.; Scher, S.; Haarsma, R.; Drijfhout, S.; van Delden, A. How Gulf-Stream SST-fronts influence Atlantic winter storms: Results from a downscaling experiment with HARMONIE to the role of modified latent heat fluxes and low-level baroclinicity. Clim. Dyn. 2018, 52, 5899–5909. [Google Scholar] [CrossRef] [Green Version]
  8. Small, R.J.; Msadek, R.; Kwon, Y.O.; Booth, J.F.; Zarzycki, C. Atmosphere surface storm track response to resolved ocean mesoscale in two sets of global climate model experiments. Clim. Dyn. 2018, 52, 2067–2089. [Google Scholar] [CrossRef]
  9. Gimeno, L.; Dominguez, F.; Nieto, R.; Trigo, R.; Drumond, A.; Reason, C.J.C.; Taschetto, A.S.; Ramos, A.M.; Kumar, R.; Marengo, J. Major Mechanisms of Atmospheric Moisture Transport and Their Role in Extreme Precipitation Events. Annu. Rev. Environ. Resour. 2016, 41, 117–141. [Google Scholar] [CrossRef] [Green Version]
  10. Ralph, F.M.; Neiman, P.J.; Wick, G.A.; Gutman, S.I.; Dettinger, M.D. Flooding on California’s Russian River: Role of atmospheric rivers. Geophys. Res. Lett. 2006, 33, 13801. [Google Scholar] [CrossRef] [Green Version]
  11. Bao, J.W.; Michelson, S.A.; Neiman, P.J.; Ralph, F.M.; Wilczak, J.M. Interpretation of enhanced integrated water vapor bands associated with extratropical cyclones: Their formation and connection to tropical moisture. Mon. Weather Rev. 2006, 134, 1063–1080. [Google Scholar] [CrossRef]
  12. Neiman, P.J.; Ralph, F.M.; Wick, G.A.; Lundquist, J.D.; Dettinger, M.D. Meteorological characteristics and overland precipitation impacts of atmospheric rivers affecting the West Coast of North America based on eight years of SSM/I satellite observations. J. Hydrometeorol. 2008, 9, 22–47. [Google Scholar] [CrossRef]
  13. Dacre, H.F.; Martínez-Alvarado, O.; Mbengue, C.O. Linking atmospheric rivers and warm conveyor belt airflows. J. Hydrometeorol. 2019, 20, 1183–1196. [Google Scholar] [CrossRef]
  14. Dettinger, M. Climate change, atmospheric rivers, and floods in California—A multimodel analysis of storm frequency and magnitude changes. J. Am. Water Resour. Assoc. 2011, 47, 514–523. [Google Scholar] [CrossRef]
  15. Champion, A.J.; Allan, R.P.; Lavers, D.A. Atmospheric rivers do not explain UK summer extreme rainfall. J. Geophys. Res. Atmos. 2015, 120, 6731–6741. [Google Scholar] [CrossRef]
  16. Lavers, D.A.; Allan, R.P.; Wood, E.F.; Villarini, G.; Brayshaw, D.J.; Wade, A.J. Winter floods in Britain are connected to atmospheric rivers. Geophys. Res. Lett. 2011, 38, 1–8. [Google Scholar] [CrossRef] [Green Version]
  17. Lavers, D.A.; Villarini, G.; Allan, R.P.; Wood, E.F.; Wade, A.J. The detection of atmospheric rivers in atmospheric reanalyses and their links to British winter floods and the large-scale climatic circulation. J. Geophys. Res. Atmos. 2012, 117, 1–13. [Google Scholar] [CrossRef]
  18. Sodemann, H.; Stohl, A. Moisture origin and meridional transport in atmospheric rivers and their association with multiple cyclones. Mon. Weather Rev. 2013, 141, 2850–2868. [Google Scholar] [CrossRef] [Green Version]
  19. Stohl, A.; Forster, C.; Sodemann, H. Remote sources of water vapor forming precipitation on the Norwegian west coast at 608N—A tale of hurricanes and an atmospheric river. J. Geophys. Res. 2008, 113, D05102. [Google Scholar]
  20. Ramos, A.M.; Trigo, R.M.; Liberato, M.L.R.; Tomé, R. Daily precipitation extreme events in the Iberian Peninsula and its association with atmospheric rivers. J. Hydrometeorol. 2015, 16, 579–597. [Google Scholar] [CrossRef]
  21. Eiras-Barca, J.; Brands, S.; Miguez-Macho, G. Seasonal variations in North Atlantic atmospheric river activity and associations with anomalous precipitation over the Iberian Atlantic Margin. J. Geophys. Res. 2016, 121, 931–948. [Google Scholar] [CrossRef] [Green Version]
  22. Lavers, D.A.; Villarini, G. The nexus between atmospheric rivers and extreme precipitation across Europe. Geophys. Res. Lett. 2013, 40, 3259–3264. [Google Scholar] [CrossRef]
  23. Guan, B.; Waliser, D.E. Detection of atmospheric rivers: Evaluation and application of an algorithm for global studies. J. Geophys. Res. 2015, 120, 12514–12535. [Google Scholar] [CrossRef]
  24. Eiras-Barca, J.; Ramos, A.M.; Pinto, J.G.; Trigo, R.M.; Liberato, M.L.R.; Miguez-Macho, G. The concurrence of atmospheric rivers and explosive cyclogenesis in the North Atlantic and North Pacific basins. Earth Syst. Dyn. 2018, 9, 91–102. [Google Scholar] [CrossRef] [Green Version]
  25. Pasquier, J.T.; Pfahl, S.; Grams, C.M. Modulation of Atmospheric River Occurrence and Associated Precipitation Extremes in the North Atlantic Region by European Weather Regimes. Geophys. Res. Lett. 2019, 46, 1014–1023. [Google Scholar] [CrossRef] [Green Version]
  26. Xiong, Y.; Chen, Q.; Ren, X. Influence of boreal winter intraseasonal variation of Aleutian Low on water vapor transport and Atmospheric rivers. Atmosphere 2019, 10, 49. [Google Scholar] [CrossRef] [Green Version]
  27. Tsukijihara, T.; Kawamura, R.; Kawano, T. Influential role of inter-decadal explosive cyclone activity on the increased frequency of winter storm events in Hokkaido, the northernmost island of Japan. Int. J. Climatol. 2019, 39, 1700–1715. [Google Scholar] [CrossRef]
  28. Matthews, T.; Murphy, C.; McCarthy, G.; Broderick, C.; Wilby, R.L. Super Storm Desmond: A process-based assessment. Environ. Res. Lett. 2018, 13, 014024. [Google Scholar] [CrossRef]
  29. Wu, L.; Cai, W.; Zhang, L.; Nakamura, H.; Timmermann, A.; Joyce, T.; McPhaden, M.J.; Alexander, M.; Qiu, B.; Visbeck, M.; et al. Enhanced warming over the global subtropical western boundary currents. Nat. Clim. Chang. 2012, 2, 161–166. [Google Scholar] [CrossRef]
  30. Banzon, V.F.; Reynolds, R.W.; Stokes, D.; Xue, Y. A 1/4-spatial-resolution daily sea surface temperature climatology based on a blended satellite and in situ analysis. J. Clim. 2014, 27, 8221–8228. [Google Scholar] [CrossRef]
  31. Hersbach, H.; Bell, B.; Berrisford, P.; Hirahara, S.; Horányi, A.; Muñoz-Sabater, J.; Nicolas, J.; Peubey, C.; Radu, R.; Schepers, D.; et al. The ERA5 global reanalysis. Q. J. R. Meteorol. Soc. 2020, 146, 1999–2049. [Google Scholar] [CrossRef]
  32. Zhu, Y.; Newell, R.E. A proposed algorithm for moisture fluxes from atmospheric rivers. Mon. Weather Rev. 1998, 126, 725–735. [Google Scholar] [CrossRef]
  33. Ralph, F.M.; Dettinger, M.C.L.D.; Cairns, M.M.; Galarneau, T.J.; Eylander, J. Defining “Atmospheric river”: How the glossary of meteorology helped resolve a debate. Bull. Am. Meteorol. Soc. 2018, 99, 837–839. [Google Scholar] [CrossRef]
  34. Gimeno, L.; Nieto, R.; Vázquez, M.; Lavers, D. Atmospheric rivers: A mini-review. Front. Earth Sci. 2014, 2, 2. [Google Scholar] [CrossRef]
  35. Rutz, J.J.; James Steenburgh, W.; Martin Ralph, F. The inland penetration of atmospheric rivers over western North America: A Lagrangian analysis. Mon. Weather Rev. 2015, 143, 1924–1944. [Google Scholar] [CrossRef]
  36. Ralph, F.M.; Rutz, J.J.; Cordeira, J.M.; Dettinger, M.; Anderson, M.; Reynolds, D.; Schick, L.J.; Smallcomb, C. A scale to characterize the strength and impacts of atmospheric rivers. Bull. Am. Meteorol. Soc. 2019, 100, 269–289. [Google Scholar] [CrossRef]
  37. Shaman, J.; Samelson, R.M.; Skyllingstad, E. Air-sea fluxes over the gulf stream region: Atmospheric controls and trends. J. Clim. 2010, 23, 2651–2670. [Google Scholar] [CrossRef] [Green Version]
  38. Hoskins, B.J.; Valdes, P.J. On the existence of storm tracks. J. Atmos. Sci. 1990, 47, 1854–1864. [Google Scholar] [CrossRef]
  39. Emery, W.J.; Thomson, R.E. Data Analysis Methods in Physical Oceanography, 2nd ed.; Elsevier Science: Amsterdam, The Netherlands, 2001. [Google Scholar]
  40. Fan, M.; Schneider, E.K. Observed decadal North Atlantic tripole SST variability. Part I: Weather noise forcing and coupled response. J. Atmos. Sci. 2012, 69, 35–50. [Google Scholar] [CrossRef]
  41. Seidov, D.; Mishonov, A.; Reagan, J.; Parsons, R. Resilience of the Gulf Stream path on decadal and longer timescales. Sci. Rep. 2019, 9, 1–9. [Google Scholar] [CrossRef] [Green Version]
  42. Seidov, D.; Mishonov, A.; Reagan, J.; Baranova, O.; Cross, S.; Parsons, R. Regional climatology of the northwest Atlantic Ocean: High-resolution mapping of ocean structure and change. Bull. Am. Meteorol. Soc. 2018, 99, 2129–2138. [Google Scholar] [CrossRef]
  43. Sickmöller, M.; Blender, R.; Fraedrich, K. Observed winter cyclone tracks in the northern hemisphere in re-analysed ECMWF data. Q. J. R. Meteorol. Soc. 1999, 126, 591–620. [Google Scholar] [CrossRef]
  44. Small, R.J.; Tomas, R.A.; Bryan, F.O. Storm track response to ocean fronts in a global high-resolution climate model. Clim. Dyn. 2014, 43, 805–828. [Google Scholar] [CrossRef]
  45. Ciasto, L.M.; Li, C.; Wettstein, J.J.; Kvamstø, N.G. North Atlantic storm-track sensitivity to projected sea surface temperature: Local versus remote influences. J. Clim. 2016, 29, 6973–6991. [Google Scholar] [CrossRef]
  46. Waliser, D.; Guan, B. Extreme winds and precipitation during landfall of atmospheric rivers. Nat. Geosci. 2017, 10, 179–183. [Google Scholar] [CrossRef]
  47. Guan, B.; Waliser, D.E.; Martin Ralph, F. An intercomparison between reanalysis and dropsonde observations of the total water vapor transport in individual atmospheric rivers. J. Hydrometeorol. 2018, 19, 321–337. [Google Scholar] [CrossRef]
  48. Xu, G.; Ma, X.; Chang, P.; Wang, L. A comparison of northern hemisphere atmospheric rivers detected by a new image-processing based method and magnitude-thresholding based methods. Atmosphere 2020, 11, 628. [Google Scholar] [CrossRef]
  49. Łupikasza, E.B. Seasonal patterns and consistency of extreme precipitation trends in Europe, December 1950 to February 2008. Clim. Res. 2017, 72, 217–237. [Google Scholar] [CrossRef] [Green Version]
  50. Azad, R.; Sorteberg, A. Extreme daily precipitation in coastal western Norway and the link to atmospheric rivers. J. Geophys. Res. 2017, 122, 2080–2095. [Google Scholar] [CrossRef]
  51. Mattingly, K.S.; Mote, T.L.; Fettweis, X. Atmospheric River Impacts on Greenland Ice Sheet Surface Mass Balance. J. Geophys. Res. Atmos. 2018, 123, 8538–8560. [Google Scholar] [CrossRef] [Green Version]
  52. Lavers, D.A.; Villarini, G. The contribution of atmospheric rivers to precipitation in Europe and the United States. J. Hydrol. 2015, 522, 382–390. [Google Scholar] [CrossRef]
  53. Payne, A.E.; Demory, M.-E.; Leung, L.R.; Ramos, A.M.; Shields, C.A.; Rutz, J.J.; Siler, N.; Villarini, G.; Hall, A.; Ralph, F.M. Responses and impacts of atmospheric rivers to climate change. Nat. Rev. Earth Environ. 2020, 1, 143–157. [Google Scholar] [CrossRef] [Green Version]
  54. Jia, Y.; Chang, P.; Szunyogh, I.; Saravanan, R.; Bacmeister, J.T. A Modeling Strategy for the Investigation of the Effect of Mesoscale SST Variability on Atmospheric Dynamics. Geophys. Res. Lett. 2019, 46, 3982–3989. [Google Scholar] [CrossRef]
Figure 1. Mean sea surface temperature (SST) gradient across the front between 1981 and 2019 in winter months (November to March, NDJFM) in the Gulf Stream extension region from (a) NOAA OISST (Optimum Interpolation Sea Surface Temperature) (°C/100 km) and (b) ERA5 SST (°C/100 km). (c) Mean turbulent heat flux during 1981–2019 (W/m2). (d) As in (c) but for evaporation (mm/d). Contours are mean SST during 1981–2019. The blue box in (a) marks the region (35° N–45° N, 72° W–56° W) used to calculate the regional averaged SST time series in Figure 2. The green line shows the section used to plot the SST profile in Figure 2.
Atmosphere 11 01109 g001
Figure 2. (a) Time series of SST (solid line) averaged in the region (35° N–45° N, 72° W–56° W) from 1981 to 2019 (°C), with linear trend lines from a regression (dashed line). Red is for NOAA OISST and black is for ERA5-SST. The values of the trend (±one standard error) are annotated. The linear trend of 1997–2019 arise significant at the 95% confidence level (Trend 2 and Trend 4). Trends before 1997 (Trend 1 and Trend 3) did not pass the significance test. (b) SST profile along 64° W in 1997 (black) and 2019 (red) from NOAA OISST (°C). (c) As in (b) but for SST gradient (°C/100 km). (d) SST profile along 64° W averaged in 1985–1994 (black) and 2005–2012 (red) from NOAA OISST (°C). (e) As in (d) but for SST gradient (°C/100 km). (f) SST profile along 64° W averaged in 1985–1994 (black) and 2005–2012 (red) from the NWARC dataset (°C). (g) As in (f) but for SST gradient (°C/100 km).
Atmosphere 11 01109 g002
Figure 3. (a) Increase of OISST SST from 1997 to 2019 (°C). (b) As in (a) but for OISST SST gradient (°C/100 km). (c) As in (a) but for turbulent heat flux (W/m2). (d) As in (a) but for evaporation (mm/d). Contours are mean SST between 1997 and 2019 (°C). Black dots mark the region in which the trend passed the 95% significance level.
Atmosphere 11 01109 g003
Figure 4. (a) Mean eddy kinetic energy (EKE) on 300 hPa during 1997–2019 (m2/s2). (b) As in (a) but for IVT (kg·m−1s−1). (c) As in (a) but for AR occurrence frequency (%). (d) As in (a) but for total precipitation (mm/d). Contours are the mean SST between 1997 and 2019 (°C). The frequency is defined as the number of days with an AR divided by the total number of days in winter on each grid.
Atmosphere 11 01109 g004
Figure 5. (a) Increase of EKE on 300 hPa during 1997–2019 (m2/s2). (b) As in (a) but for integrated water vapor transport (IVT) (kg·m−1s−1). (c) As in (a) but for AR frequency (%). (d) As in (a) but for precipitation (mm/d). Contours are the mean SST between 1997 and 2019 (°C). Black dots mark the region in which the trend passed the 95% significance level.
Atmosphere 11 01109 g005
Figure 6. (a) Mean AR landfalling frequency during 1997–2019 (%). (b) As in (a) but for landfalling AR related rainfall (mm/d). (c) Ratio of landfalling AR-related precipitation to total precipitation (%). (d) Increase of landfalling AR frequency (%). Contours are mean SST between 1997 to 2019 (°C). Black dots mark the region in which the trend passed the 95% significance level. The blue box in (d) shows the region (10° W–20° E, 35° N–44° N) used to calculate the regional averaged precipitation in the Iberian Peninsula and the Mediterranean Sea region.
Atmosphere 11 01109 g006
Figure 7. (a) Time series of precipitation (solid line) averaged in region (35° N–44° N, 10° W–20° E) from 1997 to 2019 (mm/d), with linear trend from regression (dashed line). Red is for AR related rainfall and black for total rainfall. The values of the trend (±one standard error) are annotated. Trend 2 (red) is significant at the 90% confidence level while Trend 1 (black) did not pass the significance test. (b) Red lines: ratio of AR-related rainfall to total rainfall; black lines: ratio of AR-related 95% extreme rain to total 95% extreme rain (%). Trend 2 (red) is significant at the 80% confidence level, while Trend 1 (black) is significant at the 90% confidence level.
Atmosphere 11 01109 g007
Figure 8. Left column is the temporal mean during 1997–2019 of (a) Eady growth rate at 850 hPa (10−1 day−1), (c) upward water vapor flux <wQ> at 850 hPa (Pa/s g/kg), (e) mean vertically integrated moisture divergence (kg⋅m−2s−1). The right column is for the same variables as the left but for their increase (b,d,f). Contours are mean SST between 1997 and 2019 (°C). Black dots mark the region in which the trend passed the 95% significance level. Arrow vectors in (e) are the mean vertical integrated water vapor flux (kg⋅m−1s−1).
Atmosphere 11 01109 g008
Publisher’s Note: MDPI stays neutral with regard to jurisdictional claims in published maps and institutional affiliations.

