Article

Carbonaceous Aerosol Emitted from Biofuel Household Stove Combustion in South China

1
School of Environmental Science and Engineering, Sun Yat-sen University, Guangzhou 510000, China
2
Beckhan Guangzhou Environmental Protection Technology Co., Ltd., Guangzhou 510000, China
3
Guangdong Provincial Key Laboratory of Environmental Pollution Control and Remediation Technology, Guangzhou 510000, China
4
Guangzhou Institute of Geochemistry, Chinese Academy of Science, Guangzhou 510000, China
5
South China Institute of Environmental Sciences, Ministry of Environmental Protection, Guangzhou 510000, China
6
School of Agriculture and Environment, Massey University, Palmerston North 4442, New Zealand
7
Department of Biomedical Engineering and Environmental Sciences, National Tsing Hua University, Hsinchu 30013, Taiwan
*
Authors to whom correspondence should be addressed.
Current Address: California Air Resources Board, El Monte, CA 91731, USA.
Atmosphere 2020, 11(1), 112; https://doi.org/10.3390/atmos11010112
Submission received: 6 December 2019 / Accepted: 6 January 2020 / Published: 17 January 2020
(This article belongs to the Special Issue Ambient Aerosol Measurements in Different Environments)

Abstract

:
Near-source measurements of smoke emissions from household stove combustion in a rural area of South China were conducted with 7 typical biomass fuels. Particulate matter samples (both PM10 and PM2.5) were analyzed for their carbonaceous components, including organic and elemental carbon (OC, EC) as well as levoglucosan (molecular tracer of biomass burning), employing thermal-optical and GC-MS analysis. The OC and EC content in PM2.5 and PM10 smoke particles derived from the various types of vegetation showed different patterns with the smallest values observed for straw type fuels. The OC/EC ratios in PM2.5 and PM10 showed an order of straw > hardwood > bamboo > softwood. Mass concentrations of particulate matter emitted from rice straw burning were highest with 12.23 ± 0.87 mg/m3 (PM10) and 9.31 ± 0.81 mg/m3 (PM2.5), while the mass ratios (LG/PM and OC/PM) were lowest among the 7 fuels, indicating that particle emissions from straw burning were higher than those from woody fuels, using similar burning conditions. The levoglucosan emission ratios were rather high and this single most abundant organic species was mainly present in the fine particle mode. Linear correlation analysis showed a strong relationship between levoglucosan and EC emissions.

1. Introduction

Carbonaceous aerosols, comprised of two main components, i.e., organic carbon (OC) and elemental carbon (EC), are large contributors to the fine particle burden in the urban atmosphere and in rural areas. OC, containing polycyclic aromatic hydrocarbons (PAHs) and other organic compounds with possible mutagenic and carcinogenic effects, can be directly emitted from various sources (primary OC) or produced from atmospheric reactions involving gaseous organic precursors (secondary OC) [1,2]. EC (often referred to as black carbon or soot, depending on the measurement method), with a similar chemical structure to impure graphite, is emitted directly during the combustion of carbonaceous fuels. Besides participating in certain chemical reactions in the atmosphere [3], EC is the second-largest contributor to global warming due to its light-absorbing properties after CO2 [4,5,6].
Biomass burning is an important source of global atmospheric pollution and carbonaceous aerosol in particular [7,8,9]. Biomass burning activities can be divided into two types: natural fires, such as wildland and forest fires, and anthropogenic combustion processes, such as residential biofuel utilization (performed daily) and seasonal agricultural residue burning. For example, while investigating source contributions to carbonaceous aerosol in Korea, Jeong et al. [10] found that residential anthropogenic emissions are the most import factor, contributing 74% (9% from fossil fuels and 65% from biofuels) and 78% (42% from fossil fuels and 36% from biofuels) to the ambient OC and EC concentrations, respectively, on an annual mean basis. At present, biomass provides about 10% of the world’s primary energy supplies, most of it being used in developing countries in the form of fuelwood or charcoal for heating and cooking. Although China has experienced rapid economic growth in the past 30 years, biofuels still play a vital role in rural areas as an energy source [11], with contributions up to 23.5% of the total energy consumption in China [12].
As one of the areas with the most serious atmospheric pollution in China, the Pearl River Delta (PRD) is characterized by a complex mix of air pollution sources and atmospheric processes. Despite the high degree of urbanization, biomass burning in rural areas is an important factor contributing to regional atmospheric pollution in the PRD [13]. During autumn and winter, the increasing biomass burning activities in the northern part of the PRD can affect most of the PRD region through the northeast monsoon. Nearly 55% of straw residues are used in domestic energy production in Guangdong province [14].
The main components of biofuels/biomass include cellulose (40–50%), hemicelluloses (20–30%) and lignin (15–35%) [15,16]. Thermal degradation of cellulose and hemicelluloses during biomass combustion produces anhydrosugars, with levoglucosan being the single most abundant organic species found in biomass smoke particles. Levoglucosan is regarded as a superior molecular tracer for biomass burning, owing to the large emissions during biomass combustion and its stability during atmospheric transport [17], although recent laboratory studies have shown possible degradation of levoglucosan in aqueous and heterogeneous phases in the presence of strong oxidants such as OH radical [18,19,20]. Therefore, caution is warranted when using this tracer in source apportionment studies, while in many cases sufficient atmospheric stability may be assumed [21]. Moreover, the pyrolysis of cellulose and hemicelluloses is believed to be the only emission source of levoglucosan, although it has been reported that anhydrosugars are present in particulate matter generated from incense burning and cooking, which are of substantially smaller magnitude [22,23], rendering levoglucosan an important molecular tracer for biomass burning emissions.
The emission characteristics, including type and amounts of emitted pollutants, i.e., emission factors and inventories from residential stoves, are highly dependent on the design and construction material of the stoves, as well as the biomass fuels used. Previous burning experiments under controlled combustion conditions in western countries mainly focused on wood-burning stoves, fireplaces and wood furnaces, which are typically used in North America and Europe [24,25,26]. Limited research on emissions from household cooking stoves using biomass fuels has been conducted in Asia [27,28]. Considering the difference in design and utilization patterns of stoves in western countries from those in Asia, and even between North and South China, a large variation is expected in the emission patterns and pollutant characteristics. In addition, the combustion efficiency of Chinese cooking stoves is relatively low compared to the foreign counterparts, and hence the measurement results of pollutant emissions from stove combustion as reported in the literature from western countries may not be applicable to China. Therefore, this report provides results from field measurements of emissions from typical combustion of household biomass fuels in South China’s PRD region. The main purpose of this study was to characterize PM emissions in terms of OC, EC, and levoglucosan content from typical biofuels used in South China.

2. Experiments

2.1. Sampling

Sampling was performed in Shixing (N 24.90°, E 114.16°), a rural area of Shaoguan, in the north of Guangdong Province. The region is characterized by the subtropical monsoon climate, with an annual average temperature of 23 °C. As this region is covered by large forests, biomass fuels are readily available from forests aside from agricultural residues. Consequently, wood and agricultural residue burning is a common energy source. Thus, smoke particles derived from biomass burning contribute significantly to PM pollution over the entire region of the PRD. The biomass fuels selected in this study represent those typically used by local rural households and their characteristics are summarized in Table 1. The biomass categories include woods (hardwood and softwood) and straws. Bamboo, a woody plant in contrast to grass-type plants, was also evaluated in this study and was treated separately.
The stove used in this study was a typical brick stove found in village kitchens (Figure 1). It consists of four ovens and four fuel entrances, built on the floor with a flue attached to one side of the wall and a chimney extending to the second floor of the residence [29]. The burning cycle consisted of heating a specific amount of water from room temperature to its boiling point and keeping the water boiling to the end of the burning cycle. The typical sampling period was 1 h. During this period, the woman of the household was in charge of feeding fuel into the stove in batches consistent with typical local practices [30]. The particle collection instruments were Mini-volume samplers operating at a flow rate of 5 L min−1 (Airmetrics, Eugene, OR, USA). The samplers were set at about 1.5 m downwind from the chimney on the second floor at nearly 3 m height above ground. Both PM10 and PM2.5 aerosol samples were collected on 47 mm quartz fiber filters. The ambient temperature during the experiments ranged from 19 to 30 °C, while the relative humidity (RH) varied from 26% to 80%, with wind speeds between 0 and 4 m·s−1.

2.2. Quality Assurance and Quality Control (QA/QC)

Prior to sampling, the quartz filters were baked at 450 °C for 8 h to remove organic carbon. The filters were weighed, following conditioning under controlled temperature and humidity conditions (23 ± 1 °C, 40% RH) for 24 h before and after sampling, in order to determine PM mass concentrations. All samples were stored at −15 °C prior to extraction and analysis. During the sampling period, PM10 and PM2.5 blank samples were collected periodically to account for background effects. The chemical analysis procedures included the use of internal standards to account for errors, such as loss due to volatilization or incomplete extraction and derivatization.

2.3. Elemental Analysis

The elemental composition of the individual biomass fuels was determined with an elemental analyzer (Elementar Vario ELIII). Samples were combusted in an aluminum container at 950 °C over a catalyst in an oxygen atmosphere. The elements (C, H and N) were oxidized to CO2, H2O, and NOx, respectively, and subsequently separated on selective trap columns, followed by detection with a thermal conductivity detector (TCD).

2.4. OC/EC Analysis

An area of 1.5 cm2 of each quartz filter sample was used for OC/EC analysis. A Sunset Laboratory Carbon Analyzer (Sunset, Tigard, OR, USA) was used in this study to determine the carbonaceous aerosol portion using the thermal-optical transmittance (TOT) protocol (National Institutes of Safety and Health). The individual carbon fractions evolving from the filters during the analysis process were oxidized to carbon dioxide over a high-temperature manganese dioxide catalyst and the carbon dioxide was subsequently reduced to methane. Finally, the methane was quantified using a flame ionization detector (FID). The FID response was calibrated with known quantities of CO2 and CH4 gases and micropipette deposits on filters of sucrose and potassium hydrogen phthalate (KHP) solutions. The limits of detection (LOD) for OC and EC were 0.1 µgC cm−2, and the measurement precision was <10% for both carbon fractions.

2.5. GC-MS Analysis

Half of each filter sample was extracted ultrasonically three times for 15 min with 30 mL dichloromethane/methanol (1:1, v:v) in thick-wall sealed bottles (pre-baked for 4 h). The solvent extracts were pooled and then reduced to about 1.5 mL using a rotary vacuum evaporator. Subsequently, the extracts were concentrated to 0.5 mL by a mild stream of ultra-pure nitrogen gas. The concentrated extracts were treated with N,O-Bis (trimethylsilyl) trifluoroacetamide (BSTFA) containing 1% trimethylchlorosilane and 10 µL pyridine for 1 h at 70 °C to derivatize OH groups, such as in levoglucosan, to trimethylsilyl esters. The silylated extracts were dried under nitrogen flow to remove the remaining BSTFA and pyridine and then taken up into n-hexane prior to GC injection. All samples were analyzed using an Agilent 6890GC/5973MSD system equipped with an HP-5 capillary column (length 30 m, inside diameter 0.25 mm, film thickness 0.25 μm) operating in the electron impact (EI) ionization mode (70 eV). 400 μL C13-labeled levoglucosan was injected into each sample as an internal standard before chemical analysis for quantification of levoglucosan. More details about the GC-MS method can be found elsewhere [31].

3. Results and Discussions

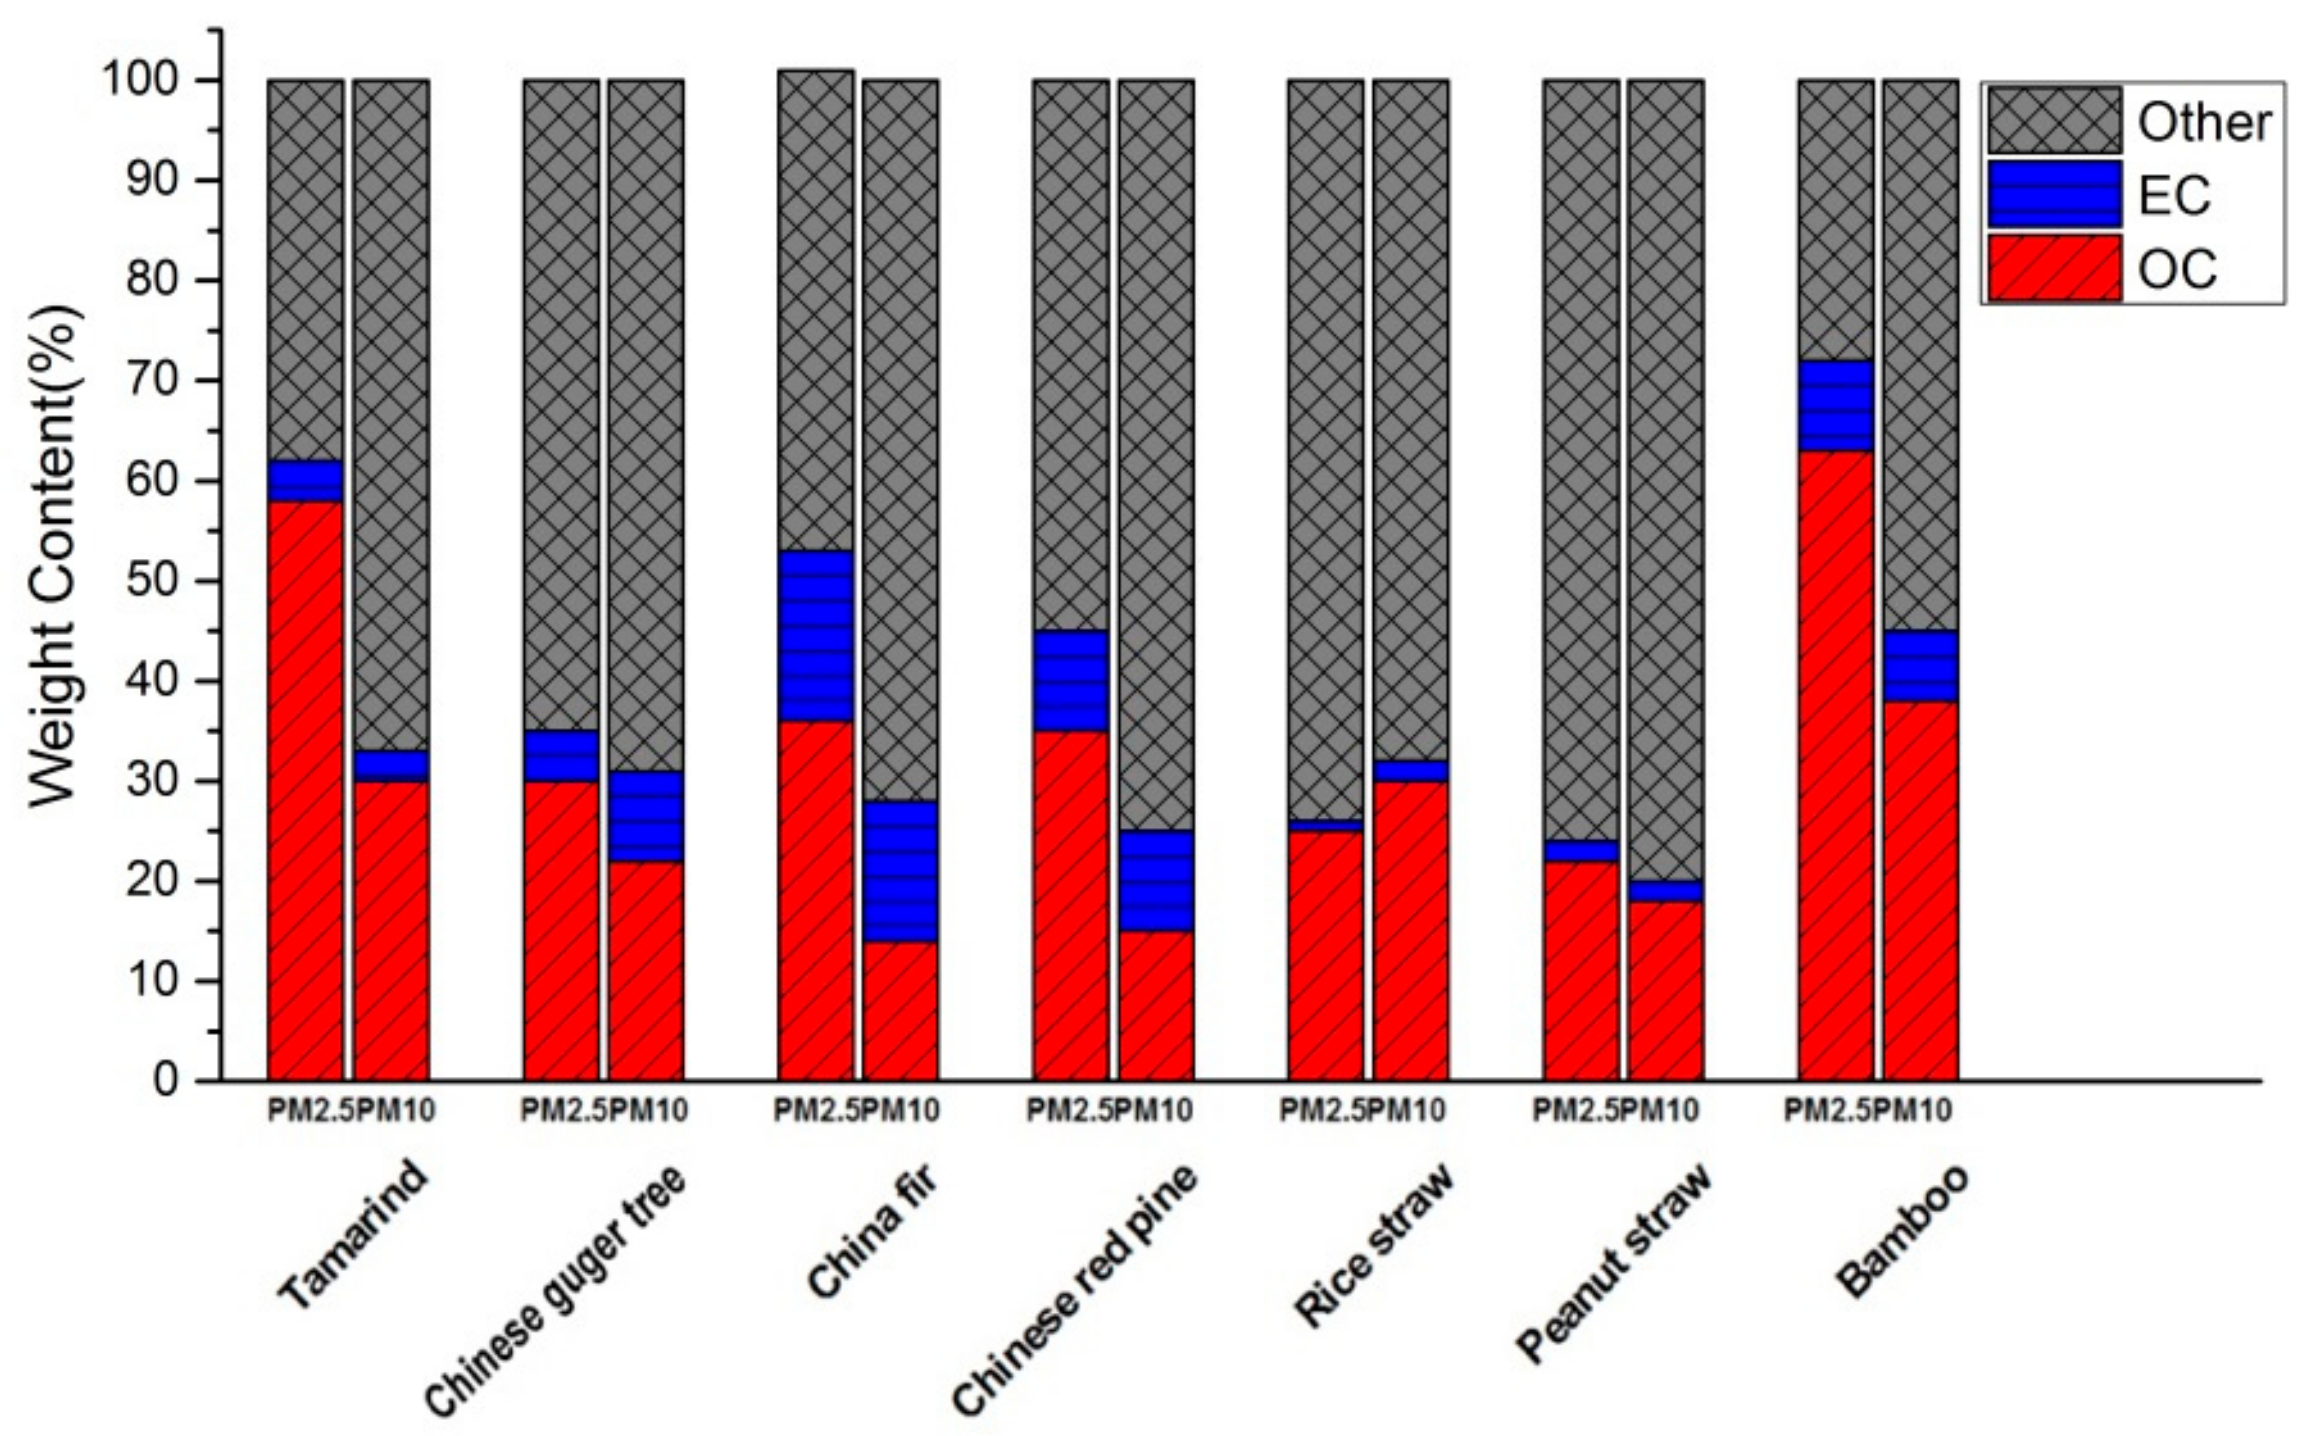
3.1. OC and EC Content in Smoke Aerosols

Mass ratios of OC and EC to PM (OC/PM, EC/PM), as shown in Figure 2, were computed in order to elucidate the characteristics of carbonaceous aerosol emitted from residential biomass fuel combustion. Comparison of the mass ratios revealed the following pattern: bamboo (0.63 and 0.38) > hardwoods (0.44 and 0.26) > softwoods (0.36 and 0.15) > straws (0.24 and 0.24) for OC/PM10 and OC/PM2.5, respectively. Among the 7 biomass fuels investigated in this study, bamboo was the highest with average OC mass ratios of 0.63 ± 0.17 and 0.38 ± 0.09, respectively, in PM10 and PM2.5, while Chinese fir had the lowest average OC content in PM10 with a mass ratio of 0.14 ± 0.01, and peanut straw was the lowest in terms of the OC/PM2.5 ratio (0.22 ± 0.03). The EC mass ratios in both PM10 and PM2.5 had the following order: softwoods > bamboo > hardwoods > straws. The highest EC content was measured for Chinese fir both in PM10 and PM2.5, while the straws had low EC fractions, such as rice straw with an average EC mass ratio of 0.01 ± 0.01 in PM2.5. Compared with charcoal burning [31], OC/PM2.5 mass ratios in this study were relatively smaller, while EC/PM2.5 mass ratios were similar.
Under similar combustion conditions, PM and OC concentrations of straws were much higher than those of woody fuels, which is in agreement with previous findings [30,32,33,34]. Meanwhile, woods and bamboo showed substantially higher EC mass ratios than straws. The probable reason for this observation is that woody fuels have higher lignin content and more compact fibers relative to straws [35]. Higher lignin content causes larger emissions of soot [36]. Li et al. [33] pointed out that the volatile matter in woody fuels, characterized by compact fibers, was released slowly and is more completely burned than in straws with loose fibers. Meanwhile, EC (at times also called “soot”, especially by the combustion community) is preferentially formed under conditions in which insufficient oxygen supply results in incomplete oxidation, such as during predominantly flaming fires. It is, therefore, obvious that higher lignin content and more compact vegetation fibers would increase oxygen consumption, which would affect the EC content in the resulting smoke emissions.

3.2. OC/EC Ratios

The ratio of OC to EC (OC/EC) is a useful parameter to help distinguish different sources of carbonaceous aerosol [37,38,39,40]. The OC/EC ratios of smoke aerosol derived from the seven biomass fuels from this study are presented in Table 2. For PM10, the OC/EC ratios of rice straw were the highest with an average value of 18.53 ± 5.40, while the Chinese fir was the lowest with a ratio of 0.55 ± 0.53. A similar pattern was observed in PM2.5 with the highest ratio in rice straw smoke (20.02 ± 5.70), while the Chinese fir was lowest with 1.64 ± 1.41. The average OC/EC values of all the biomass fuels investigated in this study were 7.65 ± 6.77 in PM10 and 9.38 ± 7.01 in PM2.5. To some extent, OC/EC ratios could be used to distinguish smoldering and flaming combustion phases during biomass burning. The OC/EC ratios obtained from smoldering combustion were higher than those under flaming conditions, as observed by Li et al. [33], which is especially the case in open field burning. Flaming fires were dominant during woody fuel combustion, while the smoldering phase dominated in case of straw combustion in this study. Consequently, OC/EC ratios of smoke particles released during the combustion of woody fuels are relatively lower than those of straw fuels.
In fine smoke particles (PM2.5), the OC/EC ratios obtained in this study were similar to those observed by Li et al. (2009) in carbonaceous aerosol emitted from household stoves in North China, whereas they differ from those reported in western studies. For instance, the OC/EC ratios in this study were significantly lower than those from the combustion studies by Oros et al. [41,42,43]. Moreover, OC/EC ratios of hardwoods were higher than those of softwoods in our study, whereas Oros et al. [41,42,43] found that softwoods were characterized by higher OC/EC ratios. Possible reasons for the variation in OC/EC ratios among the different studies are as follows. First, the particle size of the carbonaceous aerosols affects the OC/EC values. EC is found mainly in sub-micrometer particles (PM1.0), whereas OC is found both in sub- and super micrometer particles (PM10) [44]. Thus, the OC/EC ratios vary with particle size, as was found in this study with OC/EC values in PM2.5 being higher than those in PM10. The particle size in the studies by Oros et al. [42] was PM2.0, which may explain the differences in ratios between the studies to some extent. Second, different parts of woody fuels may generate smoke particles with different relative abundance in OC and EC, providing an additional explanation for the observed differences in OC/EC ratios. Previous studies found that fruit and leaves were the main sources of aerosol emissions during biomass combustion among all the parts of a plant [45]. In the study conducted by Oros et al. [41,42], branches (1–2 cm diameter), needles (dry and green) with bleed resin and conifer cones were selected for the softwood combustion experiments, while branches (1–2 cm diameter), leaves (dry and green) with gums and mucilage were available for hardwood experiments. However, only branches (2–5 cm diameter) were chosen in this study to simulate the local household combustion practices. Third, different combustion conditions play an important role in affecting the results from the various combustion experiments. Oros et al. [41,42] used “complete controlled fire burning of all samples to the embers”. Zhang et al. [46] used a combustion chamber to simulate the household stove burning with both smoldering and flaming phases. However, the combustion conditions, including flame temperature, ventilation, and oxygen supply in simulated lab experiments are different from realistic field measurements, critically affecting the results [47,48,49,50].

3.3. Levoglucosan Content

Levoglucosan (LG) concentrations in smoke aerosol particles derived from the seven biofuel species are presented in Figure 3. The relative abundance of LG in PM10 and PM2.5 was similar among all fuels, indicating that levoglucosan was mainly present in PM2.5. The LG fraction in fine particles observed here agrees with previous studies [51,52,53]. In PM10, the LG concentration for rice straw reached 0.21 mg/m3, while Chinese fir smoke had the lowest LG concentration of 0.03 mg/m3. In PM2.5, the LG concentration of tamarind was relatively high (0.18 mg/m3), and the Chinese fir was lowest among all species with an average value of 0.04 mg/m3.
The LG mass ratios (mg/mg of PM mass) of the seven biofuel species are presented in Figure 4, showing the LG distribution as a function of particle size and fuel type. Peanut and rice straw had the lowest LG content among all species in this study. The reason for this is that the content of cellulose and hemicelluloses, the parent compounds of levoglucosan, is lower in straws than in woody fuels [35]. The LG concentrations of rice straw smoke particles showed a distinct distribution between PM2.5 and PM10 (Figure 3), indicating a significant portion of LG to be present in the coarse mode (PM10–2.5). Engling et al. [52] reported LG size distributions in rice straw smoke particles derived from open field burning, with LG in coarse particles (PM10–2.5) occupying only 1–5% of total LG emissions (ng/m3), which is in contrast to the results of the present study. The combustion conditions and specific burning practices were likely the main reasons for the difference in LG size distributions. Specifically, the abundant oxygen supply in open fires leads to more complete combustion compared to stove combustion, resulting in larger emissions of fine particles. On the other hand, abundant fresh straw in open fires, without sufficient drying, reduces the combustion temperature in the initial burning stage [54], which is an important factor affecting the pyrolysis of cellulose and hemicelluloses. In the case of field burning of rice straw in Taiwan, the straw is spread in thin layers across the (wet) ground, which further reduces the flame temperature and thus the combustion efficiency [52,55]. Stove temperatures can be raised to 300 or 400 °C quickly through manual continuous fuel feeding, at which temperatures LG emission in carbonaceous fuel combustion commences. However, due to the fast burning of rice straw, the frequency to feed straws into the stove is much higher than for other fuels, which leads to longer times for the smoldering phase. Meanwhile, oxygen is limited in stove combustion, which prevents temperatures from reaching higher levels, thus limiting the combustion efficiency. Consequently, a larger abundance of coarse particles in the smoke emissions affects the size distribution of LG, which may be one reason for the larger coarse mode fraction of LG observed in this study.

3.4. LG/OC and LG/EC Ratios

The OC, EC, and LG concentrations in PM2.5 and PM10 of each biomass category are only slightly different, which is due to most of the carbonaceous PM mass typically being present in fine particles, especially in case of smoke aerosol derived from biomass burning. Correlation analysis of OC, EC, and LG revealed a good linear relationship between EC and LG emitted from various biomass fuels except for bamboo, likely due to the relatively smaller sample number (Figure 5; the level of significance is presented in Table 3). Peanut straw was entirely excluded from the correlation analysis due to the small number of samples. The average correlation coefficient (R2) was 0.76, while the R2 of rice straw had a high value of 0.95 for the correlation between LG and EC, indicating a strong relationship between LG and EC emissions. These findings are valuable for biomass/biofuel combustion research, as they imply little variability in the relative abundance of carbonaceous species between individual burns, while in previous studies such factors were not presented [41,42,43,46]. Moreover, levoglucosan is typically the main organic component in biofuel combustion emissions, and LG and OC are co-emitted during cellulose pyrolysis, resulting in a high correlation between these two carbonaceous species, except for bamboo (Figure 6). LG/OC ratios are of importance as they can be used for distinguishing different biomass burning sources, as has been demonstrated in previous studies [56,57], as well as for semi-quantitative estimates of biomass burning contributions to ambient PM levels [13,58,59,60,61].
As shown in Table 3, the maximum LG/EC ratio was found for tamarind (4.69), while that of the Chinese fir was the lowest (0.09). The LG/OC ratios display different patterns, with Tamarind emissions showing the highest ratios (0.27) and those of peanut straw the lowest (0.02), reflecting the relative abundance in OC and EC, as presented above. LG/OC ratios of the two straws are similar, while they are much lower than those in woody fuel emissions. There is little research reporting the relationship between LG and EC. Mochida et al. [21] plotted the ratios of LG/EC versus LG/OC for aerosols from a remote marine site and those from various emission sources, in order to assess the influence of biomass burning on the LG concentrations at the sampling site. LG/EC ratios from biomass burning source emissions were not included. The LG/EC ratios in biomass burning source emissions are obviously different from those in atmospheric aerosol due to the influence of multiple sources on ambient aerosol. Rice straw is one of the most universal biofuels subject to burning worldwide and has, therefore, been investigated in several combustion studies [52,62,63,64]. Rice straw combustion in a catalyst-equipped wood stove in South Asia resulted in LG/EC and LG/OC ratios of 1.66 and 0.03, respectively [64]. In the study by Zhang et al. [46], rice straw was burned in a combustion chamber simulating household burning in South China, which gave rise to LG/EC and LG/OC ratios of 0.64 and 0.08, respectively. Further, a commercial wood-burning fireplace was applied for rice straw burning in the western US, revealing LG/EC and LG/OC values of 0.19 and 0.03, respectively [65]. While the ratios obtained in these three studies are different from those observed in the present study, smoke particles generated during rice straw open burning in Taiwan showed comparable ratios of LG/EC (0.86) and LG/OC (0.04) to the values measured in this study [66]. In addition, it is noteworthy that the average LG/EC ratio of tamarind was substantially higher than the respective ratios from any other biofuel in this study, which may be due to the fresh nature of the tamarind. Sullivan et al. [67] reported that LG/EC ratios of fresh biofuels are significantly higher than those of dry fuels, which seems to be reflected in the ratios of carbonaceous species in the tamarind smoke aerosol from this study as well.

4. Conclusions

The smoke aerosol emissions from household stove combustion of Chinese fir, Chinese pine, tamarind, Chinese gugar tree, bamboo, rice straw, and peanut straw were analyzed for OC, EC, and levoglucosan. Distinct characteristics of carbonaceous aerosol emitted from the various biomass burning sources can be summarized as follows: 1. Carbonaceous material comprised the majority of the particle mass and the carbonaceous components were mainly contained in fine particles (PM2.5); 2. The OC/EC ratio is an important parameter to characterize various aerosol emission sources, and particularly the contribution of biomass smoke; 3. Levoglucosan/EC and Levoglucosan/OC ratios can be used as potential indicators in biomass burning studies to distinguish various vegetation types. Specifically, the highest OC/EC ratios were observed for straw and the lowest values for softwood. Considering the effect of different combustion conditions on the resulting smoke particle characteristics, further work should be concentrated on the burning process and the burning products in different burning stages, e.g., flaming and smoldering phases, as well as the influence of fuel moisture content. Moreover, other important organic components should be quantified, especially different potential molecular biomass burning tracers and organic compounds contributing to aerosol light absorption, e.g., brown carbon.

Author Contributions

Conceptualization, Y.Z. (Yinan Zhang) and H.F.; Funding acquisition, Y.Z. (Yinan Zhang) and G.F.Z.; Field study, Y.Z. (Yanan Zhou) and L.Z.; Laboratory analyses, H.F., X.D. and X.W.; Data reduction, H.F. and Y.Z. (Yanan Zhou); Manuscript preparation, X.S.-A., H.F., G.F.Z. and G.E.; Project supervision, Y.Z. and G.E. All authors have read and agreed to the published version of the manuscript.

Funding

This study was supported by China Natural Science Fund (No. 40975078) and the Scientific Research Foundation for Youth Scholars of Sun Yat-sen University (No.11lgpy86).

Acknowledgments

All chemical analyses were provided by the Guangzhou Institute of Geochemistry, Chinese Academy of Sciences and Guangdong Provincial Key Laboratory of Environmental Pollution Control and Remediation Technology.

Conflicts of Interest

The authors declare no conflict of interest.

References

  1. Pandis, S.N.; Harley, R.A.; Cass, G.R.; Seinfeld, J.H. Secondary organic aerosol formation and transport. Atmos. Environ. 1992, 26, 2269–2282. [Google Scholar] [CrossRef]
  2. Turpin, B.J.; Huntzicker, J.J. Identification of secondary organic aerosol episodes and quantification of primary and secondary organic aerosol concentrations during SCAQS. Atmos. Environ. 1995, 29, 3527–3544. [Google Scholar] [CrossRef]
  3. Gundel, L.A.; Guyot-Sionnest, N.S.; Novakov, T. A study of the interaction of NO2 with carbon Particles. Aerosol Sci. Technol. 1989, 10, 343–351. [Google Scholar] [CrossRef]
  4. Bond, T.C.; Doherty, S.J.; Fahey, D.W.; Forster, P.M.; Berntsen, T.; Deangelo, B.J.; Flanner, M.G.; Ghan, S.; Karcher, B.; Koch, D.; et al. Bounding the role of black carbon in the climate system: A scientific assessment. J. Geophys. Res. 2013, 118, 5380–5552. [Google Scholar] [CrossRef]
  5. Hansen, J.; Sato, M.; Ruedy, R.; Lacis, A.; Oinas, V. Global warming in the twenty-first century: An alternative scenario. Proc. Natl. Acad. Sci. USA 2000, 97, 9875–9880. [Google Scholar] [CrossRef] [Green Version]
  6. Jacobson, M.Z. Strong radiative heating due to the mixing state of black carbon in atmospheric aerosols. Nature 2001, 409, 695–697. [Google Scholar] [CrossRef]
  7. Engling, G.; Gelencser, A. Atmospheric Brown Clouds: From Local Air Pollution to Climate Change. Elements 2010, 6, 223–228. [Google Scholar] [CrossRef]
  8. Laskin, A.; Laskin, J.; Nizkorodov, S.A. Chemistry of Atmospheric Brown Carbon. Chem. Rev. 2015, 115, 4335–4382. [Google Scholar] [CrossRef] [Green Version]
  9. Bonvalot, L.; Tuna, T.; Fagault, Y.; Jaffrezo, J.L.; Jacob, V.; Chevrier, F.; Bard, E. Estimating contributions from biomass burning, fossil fuel combustion, and biogenic carbon to carbonaceous aerosols in the Valley of Chamonix: A dual approach based on radiocarbon and levoglucosan. Atmos. Chem. Phys. 2016, 16, 13753–13772. [Google Scholar] [CrossRef] [Green Version]
  10. Jeong, J.I.; Park, R.J.; Woo, J.H.; Han, Y.J.; Yi, S.M. Source contributions to carbonaceous aerosol concentrations in Korea. Atmos. Environ. 2011, 45, 1116–1125. [Google Scholar] [CrossRef]
  11. Cui, H.; Mao, P.; Zhao, Y.; Nielsen, C.P.; Zhang, J. Patterns in atmospheric carbonaceous aerosols in China: Emission estimates and observed concentrations. Atmos. Chem. Phys. 2015, 15, 8657–8678. [Google Scholar] [CrossRef] [Green Version]
  12. Demirbas, A. Potential applications of renewable energy sources, biomass combustion problems in boiler power systems and combustion related environmental issues. Prog. Energy Combust. Sci. 2005, 31, 171–192. [Google Scholar] [CrossRef]
  13. Zhang, Z.S.; Engling, G.; Lin, C.Y.; Chou, C.C.K.; Lung, S.C.C.; Chang, S.Y.; Fan, S.J.; Chan, C.Y.; Zhang, Y.H. Chemical speciation, transport and contribution of biomass burning smoke to ambient aerosol in Guangzhou, a mega city of China. Atmos. Environ. 2010, 44, 3187–3195. [Google Scholar] [CrossRef]
  14. Tian, H.Z.; Zhao, D.; Wang, Y. Emission inventories of atmospheric pollutants discharged from biomass burning in China. Acta Sci. Circumst. 2011, 31, 349–357. [Google Scholar]
  15. Sergejewa, A.S. Chemie des Holzes und der Cellulose; Theodor Steinkopff Verlag: Dresden, Germany, 1959. [Google Scholar]
  16. Petterson, R.C. The chemical compostion of wood. In Chemistry of Solid Wood; Rowell, R., Ed.; American Chemical Society: Washington, DC, USA, 1984; pp. 57–126. [Google Scholar]
  17. Fraser, M.P.; Lakshmanan, K. Using levoglucosan as a molecular marker for the long-range transport of biomass combustion aerosols. Environ. Sci. Technol. 2000, 34, 4560–4564. [Google Scholar] [CrossRef]
  18. Hennigan, C.J.; Sullivan, A.P.; Collett, J.L.; Robinson, A.L. Levoglucosan stability in biomass burning particles exposed to hydroxyl radicals. Geophys. Res. Lett. 2010, 37, L09806. [Google Scholar] [CrossRef] [Green Version]
  19. Hoffmann, D.; Tilgner, A.; Iinuma, Y.; Herrmann, H. Atmospheric Stability of Levoglucosan: A Detailed Laboratory and Modeling Study. Environ. Sci. Technol. 2010, 44, 694–699. [Google Scholar] [CrossRef]
  20. Lai, C.Y.; Liu, Y.C.; Ma, J.Z.; Ma, Q.X.; He, H. Degradation kinetics of levoglucosan initiated by hydroxyl radical under different environmental conditions. Atmos. Environ. 2014, 91, 32–39. [Google Scholar] [CrossRef]
  21. Mochida, M.; Kawamura, K.; Fu, P.Q.; Takemura, T. Seasonal variation of levoglucosan in aerosols over the western North Pacific and its assessment as a biomass-burning tracer. Atmos. Environ. 2010, 44, 3511–3518. [Google Scholar] [CrossRef] [Green Version]
  22. Tsai, Y.I.; Wu, P.L.; Hsu, Y.T.; Yang, C.R. Anhydrosugar and sugar alcohol organic markers associated with carboxylic acids in particulate matter from incense burning. Atmos. Environ. 2010, 44, 3708–3718. [Google Scholar] [CrossRef]
  23. Hou, X.M.; Zhuang, G.S.; Lin, Y.F.; Li, J.; Jiang, Y.L.; Fu, J.S. Emission of fine organic aerosol from traditional charcoal broiling in China. J. Atmos. Chem. 2008, 61, 119–131. [Google Scholar] [CrossRef]
  24. Calvo, A.I.; Martins, V.; Nunes, T.; Duarte, M.; Pont, V.; Castro, A.; Fraile, R.; Tarelho, L.; Alves, C. Residential wood combustion in two domestic devices: Relationship of different parameters throughout the combustion cycle. Atmos. Environ. 2015, 116, 72–82. [Google Scholar] [CrossRef]
  25. Gonçalves, C.; Alves, C.; Fernandes, A.P.; Monteiro, C.; Tarelho, L.; Evtyugina, M.; Pio, C. Organic compounds in PM emitted from fireplace and woodstove 2.5 combustion of typical Portuguese wood species. Atmos. Environ. 2011, 45, 4533–4545. [Google Scholar] [CrossRef] [Green Version]
  26. Vicente, E.D.; Duarte, M.A.; Tarelho, L.A.C.; Nunes, T.F.; Amato, F.; Querol, X.; Colombi, C.; Gianelle, V.; Alves, C.A. Particulate and gaseous emissions from the combustion of different biofuels in a pellet stove. Atmos. Environ. 2015, 120, 15–27. [Google Scholar] [CrossRef]
  27. Ni, H.Y.; Han, Y.M.; Cao, J.; Chen, L.W.A.; Tian, J.; Wang, X.L.; Chow, J.C.; Watson, J.G.; Wang, Q.Y.; Wang, P.; et al. Emission characteristics of carbonaceous particles and trace gases from open burning of crop residues in China. Atmos. Environ. 2015, 123, 399–406. [Google Scholar] [CrossRef]
  28. Lai, A.M.; Carter, E.; Shan, M.; Ni, K.; Clark, S.; Ezzati, M.; Wiedinmyer, C.; Yang, X.; Baumgartner, J.; Schauer, J.J. Chemical composition and source apportionment of ambient, household, and personal exposures to PM2.5 in communities using biomass stoves in rural China. Sci. Total Environ. 2019, 646, 309–319. [Google Scholar] [CrossRef]
  29. Zhang, J.; Smith, K.R.; Ma, Y.; Ye, S.; Jiang, F.; Qi, W.; Liu, P.; Khalil, M.A.K.; Rasmussen, R.A.; Thorneloe, S.A. Greenhouse gases and other airborne pollutants from household stoves in China: A database for emission factors. Atmos. Environ. 2000, 34, 4537–4549. [Google Scholar] [CrossRef] [Green Version]
  30. Li, X.H.; Duan, L.; Wang, S.X.; Duan, J.C.; Guo, X.M.; Yi, H.H.; Hu, J.N.; Li, C.; Hao, J.M. Emission characteristics of particulate matter from rural household biofuel combustion in China. Energy Fuel 2007, 21, 845–851. [Google Scholar] [CrossRef]
  31. Alves, C.A.; Duarte, M.; Nunes, T.; Moreira, R.; Rocha, S. Carbonaceous particles emitted from cooking activities in Portugal. Glob. NEST J. 2014, 16, 411–419. [Google Scholar]
  32. Vicente, E.D.; Duarte, M.A.; Calvo, A.I.; Nunes, T.F.; Tarelho, L.A.C.; Custódio, D.; Colombi, C.; Gianelle, V.; Sanchez de la Campa, A.; Alves, C.A. Influence of operating conditions on chemical composition of particulate matter emissions from residential combustion. Atmos. Environ. 2015, 166, 92–100. [Google Scholar] [CrossRef]
  33. Li, X.H.; Wang, S.X.; Duan, L.; Hao, J.M. Characterization of non-methane hydrocarbons emitted from open burning of wheat straw and corn stover in China. Environ. Res. Lett. 2009, 4, 044015. [Google Scholar] [CrossRef]
  34. Wu, X.; Vu, T.V.; Shi, Z.; Harrison, R.M.; Liu, D.; Cen, K. Characterization and source apportionment of carbonaceous PM2.5 particles in China—A review. Atmos. Environ. 2018, 189, 187–212. [Google Scholar] [CrossRef]
  35. McKendry, P. Energy production from biomass (part 1): Overview of biomass. Bioresour. Technol. 2002, 83, 37–46. [Google Scholar] [CrossRef]
  36. Wiinikka, H. High Temperature Aerosol Formation and Emission Minimisation during Combustion of Wood Pellets. Ph.D. Thesis, Lulea University of Technology, Piteå, Sweden, 2005. [Google Scholar]
  37. Novakov, T.; Andreae, M.O.; Gabriel, R.; Kirchstetter, T.W.; Mayol-Bracero, O.L.; Ramanathan, V. Origin of carbonaceous aerosols over the tropical Indian Ocean: Biomass burning or fossil fuels? Geophys. Res. Lett. 2000, 27, 4061–4064. [Google Scholar] [CrossRef]
  38. Pio, C.; Cerqueira, M.; Harrison, R.M.; Nunes, T.; Mirante, F.; Alves, C.; Oliveira, C.; de la Campa, A.S.; Artinano, B.; Matos, M. OC/EC ratio observations in Europe: Re-thinking the approach for apportionment between primary and secondary organic carbon. Atmos. Environ. 2011, 45, 6121–6132. [Google Scholar] [CrossRef]
  39. Popovicheva, O.B.; Kozlov, V.S.; Engling, G.; Diapouli, E.; Persiantseva, N.M.; Timofeev, M.A.; Fan, T.S.; Saraga, D.; Eleftheriadis, K. Small-Scale Study of Siberian Biomass Burning: I. Smoke Microstructure. Aerosol Air Qual. Res. 2015, 15, 117–128. [Google Scholar] [CrossRef] [Green Version]
  40. Srinivas, B.; Sarin, M.M. PM2.5, EC and OC in atmospheric outflow from the Indo-Gangetic Plain: Temporal variability and aerosol organic carbon-to-organic mass conversion factor. Sci. Total Environ. 2014, 487, 196–205. [Google Scholar] [CrossRef]
  41. Oros, D.R.; Simoneit, B.R.T. Identification and emission factors of molecular tracers in organic aerosols from biomass burning Part 1. temperate climate conifers. Appl. Geochem. 2001, 16, 1513–1544. [Google Scholar] [CrossRef]
  42. Oros, D.R.; Mazurek, M.A.; Baham, J.E.; Simoneit, B.R.T. Organic tracers from wild fire residues in soils and rain/river wash-out. Water Air Soil Pollut. 2002, 137, 203–233. [Google Scholar] [CrossRef]
  43. Oros, D.R.; bin Abas, M.R.; Omar, N.Y.M.J.; Rahman, N.A.; Simoneit, B.R.T. Identification and emission factors of molecular tracers in organic aerosols from biomass burning: Part 3. Grasses. Appl. Geochem. 2006, 21, 919–940. [Google Scholar] [CrossRef]
  44. Neusüß, C.; Gnauk, T.; Plewka, A.; Herrmann, H.; Quinn, P.K. Carbonaceous aerosol over the Indian Ocean: OC/EC fractions and selected specifications from size-segregated onboard samples. J. Geophys. Res. 2002, 107, INX2 30-1–INX2 30-13. [Google Scholar] [CrossRef]
  45. Rogge, W.F.; Hildemann, L.M.; Mazurek, M.A.; Cass, G.R. Sources of fine organic aerosol. 4. Particulate abrasion products from leaf surfaces of urban plants. Environ. Sci. Technol. 1993, 27, 2700–2711. [Google Scholar] [CrossRef]
  46. Zhang, Y.X.; Shao, M.; Zhang, Y.H.; Zeng, L.M.; He, L.Y.; Zhu, B.; Wei, Y.J.; Zhu, X.L. Source profiles of particulate organic matters emitted from cereal straw burnings. J. Environ. Sci. 2007, 19, 167–175. [Google Scholar] [CrossRef]
  47. Simoneit, B.R.T.; Rogge, W.F.; Mazurek, M.A.; Standley, L.J.; Hildemann, L.M.; Cass, G.R. Lignin pyrolysis products, lignans, and resin acids as specific tracers of plant classes in emissions from biomass combustion. Environ. Sci. Technol. 1993, 27, 2533–2541. [Google Scholar] [CrossRef]
  48. Simoneit, B.R.T.; Schauer, J.J.; Nolte, C.G.; Oros, D.R.; Elias, V.O.; Fraser, M.P.; Rogge, W.F.; Cass, G.R. Levoglucosan, a tracer for cellulose in biomass burning and atmospheric particles. Atmos. Environ. 1999, 33, 173–182. [Google Scholar] [CrossRef]
  49. Simoneit, B.R.T.; Rogge, W.F.; Lang, Q.; Jaffé, R. Molecular characterization of smoke from campfire burning of pine wood (Pinus elliottii). Chemosphere Glob. Chang. Sci. 2000, 2, 107–122. [Google Scholar] [CrossRef]
  50. Fine, P.M.; Cass, G.R.; Simoneit, B.R.T. Chemical characterization of fine particle emissions from fireplace combustion of woods grown in the northeastern United States. Environ. Sci. Technol. 2001, 35, 2665–2675. [Google Scholar] [CrossRef]
  51. Simoneit, B.R.T.; Didyk, B.M. The lipid and resin composition of Laretia compacta Phil. from the andes of Chile. Zeitschrift fuer Naturforschung C 1999, 54, 309–313. [Google Scholar] [CrossRef]
  52. Engling, G.; Lee, J.J.; Tsai, Y.W.; Lung, S.C.; Chou, C.K.; Chan, C.Y. Size-resolved anhydrosugar composition in smoke aerosol from controlled field burning of rice straw. Aerosol Sci. Technol. 2009, 43, 662–672. [Google Scholar] [CrossRef]
  53. Zhang, Z.S.; Gao, J.; Engling, G.; Tao, J.; Chai, F.H.; Zhang, L.M.; Zhang, R.J.; Sang, X.F.; Chan, C.Y.; Lin, Z.J.; et al. Characteristics and applications of size-segregated biomass burning tracers in China’s Pearl River Delta region. Atmos. Environ. 2015, 102, 290–301. [Google Scholar] [CrossRef]
  54. Shafizadeh, F. The Chemistry of Pyrolysis and Combustion. In Chemistry of Solid Wood; Rowell, R., Ed.; Advances in Chemistry: Washington, DC, USA, 1984; Volume 207, pp. 489–529. [Google Scholar]
  55. Engling, G.; Lee, J.J.; Sie, H.J.; Wu, Y.C.; Yet-Pole, I. Anhydrosugar characteristics in biomass smoke aerosol-case study of environmental influence on particle-size of rice straw burning aerosol. J. Aerosol Sci. 2013, 56, 2–14. [Google Scholar] [CrossRef]
  56. Zdrahal, Z.; Oliveira, J.; Vermeylen, R.; Claeys, M.; Maenhaut, W. Improved method for quantifying levoglucosan and related monosaccharide anhydrides in atmospheric aerosols and application to samples from urban and tropical locations. Environ. Sci. Technol. 2002, 36, 747–753. [Google Scholar] [CrossRef] [PubMed]
  57. Puxbaum, H.; Caseiro, A.; Sanchez-Ochoa, A.; Kasper-Giebl, A.; Claeys, M.; Gelencser, A.; Legrand, M.; Preunkert, S.; Pio, C. Levoglucosan levels at background sites in Europe for assessing the impact of biomass combustion on the European aerosol background. J. Geophys. Res. 2007, 112, D23S05. [Google Scholar] [CrossRef] [Green Version]
  58. Zhu, C.; Kawamura, K.; Kunwar, B. Effect of biomass burning over the western North Pacific Rim: Wintertime maxima of anhydrosugars in ambient aerosols from Okinawa. Atmos. Chem. Phys. 2015, 15, 1959–1973. [Google Scholar] [CrossRef]
  59. Li, Q.; Wang, N.; Barbante, C.; Kang, S.; Yao, P.; Wan, X.; Barbaro, E.; del Carmen Villoslada Hidalgo, M.; Gambaro, A.; Li, C.; et al. Levels and spatial distributions of levoglucosan and dissolved organic carbon in snowpits over the Tibetan Plateau glaciers. Sci. Total Environ. 2018, 612, 1340–1347. [Google Scholar] [CrossRef] [PubMed]
  60. Mkoma, S.L.; Kawamura, K.; Fu, P.Q. Contributions of biomass/biofuel burning to organic aerosols and particulate matter in Tanzania, East Africa, based on analyses of ionic species, organic and elemental carbon, levoglucosan and mannosan. Atmos. Chem. Phys. 2013, 13, 10325–10338. [Google Scholar] [CrossRef] [Green Version]
  61. Li, J.; Wang, G.; Zhang, Q.; Li, J.; Wu, C.; Jiang, W.; Zhu, T.; Zeng, L. Molecular characteristics and diurnal variations of organic aerosols at a rural site in the North China Plain with implications for the influence of regional biomass burning. Atmos. Chem. Phys. 2019, 19, 10481–10496. [Google Scholar] [CrossRef] [Green Version]
  62. Hays, M.D.; Fine, P.M.; Geron, C.D.; Kleeman, M.J.; Gullett, B.K. Open burning of agricultural biomass: Physical and chemical properties of particle-phase emissions. Atmos. Environ. 2005, 39, 6747–6764. [Google Scholar] [CrossRef]
  63. Jenkins, B.M.; Jones, A.D.; Turn, S.Q.; Williams, R.B. Emission factors for polycyclic aromatic hydrocarbons from biomass burning. Environ. Sci. Technol. 1996, 30, 2462–2469. [Google Scholar] [CrossRef]
  64. Sheesley, R.J.; Schauer, J.J.; Chowdhury, Z.; Cass, G.R.; Simoneit, B.R.T. Characterization of organic aerosols emitted from the combustion of biomass indigenous to South Asia. J. Geophys. Res. 2003, 108, 4285. [Google Scholar] [CrossRef] [Green Version]
  65. Reinhardt, E.D.; Keane, R.E.; Calkin, D.E.; Cohen, J.D. Objectives and considerations for wildland fuel treatment in forested ecosystems of the interior western United States. For. Ecol. Manag. 2008, 256, 1997–2006. [Google Scholar] [CrossRef]
  66. Lee, J.J.; Engling, G.; Lung, S.C.; Lee, K.Y. Particle size characteristics of levoglucosan in ambient aerosols from rice straw burning. Atmos. Environ. 2008, 42, 8300–8308. [Google Scholar] [CrossRef]
  67. Sullivan, A.P.; Holden, A.S.; Patterson, L.A.; McMeeking, G.R.; Kreidenweis, S.M.; Malm, W.C.; Hao, W.M.; Wold, C.E.; Collett, J.L. A method for smoke marker measurements and its potential application for determining the contribution of biomass burning from wildfires and prescribed fires to ambient PM2.5 organic carbon. J. Geophys. Res. 2008, 113, D22302. [Google Scholar] [CrossRef]
Figure 1. Household stove used in this study.
Atmosphere 11 00112 g001
Figure 2. OC (organic carbon) and EC (elemental carbon) mass ratios in PM2.5 and PM10 emitted by combustion of different biofuel species.
Atmosphere 11 00112 g002
Figure 3. Levoglucosan concentrations in PM10 and PM2.5 emitted by combustion of different biofuel species.
Atmosphere 11 00112 g003
Figure 4. Levoglucosan mass ratios in PM2.5 and PM10 emitted by combustion of different biofuel species.
Atmosphere 11 00112 g004
Figure 5. Correlations between LG and EC for different biofuel species.
Atmosphere 11 00112 g005
Figure 6. Correlations between LG and OC for different biofuel species.
Atmosphere 11 00112 g006
Table 1. Vegetation species used in this study, including their classification and elemental composition.
NameLatin NameFamilyVegetation ClassificationBiofuel ClassificationC (%)H (%)N (%)C/N
TamarindTamarindus indicaFabaceaeWoody plantHard wood44.226.360.13344.39
Chinese guger treeSchima superba Gardn TheaceaeWoody plantHard wood45.026.450.13338.50
Chinese firPinaceaePinaceaeWoody plantSoftwood47.146.500.11416.34
Chinese red pinepinus Massoniana lambPinaceaeWoody plantSoftwood46.716.520.07714.60
BambooBambooPoaceaeWoody plant45.676.370.31145.63
Rice strawOryza glaberrimaPoaceaeHerbStraw38.735.640.7750.58
Peanut strawArachis hypogaeaFabaceaeHerbStraw39.405.911.1035.95
Table 2. OC, EC and total carbon (TC) mass ratios and OC/EC ratios in PM2.5 and PM10 emitted by combustion of different biofuel species.
Biofuel ClassificationBiofuel SpeciesPMSample Numbers (n)OC (mg/mg)EC (mg/mg)TC (mg/mg)OC/EC
Hard woodTamarindPM2.550.58 ± 0.090.04 ± 0.020.63 ± 0.1015.4 ± 3.35
PM1050.30 ± 0.160.03 ± 0.010.33 ± 0.1610.2 ± 6.59
Chinese guger treePM2.570.30 ± 0.120.05 ± 0.010.35 ± 0.116.73 ± 2.73
PM1050.22 ± 0.100.09 ± 0.010.31 ± 0.265.73 ± 4.36
SoftwoodChina firPM2.550.36 ± 0.320.17 ± 0.040.53 ± 0.321.64 ± 1.41
PM1040.14 ± 0.0540.14 ± 0.0120.28 ± 0.0660.55 ± 0.53
Chinese red pinePM2.530.35 ± 0.070.10 ± 0.040.44 ± 0.073.91 ± 3.00
PM1030.15 ± 0.060.10 ± 0.020.25 ± 0.081.45 ± 0.36
StrawRice strawPM2.550.25 ± 0.060.01 ± 0.010.26 ± 0.0620.0 ± 5.70
PM1040.30 ± 0.070.02 ± 0.010.32 ± 0.3018.5 ± 5.40
Peanut strawPM2.520.22 ± 0.020.02 ± 0.000.24 ± 0.0210.28
PM1020.18 ± 0.110.02 ± 0.010.20 ± 0.119.50 ± 2.07
BambooBambooPM2.540.63 ± 0.170.09 ± 0.040.72 ± 0.157.84 ± 3.69
PM1040.38 ± 0.090.07 ± 0.030.45 ± 0.076.28 ± 3.10
Table 3. OC, EC, and LG concentrations, as well as LG/EC and LG/OC ratios in smoke particles derived from different biofuel species.
TamarindChinese Guger TreeChina FirChinese Red PineRice StrawPeanut StrawBamboo
Samples (n)8773826
LG (mg/m3)0.170.030.020.050.100.030.13
OC (mg/m3)0.640.360.430.402.731.041.26
EC (mg/m3)0.040.060.280.150.130.100.13
LG/EC (w/w)4.690.500.090.330.780.220.96
R20.840.860.820.990.950.28
p0.010.010.010.050.01 0.16
LG/OC (w/w)0.270.080.060.120.040.020.10
R20.810.970.960.990.97−0.11
p0.010.010.010.050.01 0.53

