Article

Indications of Ground-based Electromagnetic Observations to A Possible Lithosphere–Atmosphere–Ionosphere Electromagnetic Coupling before the 12 May 2008 Wenchuan MS 8.0 Earthquake

1
China Earthquake Networks Center, China Earthquake Administration, Beijing 100045, China
2
The Institute of Earthquake Forecasting, China Earthquake Administration, Beijing 100036, China
3
The Institute of Crustal Dynamics, China Earthquake Administration, Beijing 100085, China
*
Author to whom correspondence should be addressed.
Atmosphere 2019, 10(7), 355; https://doi.org/10.3390/atmos10070355
Submission received: 17 May 2019 / Revised: 24 June 2019 / Accepted: 25 June 2019 / Published: 27 June 2019
(This article belongs to the Special Issue Lithosphere–Atmosphere–Ionosphere Coupling (LAIC) Models)

Abstract

:
A large number of various precursors have been reported since the Wenchuan MS 8.0 earthquake (EQ) took place on 12 May 2008 in China. In this work, previous investigations of both ground-based electromagnetic (EM) parameters and spatial ionospheric parameters were first examined. The statistical results showed that various anomalies presented different time-scale variations but tended to be characterized by a common feature – reaching their climax on 9 May, three days before the Wenchuan event, which indicates a lithosphere–atmosphere–ionosphere (LAI) electromagnetic coupling. Second, the fluctuations on 9 May based on the observational ground-based ultra low frequency (ULF) electrical field at the Gaobeidian (GBD) station and the direct current/ultra low frequency (DC–ULF) geomagnetic vertical Z field at the Chengdu (CD) station were comparably analyzed with those of ionospheric disturbances reported previously. The results showed that distinct electromagnetic changes, geomagnetic “double low-point” phenomena, and ionospheric disturbances above both sides of the Earth started in turn, respectively, but reached their climax simultaneously within dozens of hours on 9 May. This evolutionary process increases the probability that electromagnetic energy propagates from the epicentral area, via the atmosphere and ionosphere, to the equatorial plane, and through this plane finally to its magnetically conjugated area in the opposite hemisphere, causing electromagnetic disturbances on the Earth’s surface, in the atmosphere, and in the ionosphere and its conjugate point, in that order.

1. Introduction

Ground-based electromagnetic (EM) observation is one of the geophysical methods employed early to search precursors related to seismic activities. Many observational and investigative studies have been performed in Russia, Greece, Japan, America, and China and abundant earthquake (EQ) data have been obtained as well. An important characteristic of probable EM precursors is their appearance in a wide frequency band, covering from the direct current/ultra low frequency (DC–ULF), very low frequency (VLF), and low frequency (LF) to very high frequency (VHF) ranges. The ULF band has been gaining more attention because only EM signals originating from the epicenter depths of EQs can be easily recorded at the Earth’s surface without significant attenuation [1]. As typical examples, unusual ULF (f < 10 Hz) EM emissions were recorded 12 days prior to the Loma Prieta Ms 7.1 EQ, on 17 October 1989 and 3–5 days prior to the great crustal MS 6.9 EQ at Spitak, Armenia, on 7 December 1988. The abnormities occurred a maximum of 3 h before the Spitak event, 4 h before the Loma Prieta event, and 5 h before the 8 September 2017 offshore Chiaps MW 8.1 EQ [2,3,4,5,6]. Possible seismic-related ULF anomalies have also occurred about one month and a few days before the 8 August 1993 MS 8.0 Guam EQ [7,8], ≈2 weeks before the L’Aquila M 6.3 EQ on 6 April 2009 at a distance up to 630 km [9], and three days before the Vrancea MW 5.7 EQ on 24 September 2016 [10].
Satellite Earth observation has gradually shown its application potential in fields of EQ local mechanism investigation, EQ monitoring and prediction, and defense and rescue in the case of seismic disasters because of its advantages of fast-speed, large-scale and high-resolution results, especially for areas with harsh natural conditions. As early as in 1965, Davies and Baker [11] found irregularities in the ionospheric sounder data before the Alaskan EQ that took place on 28 March 1964. As the result of research undertaken over the last ten years, it has been shown that the ionosphere is unexpectedly extremely sensitive to seismic effect. Ionospheric disturbances can be considered as short-time (usually less than two weeks) precursors, although the appearance of changes in the ionosphere is not firmly established before all EQs [12,13,14,15,16,17,18,19], especially after the launch of DEMETER (Detection of Electro-Magnetic Emissions Transmitted from EQ Regions) in June 2004 [20]. It is the first satellite used specifically to study the influence of seismic activities on ionospheric parameters [21].
The China Seismo-Electromagnetic Satellite (CSES, also called ZH-1) was launched successfully on 2 February 2018. It is the first geophysical field measurement satellite and space-based platform for EQ research in China [22]. The primary study on four EQs with a magnitude of more than 7.0 occurring during August 2018 was performed by Yan et al. [23], and the results showed that unusual features in waves, plasma, and energetic particle fluxes can be recorded when the satellite flies over regions that include epicenters of future EQs.
In very recent years, with the development of integration observation of space and Earth, a promising way to improve our understanding of unusual EM phenomena during strong EQs is to combine ground data analysis with satellite Earth Observation (EO) [24]. On the one hand, scientists acknowledge that a seismic EM anomaly is a climax of some process which begins a few days before the main event and remains until a few days after it [17]. On the other hand, increasingly more evidence shows that during the last stage of the long process of preparation, an energy transfer can occur between the lithosphere and the two layers above, that is, the atmosphere and the ionosphere, so as to introduce the concept of a lithosphere–atmosphere–ionosphere coupling (LAIC) among these three involved layers of the Earth system [25,26,27,28]. At present, the LAIC mechanism and the LAIC model are still an issue being discussed by many scientists worldwide [28,29,30,31].
A large EQ with a magnitude MS 8.0 hit Wenchuan, Sichuan province, China at 14:28:01 CST (China Standard Time) on 12 May 2008 with an epicenter located at 31.0°N and 103.4°E and a depth of 19 km. This event caused major extensive damage and 69,000 people lost their lives [32]. Thanks to the development of current comprehensive observing technologies, a large number of investigation papers on this event appeared in the following ten years. Ma and Wu [33] conducted a statistical work on more than 200 papers depicting precursors related to this EQ, and the topics included seismic deformation, strain/stress, structure variations, gravity and broadband seismic recordings, as well as geomagnetic, geothermal, atmospheric, and ionospheric anomalies. One interesting result shows that the percentage of anomalies appearing 2 to 3 days prior to the Wenchuan main event is 29%, the highest one among 12 time-scale anomalies from 30–10 years to 6–0 h prior to the EQ (see Figure 1 in this paper and also refer to Figure 3b in [33]). The key point is that these anomalies are almost EM variations recorded by ground-based installations and ionospheric satellites according to the paper’s context [33]. Obviously, an LAI EM coupling may have occurred before the Wenchuan main shock.
The topic considered in this paper examines the questions of whether there is a relationship among various EM disturbances registered from the Earth to the ionosphere according to the time of their occurrence, and whether this relationship can give a hint about the mechanism of this LAI electromagnetic coupling. Therefore, in Section 2 of this paper, we first review previous studies on electromagnetic parameters from ground-based electromagnetic observations to ionospheric observations. Then, in Section 3, new observational results about these parameters are comparatively presented. Discussion and conclusions are presented in Section 4 and Section 5, respectively.

2. Previous Studies on Electromagnetic Variations during the Wenchuan MS 8.0 Earthquake

2.1. Ground-based Electromagnetic Anomalies

Many researchers have investigated the EM effects since the occurrence of the Wenchuan MS 8.0 EQ on 12 May 2008. These studies were mainly based on the ground-based ultra low frequency/extremely low frequency (ULF–ELF) EM data [32,34,35,36,37,38,39,40,41] and DC–ULF geomagnetic data [42,43,44,45,46,47,48,49,50,51].

2.1.1. Anomalous Emissions on the ULF–ELF Electrical Field

It has been reported that many kinds of electrical anomalies occurred during the Wenchuan MS 8.0 EQ. Gao et al. [34] reported a 1–5 order increase of ULF–ELF (0.5–39 Hz) electromagnetic fields and a coseismic response at Longnan station, 320 km away from the Wenchuan epicenter. Ma [35] and An et al. [36] presented DC–ULF (0–0.005 Hz) electrical anomalies at eight observing stations in the range of 40–600 km of the Wenchuan epicentral distances. Ding et al. [37] displayed obvious ULF (0.001–20 Hz) electrical emissions from December 2007 to April 2008 at the Jinhe station 35 km away. Furthermore, using FFT and wavelet methods, Zhang et al. [38] obtained spectrum variations which occurred at that station during the Wenchuan EQ.
Li et al. [32,40,41] reported the outstanding electrical emissions which occurred at the Hebei ULF (0.1–10 Hz) EM observing network in northern China during the Wenchuan MS 8.0 EQ. The Hebei EM observing network was established during 1980s around the area of Beijing in northern China after the occurrence of the Tangshan MS 7.8 EQ on 28 July 1976. The network includes eight ULF (0.1–10 Hz) EM observing stations, named Langfang (LF), Sanhe (SH), Qingxian (QX), Huailai (HL), Changli (CL), Bazhou (BZ), Gaobeidian (GBD), and Ningjin (NJ), respectively (see Figure 2a).
Two pairs of electrodes are installed along perpendicular axes and they form two observing components SN (south-north) and EW (east-west). To reduce the effects of polarization potential, the electrodes of the sensor are made of high-quality stainless steel (Cr18Ni9C), and are cylinder-shaped with a height of 300 mm and a radius of 4 mm; each pair of electrodes is buried 12 m beneath the Earth and 40 m apart. All wires used for signal transmission are screened by high-quality metal nets, covered by waterproof pipes, and buried 0.6–0.8 m below the surface.
An observing system called E-EM measures the potential difference between the two electrodes. A recording device called DJ-1 outputs the signals using two writing needles, which are perpendicular to the recording paper surrounding a drum. The drum rotates automatically with a speed of 1 mm s−1 and six parallel lines per hour are usually left on the paper. A blank recording paper replaces the last one at 0900 local time (LT) every day. In general, the equipment is calibrated every year to avoid instrumental drift and runs stably without background noise. It is free of annual variation, seasonal variation, rain, temperature, and magnetic storm. However, interference pulses due to low-sky or sky-to-ground lightning strikes are sometimes recorded but they are easy to identify. More details of the observation system can be found in [32] and [52,53,54,55].
At that time, three out of four running stations recorded obvious EM signals. The emissions recorded at the GBD station (Δ = 1440 km) are the most typical: most signals in the SN component before 9 May 2008; an abrupt enhancement on 9 May in SN and EW components; climax emissions in both components during the period of 9–17 May; and main signals in SN again after 17 May 2008 (see Figure 2b).

2.1.2. Variations on the DC–ULF Geomagnetic Field

In the 1980s, a network of geomagnetic analog observation stations was constructed in China after the occurrence of the 28 July 1976 Tangshan MS 7.8 EQ. As one of the scientific achievements during the 10th Five-Year Plan, the digital geomagnetic observation network was put into service in 2007 in China. There are about 45 independent stations and two geomagnetic seismic arrays, one involving 7 stations in northwest China and the other with 6 stations in the southwest. The experimental equipment called GM4 is used to measure relative variations of three components of magnetic oscillations, namely, horizontal H, vertical Z, and declination D. The magnetometer works in the DC–ULF frequency band of 0–0.3 Hz and the magnetic noise level in this frequency band is less than 0.1 nT. The data from each sensor are digitized at a sampling frequency of 1 Hz and stored in a 1 GB CF memory card. More details on the observing mechanism and data output of this equipment can be found in Wang et al. [56].
Based on this DC–ULF geomagnetic observing network in China, anomalous changes concerning the Wenchuan MS 8.0 EQ have already been reported with different time scales. Using the rescaled range analysis (R/S) method, Li et al. [50] presented a decrease on the Hurst exponent and an increase on the fractal dimension 2–3 months before the Wenchuan event by processing 2-year geomagnetic vertical Z data at the Tianshui station (TS station in Figure 3 in this paper). Zhang et al. [42] reported that a positive anomaly range on the total geomagnetic field expanded from the end of April 2008 near the Wenchuan epicenter area. It reached its maximum on 10 May and disappeared on 12 May 2008 immediately after the Wenchuan shock.
It is worthy to note that, for a short time scale, the well-known outstanding variation is the “double low-point” (the term we apply to the daily appearance of two low points instead of a single usual minimum point on the geomagnetic vertical Z), a phenomenon which occurred on the geomagnetic vertical Z on 9 May [43,44,45,46,47]. Wang et al. [44] were the first to report a “double low-point” phenomenon in the vertical Z measurements recorded on 9 May at three ground-based ULF geomagnetic observing stations near the epicenter of the Wenchuan EQ. Then, Hu et al. [43], Zhang et al. [45], and Cheng et al. [46] further reported that this kind of variation was observed on the same day at 13 stations near the Wenchuan epicenter.
Lately, Li et al. [51] comprehensively analyzed hourly data of the vertical Z component of 37 DC–ULF geomagnetic stations and they found that 25 out of these stations recorded a “double low-point” phenomenon on 9 May 2008 (Figure 3), that is, 1–2 h earlier or later than usual for the first low point and a 2–6 h gap between these two low points.

2.2. Spatial Ionospheric Anomalies

Many researchers have also performed investigations on seismo-ionospheric effects since the occurrence of the Wenchuan MS 8.0 EQ. These studies include at least ionospheric changes of ground-based ionosonde data [57,58,59,60,61,62,63,64], DEMETER satellite data [17,65,66,67,68,69,70,71,72,73,74,75,76,77,78], ground-based GPS satellite data [17,28,57,58,74,77,79,80,81,82,83,84], radio occultation data from six microsatellites of FORMOSAT3/COSMIC (F3/C) data [81,84,85], and CHAMP (challenging minisatellite payload) satellite data [77].
It has been found that the ionospheric variations which registered prior to the Wenchuan EQ present different time-scale processes. The study conducted on CHAMP satellite Ne (electron density) and GPS TEC (total electron content) by Ryu et al. [77] revealed that the increments were fragments of the gradually increased equatorial ionization anomaly (EIA) strength near the epicenter longitude approximately 1 month before the event. In addition, they also checked the solar wind conditions and geomagnetic activities for the study period (April to June 2008) around the occurrence of the earthquake, with the same parameters in 2007 as a comparison. Their results indicated that the disturbances in the ionosphere that were directly caused by solar irradiance were insignificant.
In this paper, with all collected references considered, the ionospheric abnormities appearing within two weeks before the Wenchuan EQ are statistically displayed in Figure 4; time scales with obvious and distinct abnormities are, respectively, filled with blue and red. From Figure 4, results of statistical work on ionospheric parameters show anomalous changes appearing in the epicentral zone two weeks to several hours before the shock. However, most anomalous variations on different ionospheric parameters appeared about one week before the impending EQ. The key point is that variations on 6 May and 9 May cannot be ignored during this period.
However, as Yu et al. [58] have mentioned, the variations of GPS TEC on 6 May could be attributed to a small geomagnetic storm occurring on 5 May [86]. What has been established is that distinct enhancements recorded by ionospheric installations occurred in the epicentral area in the northern hemisphere, as well as in its magnetically conjugated area in the opposite hemisphere, on 9 May, three days before the Wenchuan MS 8.0 EQ [28,57,58,59,74,80,81,82,83].

3. New Observational Electromagnetic Results for 9 May 2008

From the review of previous work above, one can notice that, although the results of these investigations reveal different time-scale anomalies from several months to several days prior to the Wenchuan EQ, distinct enhancements were registered either on ground-based electromagnetic emissions or on ionospheric variations coincidentally on 9 May 2008, 3 days prior to the Wenchuan main event. The following investigation focuses mainly on the variation process of electromagnetic parameters occurring on 9 May 2008.

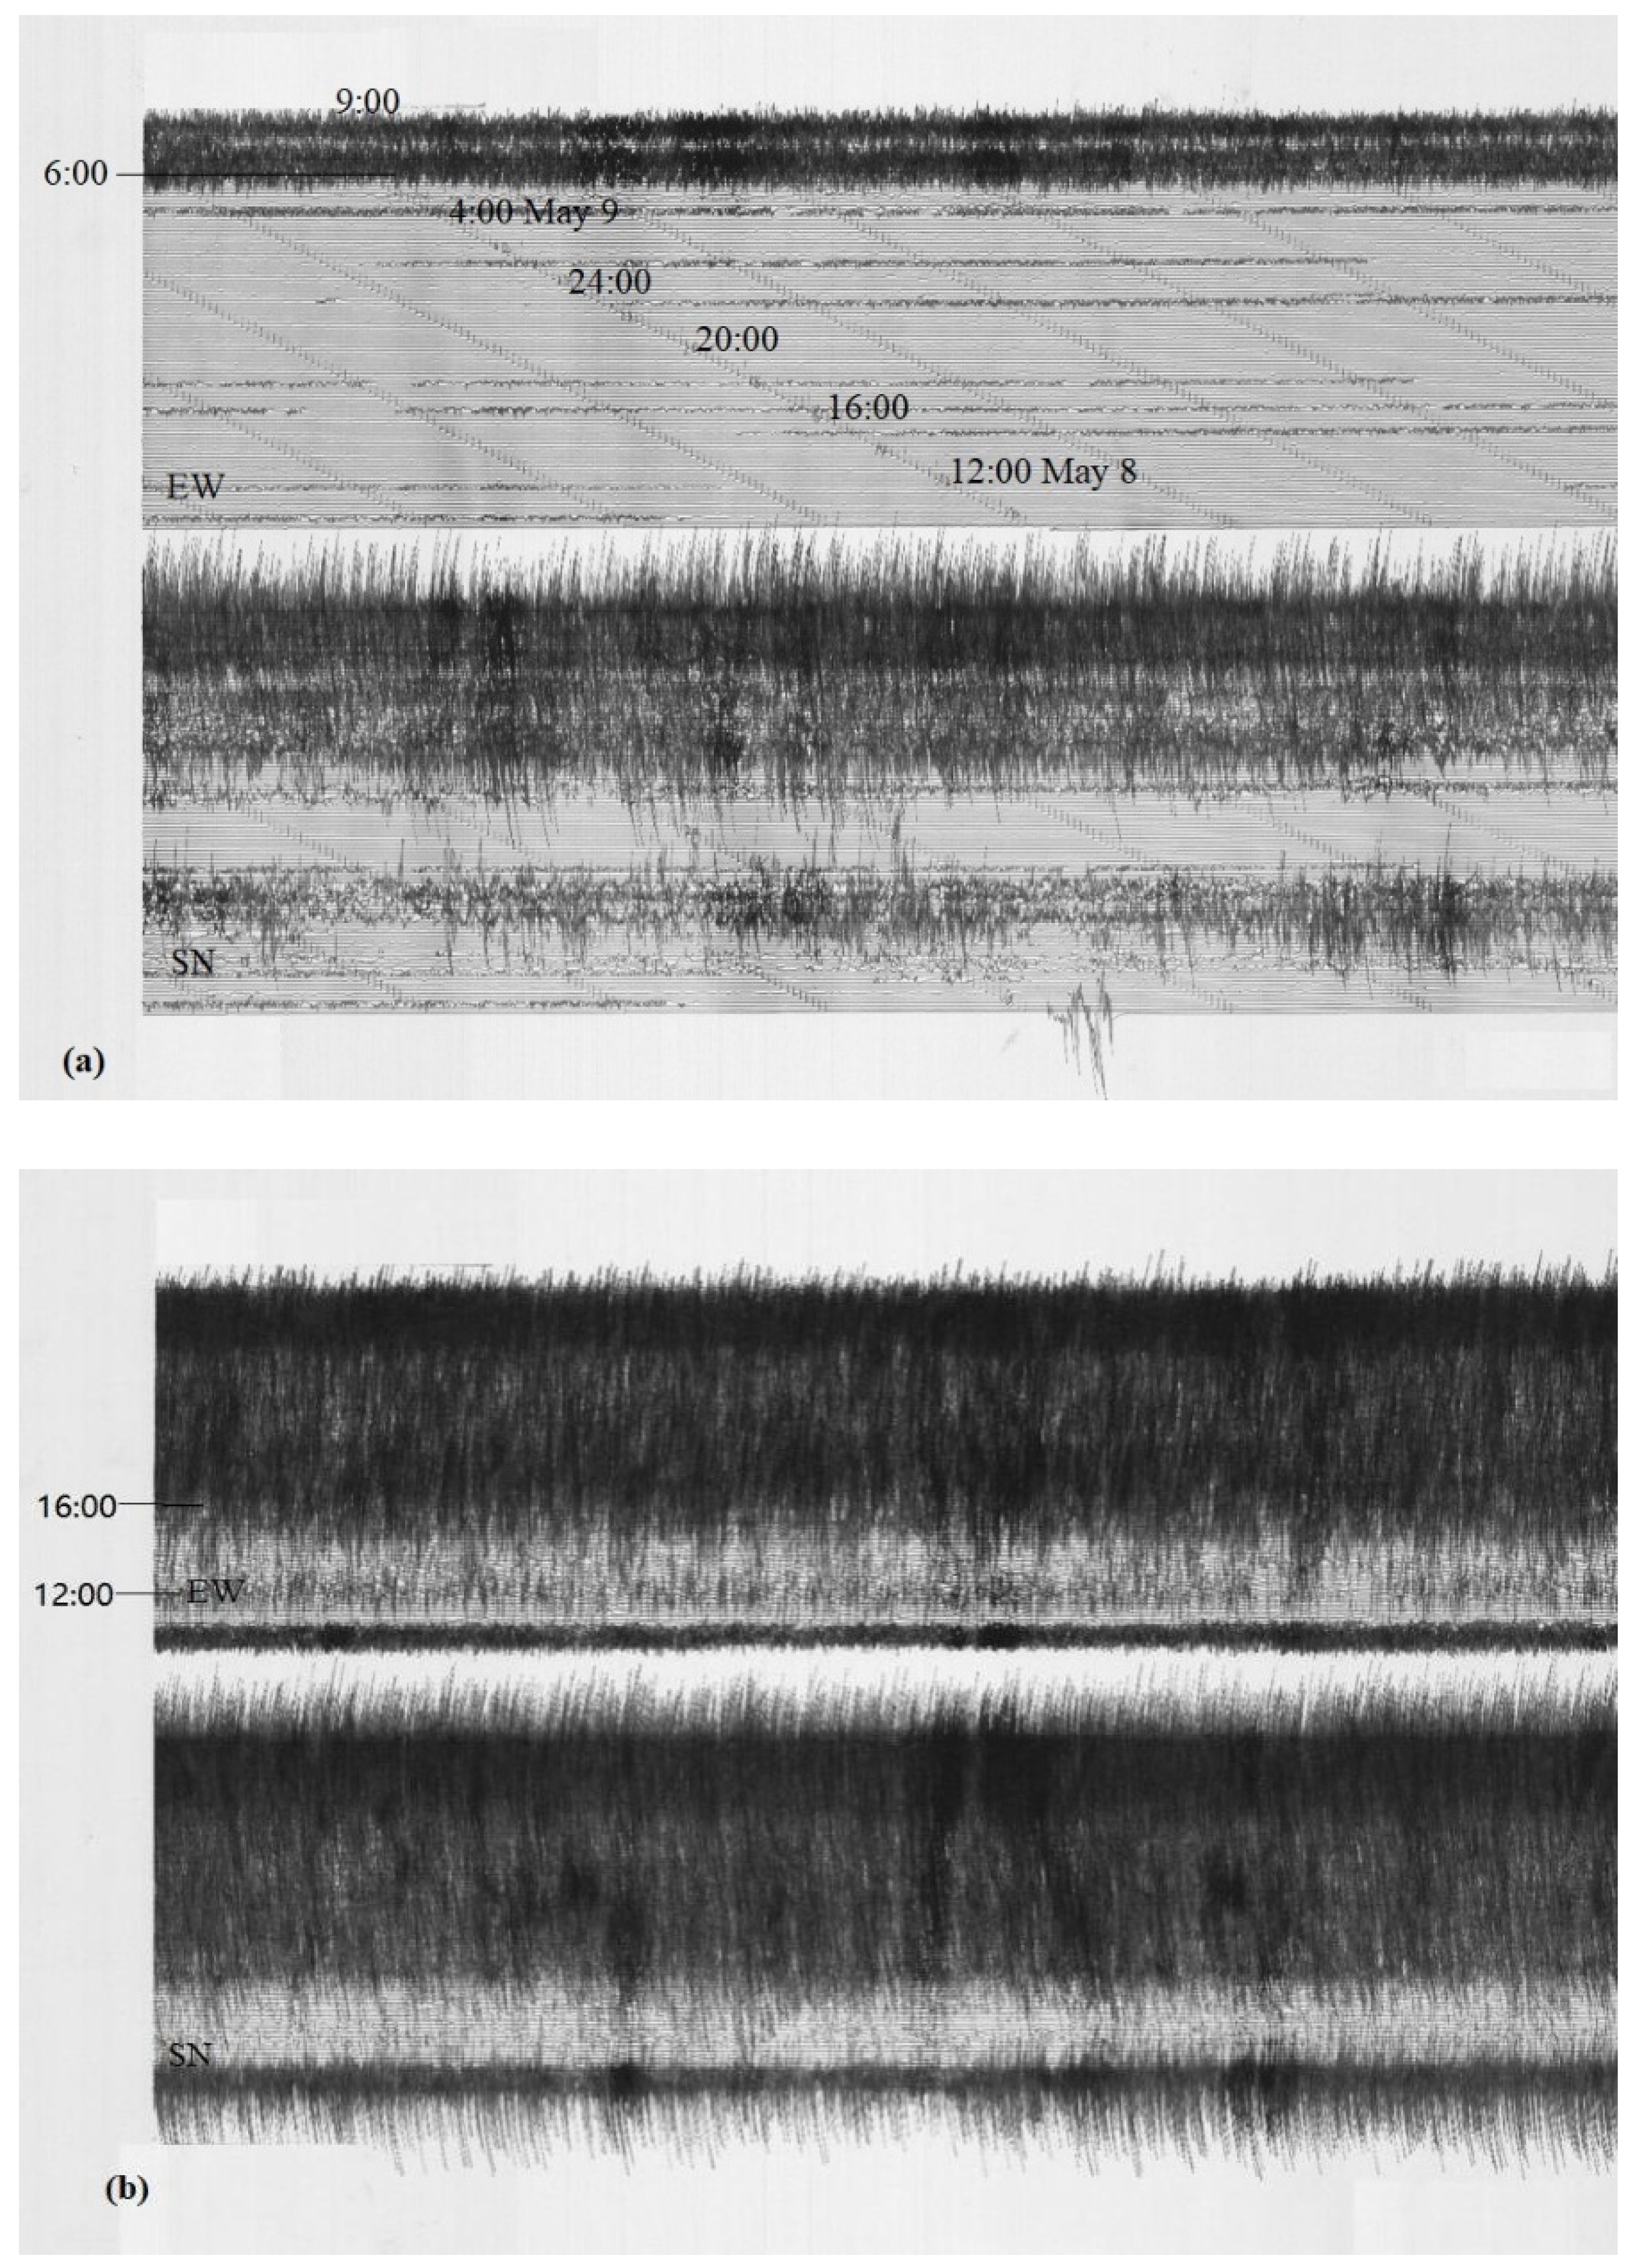
3.1. ULF Electrical Emissions at the GBD Station

As reported by Li et al. [32,40], the GBD station is one of eight stations in the Hebei ULF (0.1–10 Hz) EM observing network in northern China (see Figure 2a). This station recorded outstanding electrical emissions during the Wenchuan EQ and this anomaly is characterized by three typical stages of electrical emissions: most signals in the SN component before 9 May 2008; notable emissions in both SN and EW components during the period of 9–17 May; and main signals in SN again after 17 May 2008 (see Figure 2b).
Figure 5 shows parts of the real-time analog recordings from 0900 on 8 May 2008 to 0900 on 10 May 2008. On 9 May 2008, abnormal emissions gained an abrupt intensive enhancement both in frequency and in magnitude at ≈0600 LT (see Figure 5a); then, larger amplitudes occurred at ≈1200 LT (see Figure 5b); finally, intensive signals with larger magnitudes started from ≈1600 LT on the same day (see Figure 5b) and this situation did not stop until 17 May 2008, although some rises and falls did occur during this climax period. On the one hand, it is noted that few signals appeared when the main event took place at 1428 LT on 12 May 2008. Furthermore, abnormal emissions were still intensive after the main shock because more than 50% of the aftershocks with a magnitude equaling to or more than 5.0 occurred during the period of 12–17 May.

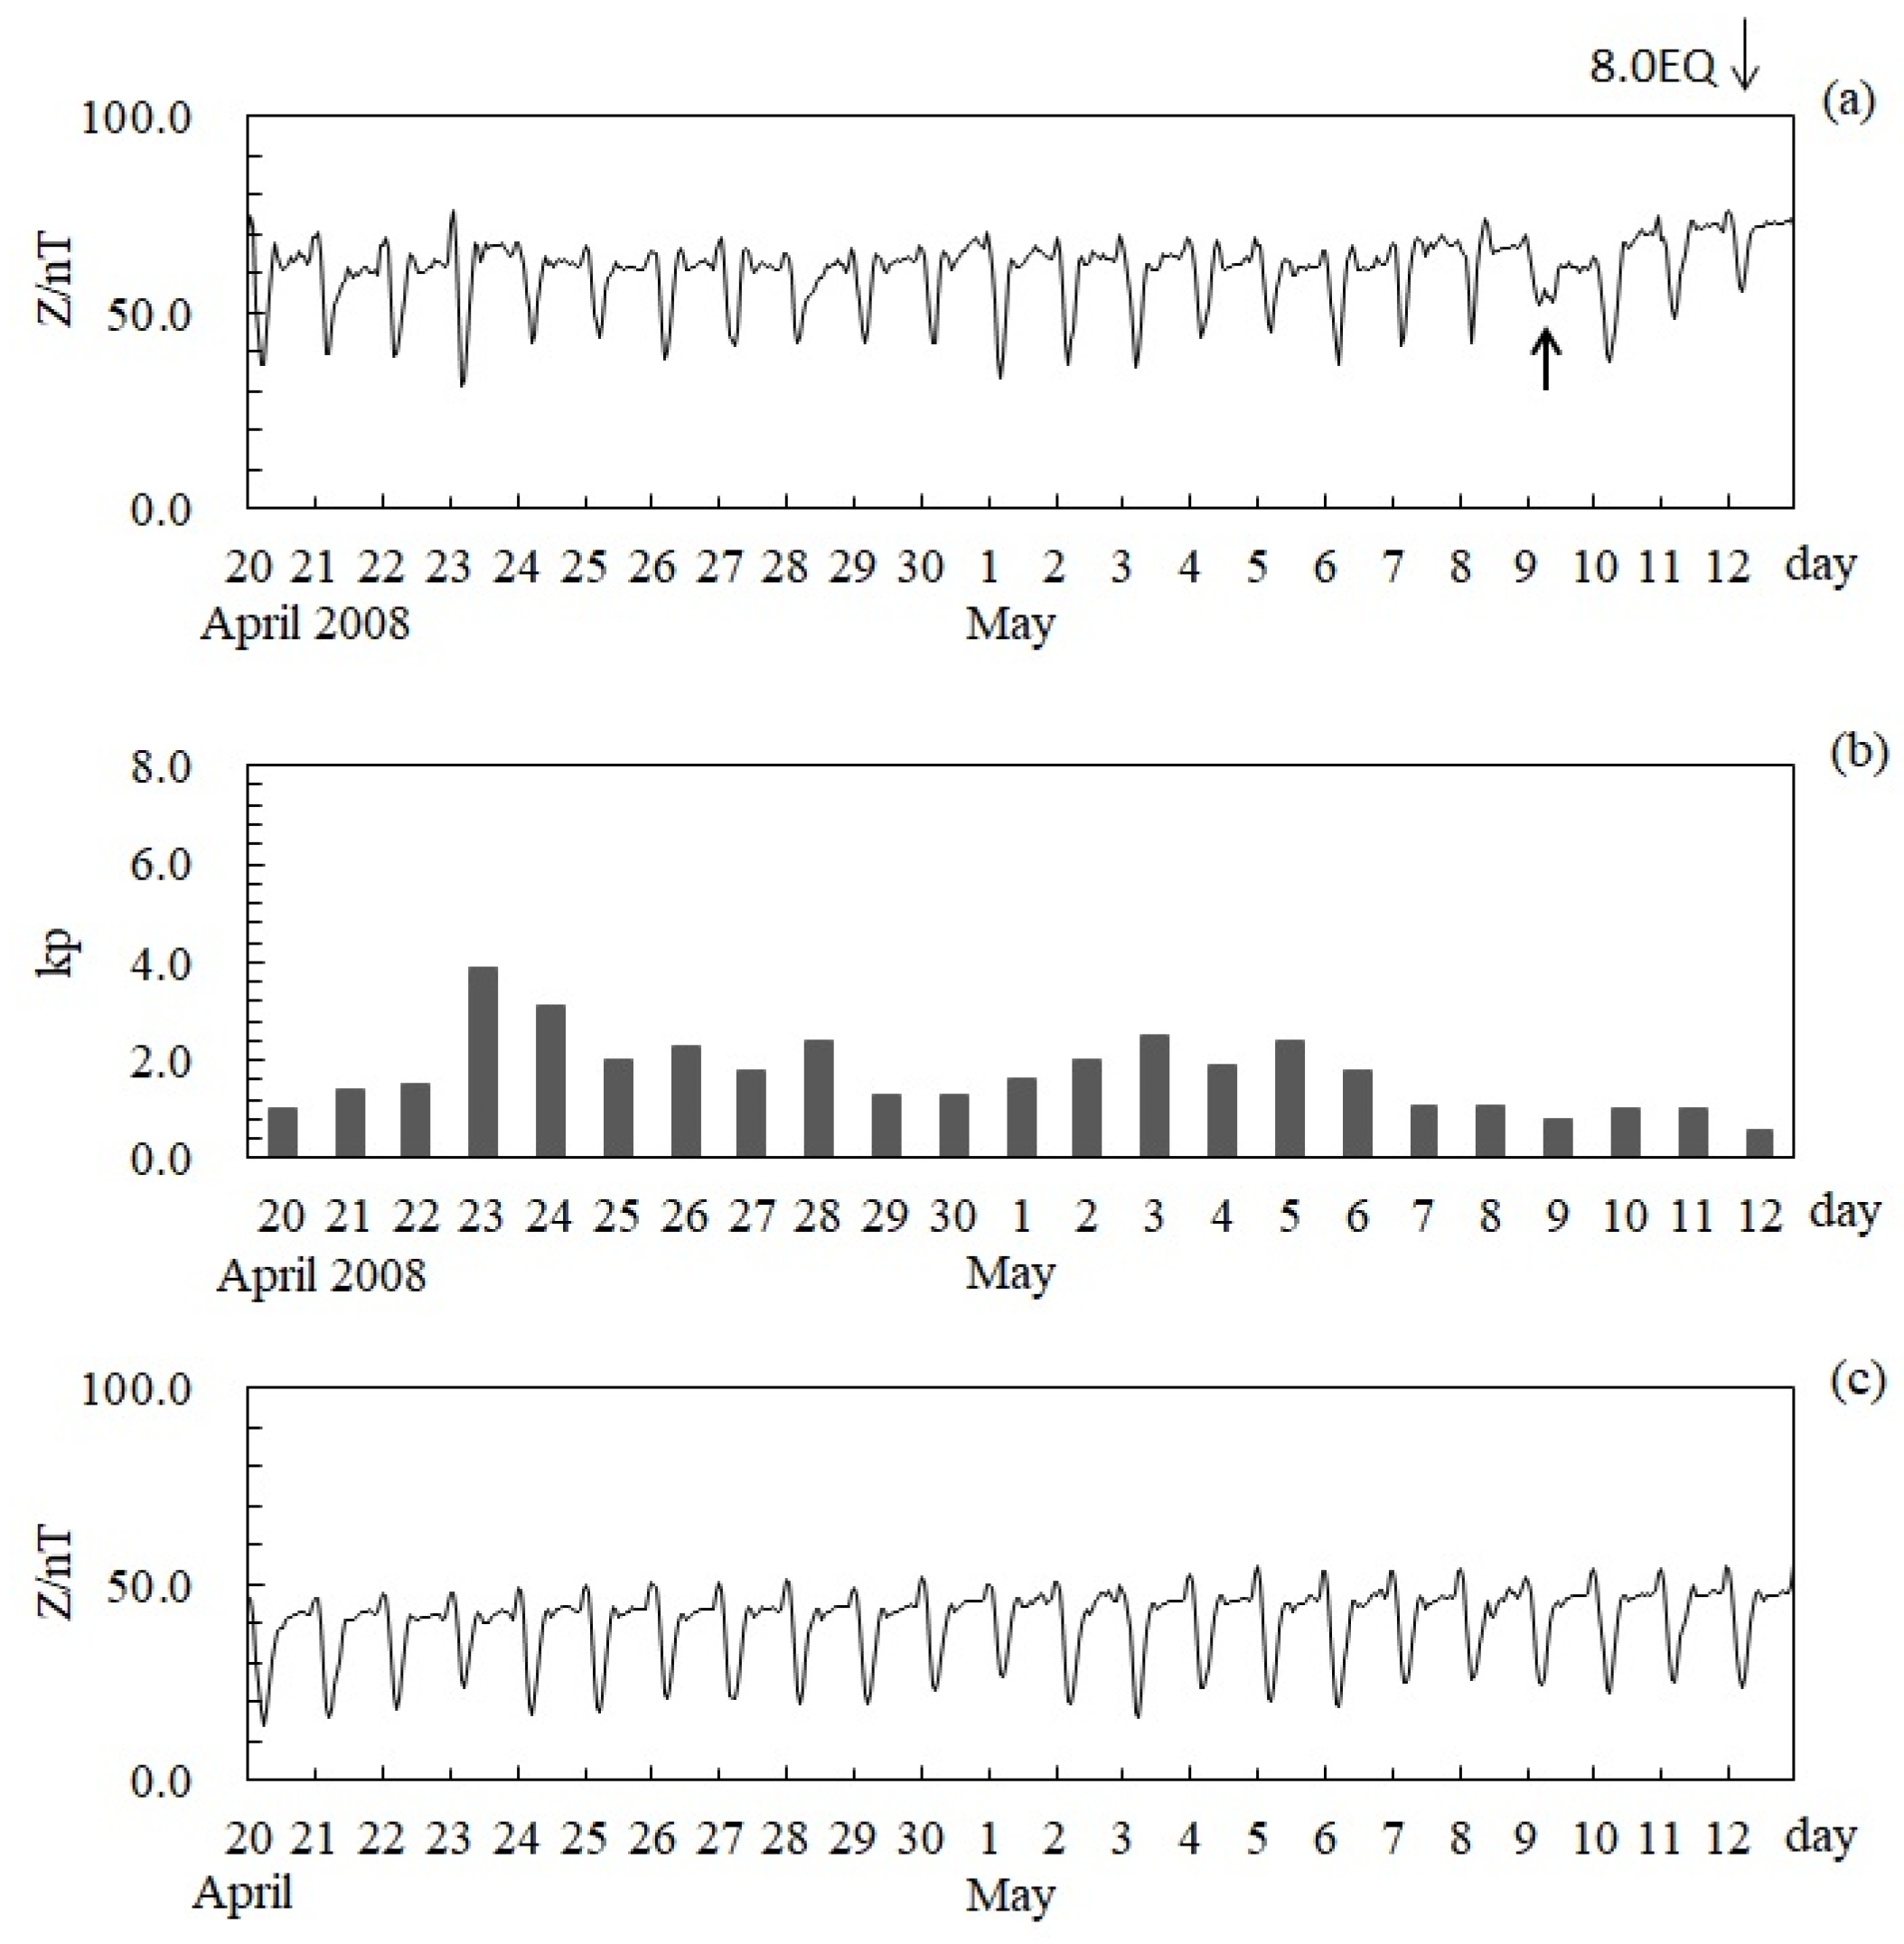
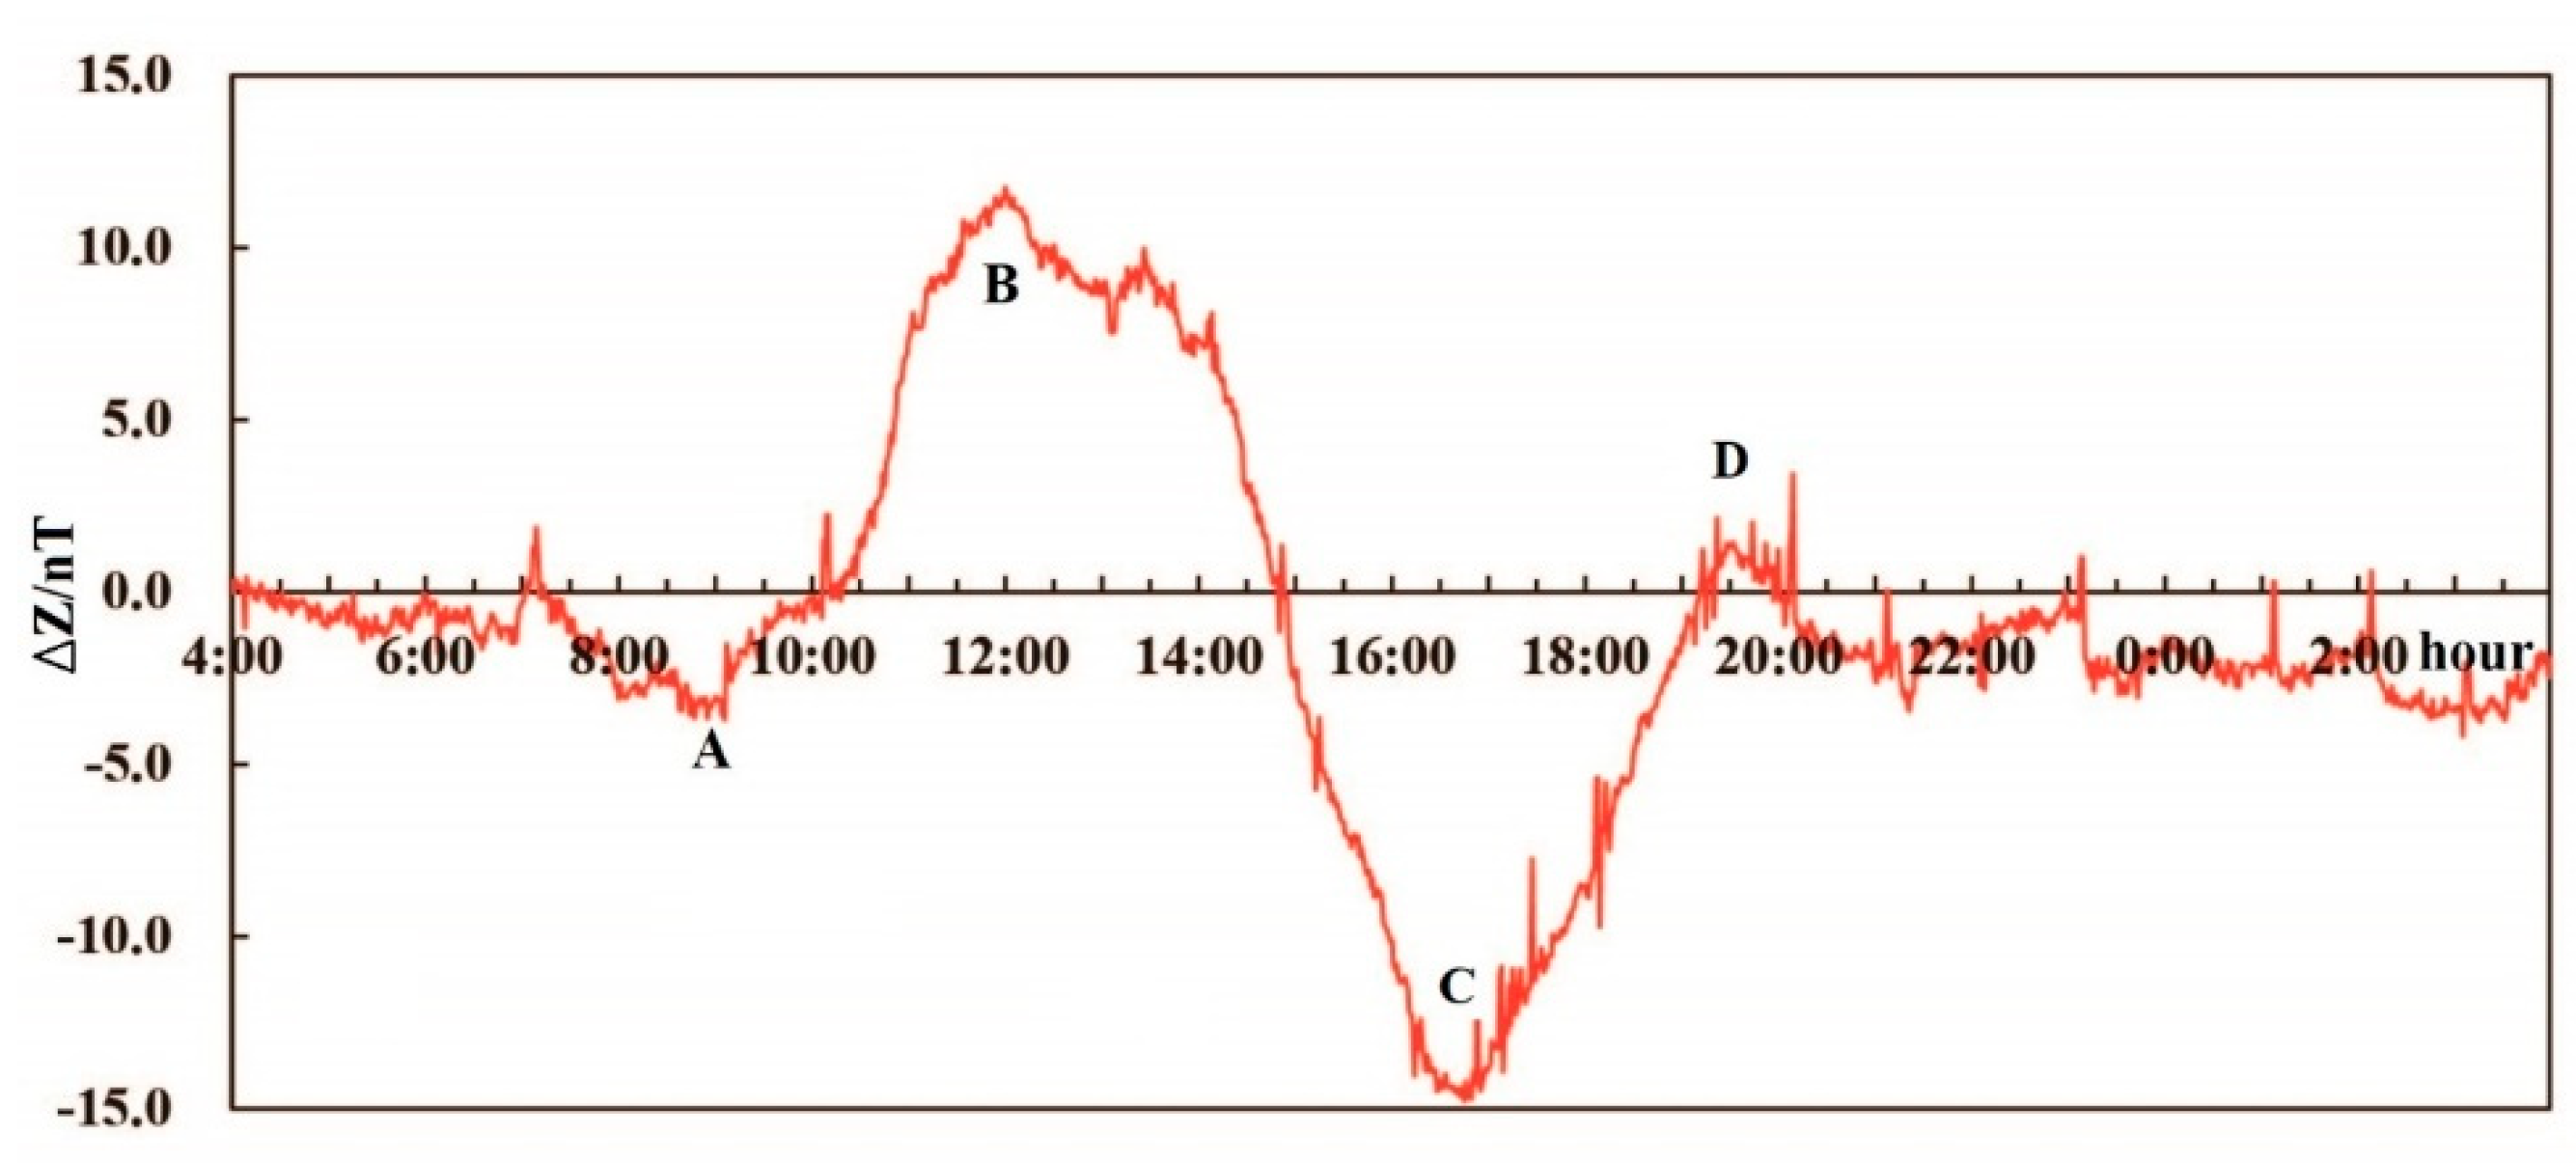
3.2. “Double Low-point” Phenomenon on Geomagnetic Vertical Z at the CD Station

In the low-mid latitude area of the Northern Hemisphere, the daily fluctuation of vertical Z is characterized by its solar periodic component Sq, presenting a minimum point around noon local time (LT). A “double low-point” anomalous phenomenon occurring on 9 May 2008 has been reported in the literature [43,44,45,46,47,51] (see also Figure 3).
The CD station lies in the middle of the geographic longitude range in China and is the nearest station, ≈30 km away, from the epicenter of the Wenchuan EQ. Figure 6a shows the daily curves for hourly readings of vertical Z for this station during the period of 20 April–12 May 2008 (see Figure 6a). It is obvious that the daily curve on 9 May 2008 behaves in a different way from the other days and displays two typical signatures labeled by a black arrow: one is that two low points (double low points) are registered and the other is that the amplitude changes are smaller than those of other days during the same period (Figure 6a).
The Kp (http://isgi.unistra.fr/) daily average values shown in Figure 6b are less than 3 compared to 3.9 and 3.1 on 23 and 24 April, respectively, which means there are no obvious solar activities in this time period. As a comparison, we present in Figure 6c the hourly data of the Z component at the CD station during the same period (20 April–12 May) over the eight years (2009–2016) following the Wenchuan event.
In order to identify the variation process on 9 May 2008 of the CD station, minute readings were also examined and compared with the averaged data during the period of 1–5 May 2008 at the same station. Figure 7 shows the difference between minute readings from 0400 LT on 9 May 2008 to 0400 LT on 10 May 2008 and the corresponding average values during the period of 1–5 May at the CD station. From Figure 7, it seems that a sin-like wave signal has been added to the previous one and that this process started at (A) ≈ 0900 LT, reached its first peak at (B) ≈ 1200 LT, and the climax at (C) ≈ 1600 LT, and ended at (D) ≈ 2000 LT on 9 May 2008, and its period lasted about 11 h.

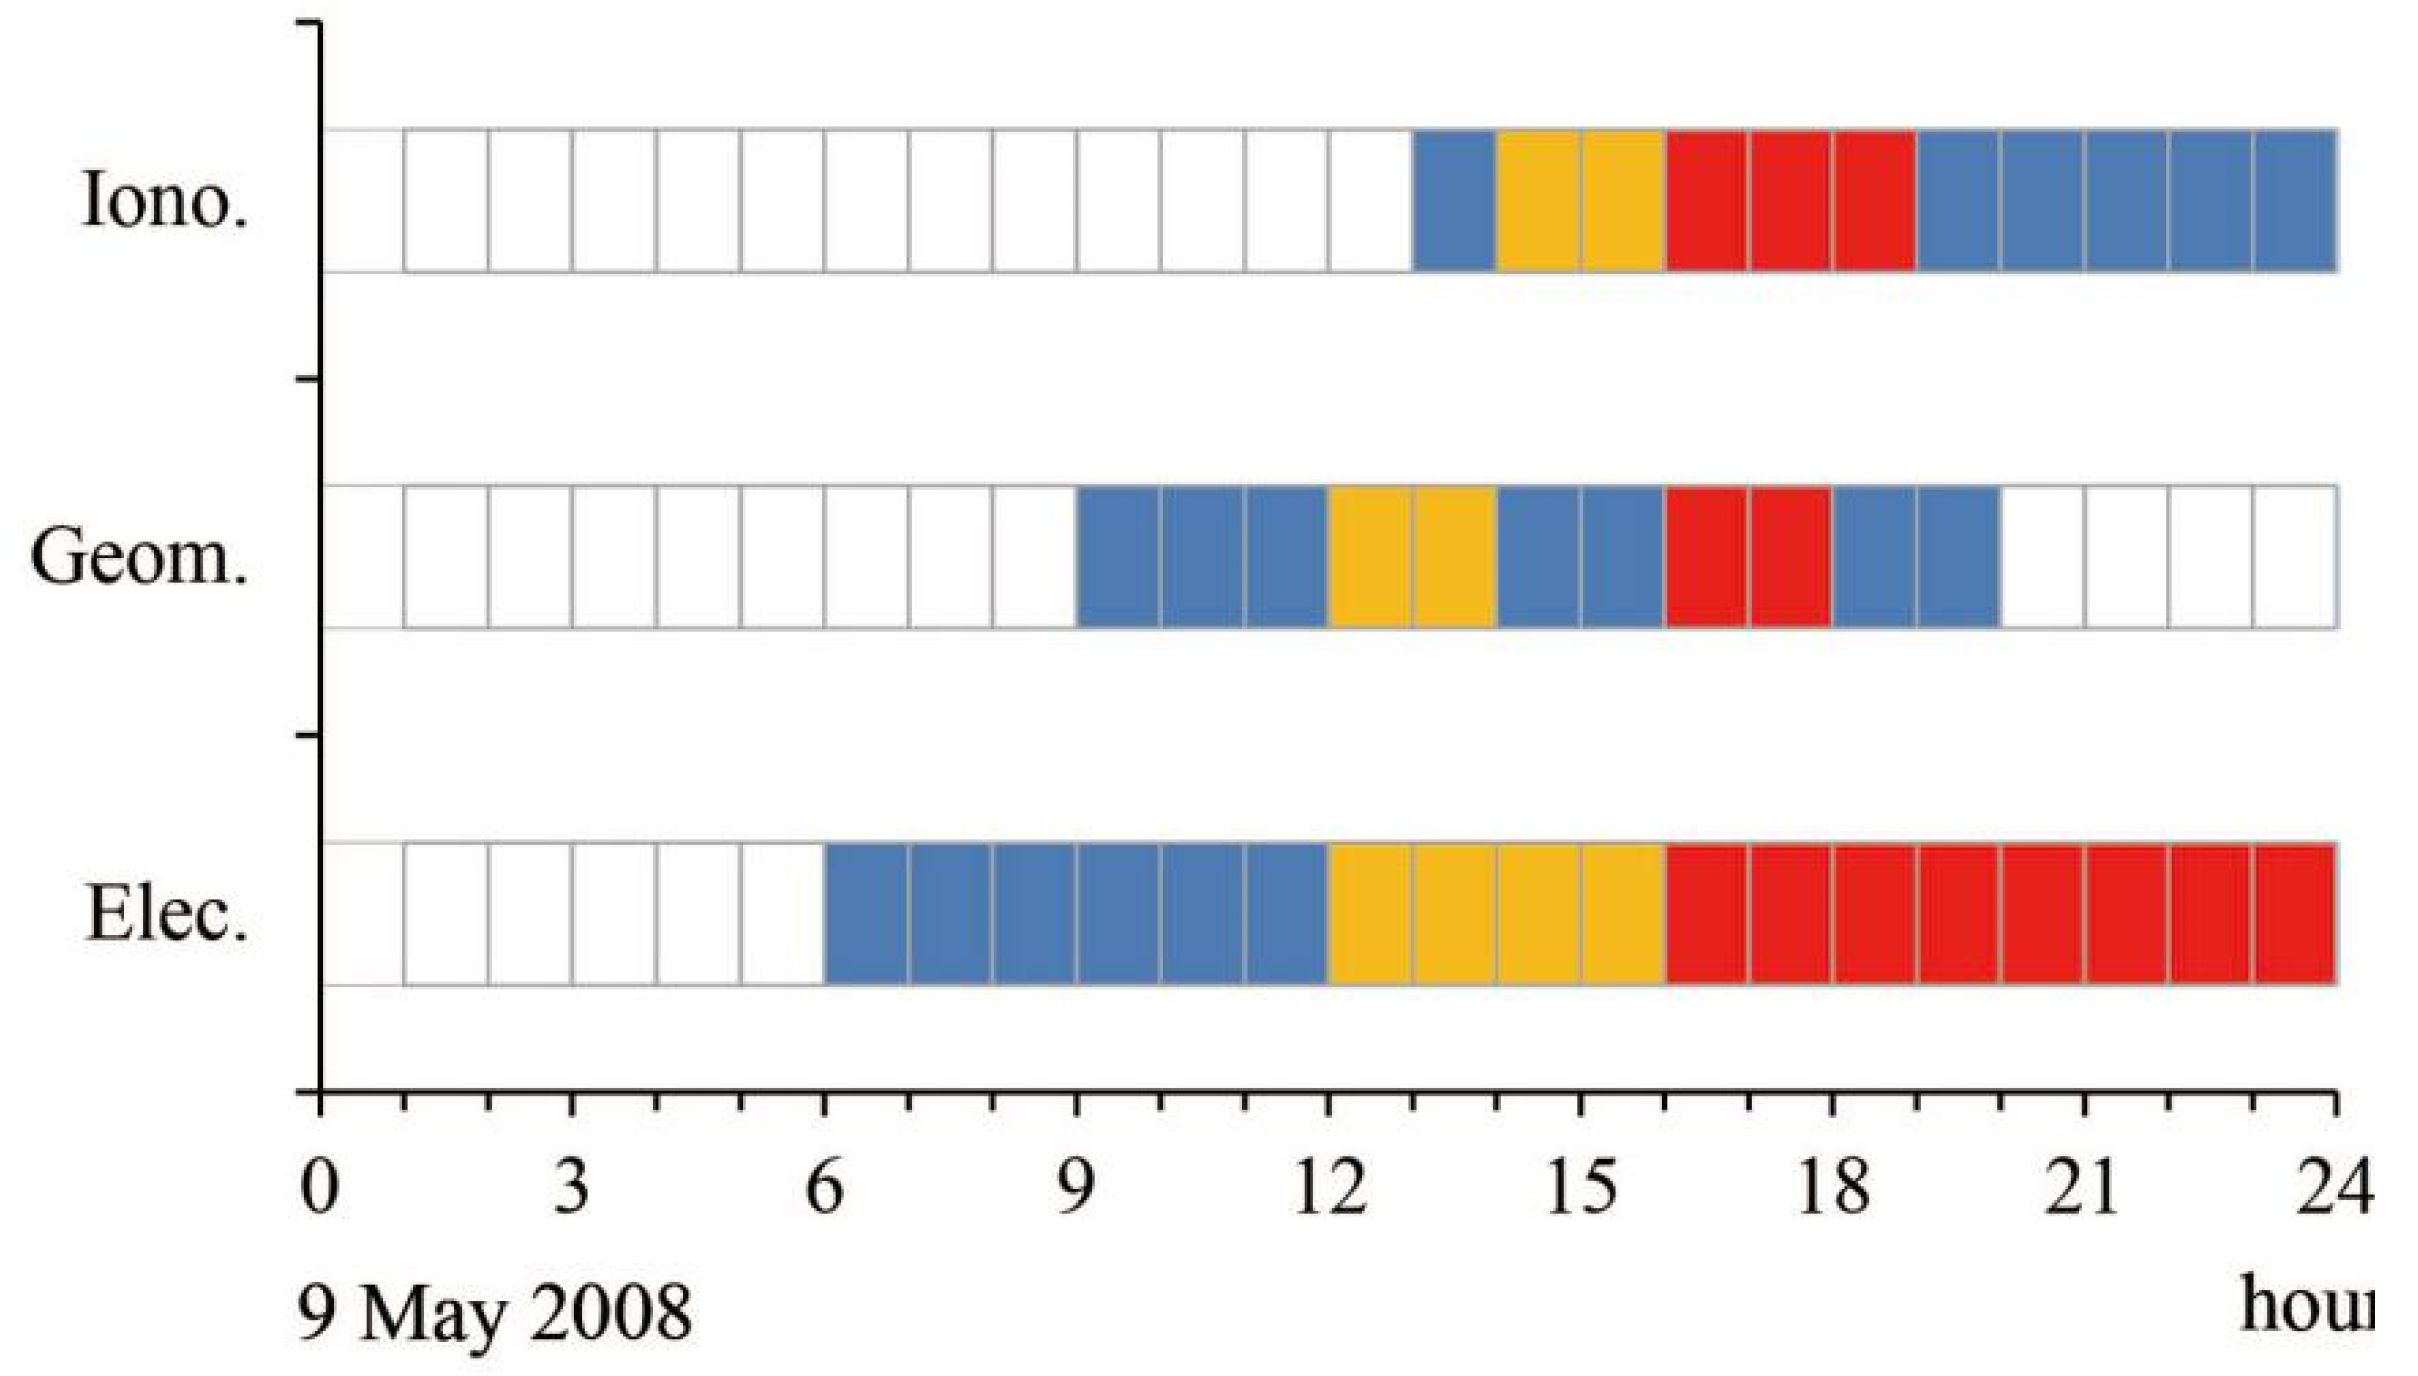
3.3. Summary of Ionospheric Fluctuation from Previous Descriptions

Many investigations have been carried out on ionospheric variations before the Wenchuan EQ. The results of these studies show ionospheric anomalies according to a different time scale, but they tend to attain obvious enhancements on 9 May, 3 days prior to the Wenchuan event [17,28,57,58,59,60,61,62,63,64,65,66,67,68,69,70,71,72,73,74,75,76,77,78,79,80,81,82,83,84,85].
There is the fact that the DEMETER satellite is above a seismic area only a few minutes per day, and that we do not expect continuous observations from a given location. Thus, the obvious disturbances of the DEMETER parameters on 6 May and 9 May 2008 are reported but with fewer details [17,65,66,67,77]. Zeng et al. [67] reported that there was a sharp increase of more than 20% in electron density, electron temperature, and oxygen ion density near the epicenter 4 and 5 days prior to the shock. Increased EM emissions were registered when the satellite passed the epicenter 3 and 7 days before the shock. The atypical reduction of O+ density in the Northern Hemisphere near the epicenter region could be found in the periods of 12, 11, 6, and 3 days before the EQ [77]. Analysis of local daytime O+ density showed that it reached its lowest values 3 days prior to the EQ [66].
Research studies on GPS TEC have given more detail on the continuous processing of the fluctuations for 6 May and 9 May 2008. The results obtained by Zhao et al. [57] showed that the enhancement of GPS TEC started at 1330 LT on 9 May, and that after an evolution of four hours the enhancement reached 100% increase and ended at 2000 LT with respect to the median value. Liu et al. [81] reported that GPS TEC reduced significantly in the epicentral area during the afternoon periods of days 6–4 (6–8 May 2008) and drastically increased by about 40–50% at 1700 LT on day 3 (9 May 2008) before the Wenchuan EQ. Yan et al. [74] reported a decrease anomaly in the afternoon during the period of 6–10 May and a strong increase anomaly at 1600–1800 LT on 9 May. Yu et al. [58] found a GPS TEC decrease on 6 May and an obvious enhancement at 1600–1800 LT on 9 May within an area of 20° in the southeast direction of the Wenchuan epicenter. Zhu et al. [82] also reported a 30% GPS TEC decrease on 6 May and a rapid increase at 0800 UT (1500 LT) on 9 May. The observed anomalies on GPS TEC, the global TEC maps, and the reconstructed vertical profiles of electron density during 1400–1600 LT on 3, 6, and 9 May have also been reported [28,83]. In addition, an obvious anomaly in f0F2 recorded by ground-based ionosondes took place during 1600–1800 LT on 9 May as described in Xu et al. [60] and Xu et al. [61].
Therefore, it has been established that distinct enhancements recorded by ionospheric installations occurred in the epicentral area in the Northern Hemisphere, as well as in its magnetically conjugated area in the opposite hemisphere, during the afternoon period of 1300–1800 LT, with a climax occurring during 1600–1800 LT, on 9 May 2008 [28,57,58,59,74,80,81,82,83].
According to the illustrations above, we can now summarize the fluctuating processes for ULF electrical emissions recorded at the GBD station, DC-ULF geomagnetic Z “double low-point” phenomenon recorded at the CD station, and previously reported ionospheric variations on 9 May 2008, 3 days before the Wenchuan main event. Figure 8 presents the general variations in blue, increasing anomalies in orange, and climax ones in red for the three items considered here.
From Figure 8, we can see first, in turn, the variations of electrical field, geomagnetic vertical Z, and ionospheric parameters starting at 0600 LT, 0900 LT, and 1300 LT; second, we can see that the anomalies of the electrical field and geomagnetic field gained their peaks during 1200–1300 LT, when the ionospheric variations started; third, all the variations of these three items reached their climax almost at the same time, at 1600 LT.
Up to that point, this process did not stop but became weak rapidly until the occurrence of the main shock, which can be seen in Figure 7 and Figure 8 on geomagnetic variations and ionospheric perturbations. However, distinct ULF EM emissions continued until the morning of 17 May, 5 days after the main shock, possibly because these ULF electrode sensors were more sensitive to the generated signals.

4. Discussion

The concept of a lithosphere–atmosphere–ionosphere coupling (LAIC) among the three involved layers of the Earth system has been proposed due to a transfer of energy among these three layers during certain last stages of the long-term process of preparation before strong EQs [26,28,87,88,89,90]. The primary study of the LAI coupling mechanism is based on two major hypotheses, namely, internal gravity wave (IGW) and electrical field. However, Sorokin and Hayakawa [30] thought that there were some difficulties in the interpretation of observational results of EQ precursors based on the IGW propagation model. First, the ground distance of the IGW reaching the ionosphere is of the order of 1000 km from the EQ epicenter because of its angular propagation, which seems to be in conflict with the localization of the plasma and EM disturbances in the vicinity of the EQ epicenter. Second, the variation caused by the IGW should be of the feature of waves and moves at the speed of acoustic waves, whereas recordings before EQs are persistent changes and without a spatial movement tendency [91]. Thus, Pulinets and Davidenko [29] thought it was the smooth transition from acoustic-driven mechanisms to the EM coupling. The reason of this is very simple: the acoustic coupling mechanism has shown recently its very low effectiveness and that it is difficult to produce an order of the ionospheric perturbations which are actually observed before EQs.
With respect to the LAIC mechanism based on the EM theory, the LAI EM coupling associated with EQs has been considered as a systematic comprehensive process. However, so far, there is no well-established model of the lithosphere–atmosphere–ionosphere coupling [24,92,93,94].
There are still issues under controversy. One of the most important is that of the original source of EM energy which drives a possible LAI coupling before a large EQ. Pulinets and Ouzounov [28] thought that different kind of gases (e.g., methane, helium, hydrogen, and carbon dioxide) can serve as carrier gases taking radon and aerosols from seismically active faults to the near Earth’s surface where the electrical field is produced by radon ionization and injection of the aerosols [29], Sorokin and Hayakawa [30,31] proposed that the external current of EMF (electro-motive force) is formed in the near ground atmosphere during the injection of charged aerosols by soil gases and that it drives an LAI coupling.
The change of atmospheric aerosol optical depth (AOD) has been confirmed by Qin et al. [95], who reported that there was a clear enhancement of AOD along the Longmenshan faults 7 days before the Wenchuan shock, 1 day and 4 days earlier than the reported negative and positive ionospheric disturbances, respectively. However, they absently reported any anomalous details of AOD which occurred on 9 May. The point is what happens in the hypocentral area or in the main fault of the promising event, which leads to the appearance of a large quantity of charged aerosols.
The fact that EM emissions were observed prior to strong EQs has gained much attention. Up to now, no clear explanation has been given, although several physical mechanisms have been proposed to interpret the generation of EM emissions and electrical currents observed either during seismic activity or in the laboratory experiments. Whatever the physical mechanism of EM generation, it is well established that, during rock experiments conducted under laboratory conditions, a strong electrical current is produced when rocks are stressed, especially at the stage of the main rupture.
Li et al. [32] have suggested that, due to the adjustment of regional stress in the focus zone, micro-cracks developed rapidly to the macro-cracks and the main rupture started, producing a strong seismo-telluric current that propagated mainly along the Longmenshan fault. The current induced strong electrical signals that were recorded initially by sensitive ULF electrode sensors in northern China at ≈0600 LT on 9 May (see Figure 5a). This suggestion seems to match well with what was obtained by Zhao et al. [57], who proposed that the most possible cause for pre-EQ ionospheric anomalies prior to the Wenchuan EQ at low latitudes could be the strong vertical electrical field occurring in the EQ preparation area, which modifies the whole structure of the EIA (equatorial ionization anomaly) and most of the effect is the equatorward shift of both crests of the EIA up to their complete disappearance [92,96].
These conclusions are confirmed by Pan et al. [97], who performed an inversion analysis of the geomagnetic data at 37 stations during the ‘lowest point shift” phenomenon before the Zhangbei MS 6.2 EQ of 10 January 1998 and determined that the interior equivalent current system produced an upward magnetic field, which was opposite to the external one, and the combined influence of these two magnetic fields led to a reduction of the magnitude of the vertical Z component. Furthermore, the authors also suggested that the focus of the interior equivalent current system was characterized by a latitudinal displacement, which is highly coincident with the zonal evolutionary phenomenon of the first low points recorded at various stations on 9 May 2008 [51].
It seems that the so–called “double low-point” phenomenon of the nearest CD station did not occur at the same time as the GBD electrical emissions did. It started at ≈0900 LT (see Figure 7), with a three-hour delay. It is possible that the inner upward magnetic field was strong enough to modify the running way of the external one. However, we are convinced that the variations both on ground-based electrical fields and the geomagnetic vertical Z element reached their peak magnitudes in the same period of ≈1200 LT (see Figure 7 and Figure 8), which is close to the registered time (≈1330 LT) when ionospheric varieties started to appear.
One of the most interesting results is that these EM variations either on ground-based observations or on ionospheric observations reached their climax stage almost in the same period of 1600–1800 LT (see also Figure 8). The registered various amplitudes are up to 26 nT for the DC–ULF geomagnetic vertical Z at the CD station [51], 1.3 mV m−1 for the ULF electrical field at the GBD station [32,41], and 15 TECU for GPS TEC [58], respectively. Using a three-layer model (Earth–atmosphere–ionosphere), Li et al. [41] simulated this observable 1.3 mV m−1 electrical field at f = 1 Hz at the Gaobeidian (GBD) station and determined that the order of the instantaneous seismo-telluric current produced by the main rupture was up to 107 A. This current induces strong EM fields in the Earth’s surface, and these strong fields can accumulate air ionization above the pre-EQ zone. The air ionization is advantageous for electrical fields propagating up to the ionosphere, leading to ionospheric anomalies in the epicentral area, as well as its magnetically conjugated point area. This evolutionary process seems to support well the LAI coupling model proposed by previous investigations [28,98,99].
However, Figure 9 shows weekly magnetic field and solar wind plots observed by the ACE (advanced composition explorer) spacecraft from 124.0th day to 131.0th day in 2008 (3 May to 9 May 2008) (http://www.srl.caltech.edu). From Figure 9, ACE observed the arrival of a high-speed solar wind stream in the near-Earth interplanetary space (see the green rectangle in Figure 9), which is usually associated with Alfvenic fluctuations in the interplanetary magnetic field (IMF). The Alfven wave is one source of ULF waves on the Earth. At this point, this remarkable Alfvenic activity (see the blue rectangle in Figure 9) partly coincides with the period of intensive electromagnetic variations presented in Figure 4. Furthermore, the year 2008 was in the solar minimum phase right before the end of Solar Cycle 23. The statistical results performed by Anagnostopoulos et al. [100] show there is a near relationship between the high-speed solar wind streams (HSSs) and seismic activity, in particular during the decay phase or minimum phase of the solar cycle. It is therefore possible that these various electromagnetic variations that occurred within one week before the Wenchuan event were from different sources.

5. Conclusions

As spatial ionospheric observation develops, a promising topic is to investigate the interacted effects of ground-based variations and ionospheric disturbances before seismic activities.
The statistical results of a large number of previous investigations on both ground-based electromagnetic parameters and ionospheric parameters prior to the Wenchuan MS 8.0 earthquake showed different time scales from several months to several days, even several hours, but they reached a common climax period on 9 May, 3 days before the Wenchuan main shock, which indicates the occurrence of an LAI electromagnetic coupling. In the meantime, the new observational results for 9 May presented here show that the ground-based ULF electrical emissions initiated first at ≈0600 LT, and that the geomagnetic “double low-point” phenomena started at ≈0900 LT, but they reached their first peaks at ≈1200 LT simultaneously; then the ionospheric changes began at ≈1330 LT. Finally, all these variations reached their climax in the same period of 1600–1800 LT. All these LAI processes took place in turn during dozens of hours on 9 May, 3 days prior to the Wenchuan main event which occurred on 12 May 2008. Though the energy sources driving this LAI coupling are indefinite, this evolutionary process may give us some hints in establishing an improved LAI model.

Author Contributions

Data collection, writing, and investigation, M.L. and J.L.; review and editing, X.Z. and X.S.

Acknowledgments

This work was supported by the National Natural Science Foundation of China (NSFC) under Grant Agreement No. 41774084 and the National Key R&D Program of China under Grant No. 2018YFC1503506.

Conflicts of Interest

The authors declare no conflict of interest. The funders had no role in the design of the study; in the collection, analyses, or interpretation of data; in the writing of the manuscript, or in the decision to publish the results.

References

  1. Eftaxias, K.; Kapiris, P.; Polygiannakis, J.; Peratzakis, A.; Kopanas, J.; Antonopoulos, G.; Rigas, D. Experience of short term earthquake precursors with VLF-VHF electromagnetic emissions. Nat. Hazards Earth Syst. Sci. 2003, 3, 217–228. [Google Scholar] [CrossRef]
  2. Fraser-Smith, A.C.; Bernardi, A.; McGill, P.R.; Ladd, M.E.; Helliwell, R.A.; Villard, O.G., Jr. Low-frequency magnetic measurements near the epicenter of the MS 7.1 Loma Prieta earthquake. Geophys. Res. Lett. 1990, 17, 1465–1468. [Google Scholar] [CrossRef]
  3. Bernardi, A.; Fraser-Smith, A.C.; McGill, P.R.; Villard, O.G., Jr. Magnetic field measurements near the epicenter of the MS 7.1 Loma Prieta earthquake. Phys. Earth Planet. Inter. 1991, 68, 45–63. [Google Scholar] [CrossRef]
  4. Molchanov, O.A.; Kopytenko, Y.A.; Voronov, P.M.; Kopytenko, E.A.; Matiashvili, T.G.; Fraser-Smith, A.C.; Bernardi, A. Results of ULF Magnetic field measurements near the epicenters of the Spitak (MS 6.9) and Loma Prieta (MS 7.1) earthquakes: Comparative analysis. Geophys. Res. Lett. 1992, 19, 1495–1498. [Google Scholar] [CrossRef]
  5. Kopytenko, Y.A.; Matiashvili, T.G.; Voronov, P.M.; Kopytenko, E.A.; Molchanov, O.A. Detection of ultra-low frequency emissions connected with the Spitak earthquake and its aftershock activity, based on geomagnetic pulsations data at Dusheti and Vardzia observatories. Phys. Earth Planet. Inter. 1993, 77, 85–95. [Google Scholar] [CrossRef]
  6. Stanica, D.A.; Stanica, D. ULF Pre-seismic geomagnetic anomalous signal related to MW 8.1 offshore Chiapas eartquakes, Mexico, on 8 September 2017. Entropy 2019, 21, 29. [Google Scholar] [CrossRef]
  7. Hayakawa, M.; Kawate, R.; Molchanov, O.A.; Yumoto, K. Results of ultra-low frequency magnetic field measurements during the Guam earthquake of 8 August 1993. Geophys. Res. Lett. 1996, 23, 241–244. [Google Scholar] [CrossRef]
  8. Kawate, R.; Molchanov, O.A.; Hayakawa, M. Ultra-low frequency magnetic fields during the Guam earthquake of 8 August 1993 and their interpretation. Phys. Earth Planet. Inter. 1998, 105, 229–238. [Google Scholar] [CrossRef]
  9. Prattes, G.; Schwingenschuh, K.; Eichelberger, H.U.; Magnes, W.; Boudjada, M.; Stachel, M.; Vellante, M.; Villante, U.; Wesztergom, V.; Nenovski, P. Ultra Low Frequency (ULF) European multi station magnetic field analysis before and during the 2009 earthquake at L’Aquila regarding regional geotechnical information. Nat. Hazards Earth Syst. Sci. 2011, 11, 1959–1968. [Google Scholar] [CrossRef]
  10. Stanica, D.A.; Stanica, D.; Blecki, J.; Ernst, T.; Jozwiak, W.; Slominski, J. Pre-seismic geomagnetic and ionosfere signatures related to the MW 5.7 earthquake occurred in Vrancea zone on September 24, 2016. Acta Geophys. 2018, 66, 167–177. [Google Scholar] [CrossRef]
  11. Davies, K.; Baker, D.M. Ionospheric effects observed around the time of the Alaskan earthquake of March 28, 1964. J. Geophys. Res. 1965, 70, 2251–2253. [Google Scholar] [CrossRef]
  12. Pulinets, S.A.; Boyarchuk, K.; Shalimov, S.L. Ionospheric Precursors of Earthquakes; Springer: Berlin/Heidelberg, Germany, 2004. [Google Scholar] [CrossRef]
  13. Molchanov, O.A. Wave and plasma phenomena inside the ionosphere and magnetosphere associated with earthquakes. In Review of Radio Science 1990–1992; Stone, W.R., Ed.; Oxford University Press: Oxford, UK, 1993; pp. 591–600. [Google Scholar]
  14. Hayakawa, M. VLF/LF Radio Sounding of Ionospheric Perturbations Associated with Earthquakes. Sensors 2007, 7, 1141–1158. [Google Scholar] [CrossRef] [Green Version]
  15. Liu, J.Y.; Chen, Y.I.; Pulinets, S.A.; Tsai, Y.B.; Chuo, Y.J. Seismo-ionospheric signatures prior to M ≥ 6 Taiwan earthquakes. Geophys. Res. Lett. 2000, 27, 3113–3116. [Google Scholar] [CrossRef]
  16. Singh, R.P.; Singh, B.; Mishra, P.K.; Hayakawa, M. On the lithosphere atmosphere coupling of seismo-electromagnetic signals. Radio Sci. 2003, 38, 1065. [Google Scholar] [CrossRef]
  17. Akhoondzadeh, M.; Parrot, M.; Saradjian, M.R. Electron and ion density variations before strong earthquakes (M > 6.0) using DEMETER and GPS data. Nat. Hazards Earth Syst. Sci. 2010, 10, 7–18. [Google Scholar] [CrossRef]
  18. Bankov, L.G.; Parrot, M.; Heelis, R.A.; Berthelier, J.-J.; Marinov, P.G.; Vassileva, A.K. DEMETER and DMSP satellite observations of the disturbed H+/O+ ratio caused by Earth’s seismic activity in the Sumatra area during December 2004. Adv. Space Res. 2010, 46, 419–430. [Google Scholar] [CrossRef]
  19. Kon, S.; Nishihashi, M.; Hattori, K. Ionospheric anomalies possibly associated with M ≥ 6.0 earthquakes in the Japan area during 1998–2010: Case studies and statistical study. J. Asian Earth Sci. 2011, 41, 410–420. [Google Scholar] [CrossRef]
  20. Parrot, M.; Berthelier, J.J.; Lebreton, J.P.; Sauvaud, J.A.; Santolík, O.; Blecki, J. Examples of unusual ionospheric observations made by the DEMETER satellite over seismic regions. Phys. Chem. Earth 2006, 31, 486–495. [Google Scholar] [CrossRef]
  21. Cussac, T.; Clair, M.A.; Guerard, P.U.; Buisson, F.; Balier, G.L.; Ledu, M.; Elisabelar, C.; Passot, X.; Rey, N. The Demeter microsatellite and ground segment. Planet. Space Sci. 2006, 54, 413–427. [Google Scholar] [CrossRef]
  22. Shen, X.H.; Zhang, X.M.; Yuan, S.G.; Wang, L.W.; Cao, J.B.; Huang, J.P.; Zhu, X.H.; Piergiorgio, P.; Dai, J.P. The state-of-the-art of the China Seismo-Electromagnetic Satellite mission. Sci. China Technol. Sci. 2018, 61, 634–642. [Google Scholar] [CrossRef]
  23. Yan, R.; Shen, X.H.; Huang, J.P.; Wang, Q.; Chu, W.; Liu, D.P.; Yang, Y.Y.; Lu, H.X.; Xu, S. Examples of unusual ionospheric observations by the CSES prior to Earthquakes. Earth Planet. Phys. 2018, 2, 515–526. [Google Scholar] [CrossRef]
  24. De Santis, A.; De Franceschi, G.; Spogli, L.; Perrone, L.; Alfonsi, L.; Qamili, E.; Cianchini, G.; Di Giovambattista, R.; Salvi, S.; Filippi, E.; et al. Geospace perturbations induced by the Earth: The state of the art and future trends. Phys. Chem. Earth 2015, 85–86, 17–33. [Google Scholar] [CrossRef]
  25. Pulinets, S.A.; Boyarchuk, K.A.; Hegai, V.V.; Kim, V.P.; Lomonosov, A.M. Quasielectrostatic model of atmosphere-thermosphere-ionosphere coupling. Adv. Space Res. 2000, 26, 1209–1218. [Google Scholar] [CrossRef]
  26. Hayakawa, M.; Molchanov, O.A. (Eds.) Seismo-Electromagnetics: Lithosphere-Atmosphere-Ionosphere Coupling; TERRAPUB: Tokyo, Japan, 2002. [Google Scholar]
  27. Kamogawa, M. Pre-seismic lithosphere-atmosphere-ionosphere coupling. EOS 2006, 87, 417–424. [Google Scholar] [CrossRef]
  28. Pulinets, S.A.; Ouzounov, D. Lithosphere-Atmosphere-Ionosphere Coupling (LAIC) model—An unified concept for earthquake precursors validation. J. Southeast Asian Earth Sci. 2011, 41, 371–382. [Google Scholar] [CrossRef]
  29. Pulinets, S.A.; Davidenko, D. Ionospheric precursors of earthquakes and Global Electric Circuit. Adv. Space Res. 2014, 53, 709–723. [Google Scholar] [CrossRef]
  30. Sorokin, V.M.; Hayakawa, M. Generation of Seismic-Related DC Electric Fields and Lithosphere-Atmosphere-Ionosphere Coupling. Mod. Appl. Sci. 2013, 7, 1–25. [Google Scholar] [CrossRef]
  31. Sorokin, V.M.; Hayakawa, M. Plasma and Electromagnetic Effects Caused by the Seismic-Related Disturbances of Electric Current in the Global Circuit. Mod. Appl. Sci. 2014, 8, 61–83. [Google Scholar] [CrossRef]
  32. Li, M.; Lu, J.; Parrot, M.; Tan, H.; Chang, Y.; Zhang, X.; Wang, Y. Review of unprecedented ULF electromagnetic anomalous emissions possibly related to the Wenchuan MS = 8.0 earthquake, on 12 May 2008. Nat. Hazards Earth Syst. Sci. 2013, 13, 279–286. [Google Scholar] [CrossRef]
  33. Ma, T.; Wu, Z. Precursor-like anomalies prior to the 2008 Wenchuan earthquake: A critical-but-constructive review. Int. J. Geophys. 2012, 1687–1885X, 55–64. [Google Scholar] [CrossRef]
  34. Gao, S.D.; Tang, J.; Du, X.B.; Liu, X.F.; Su, Y.G.; Chen, Y.P.; Di, G.R.; Mei, D.L.; Zhan, Y.; Wang, L.F. The change characteristics of electromagnetic field before to after Wenchuan MS 8.0 earthquake. Chin. J. Geophys. 2010, 53, 512–525. (In Chinese) [Google Scholar] [CrossRef]
  35. Ma, Q.Z. Abnormal signals of geoelectric field related to Wenchuan MS 8.0 earthquake recorded at the Chengdu station. Acta Seismol. Sin. 2018, 40, 351–363. [Google Scholar] [CrossRef]
  36. An, Z.H.; Du, X.B.; Tan, D.C.; Fan, Y.Y.; Liu, J.; Cui, T.F. Study on the geo-electrical field variation of Sichuan Lushan MS 7.0 and Wenchuan MS 8.0 earthquake. Chinese J. Geophys. 2013, 56, 3868–3876. (In Chinese) [Google Scholar] [CrossRef]
  37. Ding, Y.J.; Chen, H.R.; Zhang, J.G. The preliminary research on anomalous variation character of electromagnetic radiation before the Wenchuan MS 8.0 earthquake. Seismol. Geomagn. Obs. Res. 2009, 30, 11–15. (In Chinese) [Google Scholar]
  38. Zhang, J.G.; Jiao, L.G.; Liu, X.C.; Ma, X.X. A study on the characteristics of ULF electromagnetic spectrum before and after the Wenchuan MS 8.0 earthquake. Chin. J. Geophys. 2013, 56, 1253–1261. (In Chinese) [Google Scholar] [CrossRef]
  39. Tian, S.; Zhang, L.; Wang, J.G.; Xu, X.G.; Dong, H.J.; Yao, H.Q. Geo-electric field anomaly before the Wenchuan and Yushu earthquakes. Prog. Geophys. 2012, 27, 878–887. (In Chinese) [Google Scholar]
  40. Li, M.; Lu, J. ULF electromagnetic abnormity recorded at Gaobeidian and Ningjin stations before the Wenchuan 8.0 earthquake. Int. Seismol. Dyn. 2009, 367, 76–82. (In Chinese) [Google Scholar]
  41. Li, M.; Tan, H.D.; Cao, M. Ionospheric influence on the seismo-telluric current related to electromagnetic signals observed before the Wenchuan MS 8.0 earthquake. Solid Earth 2016, 7, 1405–1415. [Google Scholar] [CrossRef]
  42. Zhang, J.G.; Liu, X.C.; Tang, T.M.; Ma, J.Z. Research on dynamic evolution characteristics of geomagnetic field in Chinese mainland before and after Wenchuan MS 8.0 earthquake. J. Seismol. Res. 2009, 32, 231–234. (In Chinese) [Google Scholar]
  43. Hu, J.C.; Liu, W.; Guo, M.R.; Zheng, H. The “double low-points” anomaly of daily vertical component variation of geomagnetic field before the M 8.0 Wenchuan earthquake. Acta Seismol. Sin. 2009, 31, 589–593. (In Chinese) [Google Scholar] [CrossRef]
  44. Wang, W.X.; Ding, J.H.; Yu, S.R.; Zhang, Y.X. Short-term geomagnetic abnormity before Wenchuan MS 8.0 earthquake and strong earthquake prediction explore. Earthq. Sci. 2009, 31, 172–179. (In Chinese) [Google Scholar]
  45. Zhang, X.M.; Ding, J.H.; Shen, X.H.; Wang, M.; Liu, J.; Yu, S.R.; Wang, Y.L.; Ouyang, X.Y. Electromagnetic perturbations before Wenchuan M 8 earthquake and stereo electromagnetic observation system. Chin. J. Radio Sci. 2009, 24, 1–8. (In Chinese) [Google Scholar]
  46. Cheng, F.Z.; Ren, Y.X.; Wu, X.P. Analyzing the anomalies of geo-electrical and geo-magnetic observation data in Sichuan Province before the 2008 Wenchuan M 8.0 Earthquake. Earthq. Res. Sichuan 2010, 135, 2–9. (In Chinese) [Google Scholar]
  47. Zhang, X.M.; Shen, X.H.; Liu, J.; Ouyang, X.Y.; Qian, J.D.; Zhao, S.F. Ionospheric perturbations of electron density before the Wenchuan Earthquake. Int. J. Remote Sens. 2010, 31, 3559–3569. [Google Scholar] [CrossRef]
  48. Hayakawa, M.; Schekotov, A.; Potirakis, S.M.; Eftaxias, K.; Li, Q.; Asano, T. An Integrated Study of ULF Magnetic Field Variations in Association with the 2008 Sichuan Earthquake, on the Basis of Statistical and Critical Analyses. Open J. Earthq. Res. 2015, 4, 85–93. [Google Scholar] [CrossRef] [Green Version]
  49. Li, Q.; Schekotov, A.; Asano, T.; Hayakawa, M. On the Anomalies in ULF Magnetic Field Variations Prior to the 2008 Sichuan Earthquake. Open J. Earthq. Res. 2015, 4, 55–64. [Google Scholar] [CrossRef] [Green Version]
  50. Li, M.; Lu, J.; Su, X.Z.; Feng, Z.S. A study on fractal Brownian motion of geomagnetic observations before large earthquakes. Acta Seismol. Sin. 2009, 31, 650–659. (In Chinese) [Google Scholar]
  51. Li, M.; Yao, L.; Wang, Y.L.; Parrot, M.; Hayakawa, M.; Lu, J.; Tan, H.D.; Xie, T. Anomalous phenomena in DC-ULF geomagnetic daily variation registered three days before the 12 May 2008 Wenchuan MS 8.0 earthquake. Earth Planet. Phys. 2019, 3, 328–339. [Google Scholar] [CrossRef]
  52. Guan, H.; Chen, Z. Qualitative study of the relationship between earthquakes and electromagnetic information. Earthquake 1996, 16, 168–176. (In Chinese) [Google Scholar]
  53. Guan, H.; Han, F.; Xiao, W.; Chen, Z. ULF electromagnetic observation and data processing methods. Earthquake 2003, 23, 85–93. (In Chinese) [Google Scholar]
  54. Guan, H.; Zhang, H.; Lu, Y. Study of the relationship between earthquakes and ULF electromagnetic information at Huailai station. Earthquake 1999, 19, 142–148. (In Chinese) [Google Scholar]
  55. Zhuang, J.; David, V.; Guan, H.; Yosihiko, O.; Ma, L. Preliminary Analysis of Observations on the Ultra-Low Frequency Electric Field in the Beijing Region. Pure Appl. Geophys. 2005, 162, 1367–1396. [Google Scholar] [CrossRef]
  56. Wang, X.M.; Teng, Y.T.; Wang, X.Z.; Wang, C.; Wu, Q. The test method for the performance of fluxgate magnetometer. Seismol. Geomagn. Obs. Res. 2008, 29, 88–94. (In Chinese) [Google Scholar]
  57. Zhao, B.; Yu, T.; Wang, M.; Wan, W.; Lei, J.; Liu, L.; Ning, B. Is an unusual large enhancement of ionospheric electron density linked with the 2008 great Wenchuan earthquake? J. Geophys. Res. 2008, 113, A11304. [Google Scholar] [CrossRef]
  58. Yu, T.; Mao, T.; Wang, Y.G.; Wang, J.S. Study of the ionospheric anomaly before the Wenchuan earthquake. Chin. Sci. Bull. 2009, 54, 1086–1092. (In Chinese) [Google Scholar] [CrossRef]
  59. Ding, Z.H.; Wu, J.; Sun, S.J.; Chen, J.S.; Ban, P.P. The variation of ionosphere on some days before the Wenchuan Earthquake. Chin. J. Geophys. 2010, 53, 30–38. [Google Scholar]
  60. Xu, T.; Hu, Y.L.; Wu, J.; Wu, Z.S.; Suo, Y.C.; Feng, J. Giant disturbance in the ionospheric F2 region prior to the M 8.0 Wenchuan earthquake on 12 May 2008. Ann. Geophys. 2010, 28, 1533–1538. [Google Scholar] [CrossRef]
  61. Xu, T.; Hu, Y.L.; Wu, J.; Wu, Z.S.; Suo, Y.C.; Feng, J.; Huang, C.J. Abnormal perturbations in the ionospheric F2 region before Wenchuan earthquake on 12 May 2008. Sci. China Ser. D Earth Sci. 2010, 53, 1671–1674. [Google Scholar] [CrossRef]
  62. Sun, Y.Y.; Oyama, K.-I.; Liu, J.Y.; Jhuang, H.K.; Cheng, C.Z. The neutral temperature in the ionospheric dynamo region and the ionospheric F region density during Wenchuan and Pingtung Doublet earthquakes. Nat. Hazards Earth Syst. Sci. 2011, 11, 1759–1768. [Google Scholar] [CrossRef] [Green Version]
  63. Xu, T.; Wu, J.; Zhao, Z.; Liu, Y.; He, S.; Li, J.; Wu, Z.; Hu, Y. Brief communication “Monitoring ionospheric variations before earthquakes using the vertical and oblique sounding network over China”. Nat. Hazards Earth Syst. Sci. 2011, 11, 1083–1089. [Google Scholar] [CrossRef]
  64. Maurya, A.K.; Singh, R.; Veenadhari, B.; Kumar, S.; Singh, A.K. Sub-ionospheric very low frequency perturbations associated with the 12 May 2008 M = 7.9 Wenchuan earthquake. Nat. Hazards Earth Syst. Sci. 2013, 13, 2331–2336. [Google Scholar] [CrossRef]
  65. Zhang, X.M.; Shen, X.H.; Liu, J.; Ouyang, X.Y.; Qian, J.D.; Zhao, S.F. Analysis of ionospheric plasma perturbations before Wenchuan earthquake. Nat. Hazards Earth Syst. Sci. 2009, 9, 1259–1266. [Google Scholar] [CrossRef] [Green Version]
  66. Zhang, X.M.; Shen, X.H.; Ouyang, X.Y.; Cai, J.A.; Huang, J.P.; Liu, J.; Zhao, S.F. Ionosphere VLF electric field anomalies before Wenchuan M 8 earthquake. Chin. J. Radio Sci. 2009, 24, 1024–1032. (In Chinese) [Google Scholar]
  67. Zeng, Z.C.; Zhang, B.; Fang, G.Y.; Wang, D.F.; Yin, H.J. The analysis of ionospheric variations before Wenchuan earthquake with DEMETER data. Chin. J. Geophys. 2009, 52, 11–19. (In Chinese) [Google Scholar] [CrossRef]
  68. An, Z.H.; Fan, Y.Y.; Liu, J.; Tan, D.C.; Chen, J.Y.; Zheng, G.; Xie, T. Analysis on ion temperature variation detected by DEMETER before 2008 Wenchuan MS 8.0 earthquake. Acta Seismol. Sin. 2010, 32, 754–759. (In Chinese) [Google Scholar]
  69. Błeçki, J.; Parrot, M.; Wronowski, R. Studies of the electromagnetic field variations in ELF frequency range registered by DEMETER over the Sichuan region prior to the 12 May 2008 earthquake. Int. J. Remote Sens. 2010, 31, 3615–3629. [Google Scholar] [CrossRef]
  70. Sarkar, S.; Gwal, A.K. Satellite monitoring of anomalous effects in the ionosphere related to the great Wenchuan earthquake of 12 May 2008. Nat. Hazards Earth Syst. Sci. 2010, 55, 321–332. [Google Scholar] [CrossRef]
  71. He, Y.; Yang, D.; Qian, J.; Parrot, M. Response of the ionospheric electron density to different types of seismic events. Nat. Hazards Earth Syst. Sci. 2011, 11, 2173–2180. [Google Scholar] [CrossRef] [Green Version]
  72. He, Y.F.; Yang, D.M.; Qian, J.D.; Parrot, M. Anomaly of the ionospheric electron density close to earthquakes: Case studies of Pu’er and Wenchuan earthquakes. Earthq. Sci. 2011, 24, 549–555. [Google Scholar] [CrossRef]
  73. Onishi, T.; Berthelier, J.J.; Kamogawa, M. Critical analysis of the electrostatic turbulence enhancements observed by DEMETER over the Sichuan region during the earthquake preparation. Nat. Hazards Earth Syst. Sci. 2011, 11, 561–570. [Google Scholar] [CrossRef] [Green Version]
  74. Yan, X.X.; Shan, X.J.; Cao, J.B.; Tang, J.; Wang, F.F. Seismoionospheric anomalies observed before the Wenchuan earthquake using GPS and DEMETER data. Seismol. Geol. 2012, 34, 160–171. [Google Scholar] [CrossRef]
  75. Wan, J.H.; Wang, F.F.; Shan, X.J.; Yan, X.X. Preliminary application of energetic particle on DEMETER Satellite in Wenchuan earthquake. Prog. Geophys. 2012, 27, 2279–2288. (In Chinese) [Google Scholar]
  76. Walker, S.N.; Kadirkamanathan, V.; Pokhotelov, O.A. Changes in the ultra-low frequency wave field during the precursor phase to the Sichuan earthquake: DEMETER observations. Ann. Geophys. 2013, 31, 1597–1603. [Google Scholar] [CrossRef] [Green Version]
  77. Ryu, K.; Parrot, M.; Kim, S.G.; Jeong, K.S.; Chae, J.S.; Pulinets, S.; Oyama, K.I. Suspected seismo-ionospheric coupling observed by satellite measurements and GPS TEC related to the M7.9 Wenchuan earthquake of 12 May 2008. J. Geophys. Res. Space Phys. 2014, 119, 305–323. [Google Scholar] [CrossRef]
  78. Liu, J.Y.; Chen, Y.I.; Huang, C.C.; Parrot, M.; Shen, X.H.; Pulinets, S.A.; Yang, Q.S.; Ho, Y.Y. A spatial analysis on seismo-ionospheric anomalies observed by DEMETER during the 2008 M 8.0 Wenchuan earthquake. J. Asian Earth Sci. 2015, 114, S1367912015003399. [Google Scholar] [CrossRef]
  79. Zhao, B.Q.; Wang, M.; Yu, T.; Xu, G.R.; Wan, W.X.; Liu, L.B. Ionospheric total electron content variations prior to the 2008 Wenchuan Earthquake. Int. J. Remote Sens. 2010, 31, 3545–3557. [Google Scholar] [CrossRef]
  80. Lin, J.; Wu, Y.; Zhu, F.Y.; Qiao, X.J.; Zhou, Y.Y. Wenchuan earthquake ionosphere TEC anomaly detected by GPS. Chin. J. Geophys. 2009, 52, 297–300. (In Chinese) [Google Scholar]
  81. Liu, J.Y.; Chen, Y.I.; Chen, C.H.; Liu, C.Y.; Chen, C.Y.; Nishihashi, M.; Li, J.Z.; Xia, Y.Q.; Oyama, K.I.; Hattori, K.; et al. Seismoionospheric GPS total electron content anomalies observed before the 12 May 2008 MW7.9 Wenchuan earthquake. J. Geophys. Res. 2009, 114, A04320. [Google Scholar] [CrossRef]
  82. Zhu, F.Y.; Wu, Y.; Lin, J.; Zhou, Y.Y.; Xiong, J.; Yang, J. Anomalous response of ionospheric VTEC before the Wenchuan earthquake. Acta Seismol. Sin. 2009, 31, 180–187. [Google Scholar]
  83. Pulinets, S.A.; Bondur, V.G.; Tsidilina, M.N.; Gaponova, M.V. Verification of the concept of seismoionospheric coupling under quiet heliogeomagnetic conditions, using the Wenchuan (China) earthquake of 12 May 2008, as an example. Geomagn. Aeron. 2009, 50, 231–242. [Google Scholar] [CrossRef]
  84. Ma, X.X.; Lin, Z.; Chen, H.R.; Jin, H.L.; Liu, X.C.; Jiao, L.G. Analysis on ionospheric perturbation of TEC and NmF2 based on GPS and COSMIC data before and after the Wenchuan earthquake. Chin. J. Geophys. 2014, 57, 2415–2422. (In Chinese) [Google Scholar] [CrossRef]
  85. Hsiao, C.C.; Liu, J.Y.; Oyama, K.I.; Yen, N.L.; Liou, Y.A.; Chen, S.S.; Miau, J.J. Seismo-ionospheric precursor of the 2008 Mw 7.9 wenchuan earthquake observed by formosat-3/cosmic. GPS Solut. 2010, 14, 83–89. [Google Scholar] [CrossRef]
  86. Klimenko, M.V.; Klimenko, V.V.; Zakharenkova, I.E.; Pulinets, S.A.; Zhao, B.; Tsidilina, M.N. Formation mechanism of great positive TEC disturbances prior to Wenchuan earthquake on 12 May 2008. Adv. Space Res. 2011, 48, 488–499. [Google Scholar] [CrossRef]
  87. Pulinets, S.A.; Legen’ka, A.D.; Alekseev, V.A. Pre-earthquakes effects and their possible mechanisms. In Dusty and Dirty Plasmas, Noise and Chaos in Space and in the Laboratory; Plenum Publishing: New York, NY, USA, 1994; pp. 545–557. [Google Scholar]
  88. Pulinets, S.A.; Alekseev, V.A.; Legen’ka, A.D.; Khegai, V.V. Radon and metallic aerosols emanation before strong earthquakes and their role in atmosphere and ionosphere modification. Adv. Space Res. 1997, 20, 2173–2176. [Google Scholar] [CrossRef]
  89. Pulinets, S.A.; Khegai, V.V.; Boyarchuk, K.A.; Lomonosov, A.M. Atmospheric electric field as a source of ionospheric variability. Phys. Uspekhi 1998, 41, 515–522. [Google Scholar] [CrossRef]
  90. Molchanov, O.A.; Fedorov, E.; Schekotov, A.; Gordeev, E.; Chebrov, V.; Surkov, V.; Rozhnoi, A.; Andreevsky, S.; Iudin, D.; Yunga, S.; et al. Lithosphere-atmosphere-ionosphere coupling as governing mechanism for preseismic short-term events in atmosphere and ionosphere. Nat. Hazards Earth Syst. Sci. 2004, 4, 757–767. [Google Scholar] [CrossRef] [Green Version]
  91. Freund, F. Earthquake Forewarning—A Multidisciplinary Challenge from the Ground up to Space. Acta Geophys. 2013, 61, 775–807. [Google Scholar] [CrossRef]
  92. Pulinets, S.A.; Boyarchuk, K.A. Ionospheric Precursors of Earthquakes; Springer: Berlin/Heidelberg, Germany, 2004. [Google Scholar]
  93. Liperovsky, V.A.; Pokhotelov, O.A.; Meister, C.-V.; Liperovskaya, E.V. Physical models of coupling in the lithosphere-atmosphere-ionosphere system before earthquakes. Geomagn. Aeron. 2008, 48, 795–806. [Google Scholar] [CrossRef]
  94. Freund, F.T. Pre-earthquake signals: Underlying physical processes. J. Asian Earth Sci. 2011, 41, 383–400. [Google Scholar] [CrossRef]
  95. Qin, K.; Wu, L.X.; Zheng, S.; Bai, Y.; Lv, X. Is there an abnormal enhancement of atmospheric aerosol before the 2008 wenchuan earthquake? Adv. Space Res. 2014, 54, 1029–1034. [Google Scholar] [CrossRef]
  96. Liu, J.Y.; Chen, Y.I.; Chuo, Y.J.; Tsai, H.F. Variations of ionospheric total electron content during the Chi-Chi earthquake. Geophys. Res. Lett. 2001, 28, 1383–1386. [Google Scholar] [CrossRef]
  97. Pan, H.; Zhang, J.G.; Yang, D.M.; Li, M. A possible mechanism of the contributing factor of geomagnetic lowest shift. J. Geod. Geodyn. 2014, 34, 83–87. (In Chinese) [Google Scholar]
  98. Kuo, C.L.; Huba, J.D.; Joyce, G.; Lee, L.C. Ionosphere plasma bubbles and density variations induced by pre-earthquake rock currents and associated surface charges. J. Geophys. Res. 2011, 116, A10317. [Google Scholar] [CrossRef]
  99. Kuo, C.L.; Lee, L.C.; Huba, J.D. An improved coupling model for the lithosphere-atmosphere-ionosphere system. J. Geophys. Res. Space Phys. 2014, 119, 3189–3205. [Google Scholar] [CrossRef]
  100. Anagnostopoulos, G.; Spyroglou, I.; Rigas, A.; Preka-Papadema, P.; Mayromichalaki, E.; Kiosses, G. The sun as a significant agent provoking earthquakes. Eur. Phys. J. 2019, in press. [Google Scholar]
Figure 1. Temporal distribution of the appearance of all the reported anomalies (adapted from [33]).
Atmosphere 10 00355 g001
Figure 2. (a) Locations of the Wenchuan earthquake (EQ) epicenter and ultra low frequency (ULF) EM observing stations. Red solid triangles are stations recording ULF electrical emissions during the Wenchuan EQ; the black solid triangle shows the Sanhe (SH) station which was running when the event occurred but recorded no anomaly; empty black triangles show the stations out of order during the Wenchuan event. The Wenchuan main shock is labeled by a red empty star. The red solid star denotes Beijing. (b) Timeline of daily total cumulative amplitude (black bar) of electromagnetic information recorded at the Gaobeidian (GBD) station during 2007–2008.
Atmosphere 10 00355 g002
Figure 3. Locations of the geomagnetic observing stations in China during the Wenchuan MS 8.0 EQ. Red triangles represent geomagnetic stations registering “double low-point” anomalous phenomena in the vertical Z on 9 May 2008 and blue ones represent stations recording these phenomena on 8 and 9 May 2008. Black squares are stations which did not record this kind of anomaly during the period of 20 April–12 May 2008. The location of the Wenchuan MS 8.0 EQ is indicated by a red star.
Atmosphere 10 00355 g003
Figure 4. Statistical ionospheric variations during the period of 1–12 May 2008. Blue lines represent an anomaly and red lines represent a distinct anomaly. The Wenchuan MS 8.0 EQ that occurred on 12 May 2008 is labeled by an arrow.
Atmosphere 10 00355 g004
Figure 5. Copies of part of the original real-time analog recordings: (a) from 0900 on 8 May to 0900 on 9 May and (b) from 0900 on 9 May to 0900 on 10 May in 2008 at the GBD station.
Atmosphere 10 00355 g005
Figure 6. Daily changes of the geomagnetic vertical Z at the CD station and Kp-index. (a) Daily vertical Z fluctuations from 20 April to 12 May 2008. The unusual fluctuation on 9 May is labeled by a black arrow and the Wenchuan 8.0 EQ is also labeled. (b) Daily average Kp-index fluctuations from 20 April to 12 May 2008. (c) Average daily vertical Z fluctuations during the period of 2009–2016 from 20 April to 12 May (adapted from [51]).
Atmosphere 10 00355 g006
Figure 7. Variation amplitude obtained by using minute readings from 0400 LT on 9 May 2008 to 0400 LT on 10 May 2008, subtracting the corresponding average values during the period of 1–5 May at the CD station.
Atmosphere 10 00355 g007
Figure 8. Fluctuating processes on ULF electrical (Elec.) emissions recorded at the GBD station, DC-ULF geomagnetic (Geom.) Z “double low-point” phenomenon recorded at the CD station, and previously reported ionospheric (Iono.) variations on 9 May 2008. Blue represents general variations, orange represents increasing anomalies, and red represents climax anomalies, respectively.
Atmosphere 10 00355 g008
Figure 9. Weekly magnetic field and solar wind fluctuations recorded by ACE from 124.0th day to 131.0th day in 2008 (3 May to 9 May 2008). The panels, from top the bottom, display the magnetic field magnitude B, the polar coordinates of the field δ and λ, the uncertainty Brms, solar wind velocity Vp and the density of the proton plasma Np.
Atmosphere 10 00355 g009

