Article

SLCO1B1 Genetic Variation Influence on Atorvastatin Systemic Exposure in Pediatric Hypercholesterolemia

1
Ward Family Heart Center, Children’s Mercy, Kansas City, MO 64108, USA
2
Division of Clinical Pharmacology and Toxicology, Children’s Mercy, Kansas City, MO 64108, USA
3
Department of Pediatrics, University of Missouri-Kansas City School of Medicine, Kansas City, MO 64108, USA
4
Health Services & Outcomes Research, Children’s Mercy, Kansas City, MO 64108, USA
5
Clinical Pharmacology Shared Resource, University of Kansas Cancer Center, Fairway, KS 66205, USA
*
Author to whom correspondence should be addressed.
Genes 2024, 15(1), 99; https://doi.org/10.3390/genes15010099
Submission received: 13 December 2023 / Revised: 4 January 2024 / Accepted: 10 January 2024 / Published: 15 January 2024
(This article belongs to the Special Issue Genetics, Genomics and Precision Medicine in Heart Diseases)

Abstract

:
This clinical study examined the influence of SLCO1B1 c.521T>C (rs4149056) on plasma atorvastatin concentrations in pediatric hypercholesterolemia. The participants (8–21 years), including heterozygous (c.521T/C, n = 13), homozygous (c.521C/C, n = 2) and controls (c.521T/T, n = 13), completed a single-oral-dose pharmacokinetic study. Similar to in adults, the atorvastatin (AVA) area-under-concentration-time curve from 0 to 24 h (AUC0–24) was 1.7-fold and 2.8-fold higher in participants with c.521T/C and c.521C/C compared to the c.521T/T participants, respectively. The inter-individual variability in AVA exposure within these genotype groups ranged from 2.3 to 4.8-fold, indicating that additional factors contribute to the inter-individual variability in the AVA dose–exposure relationship. A multivariate model reinforced the SLCO1B1 c.521T>C variant as the central factor contributing to AVA systemic exposure in this pediatric cohort, accounting for ~65% of the variability in AVA AUC0–24. Furthermore, lower AVA lactone concentrations in participants with increased body mass index contributed to higher exposure within the c.521T/T and c.521T/C genotype groups. Collectively, these factors contributing to higher systemic exposure could increase the risk of toxicity and should be accounted for when individualizing the dosing of atorvastatin in eligible pediatric patients.

1. Introduction

Atorvastatin (AVA) is a moderately lipophilic, synthetic inhibitor of 3-hydroxy-3-methyl-glutaryl coenzyme A (HMG-CoA) reductase, labeled to treat children 10 years of age and older with heterozygous familial hypercholesterolemia [1,2]. AVA is given in its active acid form [3] and experiences hepatic uptake via the OATP1B1 and OATP1B3 proteins [4]. Cytochrome P450 (CYP)-mediated metabolism (e.g., CYP3A4) leads to the formation of an active metabolite, 2-hydroxyatorvastatin (Figure 1) [5,6]. AVA undergoes phase II metabolism (e.g., UGT1A1/3) to form inactive metabolites, atorvastatin lactone (AVL) and 2-hydroxyatorvastatin lactone (2-OH AVL) [7,8]. Following biotransformation, AVA is a substrate for MDR1 (e.g., P-Gp) and BCRP, which are responsible for hepatic clearance into the bile [9,10]. Given its lipophilic nature, AVA, similar to simvastatin acid, may experience more passive movement across extra-hepatic tissues (e.g., skeletal muscle, brain) compared to pravastatin or rosuvastatin [11,12,13,14,15,16,17]. However, a comparative study between lipophilic and hydrophilic statins and their differential effects on extra-hepatic cellular translocation leading to excessive systemic exposure and subsequent toxicity remains unknown.
An approximate 40–60% decline in low-density lipoprotein cholesterol (LDL-C) has been demonstrated amongst three prospective AVA trials in children (ages 6–21 years), demonstrating its clinical effectiveness in the pediatric population [18,19,20]. Despite its effectiveness on a population basis, considerable (~2–5 fold) inter-individual variability in LDL-C has been observed. Of concern, in the only placebo-controlled trial on a pediatric cohort, nearly half of the participants did not reach target LDL-C levels (<130 mg/dL), even with self-reported adherence. Given the vast degree of variability in LDL-C decline and the dearth of longitudinal data on chronic statin exposure in a pediatric cohort, it is necessary that optimal statin dosing is established to maximize its effectiveness while minimizing its toxicity in a developing child.
To evaluate the inter-individual variability in LDL-C decline with statins, investigators must evaluate if poor or altered LDL-C decline is due to inadequate plasma AVA concentrations at the drug target (e.g., hepatocyte) or caused by inadequate drug target engagement due to the diminished expression and/or function of the targets of drug action. With respect to the former, hepatic uptake to the site of action within the liver represents the largest contributor to altered plasma statin concentrations. OATP1B1, encoded by the SLCO1B1 gene, is a hepatic uptake protein and a major contributor to AVA hepatocellular transport [21,22]. The SLCO1B1 variant NM_006446.5:c.521T>C (rs4149056) leads to an amino acid change (NP_006437.3:p.V174A), which leads to impaired OATP1B1 localization on the basolateral membrane [21]. As a result, this amino acid change in the OATP1B1 protein leads to decreased liver uptake and increased plasma AVA concentrations [23,24,25]. Previously, adult participants with SLCO1B1 c.521T/C or c.521C/C genotypes had a ~1.5- to 2.5-fold increase in plasma AVA concentrations relative to those with the reference genotype (c.521T/T) [23]. The c.521T>C variant is relatively frequent (its global frequency is ~12% according to the gnomAD database; accessed 27 September 2023) and, according to the Pharmacogene Variation (PharmVar) Consortium [26,27], can occur in several haplotypes or star alleles, i.e., SLCO1B1*5, *15, *40, *46 and *47. Of these, four are designated by the Clinical Pharmacogenetics Consortium (CPIC) to have “no function”, while one (SLCO1B1*40) is of an “uncertain function”.
However, the extrapolation of the adult c.521T>C genotype–phenotype relationship to a hypercholesterolemic child neglects the potential developmental differences in the expression of genes responsible for statin disposition. For example, we have recently demonstrated in a pediatric cohort that the influence of c.521T>C on simvastatin acid plasma concentrations was two-fold greater in children compared to adults, suggesting that this variant may be more impactful for a pediatric cohort [28]. In contrast, the genotype effect on a similar pediatric cohort receiving pravastatin and rosuvastatin was akin to the adult experience [23,29,30,31]. Surprisingly, in the aforementioned pediatric cohorts administered simvastatin and pravastatin, a significant within-c.521T>C-genotype variability in plasma statin concentration (~8- to 17-fold) was observed, with nongenetic factors partially contributing to the observed large range of plasma statin concentrations [28,29]. However, the magnitude of genetic and nongenetic factors is statin-dependent. Currently, the influence of pharmacogenomic and nonpharmacogenetic (i.e., developmental) factors on plasma AVA concentrations is not well established.
Understanding the impact of drug disposition development (e.g., ontogeny) and c.521T>C on statin disposition is crucial to optimizing drug and dose recommendations for a pediatric cohort. Thus, the primary goal of this investigation was to establish the role of the SLCO1B1 c.521T>C variant on plasma AVA concentrations in pediatric hypercholesterolemia.

2. Methods

2.1. Subjects

Those recruited from the Children’s Mercy Hospital Cardiology Pharmacogenomics Repository (CPR), a living biorepository and patient registry designed to facilitate genotype-stratified clinical trial participant selection, were screened for inclusion and exclusion criteria as previously reported [31]. Reference genotype (c.521T/T) and heterozygous variant populations (c.521T/C) were matched based on age, ethnicity and sex. Two additional participants with the c.521C/C genotype were enrolled as co-variates and not matched to the aforementioned groups. The study protocol was reviewed and approved by the Children’s Mercy Hospital Institutional Review Board, and the study was conducted in accordance with the US standards of Good Clinical Practice (ICH guidance E6(R3)). Informed permission/assent or consent was obtained from all those participating in the study.

2.2. Genetic Analysis

Genomic DNA was isolated from whole blood using a GeneEluteTM Mammalian Genomic DNA Miniprep Kit (Sigma, St. Louis, MO, USA) or a QIAamp® DNA Blood Mini Kit (Qiagen, Valencia, CA, USA) according to the manufacturer’s protocols. DNA samples were genotyped for SLCO1B1 c.-11187G>A (rs4149015), c.388A>G (p.N130D, rs2306283) and c.521T>C (p.V174A, rs4149056) using commercially available TaqMan® single-nucleotide polymorphism (SNP) genotyping tests (Thermo Fisher Scientific, Waltham, MA, USA) with KAPA Probe Fast qPCR Master Mix (2X) ABI Prism® (KAPA Biosystems, Boston, MA, USA) on a QuantStudio12k Flex Real-Time PCR System (Thermo Fisher Scientific, Waltham, MA, USA). Cycling conditions for all assays were as recommended by the manufacturer. Coriell Institute for Medical Research (Camden, NJ, USA) DNA samples were used as controls. Twenty percent of the samples were chosen and reanalyzed for quality control and were concordant with the initial data.
The samples were subjected to a targeted next-generation sequencing (NGS) panel a posteriori to test additional variants in SLCO1B1 and variants of other genes that influence AVA disposition [23,32,33,34,35,36], as noted above in the first introductory paragraph. These included the following genes (proteins) of interest in AVA disposition: SLCO1B3 (OATP1B3), ABCB1 (MDR1 or P-gp), ABCG2 (BCRP), CYP3A4 (CYP3A4), CYP3A5 (CYP3A5), UGT1A1 (UGT1A1) and UGT1A3 (UGT1A3). In short, a TruSeq Library constructed according to the manufacturer’s protocol (Illumina, San Diego, CA, USA) and a custom targeted capture sequencing panel, ADME Panel (Integrated DNA Technologies, Coralville, IA, USA), were used for data enhancement [37]. Samples were sequenced on a MiSeq instrument (Illumina, San Diego, CA, USA) with paired-end 200-base pair reads. The read coverage was approximately 300×. Variants within the gene regions of interest were retrieved with NGS using bcftools (v1.7-8). For genes with a star allele nomenclature, calls were made manually for SLCO1B1, CYP3A4 and CYP3A5 based on PharmVar allele definitions and for UGT1A1 and UGT1A3, using the UGT Nomenclature site at https://www.pharmacogenomics.pha.ulaval.ca/ugt-alleles-nomenclature/ (accessed on 8 December 2023).

2.3. Study Design

This single-center, open-label, genotype-stratified, single-oral-dose pharmacokinetic study compared plasma AVA concentrations amongst pediatric hypercholesterolemic patients with one or two SLCO1B1 variant alleles (c.521T/C and T/T) to patients who had the reference genotype (c.521T/T). Those on statin therapy required a 7-day washout prior to the study visit. A screening physical examination (including sexual maturity rating via Tanner Staging) was performed prior to ingesting AVA.
A single oral dose of AVA (ages 8–21 years: 10 mg tablet, Greenstone Pharmaceuticals®, Lot Number L57138) was given with water after an overnight fast, and no meals were allowed for 3 h after AVA ingestion. Venous blood samples were drawn from an intravenous line prior to AVA ingestion (time 0) and at 0.5, 1, 1.5, 2, 2.5, 3, 4, 5, 7, 9, 18 and 24 h post-ingestion to measure plasma AVA and AVA metabolite concentrations. Samples were immediately centrifuged at 4 °C for 10 min at 600 g. Plasma was removed and stored at −80 °C until the analysis.

2.4. Analytical Methods

Human plasma (50 µL) containing AVA, 2-hydroxy atorvastatin (2-OH AVA), atorvastatin lactone (AVL) and 2-hydroxy atorvastatin lactone (2-OH AVL) was spiked with 200 µL of cold 0.1% acetic acid in acetonitrile containing the combined internal standards (IS) (10 ng/mL) atorvastatin-d5, 2-hydroxy atorvastatin-d5, atorvastatin-d5 lactone and 2-hydroxy atorvastatin lactone-d5. All analytical reference compounds were purchased from Toronto Research Chemicals at their highest purity. Plasma proteins were precipitated with acetonitrile and centrifuged, and the filtrates were transferred to a new set of clean, labeled microcentrifuge tubes. An aliquot of the extracts was then transferred to a 96-well plate and analyzed by ultra-performance liquid chromatography tandem mass spectrometry (UPLC-MS/MS) with positive-ion electrospray ionization using multiple-reaction monitoring (MRM).
A Waters ACQUITY UPLC HSS C18 (3.5 μm, 2.1 × 100 mm) separated the analytes. Gradient elution was optimized with an acetonitrile–water–MeOH gradient: mobile phase A: water: MeOH: acetic acid (v/v/v), 90:10:0.1; mobile phase B: acetonitrile: methanol: acetic acid (v/v/v), 60:40:0.1. The yielded retention times were 2.54 min for AVA, 2.18 min for 2-OH AVA, 2.85 min for AVL and 2.45 min for 2-OH AVL. For the analytes, the MRM transitions 559.29 > 440.12 (AVA), 541.29 > 448.14 (AVL), 575.29 > 440.14 (2-OH AVA) and 557.27 > 448.11 (2-OH AVL) were used for quantitation. And for the IS, the MRM transitions 564.32 > 445.16 (AVA-d5), 546.31 > 453.15 (AVL-d5), 580.32 > 445.17 (2-OH AVA-d5) and 562.30 > 453.15 (2-OH AVL-d5) were used for quantification. All the data acquisition and analysis were carried out by Masslynx 4.2 software.
The validated linear range for the quantification of all the analytes was 0.5–100 ng/mL; the LLOQ (lower limit of quantification) for this assay is 0.5 ng/mL for each analyte. The linearity for all the analytes occurred in the range of 0.5–100 ng/mL. Intra- and inter-day precisions of ≤15% were used for three quality control levels (LQC: 1 ng/mL, MQC: 5 ng/mL, HQC: 50 ng/mL) and ≤20% for the LLOQ. The accuracy of the QC samples ranged from 80% to 120% of the theoretical concentrations at the LLOQ level and 85% to 115% at the three other quality control levels for atorvastatin and three metabolites.

2.5. Pharmacokinetic Parameters

Kinetica version 5.0 (Thermo Fisher Scientific, Philadelphia, PA, USA) was utilized for all plasma AVA analyses to generate the necessary pharmacokinetic parameters. Plasma AVA concentration vs. hours post dosing data for AVA, 2-OH AVA, AVL and 2-OH-AVL were curve fitted using a peeling algorithm to generate initial monoexponential parameter estimates. The final estimates of the terminal elimination rate constant (λz) were determined from a similar algorithm used previously [28,29,31]. The individual peak plasma concentration (Cmax) and time to maximal concentration (Tmax) were obtained by direct examination of the plasma AVA concentration versus hour profile. The area under the plasma concentration versus time curve during the sampling period (AUC0–n) was calculated using the mixed log–linear method, where n refers to the final sampling time with quantifiable plasma AVA or AVA metabolite concentrations. To determine if the AVA metabolites were driven by an elimination rate-limited vs. formation rate-limited process, a compartmental pharmacokinetic approach was performed on 23 participants with sufficient time points to accurately determine both the formation and elimination rate constants.

2.6. Statistical Analyses

Pharmacokinetic parameters were examined in JMP® version 14 (SAS, Cary, NC, USA). Pharmacokinetic parameters reflective of plasma AVA concentrations (Cmax, AUC0–n) and the SLCO1B1 genotype (c.521T/T vs. T/C and C/C) were dependent variables and independent variables, respectively. The Kruskal–Wallis test was leveraged to compare the pharmacokinetic parameters related to genotype groups and demographics.
Linear regression to examine the association between the AVA AUCn and c.521T>C genotype groups, adjusting for BMI z-score, sex and Tanner score, was performed. For modeling, the genotype was captured by coding the number of c.521C alleles (0, 1, or 2) and treating this as a quantitative variable. A single Tanner score was computed by averaging each participant’s Tanner breast/testicular and Tanner public hair stage scores. AVA AUC0–24 was first modeled as a function of BMI z-score, sex and Tanner score to estimate the proportion of variability that could be accounted for by these participant characteristics. Then, the count of c.521C alleles was added to the model to estimate the additional variability accounted for.
AVA given at a fixed dose resulted in an almost 4-fold range of weight-based doses (0.07–0.28 mg/kg). Therefore, the Cmax and AUC were normalized to a dose for each individual participant by dividing the exposure parameter value by the actual mg/kg dose received, then multiplying by the mean mg/kg dose for the entire cohort (e.g., participant AUC (ng·hr/mL)/participant dose (mg/kg) × cohort mean dose (mg/kg)).

3. Results

3.1. Participant Demographics and Adverse Events

Twenty-eight participants (fifteen males, thirteen females) successfully completed the study, and no participants withdrew from the study. The participant demographics were similar between the SLCO1B1 c.521 T/C groups (Table 1). This includes similar mg/kg doses received between the genotype groups. No adverse events were reported during the study.

3.2. Drug Disposition Profiles

The drug disposition profiles of plasma AVA, AVL, 2-OH AVA and 2-OH AVL (Figure 2A–D) reflected first-order absorption and elimination. Plasma AVA, AVL, 2-OH AVA and 2-OH AVL concentrations were present in all the participants. Secondary AVA peaking, suggestive of entero-hepatic recirculation, in 12 participants (43%) precluded an accurate assessment of the mean terminal elimination rate constant across the population.
A relatively large plasma AVA concentration range (~nine-fold) was found (median (IQR), Cmax: 2.2 ng/mL (1.6–3.5 ng/mL); and AUC0–24: 17.1 ng·hr/mL (11.5–19.7), Table S1). Significant variability was also observed for AVL (median (IQR), Cmax: 0.9 ng/mL (0.7–1.2); AUC0–24: 8.7 ng·hr/mL (4.0–15.0), Table S1), 2-OH AVA (median (IQR) Cmax: 0.7 ng/mL (0.5–1.0 ng/mL); AUC0–24: 6.4 ng·hr/mL (4.8–9.4), Table S1) and 2-OH AVL (median (IQR) Cmax: 1.1 ng/mL (0.8–1.6 ng/mL); AUC0–24: 14.5 ng·hr/mL (5.5–24.1), Table S1).

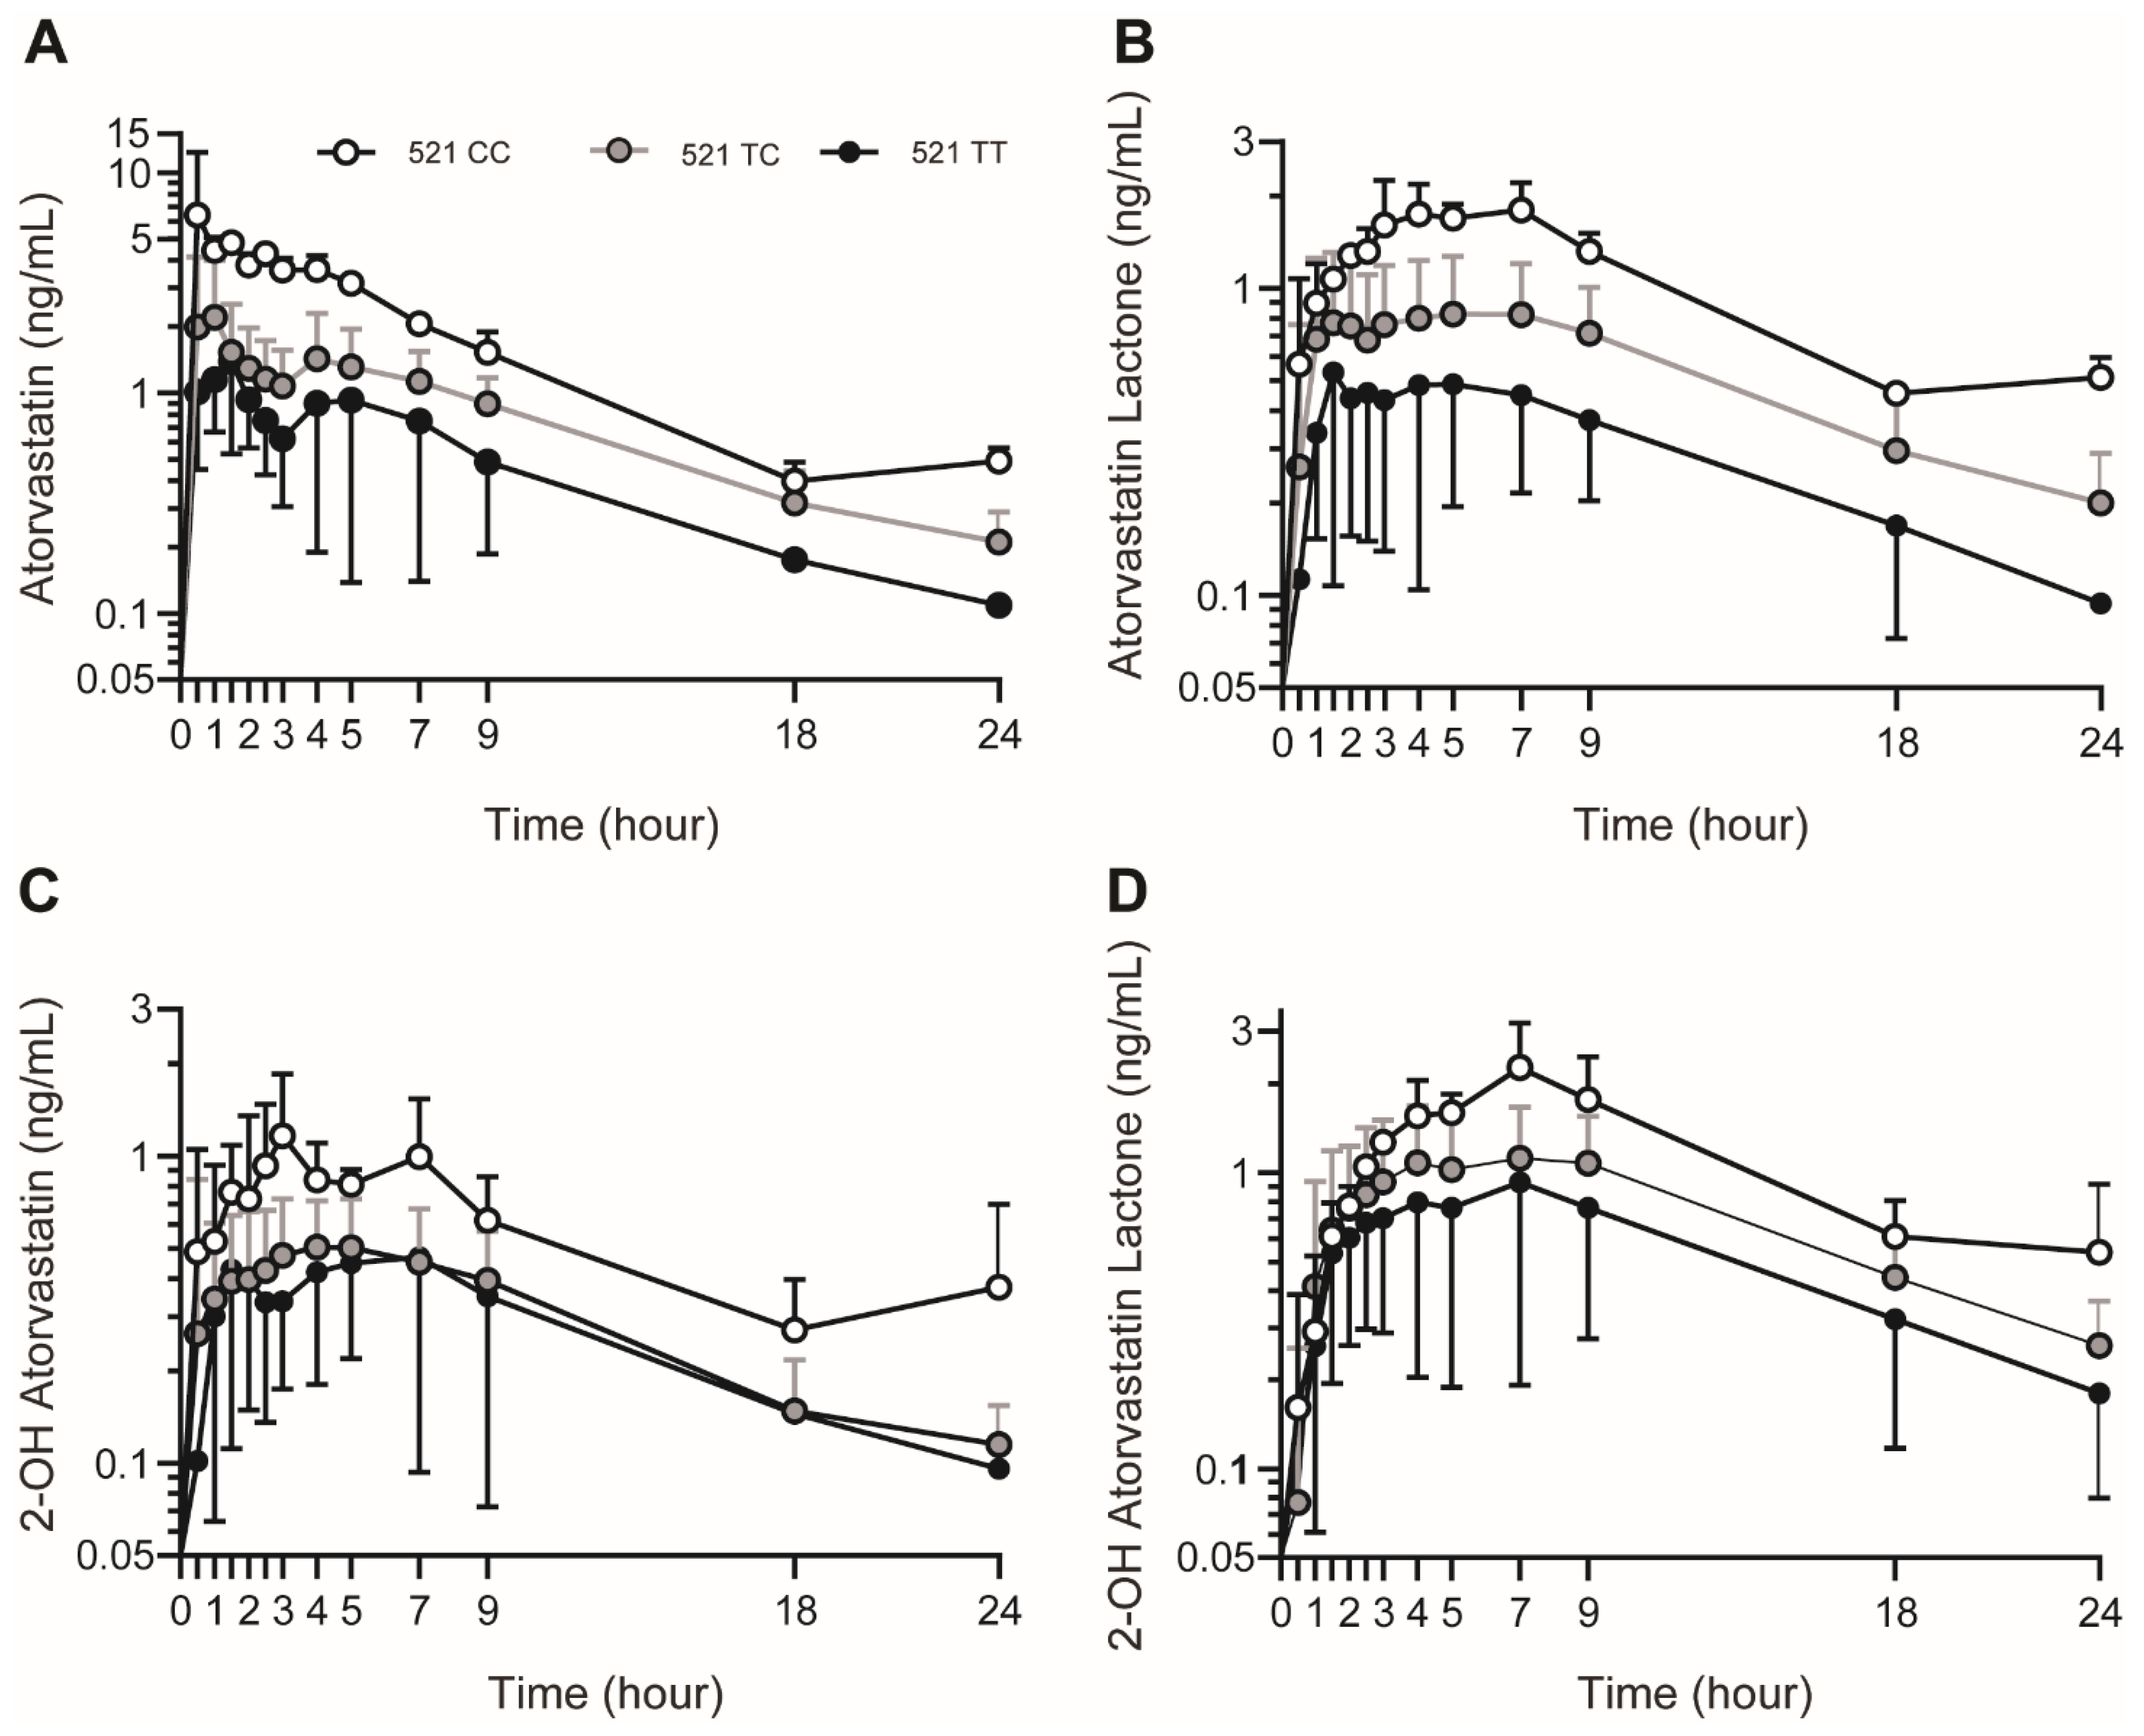
3.3. SLCO1B1 c.521T>C Genotype Influence on Plasma AVA and AVA Metabolite Concentrations

The maximum mean AVA concentrations (Cmax) were 3.6-fold higher in the c.521C/C (n = 2) group and 2.8-fold higher in the c.521T/C (n = 13) group relative to the c.521T/T (n = 13) group (Figure 3A, Table 2). The mean AVA AUC0–24 was 2.8-fold higher in the c.521C/C group and 1.7-fold higher in the c.521T/C group relative to the participants with the reference genotype (Figure 3B, Table 2).
The genotype also had an effect on the AVL Cmax and AUC0–24. The Cmax was 1.6-fold and 2.1-fold higher in the c.521T/C and C/C groups, respectively, relative to the c.521T/T group (Table 2). Those with the c.521T/C genotype had a 1.8-fold higher mean AVL AUC0–24 compared with the participants with the reference genotype (Table 2).
2-OH AVA exposure was similar amongst the genotype groups (p = 0.14; Table 2). Similarly, 2-OH AVL exposure was also not affected by genotype (p = 0.19; Table 2).
The SLCO1B1 c.-11187G>A or c.388A>G genotype demonstrated no correlation to the plasma AVA, AVL, or 2-OH AVA concentrations. There was a difference in the 2-OH AVL Cmax amongst the c.388A>G genotype groups (p = 0.04); however, those in the c.388G/G genotype group had a younger average age, which influenced this association.
Interestingly, variability in the plasma AVA concentrations within the genotype groups was also observed. The largest range of plasma AVA concentrations occurred in the c.521T/T group (4.8-fold) compared to the c.521T/C group (2.3-fold). These data indicate that additional patient-specific factors, in combination with their c.521T>C genotype, influence AVA systemic exposure. AVA exposure was normally distributed within the c.521T/T and c.521T/C groups (Figure S1). However, five c.521T/T participants had a high AVA exposure that fell within the range of that of the c.521T/C group, and one c.521T/C participant had a high AVA exposure that fell within the range of that of the c.521C/C group (Figure 3B). These participants were identified as a “high-exposure subgroup”. Therefore, secondary-hypothesis-generating post hoc analyses were conducted to discover additional variables that could explain the large range of plasma AVA concentrations within the SLCO1B1 c.521 genotype groups.

3.4. Demographic and Anthropometric Influence on Plasma AVA and AVA Metabolite Concentrations

Setting a threshold for multiple testing of p = 0.0011 using the Bonferroni method (p = 0.05/44, or 0.0011), AUC0–24 for AVL and 2-OH AVL, but not AVA and 2-OH AVA, was associated with height, weight and body mass index (Table S2). The exposure metrics for all the analytes were generally comparable across sex, race and ethnicity groups (Table S3).

3.5. Non-SLCO1B1 Drug Transporter Influence on Plasma AVA and AVA Metabolite Concentrations

The gene sequencing of hepatic transporters associated with atorvastatin uptake (SLCO1B1, SLCO1B3) and efflux (ABCB1, ABCG2) was carried out (Table S4) and did not reveal any variants impacting the plasma AVA and AVA metabolite concentrations. Some of the variants on Table S4 could explain the generous plasma AVA concentrations for some of the participants in the high-exposure subgroup, but none were unique to this group.

3.6. Effect of CYP3A and UGT on Plasma AVA and AVA Metabolite Concentrations

Compartmental pharmacokinetic analyses were performed on a cohort of participants (n = 23) with sufficient time points to generate elimination rate half-lives for AVA, 2-OH AVA, AVL and 2-OH AVL, which demonstrate similar terminal slopes, suggesting a formation rate-limited process. Thus, metabolite ratios were justified for further analyses.
To examine altered CYP-mediated metabolism as a possible contributor to the higher plasma AVA concentrations within the high-exposure subgroup, plasma 2-OH AVA, as a percentage of the total analyte (AVA + AVL + 2-OH AVA + 2-OH AVL), was quantitated. A low ratio could suggest that less 2-OH AVA formation occurred, resulting in the higher observed AVA systemic exposure. For the entire cohort, a linear regression model comparing AVA AUC0–24 and 2-OH AVA to the total analyte ratio was applied, and no correlation was observed. In the aforementioned “high-exposure subgroup”, a lower 2-OH AVA-to-total-percentage trend was not observed compared to others in the same genotype group. One c.521T/T high-exposure-subgroup participant had one of the lowest 2-OH AVA-to-total-analyte percentages, which could explain their excessive plasma AVA concentration compared to the others in the same genotype group. Of note, that participant had a genotype associated with normal CYP3A4 activity (e.g., they had CYP3A4*1/*1) and was a nonexpressor of CYP3A5 (e.g., they had CYP3A5*3/*3) (Table S4). Collectively, the CYP3A4/5 genotypes were noninformative relative to characterizing those in the high-exposure subgroup.
To examine if the diminished lactonization in the “high-exposure subgroup” was associated with increased plasma AVA concentrations, plasma AVL, as a percentage of the total analyte (AVA + AVL + 2-OH AVA + 2-OH AVL), was quantitated. For the entire cohort, a linear regression model comparing AVA AUC0–24 and AVL-to-the-total analyte ratio was applied, and no correlation was observed. Four “high-exposure-subgroup” participants (one SLCO1B1 c.521/TC and three c.521T/T) were within the lower half of the AVL-to-the-total percentage normal quantile distribution plot for each c.521T>C genotype group. One of these four participants with a low AVL-to-total-analyte percentage had sequence variants associated with diminished UGT1A3 function (e.g., UGT1A3 *1/*8) (Table S4).
Given the observation of a negative correlation between AVL and BMI, as previously mentioned in Table S2, we evaluated the AVL-to-total-analyte percentage based on the genotype groups. Interestingly, a significant correlation was observed between the AVL-to-total-analyte percentage and BMI amongst both genotype groups (Figure 4). Four of the “high exposure subgroup” were among the highest BMIs for their respective genotype cohorts. Collectively, enhanced adiposity could be a factor correlated with impaired lactonization and subsequently contribute to the variability within the c.521T>C genotype groups.

3.7. Plasma AVA Concentration Multivariate Model

In the multivariate modeling of AVA AUC0–24, the model, including the BMI z-score, sex and the Tanner score, yielded an R-squared value of 0.09. The addition of the SLC01B1 genotype (coded as the number of c.521C alleles) to the model increased the R2 to 0.65, meaning 65% of variability in AVA AUC0–24 could be accounted for by the four explanatory variables (Table 3). According to the model estimates, a difference of one c.521C allele is associated with a difference of 9.0 ng·hr/mL (equivalent to 1.2 SDs) in AVA AUC0–24, adjusting for patient BMI z-score, sex and tanner score, with a 95% CI of 6.0–12.0 (p < 0.001).

4. Discussion

This study examined the influence of the SLCO1B1 c.521T>C variant on the plasma AVA concentration in a pediatric cohort. The magnitude of the effect for the c.521T/C group compared to the reference c.521T/T group in the pediatric cohort was analogous to that reported in adults (i.e., 1.5-fold, as observed by Pasanen et al. [23], vs. 1.7-fold in this study). Additionally, a difference was observed between the c.521T/T reference and c.521C/C groups, which is also consistent with the aforementioned study in adults. We observed a difference in AVA systemic exposure amongst the three c.521T>C genotype groups. This is consistent with our previous analyses involving simvastatin acid, pravastatin and rosuvastatin, where systemic exposure increased by approximately two-fold, on average, with each variant “C” allele present [28,29,31]. In adults, a statistically significant difference amongst each genotype group has only been observed with atorvastatin [23,30,38]. The magnitude of the SLCO1B1 c.521T>C effect on plasma AVA concentrations is comparable to that found for simvastatin acid and more influential than that observed with rosuvastatin and pravastatin in this pediatric cohort [28,29,31].
Consistent with our previous investigations in children, we observed extensive and potentially clinically meaningful variability in the AVA systemic exposures within the c.521T/T (4.8-fold) and c.521T/C (2.3-fold) groups (TT: 4.1–19.7 ng·hr/mL; TC: 13.5–30.9 ng·hr/mL; Figure 3B). This has been described in adults, with coefficients of variation for the AVA AUC ranging from 31 to 57% within these genotype groups [23]. Similar to our experience with pravastatin, simvastatin and rosuvastatin, these data indicate that the SLCO1B1 c.521 genotype, in combination with other patient-specific factors, influences AVA exposure, and these factors need to be accounted for when optimizing atorvastatin treatment in an individual child or adolescent.
OATP1B1, OATP1B3, MDR1(P-gp) and BCRP are proteins known to transport AVA [4,9,10]. Gene sequencing was completed later on in the study to determine if genetic factors unique to the “high-exposure subgroup” existed (Table S4). For the SLCO1B1 phenotype, the next-generation sequencing data were all consistent with the functional status (e.g., c.521T/T: normal, c.521T/C: decreased) [26]. In our previous investigation on the same cohort of children and adolescents taking rosuvastatin [31], three “high-exposure-subgroup” participants (one c.521T/T and two c.521T/C) had nonsynonymous variants of SLCO1B3 (c.767G>C, p.G256A). In this analysis with atorvastatin, only one high exposure subgroup participant (c.521T/C) had a SLCO1B3 c.767G/C genotype. SLCO1B3 c.767G/C has been reported to be associated with a diminished expression of OATP1B3. However, from a functional standpoint, this has not been associated with diminished cellular transport of probe substrates [39]. However, it is appreciated that variants in hepatic uptake transporters can be substrate-specific [40]. The SLCO1B3 c.767G>C genotype’s influence on the rosuvastatin or atorvastatin distribution has not been investigated but should be assessed in future cellular transport analyses.
The ABCB1 (MDR1/P-Gp) and ABCG2 (BCRP) genes encode enterocyte and hepatocyte efflux transporters and are proteins associated with the transcellular movement of AVA into the intestinal lumen or bile canaliculus [41]. Therefore, sequence variation resulting in diminished protein expression can result in enhanced absorption, leading to higher systemic exposure. In fact, Keskitalo et al. have demonstrated that subjects with ABCB1 genotypes had higher plasma statin concentrations relative to the reference genotypes [32]. Four of the high outliers described by Keskitalo et al. had one variant in ABCB1 (c.3435T>C, p.I1145=; c.2677G>T/A, p.S893A/T; or c.1236T>C, p.G412=). However, in our investigation, nobody in the “high-exposure subgroup” had ABCB1 c.3435T/T, c.2677T/T or c.1236T/T associated with a significantly higher AVA exposure. Two ABCG2 variants (c.34G>A and c.421C>A) associated with increased atorvastatin systemic exposure in adults [33] were evaluated in our cohort. Two out of the six participants with ABCG2 c.34G>A SNP were in the “high-exposure subgroup”. Collectively, these variants in genes involved in AVA transport were not unique to the “high-exposure subgroup” and therefore are unlikely to explain the high AVA exposure on their own within the SLCO1B1 c.521 genotype groups or may only have a small effect.
The contribution of interindividual CYP3A variation was evaluated in our study to determine whether the higher AVA systemic exposure could be explained by impaired AVA metabolism. There was one “high-exposure-subgroup” participant with the lowest 2-OH AVA-to-total-analyte percentage within the c.521T/T group, suggesting that a low biotransformation from AVA to 2-OH AVA results in higher AVA systemic exposure. However, no variants were identified in this individual that would explain the altered CYP3A4/5 activity relative to the rest of the individuals within the c.521T/T group. Collectively, the discordant biotransformation of AVA may have contributed to the excessive AVA exposure in that one participant, but it does not explain the higher AVA exposure for the remaining five “high-exposure-subgroup” participants.
The contribution of variable lactonization to excessive AVA systemic exposure was also evaluated. If AVA lactonization was impaired, it could lead to a “high-exposure subgroup” within the c.521 genotype groups. Amongst the six high-exposure-subgroup participants, four had a significantly lower lactone-to-total-analyte percentage. However, only one “high-exposure-subgroup” participant had sequence variants that are known to diminish UGT1A3 activity (Table S4) [36]. Thus, variation in UGT1A may contribute to the discordant results only in one “high-exposure-subgroup” participant, but it does not explain the higher AVA exposure for the remaining four members of the high-exposure subgroup.
Previously, we demonstrated that BMI, in conjunction with genetic variation in SLCO1B1, is linked with excessive plasma pravastatin concentrations [29]. Obesity is associated with the development of nonalcoholic fatty liver disease (NAFLD) in pediatric and adults cohorts [42,43]. NAFLD contributes to variable hepatic uptake transporter expression [44,45,46], leading to altered simvastatin and pravastatin transport [46,47]. We did not observe a correlation between BMI and AVA systemic exposure (Table S2). However, a negative correlation between plasma AVL and 2-OH AVL concentrations and BMI was noted. Perhaps more striking was the observation of a significant negative correlation between the AVL-to-total-analyte percentage and BMI (Figure 4), potentially contributing to the altered AVA exposure in the “high-exposure subgroup”. Diminished lactonization in the obese population has previously not been described. In fact, to the contrary, Xu et al. demonstrated in a murine model that UGT expression was increased in obese mice compared to controls [48]. In human livers, there was no difference with regards to UGT1A3 mRNA expression in liver tissue samples with liver adiposity and fibrosis compared to controls [49]. However, the role of liver adiposity on drug disposition (e.g., drug transport and lactonization) for children and adolescents remains unknown and requires further elucidation.
Another explanation for the variable plasma AVA concentrations lies in the degree of transformation of AVA to AVL in the acidic conditions of the stomach after drug ingestion. Kearney et al. demonstrated that at a pH < 6, an equilibrium between AVA and AVL exists but favors AVA. At a more basic pH > 6, the equilibrium is no longer detected and greatly favors AVA [50]. More recently, atorvastatin physiologically based pharmacokinetic (PBPK) modeling, including in vitro gastric acid–lactone conversion alterations, successfully reproduced observed AVA PKs. Additionally, it was shown that delayed gastric emptying explains the increased conversion of AVA to AVL. The limited data amongst the pediatric obese patient population demonstrate that the gastric emptying time is delayed with increasing abdominal obesity, suggesting that an increased conversion to AVL should have occurred [51]. Further delays in the emptying time in pediatric obese patients with symptomatic gastroesophageal reflux (GERD) events compared to obese children without GERD can occur. In our study cohort, two of the six “high-exposure-subgroup” participants had a history of GERD. Those participants had previously undergone acid suppression therapy (omeprazole, ranitidine), which was held two weeks prior to the study enrollment. In adults, the gastric emptying time is usually shorter in obese patients compared to nonobese controls [52,53,54]. Given the age of the cohort, our obese cohort could be more analogous to adult parameters in terms of gastric emptying time, resulting in diminished lactonization at the level of the stomach. Taken together, the etiology of lower AVL exposure in those participants with higher BMIs requires further study, as we were not adequately powered to elucidate such an effect.

5. Conclusions

Our study establishes that the SLCO1B1 c.521 genotype influences the plasma AVA concentration variation observed in children and adolescents dosed with atorvastatin. However, as we have observed with our previous studies involving pravastatin, simvastatin and rosuvastatin [28,29,31], within each genotype group, there remains a degree of variation that the SLCO1B1 c.521 genotype alone or other variants within this gene can explain. As was observed with rosuvastatin, no additional genetic variants associated with protein aberrations involved in atorvastatin disposition contributed to those in the high-exposure subgroup. The effect of AVA lactonization, especially on the obese child, requires further exploration as it may be an additional variable influencing AVA systemic exposure. Given that atorvastatin lactone is not active, altered lactonization could potentially lead to an altered atorvastatin response (e.g., LDL-C reduction). This could be further altered in the obese population that is prescribed atorvastatin. Similar to rosuvastatin, atorvastatin had a lower variation in plasma AVA concentration for individuals within the genotype groups compared to pravastatin and simvastatin [28,29]. Given the lower variation in plasma AVA concentrations, rosuvastatin and/or atorvastatin may be preferred for children with hypercholesterolemia prescribed a statin. However, determining the impact of atorvastatin or rosuvastatin on the biomarkers of long-term LDL-C decline requires further analysis before one can conclude that they are preferred agents in the treatment of pediatric hypercholesterolemia.

Supplementary Materials

The following supporting information can be downloaded at: https://www.mdpi.com/article/10.3390/genes15010099/s1, Figure S1: The normal distribution plots for AVA AUC0-24 (ng·hr/mL) amongst the c.521T/C and c.521T/T genotypes. Gray circles denote participants with the c.521T/C genotype (n = 12). Black circles denote participants with the c.521T/T genotype (n = 7). Red circles denote “high exposure subgroup” participants (c.521T/T, n = 5; c.521T/C, n = 1).; Table S1: Pharmacokinetic parameters amongst the entire cohort; Table S2: Correlations between demographic parameters and systemic exposure; Table S3: Atorvastatin and atorvastatin analyte parameters stratified by demographic and developmental parameters; Table S4: Drug transporter and metabolism gene sequencing results.

Author Contributions

J.B.W., S.A.-R., A.G., R.G., G.R., V.S.S., N.Z. and J.S.L. wrote the manuscript; J.B.W., S.A.-R., A.G., G.R., V.S.S., G.A.R. and J.S.L. designed the research; J.B.W., R.G., E.C.B. and N.Z. performed the research; J.B.W., S.A.-R., V.S.S., E.C.B. and J.S.L. conducted the data analysis and interpretation. All authors have read and agreed to the published version of the manuscript.

Funding

This study was supported by the Marion Merrell Dow Clinical Scholar Award. The CPR was supported by the Children’s Mercy Hospital Fellow Clinical Scholar Award and the Ward Family Heart Center. The author’s Statin Optimization in Pediatrics program was supported by a CTSA grant from NCATS awarded to the University of Kansas for Frontiers: University of Kansas Clinical and Translational Science Institute (# KL2TR002367). The Clinical Pharmacology Shared Resource (CPSR) is a shared resource for the University of Kansas Cancer Center supported by P30CA168524. The contents are solely the responsibility of the authors and do not necessarily represent the official views of the NIH or NCATS.

Institutional Review Board Statement

Clinical Trials Registration: Identifier NCT02364258, https://clinicaltrials.gov/ct2/show/NCT02364258 (accessed on 8 December 2023). The study was conducted in accordance with the Declaration of Helsinki, and approved by the Institutional Review Board (or Ethics Committee) of Children’s Mercy (protocol code 14040145 and date of approval 7/15/2014) for studies involving humans.

Informed Consent Statement

Informed consent was obtained from all subjects involved in the study.

Data Availability Statement

Data are contained within the article and supplementary materials.

Acknowledgments

We thank our coordinators, Jennifer Panuco and Meghan Freier, for their efforts towards the study completion.

Conflicts of Interest

The authors declare no conflict of interest.

Abbreviations

2-OH-AVA—2-hydroxy atorvastatin; 2-OH-AVL—2-hydroxy atorvastatin lactone; ABC—ATP binding cassette; AUC—area under the curve; AVA—atorvastatin; AVL—atorvastatin lactone; BMI—body mass index; BCRP—Breast cancer resistance protein; Cmax—peak plasma concentration; CPIC—Clinical Pharmacogenetics Consortium; CPR—Cardiology Pharmacogenomics Repository; CYP—cytochrome P450; DNA—deoxyribonucleic acid; HMG-CoA—3-hydroxy-3-methyl-glutaryl coenzyme A; HQC—high quality control; IQR—interquartile range; LDL-C—low-density lipoprotein cholesterol; LLOQ—lower limit of quantification; LQC—lower quality control; MDR1—multidrug resistance protein; MQC—middle quality control; NGS--next-generation sequencing; OATP—organic anion transporting polypeptide; PBPK—physiologically based pharmacokinetic; P-gp—P-glycoprotein; SLC—solute carrier family gene; SNP—single-nucleotide polymorphism; tmax—time to maximal concentration; UGT—UDP-glucuronosyltransferase.

References

  1. LipitorTM (Atorvastatin Calcium) [Package Insert]; Pfizer: New York, NY, USA, 1996; Revised 2020 September.
  2. Shitara, Y.; Sugiyama, Y. Pharmacokinetic and pharmacodynamic alterations of 3-hydroxy-3-methylglutaryl coenzyme A (HMG-CoA) reductase inhibitors: Drug-drug interactions and interindividual differences in transporter and metabolic enzyme functions. Pharmacol. Ther. 2006, 112, 71–105. [Google Scholar] [CrossRef] [PubMed]
  3. Cilla, D.D., Jr.; Whitfield, L.R.; Gibson, D.M.; Sedman, A.J.; Posvar, E.L. Multiple-dose pharmacokinetics, pharmacodynamics, and safety of atorvastatin, an inhibitor of HMG-CoA reductase, in healthy subjects. Clin. Pharmacol. Ther. 1996, 60, 687–695. [Google Scholar] [CrossRef]
  4. Vildhede, A.; Karlgren, M.; Svedberg, E.K.; Wisniewski, J.R.; Lai, Y.; Noren, A.; Artursson, P. Hepatic uptake of atorvastatin: Influence of variability in transporter expression on uptake clearance and drug-drug interactions. Drug Metab. Dispos. 2014, 42, 1210–1218. [Google Scholar] [CrossRef] [PubMed]
  5. Lea, A.P.; McTavish, D. Atorvastatin. A review of its pharmacology and therapeutic potential in the management of hyperlipidaemias. Drugs 1997, 53, 828–847. [Google Scholar] [CrossRef]
  6. Lennernas, H. Clinical pharmacokinetics of atorvastatin. Clin. Pharmacokinet. 2003, 42, 1141–1160. [Google Scholar] [CrossRef] [PubMed]
  7. Jacobsen, W.; Kuhn, B.; Soldner, A.; Kirchner, G.; Sewing, K.F.; Kollman, P.A.; Benet, L.Z.; Christians, U. Lactonization is the critical first step in the disposition of the 3-hydroxy-3-methylglutaryl-CoA reductase inhibitor atorvastatin. Drug Metab. Dispos. 2000, 28, 1369–1378. [Google Scholar] [PubMed]
  8. Goosen, T.C.; Bauman, J.N.; Davis, J.A.; Yu, C.; Hurst, S.I.; Williams, J.A.; Loi, C.M. Atorvastatin glucuronidation is minimally and nonselectively inhibited by the fibrates gemfibrozil, fenofibrate, and fenofibric acid. Drug Metab. Dispos. 2007, 35, 1315–1324. [Google Scholar] [CrossRef]
  9. Wu, X.; Whitfield, L.R.; Stewart, B.H. Atorvastatin transport in the Caco-2 cell model: Contributions of P-glycoprotein and the proton-monocarboxylic acid co-transporter. Pharm. Res. 2000, 17, 209–215. [Google Scholar] [CrossRef]
  10. Hirano, M.; Maeda, K.; Matsushima, S.; Nozaki, Y.; Kusuhara, H.; Sugiyama, Y. Involvement of BCRP (ABCG2) in the biliary excretion of pitavastatin. Mol. Pharmacol. 2005, 68, 800–807. [Google Scholar] [CrossRef]
  11. Botti, R.E.; Triscari, J.; Pan, H.Y.; Zayat, J. Concentrations of pravastatin and lovastatin in cerebrospinal fluid in healthy subjects. Clin. Neuropharmacol. 1991, 14, 256–261. [Google Scholar] [CrossRef]
  12. Johnson-Anuna, L.N.; Eckert, G.P.; Keller, J.H.; Igbavboa, U.; Franke, C.; Fechner, T.; Schubert-Zsilavecz, M.; Karas, M.; Muller, W.E.; Wood, W.G. Chronic administration of statins alters multiple gene expression patterns in mouse cerebral cortex. J. Pharmacol. Exp. Ther. 2005, 312, 786–793. [Google Scholar] [CrossRef] [PubMed]
  13. Pierno, S.; De Luca, A.; Tricarico, D.; Roselli, A.; Natuzzi, F.; Ferrannini, E.; Laico, M.; Camerino, D.C. Potential risk of myopathy by HMG-CoA reductase inhibitors: A comparison of pravastatin and simvastatin effects on membrane electrical properties of rat skeletal muscle fibers. J. Pharmacol. Exp. Ther. 1995, 275, 1490–1496. [Google Scholar]
  14. Bruckert, E.; Hayem, G.; Dejager, S.; Yau, C.; Begaud, B. Mild to moderate muscular symptoms with high-dosage statin therapy in hyperlipidemic patients—The PRIMO study. Cardiovasc. Drugs Ther. 2005, 19, 403–414. [Google Scholar] [CrossRef] [PubMed]
  15. Masters, B.A.; Palmoski, M.J.; Flint, O.P.; Gregg, R.E.; Wang-Iverson, D.; Durham, S.K. In vitro myotoxicity of the 3-hydroxy-3-methylglutaryl coenzyme A reductase inhibitors, pravastatin, lovastatin, and simvastatin, using neonatal rat skeletal myocytes. Toxicol. Appl. Pharmacol. 1995, 131, 163–174. [Google Scholar] [CrossRef] [PubMed]
  16. Nakahara, K.; Kuriyama, M.; Sonoda, Y.; Yoshidome, H.; Nakagawa, H.; Fujiyama, J.; Higuchi, I.; Osame, M. Myopathy induced by HMG-CoA reductase inhibitors in rabbits: A pathological, electrophysiological, and biochemical study. Toxicol. Appl. Pharmacol. 1998, 152, 99–106. [Google Scholar] [CrossRef]
  17. Gadbut, A.P.; Caruso, A.P.; Galper, J.B. Differential sensitivity of C2-C12 striated muscle cells to lovastatin and pravastatin. J. Mol. Cell. Cardiol. 1995, 27, 2397–2402. [Google Scholar] [CrossRef]
  18. McCrindle, B.W.; Ose, L.; Marais, A.D. Efficacy and safety of atorvastatin in children and adolescents with familial hypercholesterolemia or severe hyperlipidemia: A multicenter, randomized, placebo-controlled trial. J. Pediatr. 2003, 143, 74–80. [Google Scholar] [CrossRef]
  19. Gandelman, K.; Glue, P.; Laskey, R.; Jones, J.; LaBadie, R.; Ose, L. An eight-week trial investigating the efficacy and tolerability of atorvastatin for children and adolescents with heterozygous familial hypercholesterolemia. Pediatr. Cardiol. 2011, 32, 433–441. [Google Scholar] [CrossRef]
  20. Argent, E.; Kainer, G.; Aitken, M.; Rosenberg, A.R.; Mackie, F.E. Atorvastatin treatment for hyperlipidemia in pediatric renal transplant recipients. Pediatr. Transplant. 2003, 7, 38–42. [Google Scholar] [CrossRef]
  21. Kameyama, Y.; Yamashita, K.; Kobayashi, K.; Hosokawa, M.; Chiba, K. Functional characterization of SLCO1B1 (OATP-C) variants, SLCO1B1*5, SLCO1B1*15 and SLCO1B1*15+C1007G, by using transient expression systems of HeLa and HEK293 cells. Pharmacogenet. Genom. 2005, 15, 513–522. [Google Scholar] [CrossRef]
  22. Hsiang, B.; Zhu, Y.; Wang, Z.; Wu, Y.; Sasseville, V.; Yang, W.P.; Kirchgessner, T.G. A novel human hepatic organic anion transporting polypeptide (OATP2). Identification of a liver-specific human organic anion transporting polypeptide and identification of rat and human hydroxymethylglutaryl-CoA reductase inhibitor transporters. J. Biol. Chem. 1999, 274, 37161–37168. [Google Scholar] [CrossRef]
  23. Pasanen, M.K.; Fredrikson, H.; Neuvonen, P.J.; Niemi, M. Different effects of SLCO1B1 polymorphism on the pharmacokinetics of atorvastatin and rosuvastatin. Clin. Pharmacol. Ther. 2007, 82, 726–733. [Google Scholar] [CrossRef] [PubMed]
  24. Lee, Y.J.; Lee, M.G.; Lim, L.A.; Jang, S.B.; Chung, J.Y. Effects of SLCO1B1 and ABCB1 genotypes on the pharmacokinetics of atorvastatin and 2-hydroxyatorvastatin in healthy Korean subjects. Int. J. Clin. Pharmacol. Ther. 2010, 48, 36–45. [Google Scholar] [CrossRef] [PubMed]
  25. Birmingham, B.K.; Bujac, S.R.; Elsby, R.; Azumaya, C.T.; Wei, C.; Chen, Y.; Mosqueda-Garcia, R.; Ambrose, H.J. Impact of ABCG2 and SLCO1B1 polymorphisms on pharmacokinetics of rosuvastatin, atorvastatin and simvastatin acid in Caucasian and Asian subjects: A class effect? Eur. J. Clin. Pharmacol. 2015, 71, 341–355. [Google Scholar] [CrossRef] [PubMed]
  26. Ramsey, L.B.; Gong, L.; Lee, S.B.; Wagner, J.B.; Zhou, X.; Sangkuhl, K.; Adams, S.M.; Straka, R.J.; Empey, P.E.; Boone, E.C.; et al. PharmVar GeneFocus: SLCO1B1. Clin. Pharmacol. Ther. 2023, 113, 782–793. [Google Scholar] [CrossRef] [PubMed]
  27. Gaedigk, A.; Casey, S.T.; Whirl-Carrillo, M.; Miller, N.A.; Klein, T.E. Pharmacogene Variation Consortium: A Global Resource and Repository for Pharmacogene Variation. Clin. Pharmacol. Ther. 2021, 110, 542–545. [Google Scholar] [CrossRef] [PubMed]
  28. Wagner, J.B.; Abdel-Rahman, S.; Van Haandel, L.; Gaedigk, A.; Gaedigk, R.; Raghuveer, G.; Kauffman, R.; Leeder, J.S. Impact of SLCO1B1 Genotype on Pediatric Simvastatin Acid Pharmacokinetics. J. Clin. Pharmacol. 2018, 58, 823–833. [Google Scholar] [CrossRef]
  29. Wagner, J.B.; Abdel-Rahman, S.; Gaedigk, R.; Gaedigk, A.; Raghuveer, G.; Staggs, V.S.; Kauffman, R.; Van Haandel, L.; Leeder, J.S. Impact of Genetic Variation on Pravastatin Systemic Exposure in Pediatric Hypercholesterolemia. Clin. Pharmacol. Ther. 2019, 105, 1501–1512. [Google Scholar] [CrossRef]
  30. Niemi, M.; Schaeffeler, E.; Lang, T.; Fromm, M.F.; Neuvonen, M.; Kyrklund, C.; Backman, J.T.; Kerb, R.; Schwab, M.; Neuvonen, P.J.; et al. High plasma pravastatin concentrations are associated with single nucleotide polymorphisms and haplotypes of organic anion transporting polypeptide-C (OATP-C, SLCO1B1). Pharmacogenetics 2004, 14, 429–440. [Google Scholar] [CrossRef]
  31. Wagner, J.B.; Abdel-Rahman, S.; Gaedigk, A.; Gaedigk, R.; Raghuveer, G.; Staggs, V.S.; Van Haandel, L.; Steven Leeder, J. Impact of SLCO1B1 genetic variation on rosuvastatin systemic exposure in pediatric hypercholesterolemia. Clin. Transl. Sci. 2020, 13, 628–637. [Google Scholar] [CrossRef]
  32. Keskitalo, J.E.; Kurkinen, K.J.; Neuvoneni, P.J.; Niemi, M. ABCB1 haplotypes differentially affect the pharmacokinetics of the acid and lactone forms of simvastatin and atorvastatin. Clin. Pharmacol. Ther. 2008, 84, 457–461. [Google Scholar] [CrossRef]
  33. Keskitalo, J.E.; Zolk, O.; Fromm, M.F.; Kurkinen, K.J.; Neuvonen, P.J.; Niemi, M. ABCG2 polymorphism markedly affects the pharmacokinetics of atorvastatin and rosuvastatin. Clin. Pharmacol. Ther. 2009, 86, 197–203. [Google Scholar] [CrossRef]
  34. Kivisto, K.T.; Niemi, M.; Schaeffeler, E.; Pitkala, K.; Tilvis, R.; Fromm, M.F.; Schwab, M.; Eichelbaum, M.; Strandberg, T. Lipid-lowering response to statins is affected by CYP3A5 polymorphism. Pharmacogenetics 2004, 14, 523–525. [Google Scholar] [CrossRef] [PubMed]
  35. Wang, D.; Guo, Y.; Wrighton, S.A.; Cooke, G.E.; Sadee, W. Intronic polymorphism in CYP3A4 affects hepatic expression and response to statin drugs. Pharmacogenom. J. 2011, 11, 274–286. [Google Scholar] [CrossRef] [PubMed]
  36. Riedmaier, S.; Klein, K.; Hofmann, U.; Keskitalo, J.E.; Neuvonen, P.J.; Schwab, M.; Niemi, M.; Zanger, U.M. UDP-glucuronosyltransferase (UGT) polymorphisms affect atorvastatin lactonization in vitro and in vivo. Clin. Pharmacol. Ther. 2010, 87, 65–73. [Google Scholar] [CrossRef]
  37. Twist, G.P.; Gaedigk, A.; Miller, N.A.; Farrow, E.G.; Willig, L.K.; Dinwiddie, D.L.; Petrikin, J.E.; Soden, S.E.; Herd, S.; Gibson, M.; et al. Constellation: A tool for rapid, automated phenotype assignment of a highly polymorphic pharmacogene, CYP2D6, from whole-genome sequences. NPJ Genom. Med. 2016, 1, 15007. [Google Scholar] [CrossRef] [PubMed]
  38. Pasanen, M.K.; Neuvonen, M.; Neuvonen, P.J.; Niemi, M. SLCO1B1 polymorphism markedly affects the pharmacokinetics of simvastatin acid. Pharmacogenet. Genom. 2006, 16, 873–879. [Google Scholar] [CrossRef]
  39. Schwarz, U.I.; Meyer zu Schwabedissen, H.E.; Tirona, R.G.; Suzuki, A.; Leake, B.F.; Mokrab, Y.; Mizuguchi, K.; Ho, R.H.; Kim, R.B. Identification of novel functional organic anion-transporting polypeptide 1B3 polymorphisms and assessment of substrate specificity. Pharmacogenet. Genom. 2011, 21, 103–114. [Google Scholar] [CrossRef]
  40. Niemi, M. Transporter pharmacogenetics and statin toxicity. Clin. Pharmacol. Ther. 2010, 87, 130–133. [Google Scholar] [CrossRef]
  41. Leslie, E.M.; Deeley, R.G.; Cole, S.P. Multidrug resistance proteins: Role of P-glycoprotein, MRP1, MRP2, and BCRP (ABCG2) in tissue defense. Toxicol. Appl. Pharmacol. 2005, 204, 216–237. [Google Scholar] [CrossRef]
  42. Anderson, E.L.; Howe, L.D.; Jones, H.E.; Higgins, J.P.; Lawlor, D.A.; Fraser, A. The Prevalence of Non-Alcoholic Fatty Liver Disease in Children and Adolescents: A Systematic Review and Meta-Analysis. PLoS ONE 2015, 10, e0140908. [Google Scholar] [CrossRef] [PubMed]
  43. Angulo, P. Nonalcoholic fatty liver disease. N. Engl. J. Med. 2002, 346, 1221–1231. [Google Scholar] [CrossRef] [PubMed]
  44. Fisher, C.D.; Lickteig, A.J.; Augustine, L.M.; Oude Elferink, R.P.; Besselsen, D.G.; Erickson, R.P.; Cherrington, N.J. Experimental non-alcoholic fatty liver disease results in decreased hepatic uptake transporter expression and function in rats. Eur. J. Pharmacol. 2009, 613, 119–127. [Google Scholar] [CrossRef] [PubMed]
  45. Lake, A.D.; Novak, P.; Fisher, C.D.; Jackson, J.P.; Hardwick, R.N.; Billheimer, D.D.; Klimecki, W.T.; Cherrington, N.J. Analysis of global and absorption, distribution, metabolism, and elimination gene expression in the progressive stages of human nonalcoholic fatty liver disease. Drug Metab. Dispos. 2011, 39, 1954–1960. [Google Scholar] [CrossRef] [PubMed]
  46. Clarke, J.D.; Hardwick, R.N.; Lake, A.D.; Canet, M.J.; Cherrington, N.J. Experimental nonalcoholic steatohepatitis increases exposure to simvastatin hydroxy acid by decreasing hepatic organic anion transporting polypeptide expression. J. Pharmacol. Exp. Ther. 2014, 348, 452–458. [Google Scholar] [CrossRef]
  47. Clarke, J.D.; Hardwick, R.N.; Lake, A.D.; Lickteig, A.J.; Goedken, M.J.; Klaassen, C.D.; Cherrington, N.J. Synergistic interaction between genetics and disease on pravastatin disposition. J. Hepatol. 2014, 61, 139–147. [Google Scholar] [CrossRef] [PubMed]
  48. Xu, J.; Kulkarni, S.R.; Li, L.; Slitt, A.L. UDP-glucuronosyltransferase expression in mouse liver is increased in obesity- and fasting-induced steatosis. Drug Metab. Dispos. 2012, 40, 259–266. [Google Scholar] [CrossRef]
  49. Hardwick, R.N.; Ferreira, D.W.; More, V.R.; Lake, A.D.; Lu, Z.; Manautou, J.E.; Slitt, A.L.; Cherrington, N.J. Altered UDP-glucuronosyltransferase and sulfotransferase expression and function during progressive stages of human nonalcoholic fatty liver disease. Drug Metab. Dispos. 2013, 41, 554–561. [Google Scholar] [CrossRef]
  50. Kearney, A.S.; Crawford, L.F.; Mehta, S.C.; Radebaugh, G.W. The interconversion kinetics, equilibrium, and solubilities of the lactone and hydroxyacid forms of the HMG-CoA reductase inhibitor, CI-981. Pharm. Res. 1993, 10, 1461–1465. [Google Scholar] [CrossRef]
  51. Quitadamo, P.; Zenzeri, L.; Mozzillo, E.; Cuccurullo, I.; Rocco, A.; Franzese, A.; Nardone, G.; Staiano, A. Gastric Emptying Time, Esophageal pH-Impedance Parameters, Quality of Life, and Gastrointestinal Comorbidity in Obese Children and Adolescents. J. Pediatr. 2018, 194, 94–99. [Google Scholar] [CrossRef]
  52. Buchholz, V.; Berkenstadt, H.; Goitein, D.; Dickman, R.; Bernstine, H.; Rubin, M. Gastric emptying is not prolonged in obese patients. Surg. Obes. Relat. Dis. 2013, 9, 714–717. [Google Scholar] [CrossRef] [PubMed]
  53. Wright, R.A.; Krinsky, S.; Fleeman, C.; Trujillo, J.; Teague, E. Gastric emptying and obesity. Gastroenterology 1983, 84, 747–751. [Google Scholar] [CrossRef] [PubMed]
  54. Glasbrenner, B.; Pieramico, O.; Brecht-Krauss, D.; Baur, M.; Malfertheiner, P. Gastric emptying of solids and liquids in obesity. Clin. Investig. 1993, 71, 542–546. [Google Scholar] [CrossRef] [PubMed]
Figure 1. Atorvastatin pathway. Atorvastatin and atorvastatin lactone undergo CYP3A4-mediated biotransformation to form their respective 2-hydroxy metabolites.
Genes 15 00099 g001
Figure 2. (A) Mean ± SD plasma analyte concentrations (ng/mL) of atorvastatin, (B) atorvastatin lactone, (C) 2-hydroxyatorvastatin, and (D) 2-hydroxyatorvastatin lactone. Black, gray and open white circles denote participants with the c.521T/T (n = 13), c.521T/C (n = 13) and c.521C/C (n = 2) genotypes, respectively.
Genes 15 00099 g002
Figure 3. (A) Relationship of atorvastatin Cmax (ng/mL) and (B) AUC0–24 (ng·hr/mL) normalized for doses amongst the SLCO1B1 c.521 genotype groups. Black, gray and open white circles denote participants with the c.521T/T (n = 13), c.521T/C (n = 13) and c.521C/C (n = 2) genotypes, respectively. Red circles denote “high-exposure subgroup” participants (c.521T/T, n = 5; c.521T/C, n = 1).
Genes 15 00099 g003
Figure 4. Correlation between AVL + 2-OH AVL-to-total-analyte ratio and BMI in the (A) c.521T/T and (B) SLCO1B1 c.521T/C genotype groups. Black and gray circles denote participants with the c.521T/T (n = 13) and c.521T/C (n = 13) genotypes, respectively. Red circles denote “high-exposure-subgroup” participants (c.521T/T, n = 5; c.521T/C, n = 1).
Genes 15 00099 g004
Table 1. Participants stratified by SLCO1B1 c.521T>C genotype.
SLCO1B1
c.521T/T
(n = 13)
SLCO1B1
c.521T/C
(n = 13)
SLCO1B1
c.521C/C
(n = 2)
Age (years)15.1 (±3.0)14.9 (±2.9)14.3 (±4.3)
Weight (kg)85.7 (±34.5)87.0 (±26.0)62.2 (±1.6)
Height (cm)164.1 (±8.5)165.3 (±11.8)157.6 (±19.8)
BMI (kg/m2)31.6 (±12.0)31.2 (±6.9)25.6 (±5.7)
Gender
  Female661
  Male771
Ethnicity
  White, nonHispanic771
  White, Hispanic551
  African-American110
Tanner
Breast/Testicular
  Stage 1000
  Stage 2221
  Stage 3010
  Stage 4400
  Stage 57101
Pubic
  Stage 1100
  Stage 2031
  Stage 3100
  Stage 4300
  Stage 58101
Dose (mg/kg)0.14 (±0.06)0.13 (±0.04)0.16 (±0.00)
All data expressed as mean (±SD).
Table 2. Atorvastatin and atorvastatin analyte parameters stratified by SLCO1B1 c.521T>C genotype.
SLCO1B1
c.521T/T
(n = 13)
SLCO1B1
c.521T/C
(n = 13)
SLCO1B1
c.521C/C
(n = 2)
p
Atorvastatin
  Cmax (ng/mL)1.8 (±0.7)3.0 (±1.5)6.4 (±3.3)0.01
  tmax (h)1.0 (0.5–5.0)1.0 (0.5–7.0)1.0 (0.5–1.5)N/A
  AUC0–24 (ng·hr/mL)11.3 (±5.1)19.1 (±4.5)32.0 (±5.2)0.001
AtorvastatinLactone
  Cmax (ng/mL)0.7 (±0.4) 1.1 (±0.3)1.5 (±0.4)0.007
  tmax (h)2.5 (1.0–9.2)4.0 (1.0–9.0)6.0 (5.0–7.0)N/A
  AUC0–24 (ng·hr/mL)7.2 (±4.8) 13.0 (±10.1) 27.8 (±2.3) 0.03
2-Hydroxy Atorvastatin
  Cmax (ng/mL)0.7 (±0.2)0.8 (±0.3)1.3 (±0.1)0.09
  tmax (h)2.0 (1.0–7.0)3.0 (0.5–7.0)5.0 (3.0–7.0)N/A
  AUC0–24 (ng·hr/mL)6.2 (±2.8)7.5 (±3.2)10.8 (±2.2)0.14
2-Hydroxy Atorvastatin Lactone
  Cmax (ng/mL)1.0 (±0.5)1.3 (±0.4)1.9 (±0.8)0.11
  tmax (h)7.0 (1.5–9.2)5.0 (2.0–7.0)7.0 (7.0–7.0)N/A
  AUC0–24 (ng·hr/mL)14.0 (±11.9)17.4 (±12.7)31.0 (±9.4)0.19
Data expressed as mean (±SD); tmax expressed as median (range). Kruskal–Wallis test used for all analyses.
Table 3. Results of multivariate model for AVA AUC0–24.
Explanatory Variableβ (95% CI)p
BMI z-score1.4 (−0.4, 3.1)0.114
Male sex1.7 (−2.2, 5.6)0.378
Tanner score0.5 (−1.1, 2.2)0.524
SLCO1B1 c.521 number of “C” alleles9.0 (6.0, 12.0)<0.001
Disclaimer/Publisher’s Note: The statements, opinions and data contained in all publications are solely those of the individual author(s) and contributor(s) and not of MDPI and/or the editor(s). MDPI and/or the editor(s) disclaim responsibility for any injury to people or property resulting from any ideas, methods, instructions or products referred to in the content.

