
Optical Genome Mapping: Integrating Structural Variations for Precise Homologous Recombination Deficiency Score Calculation
 , , , and
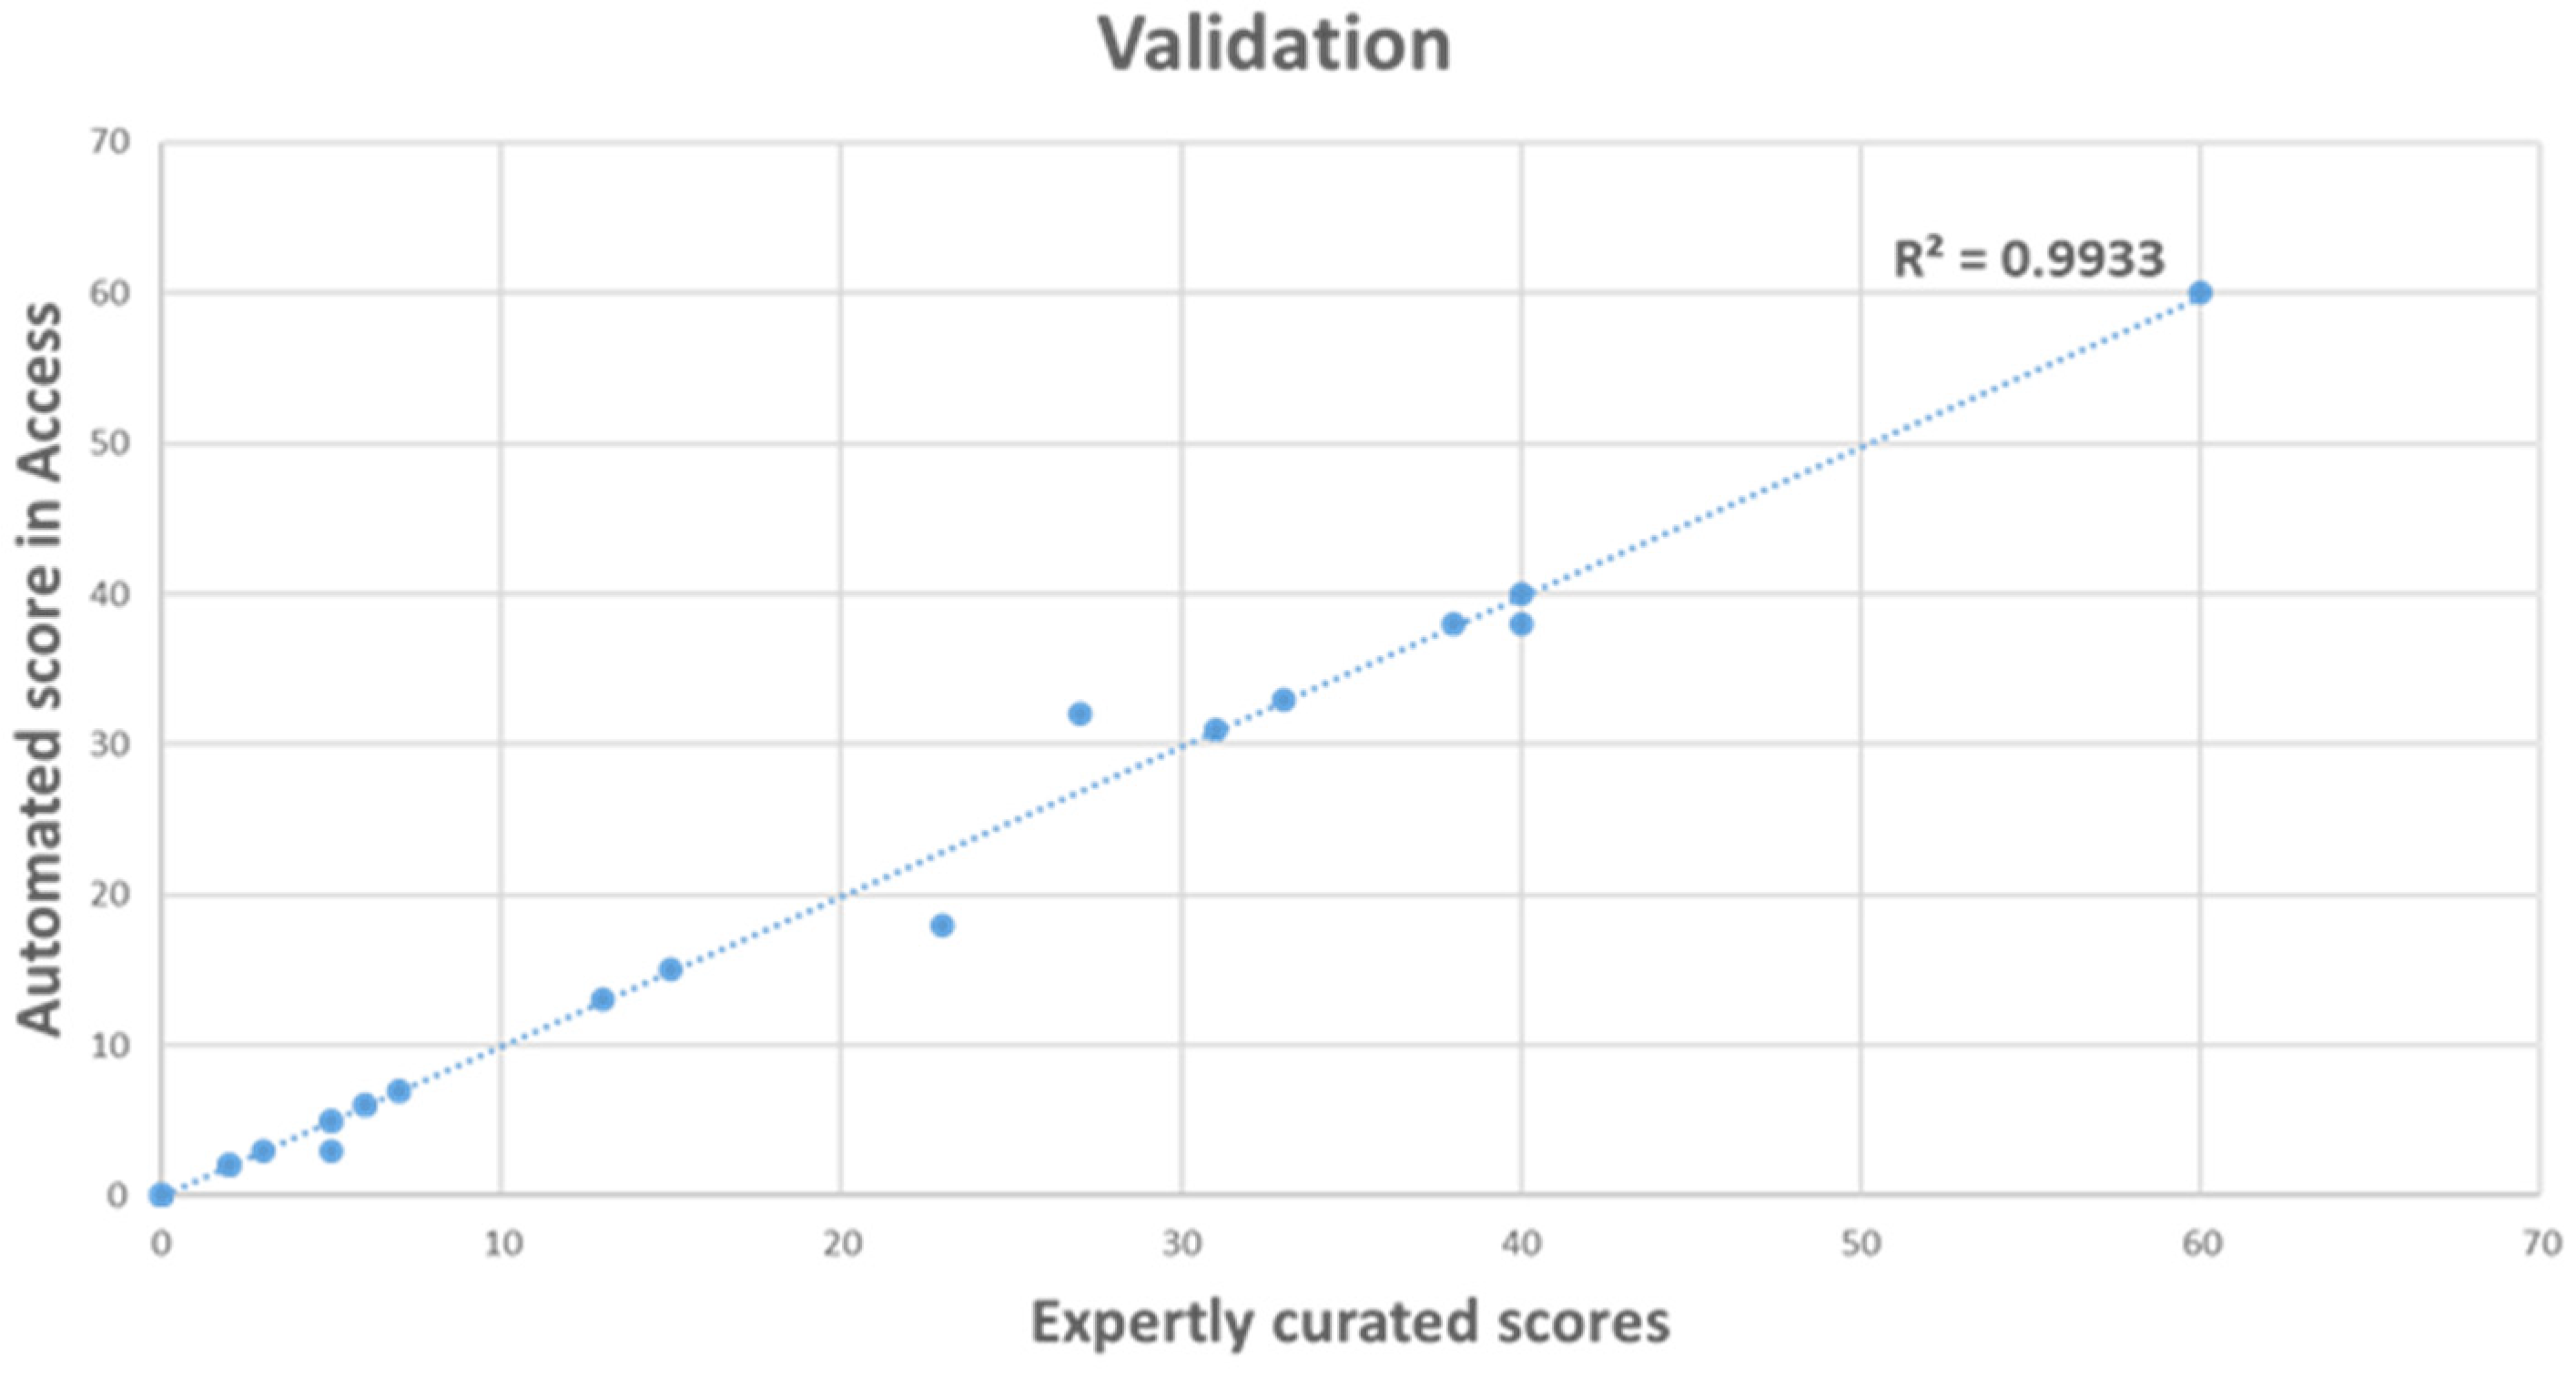
Abstract
:1. Introduction
2. Materials and Methods
2.1. Sample Selection
2.2. Optical Genome Mapping
2.3. Structural Variation Analysis Using OGM
2.4. HRD Scoring Using Automated SV Scripts (OGM Data)
2.5. Chromosomal Microarray
2.6. 523-Gene Next-Generation Sequencing (NGS) Panel
2.7. NGS Variant Calling and Data Analysis
2.8. Homologous Recombination Deficiency (HRD) Scoring
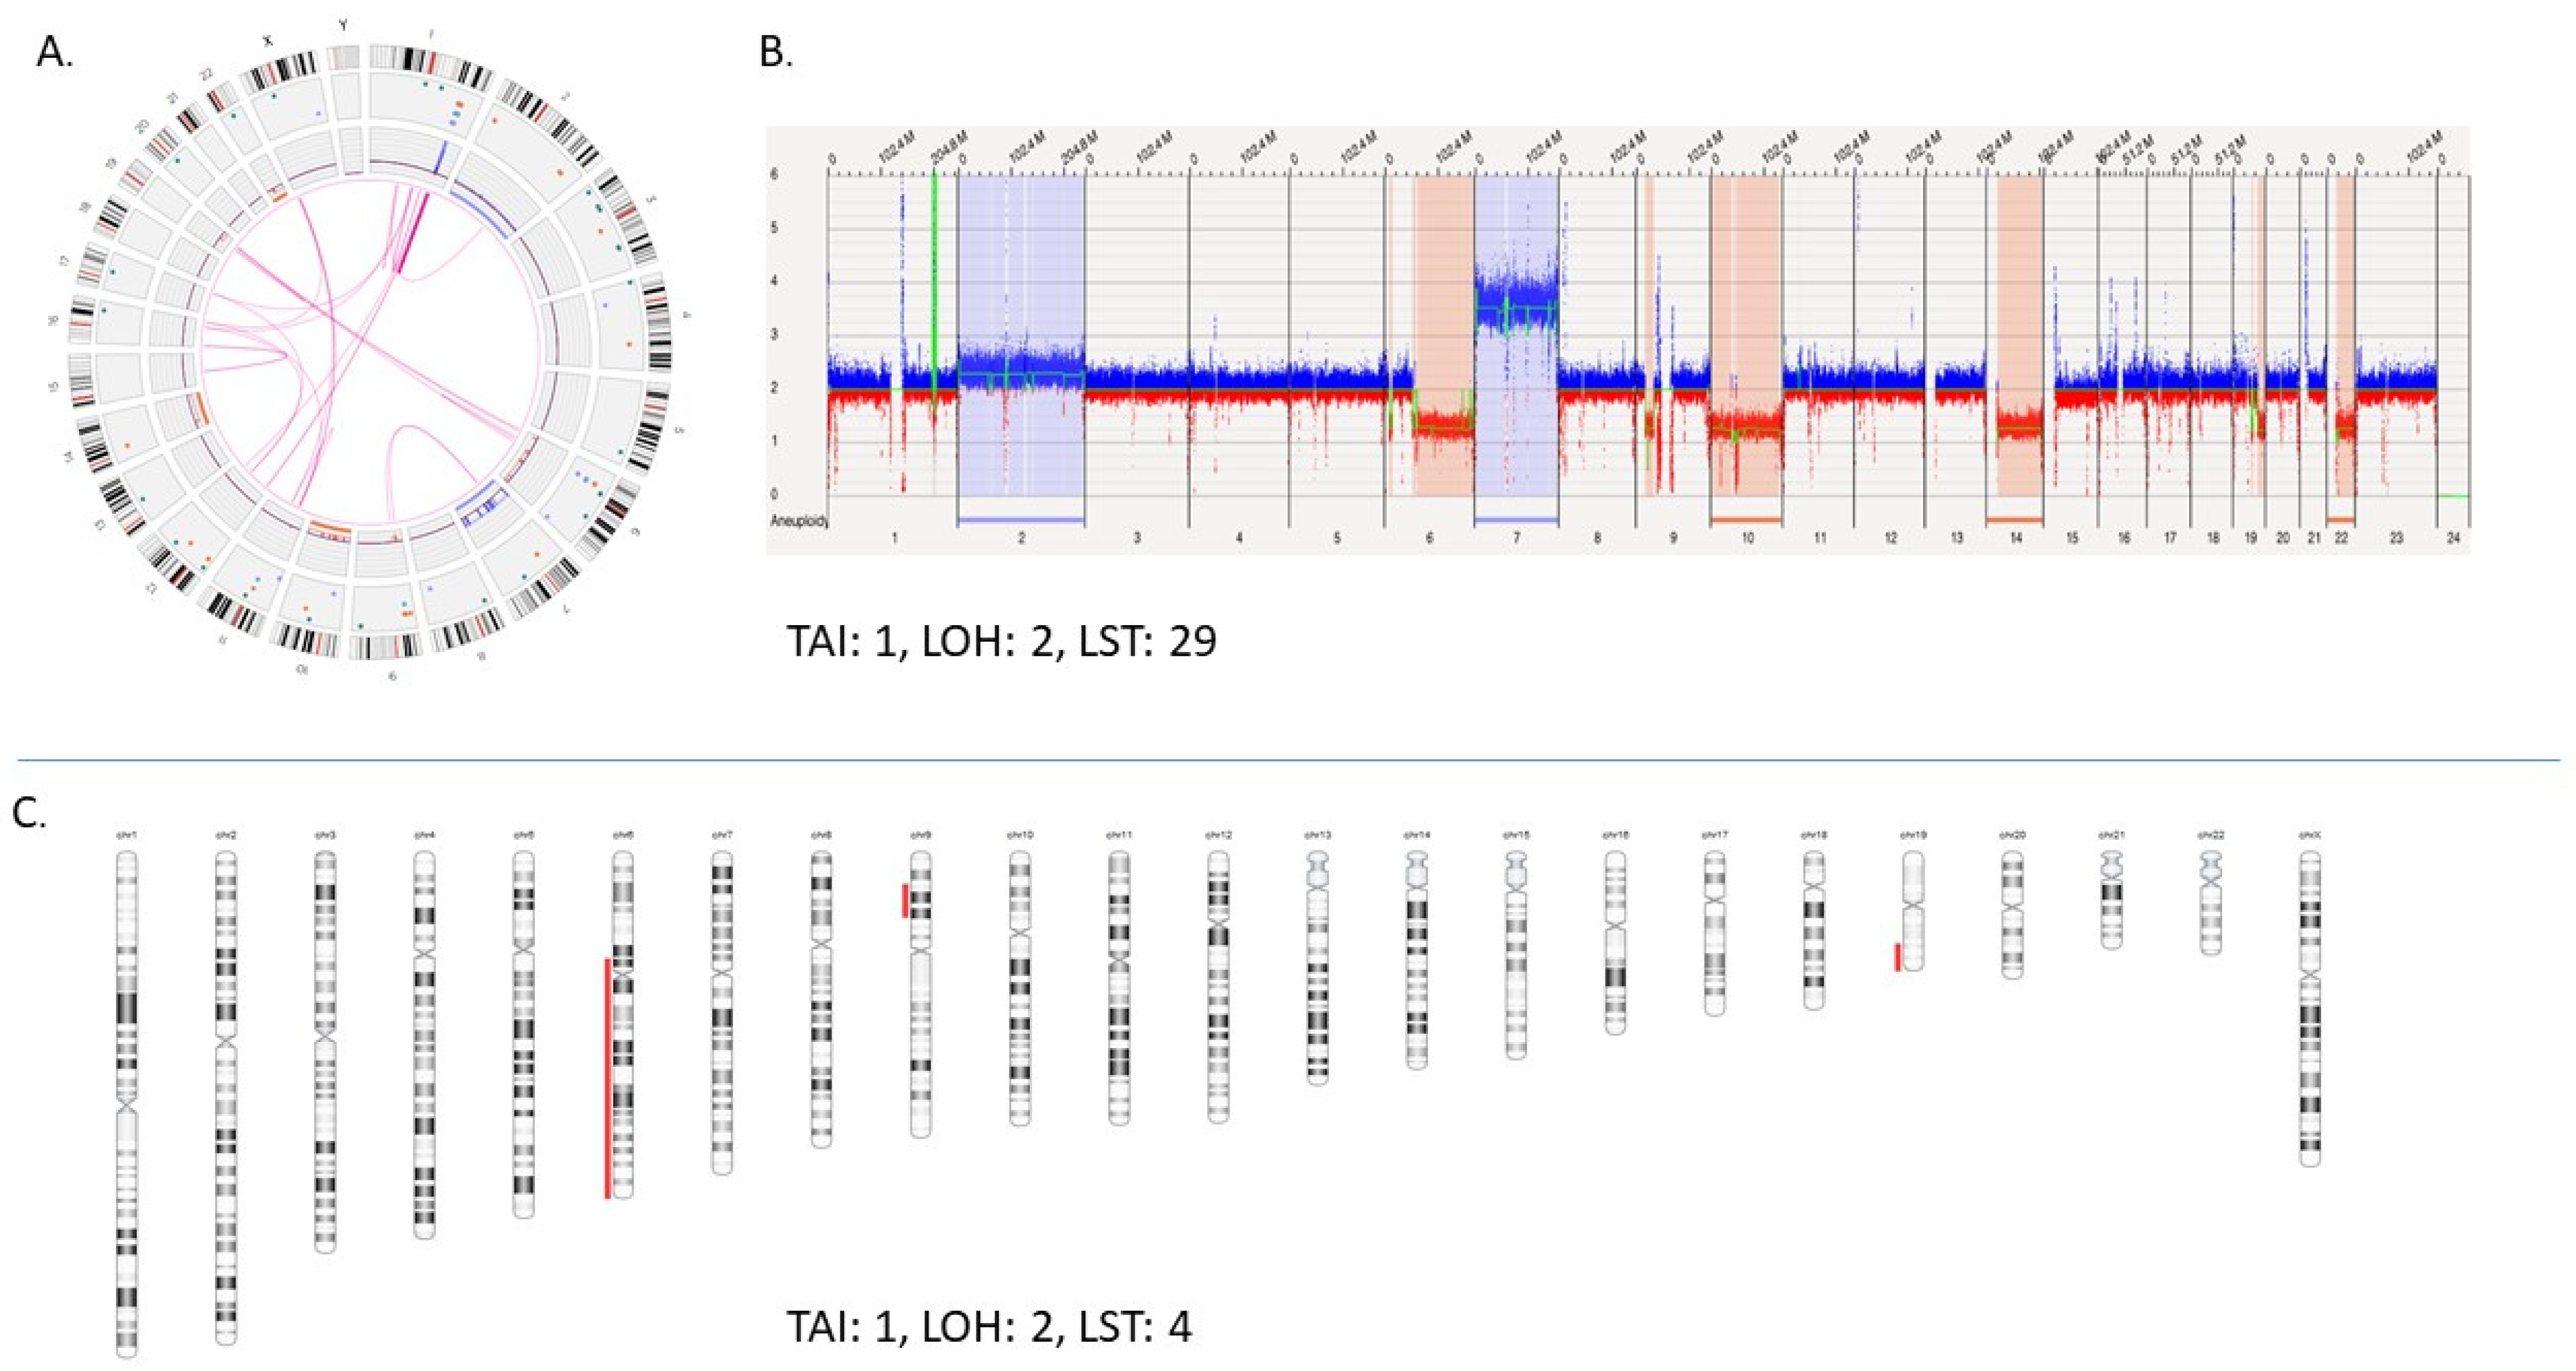
- HRD-LOH: number of regions’ with losses and absence of heterozygosity (AOH) > 15 MB (not whole chromosome);
- TAI: number of regions’ with gains, losses, and AOH > 3 MB from telomere (not involving the centromere);
- TAI-LOH: Meets the definition of both HRD-LOH and TAI;
- LST: number of breakpoints between gains, losses, and AOH segments > 10 MB, exclusive of intervals < 3 MB (not accounting for centromeric breaks).
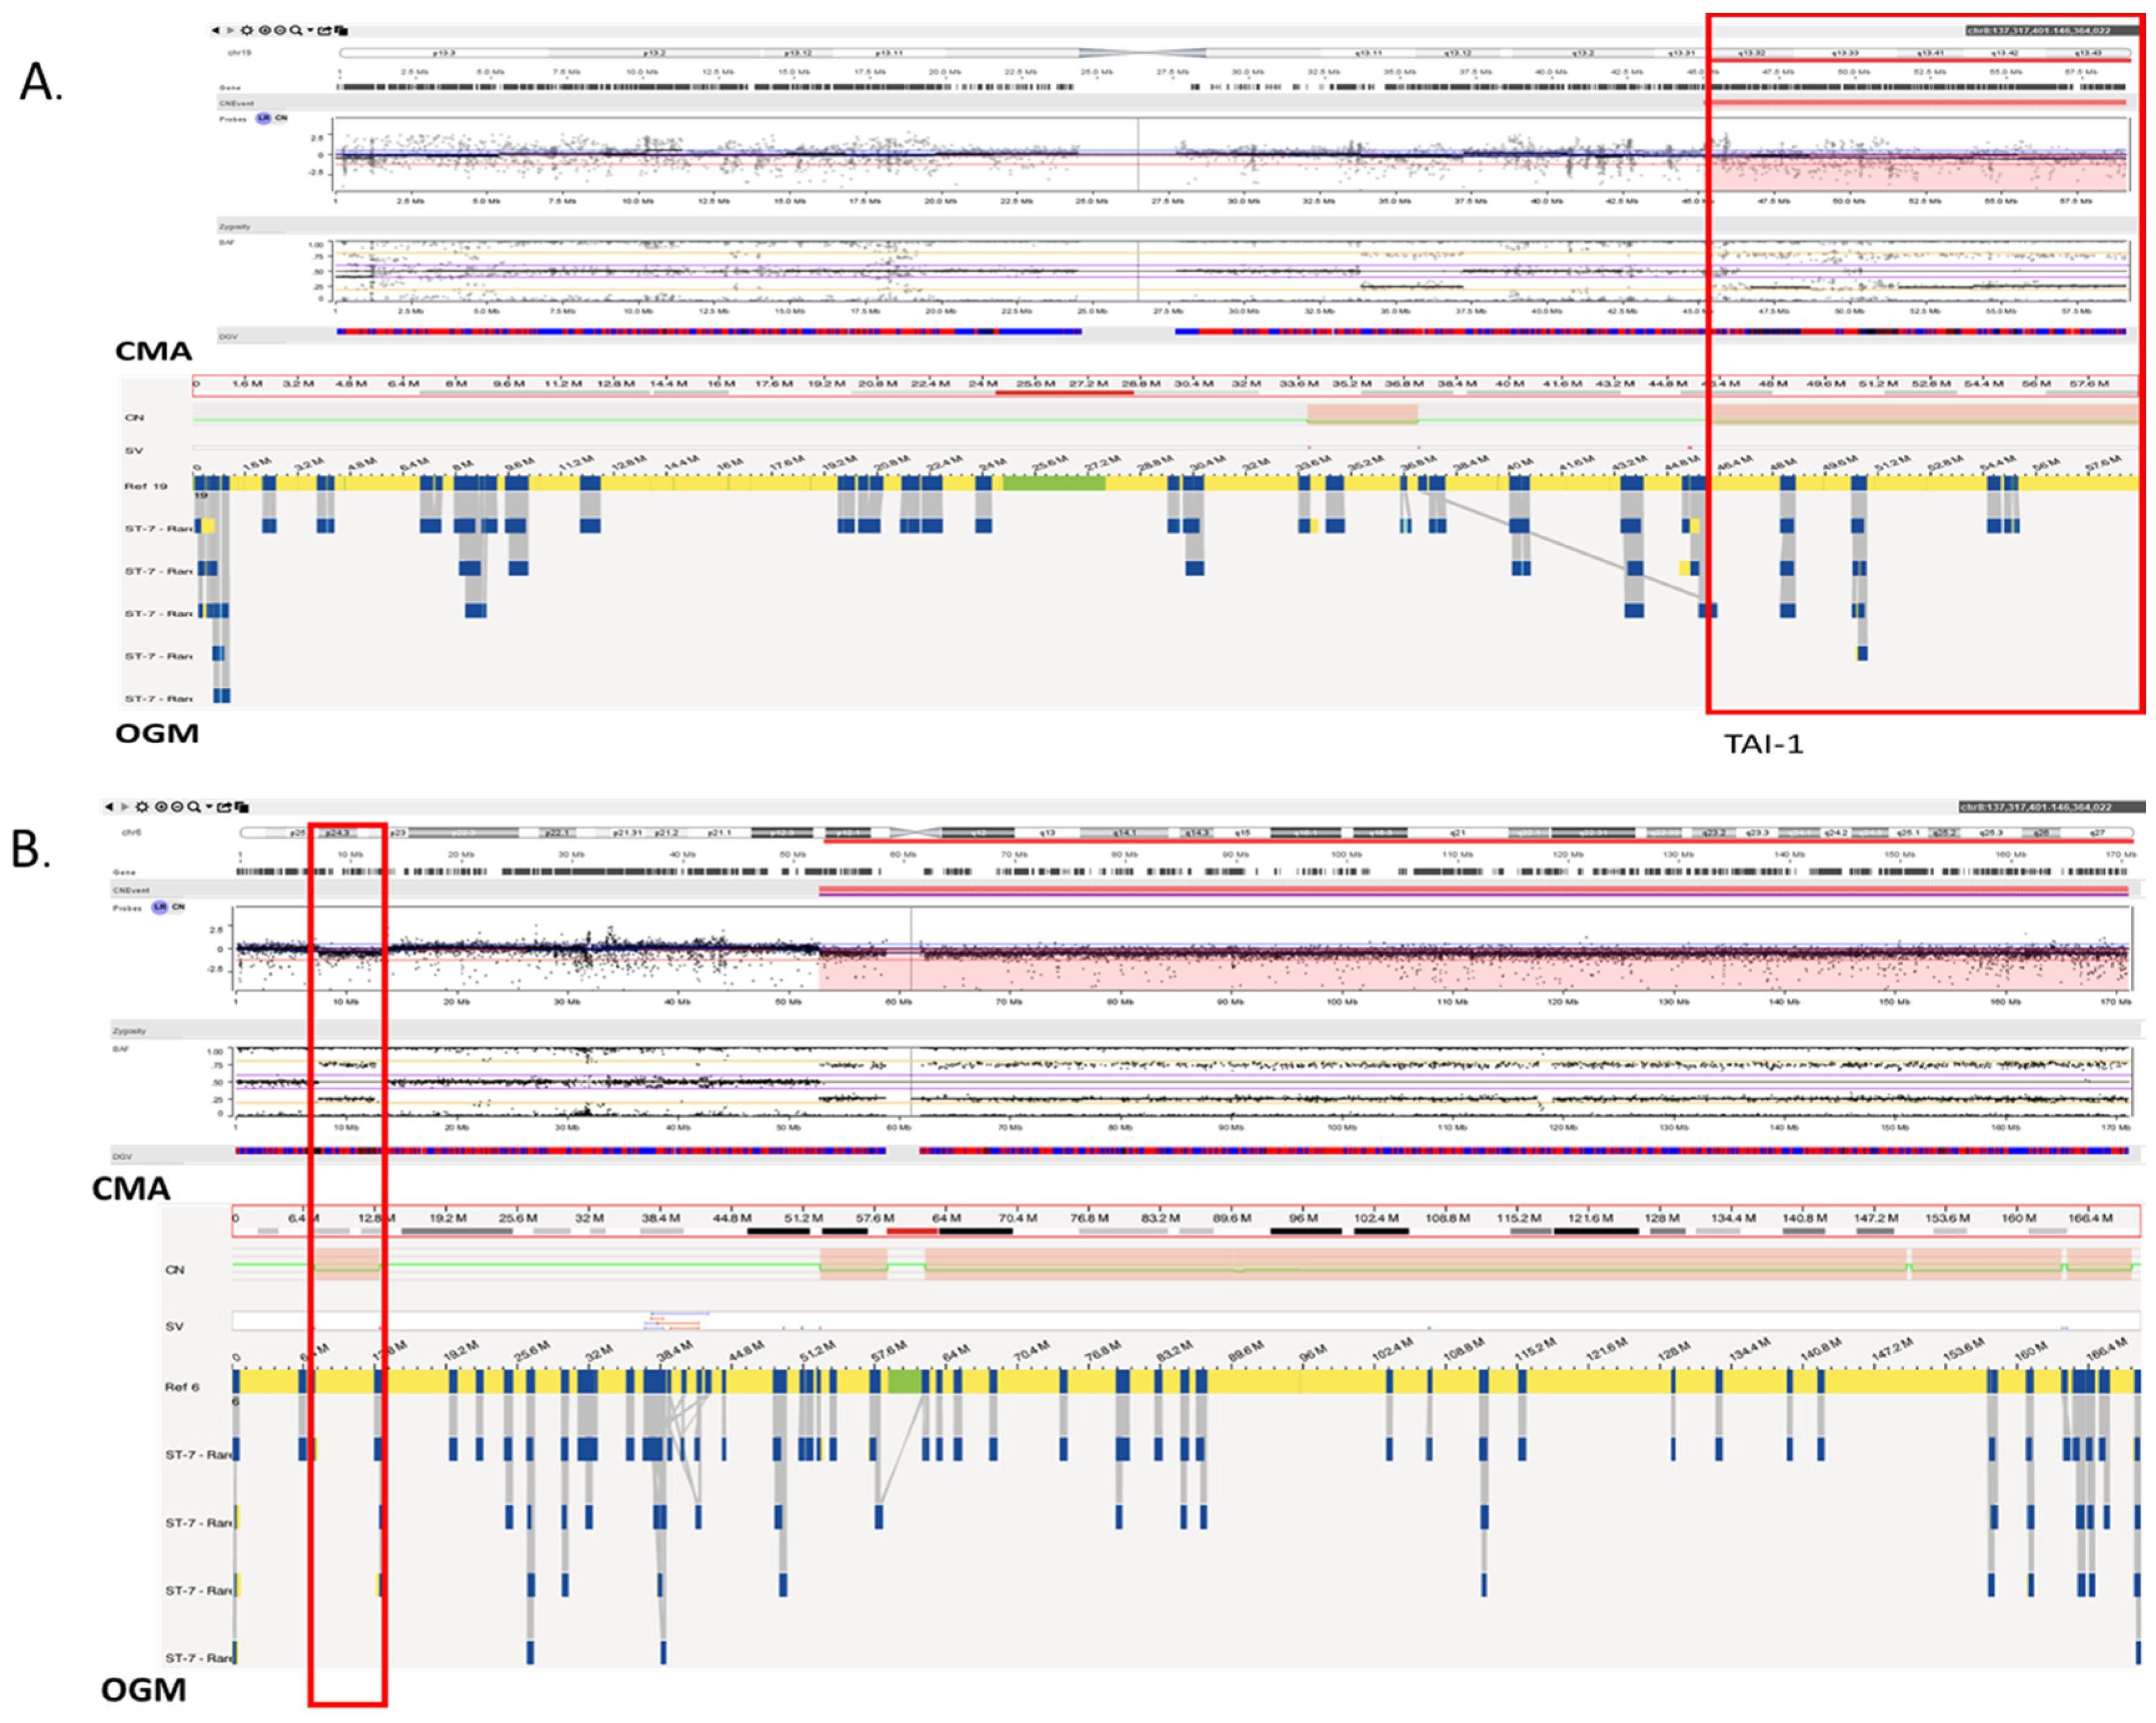
- TAI-0 = terminal gains, losses, and AOH > 3 MB < 10 MB (score = 1);
- TAI-1 = terminal gains, losses, and AOH > 10 MB (score = 2);
- TAI-LOH-1 = losses and LOH > 15 MB involving telomeres (score = 3);
- LOH-1 = interstitial losses and AOH > 15 MB with anticipated 1 chromosome breakpoint (bp) (score = 2);
- LOH-2 = interstitial losses and AOH > 15 MB with anticipated 2 chromosome bp (score = 3);
- LOH-0 = interstitial losses and AOH > 15 MB with anticipated 0 chromosome bp (score = 1);
- LST-1 = interstitial gains, losses, and AOH > 10 MB with anticipated 1 chromosome bp (score = 1);
- LST-2 = interstitial gains, losses, translocations, and intra-chromosomal rearrangements and AOH > 10 MB with anticipated 2 chromosome bp (score = 2);
- LST-3 = insertions > 10 MB with anticipated 3 chromosome bp (score = 3).
3. Results
3.1. OGM Data QC Metrics
3.2. Validation of OGM Automated Scoring
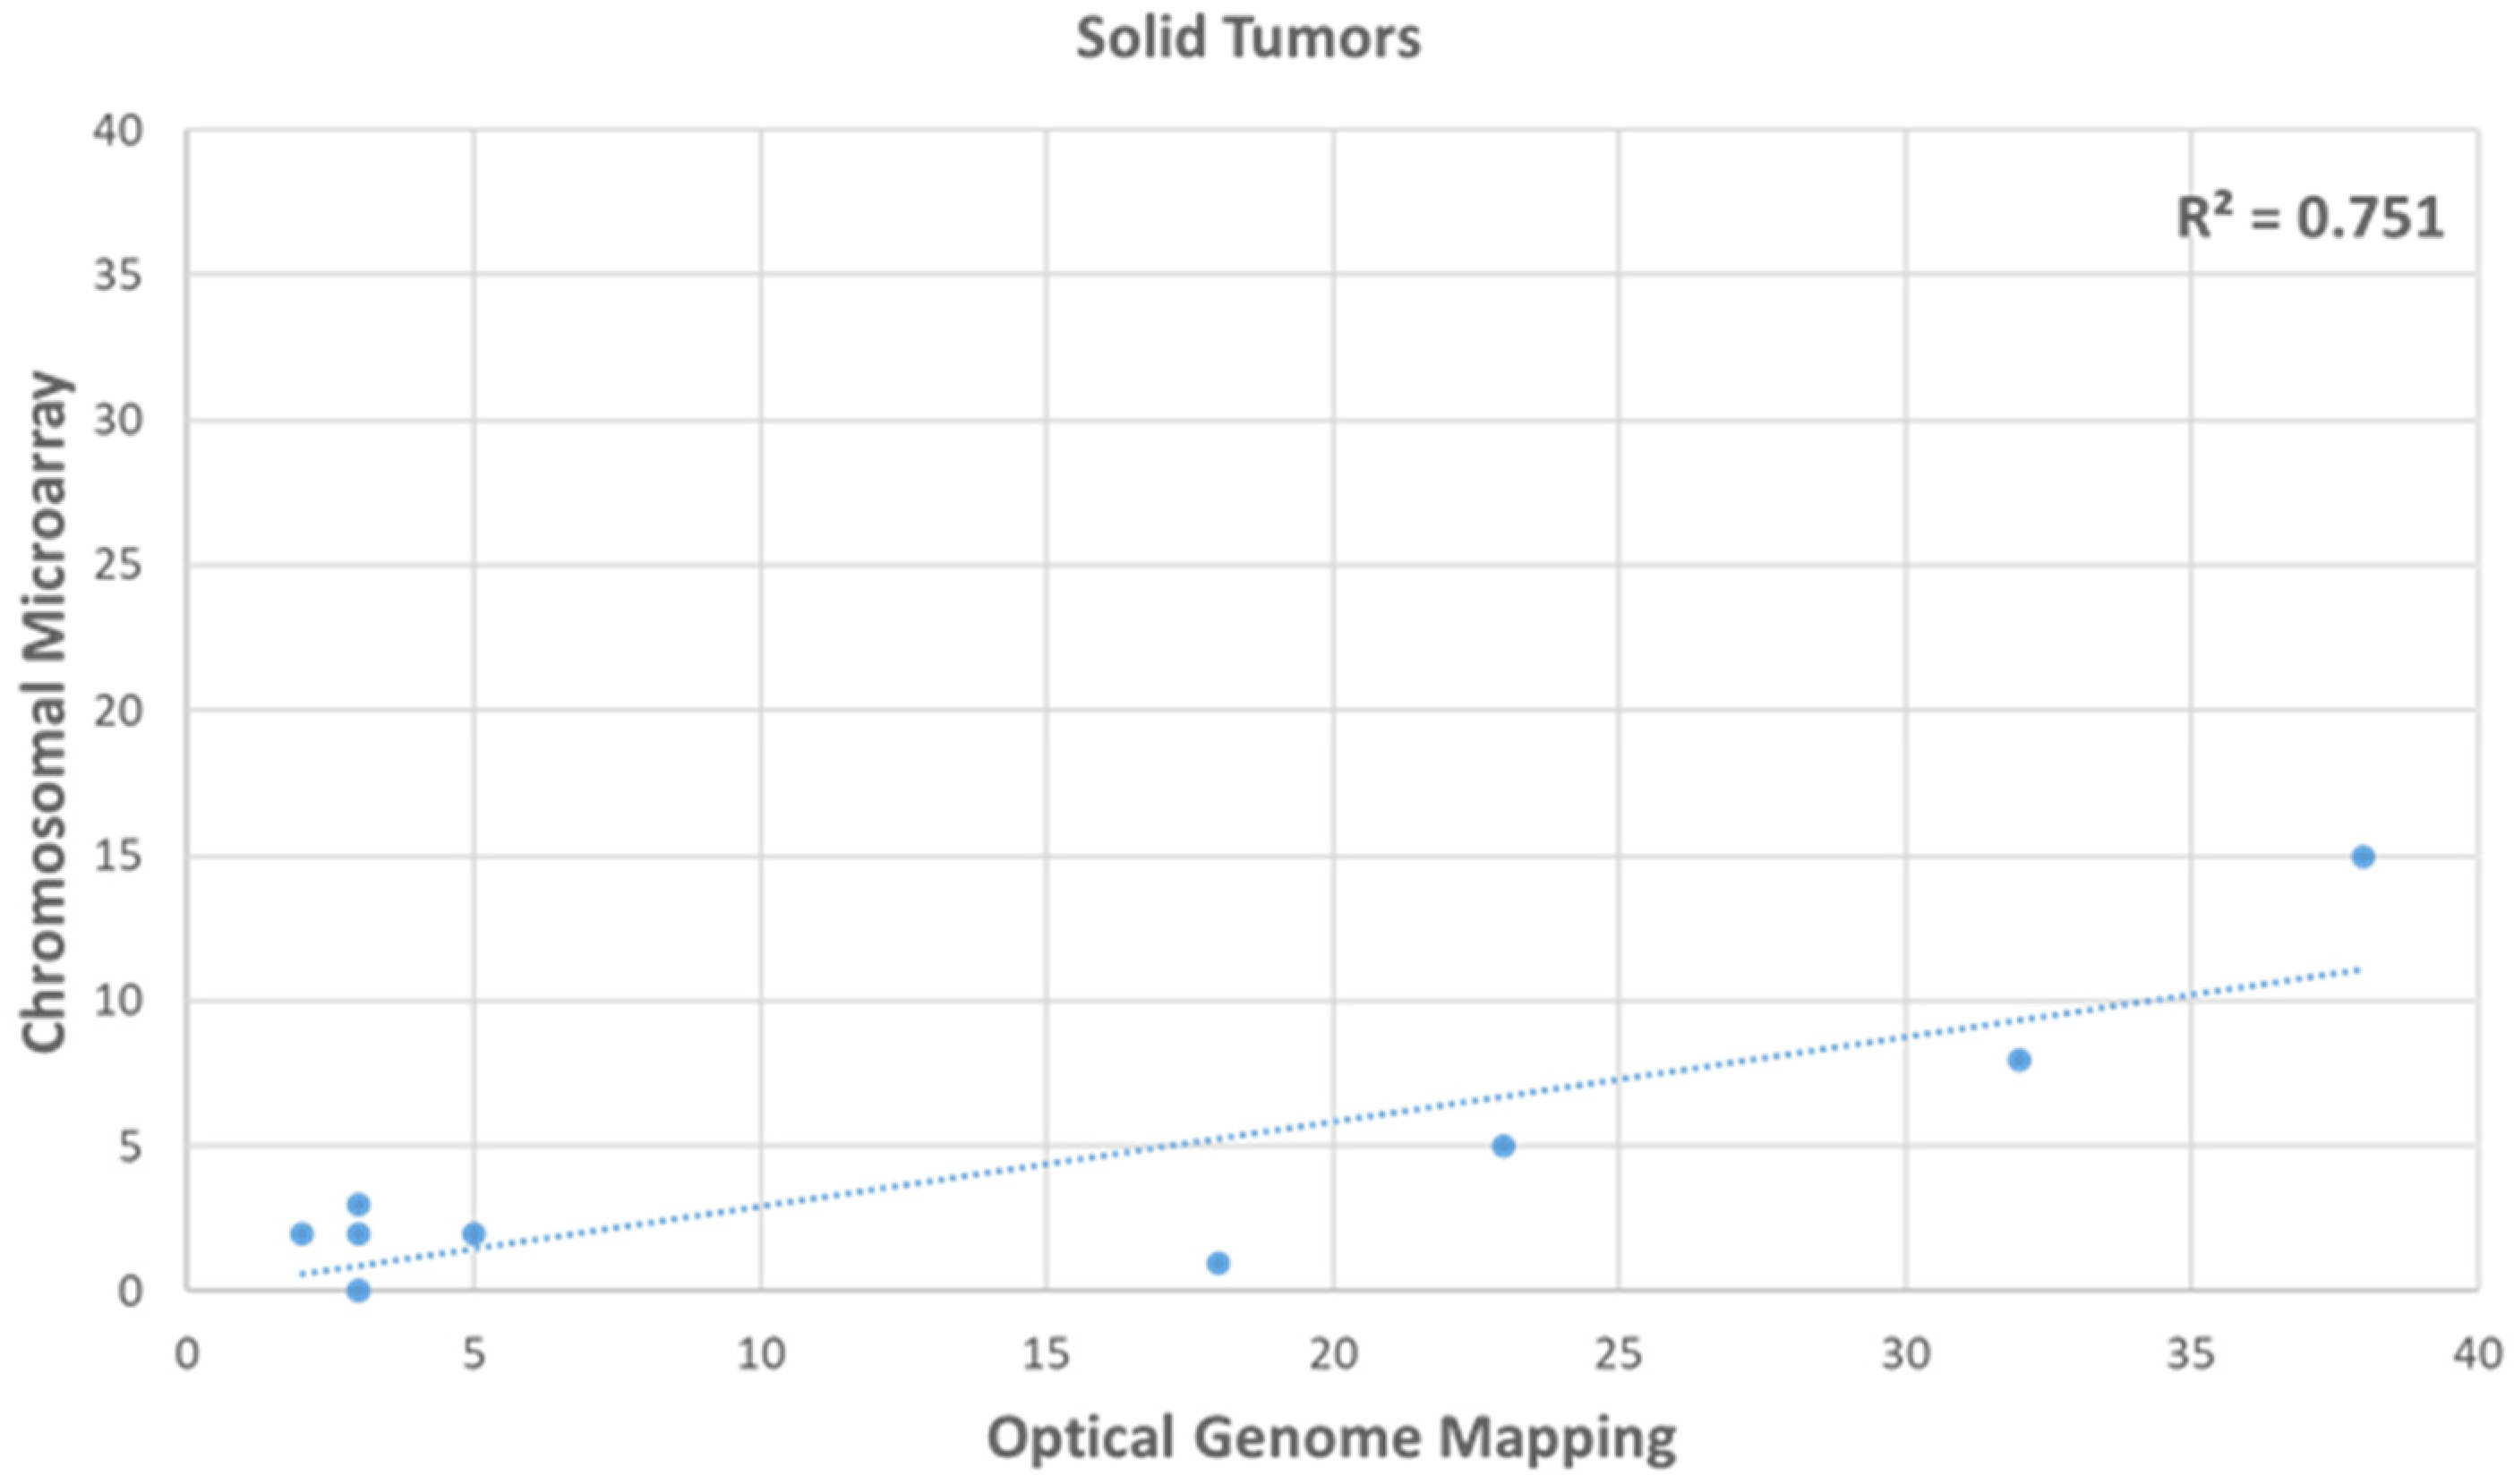
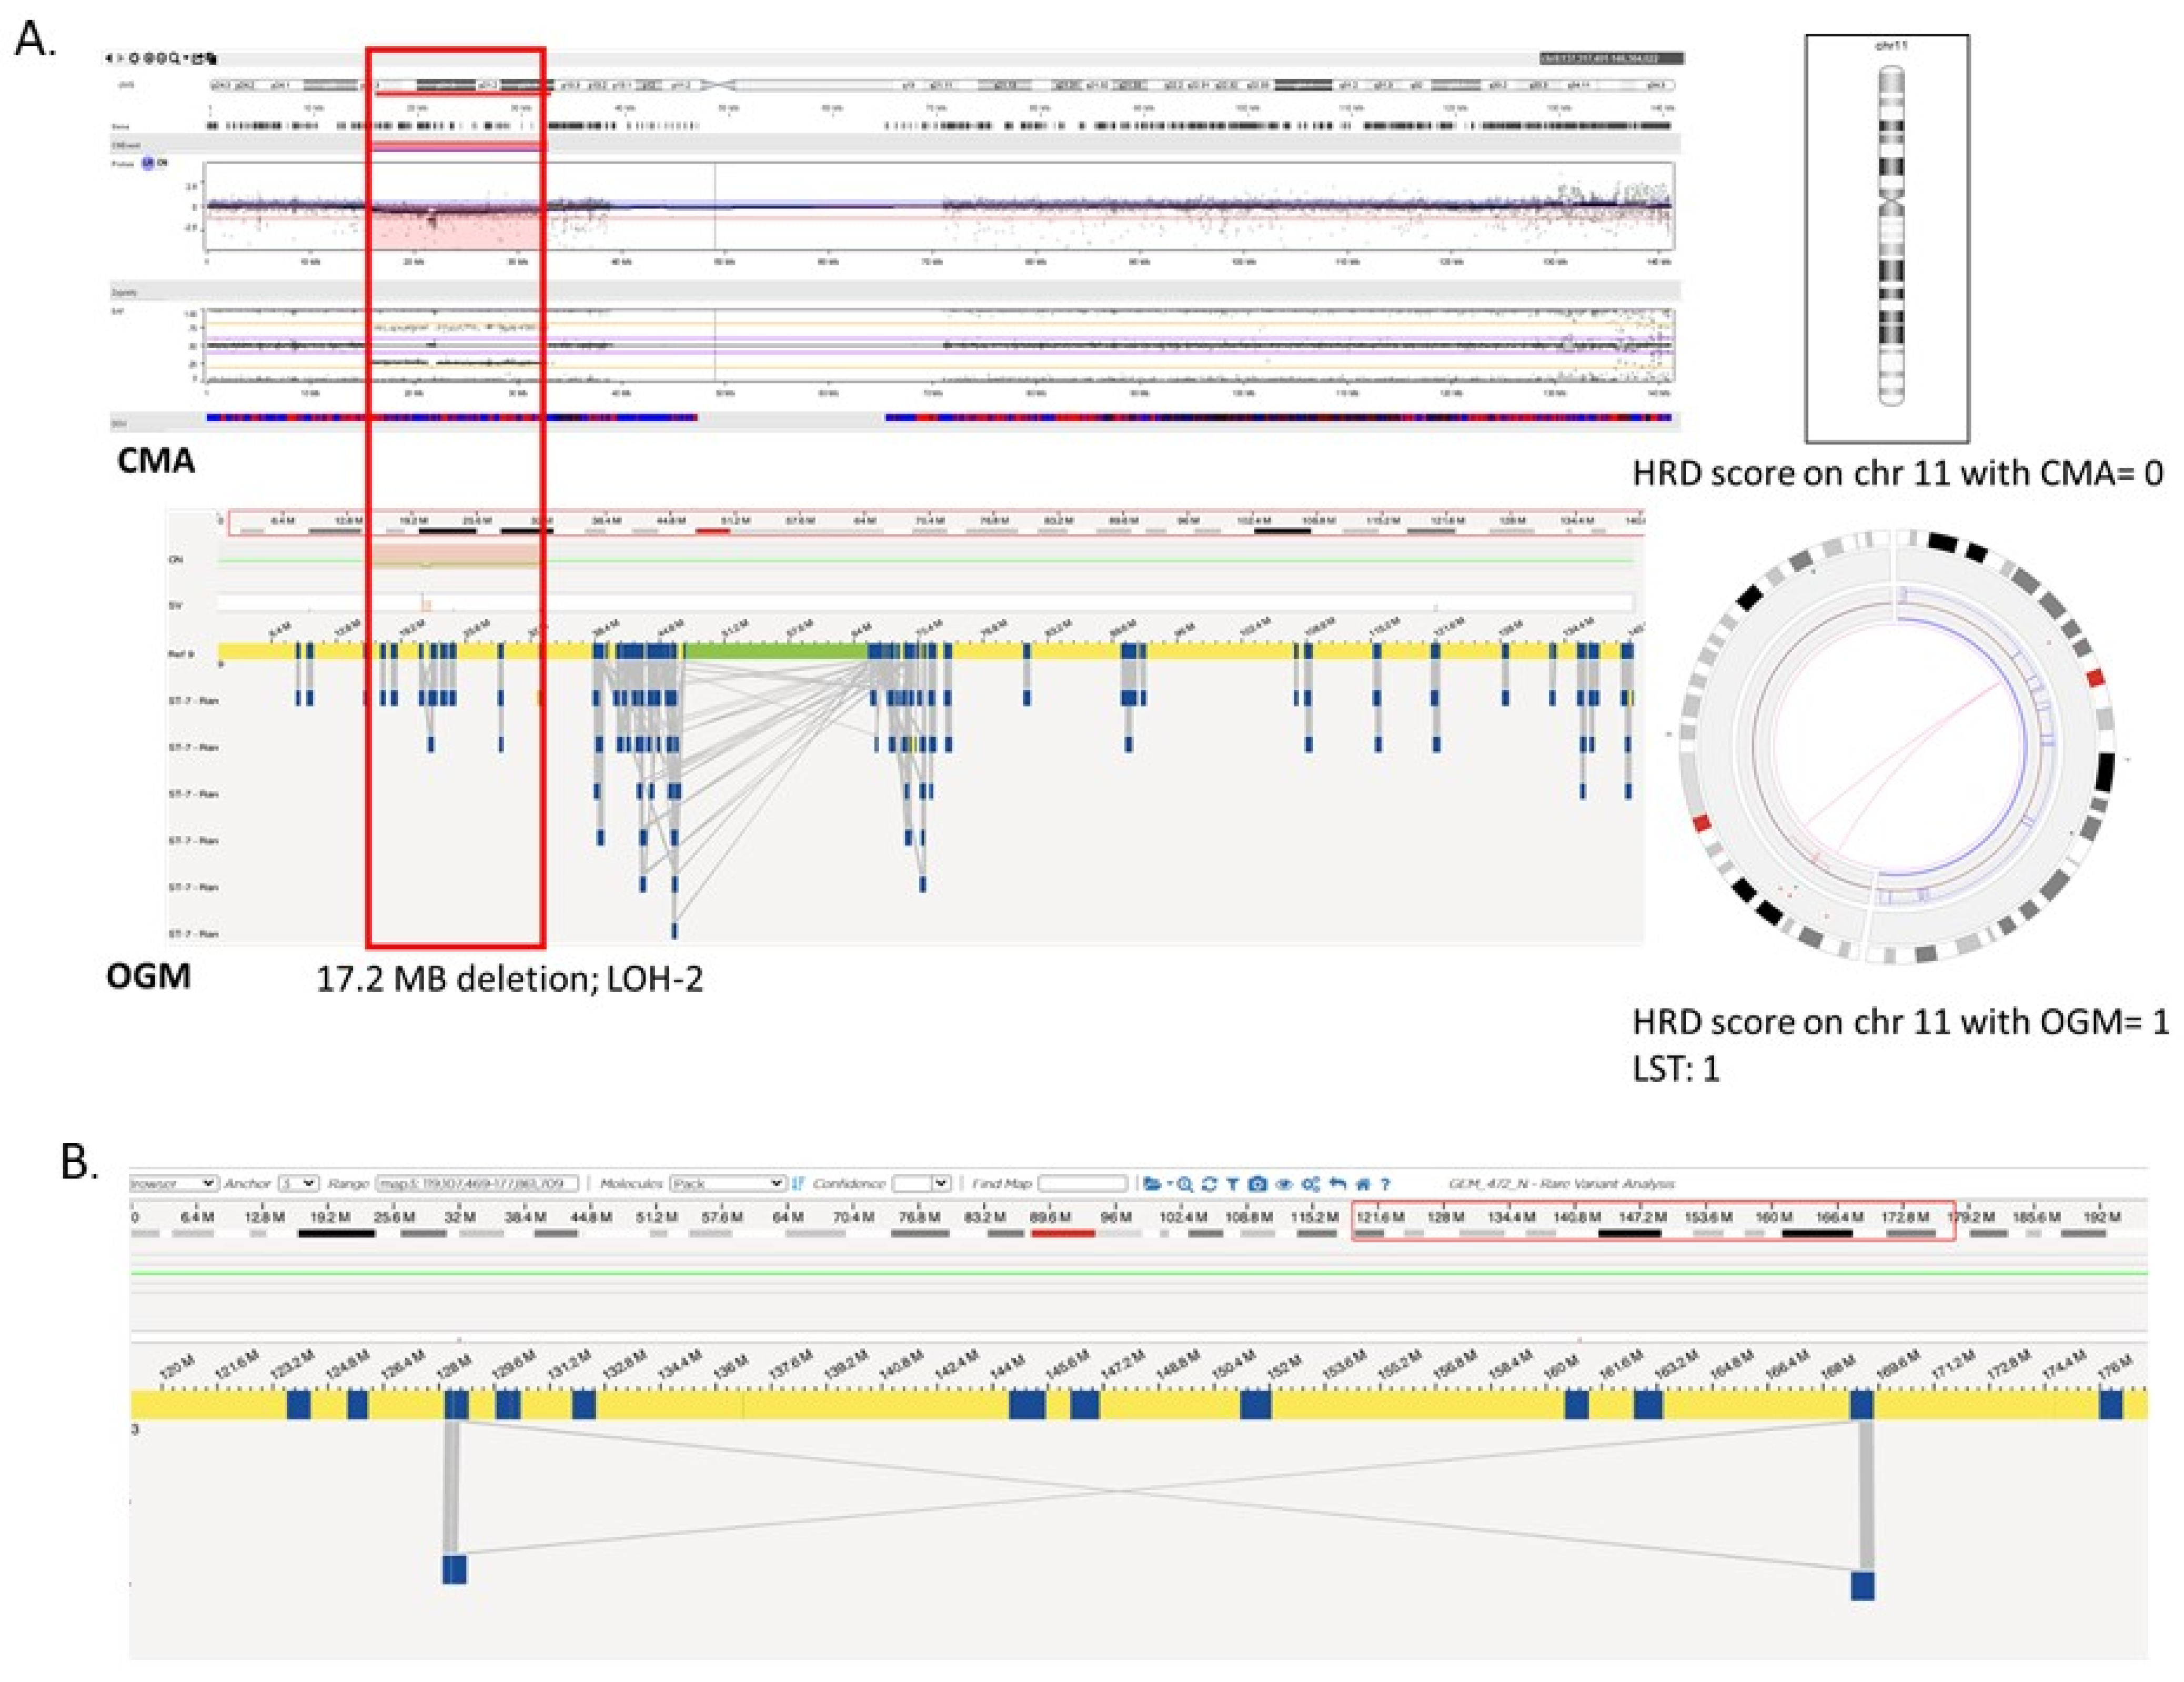
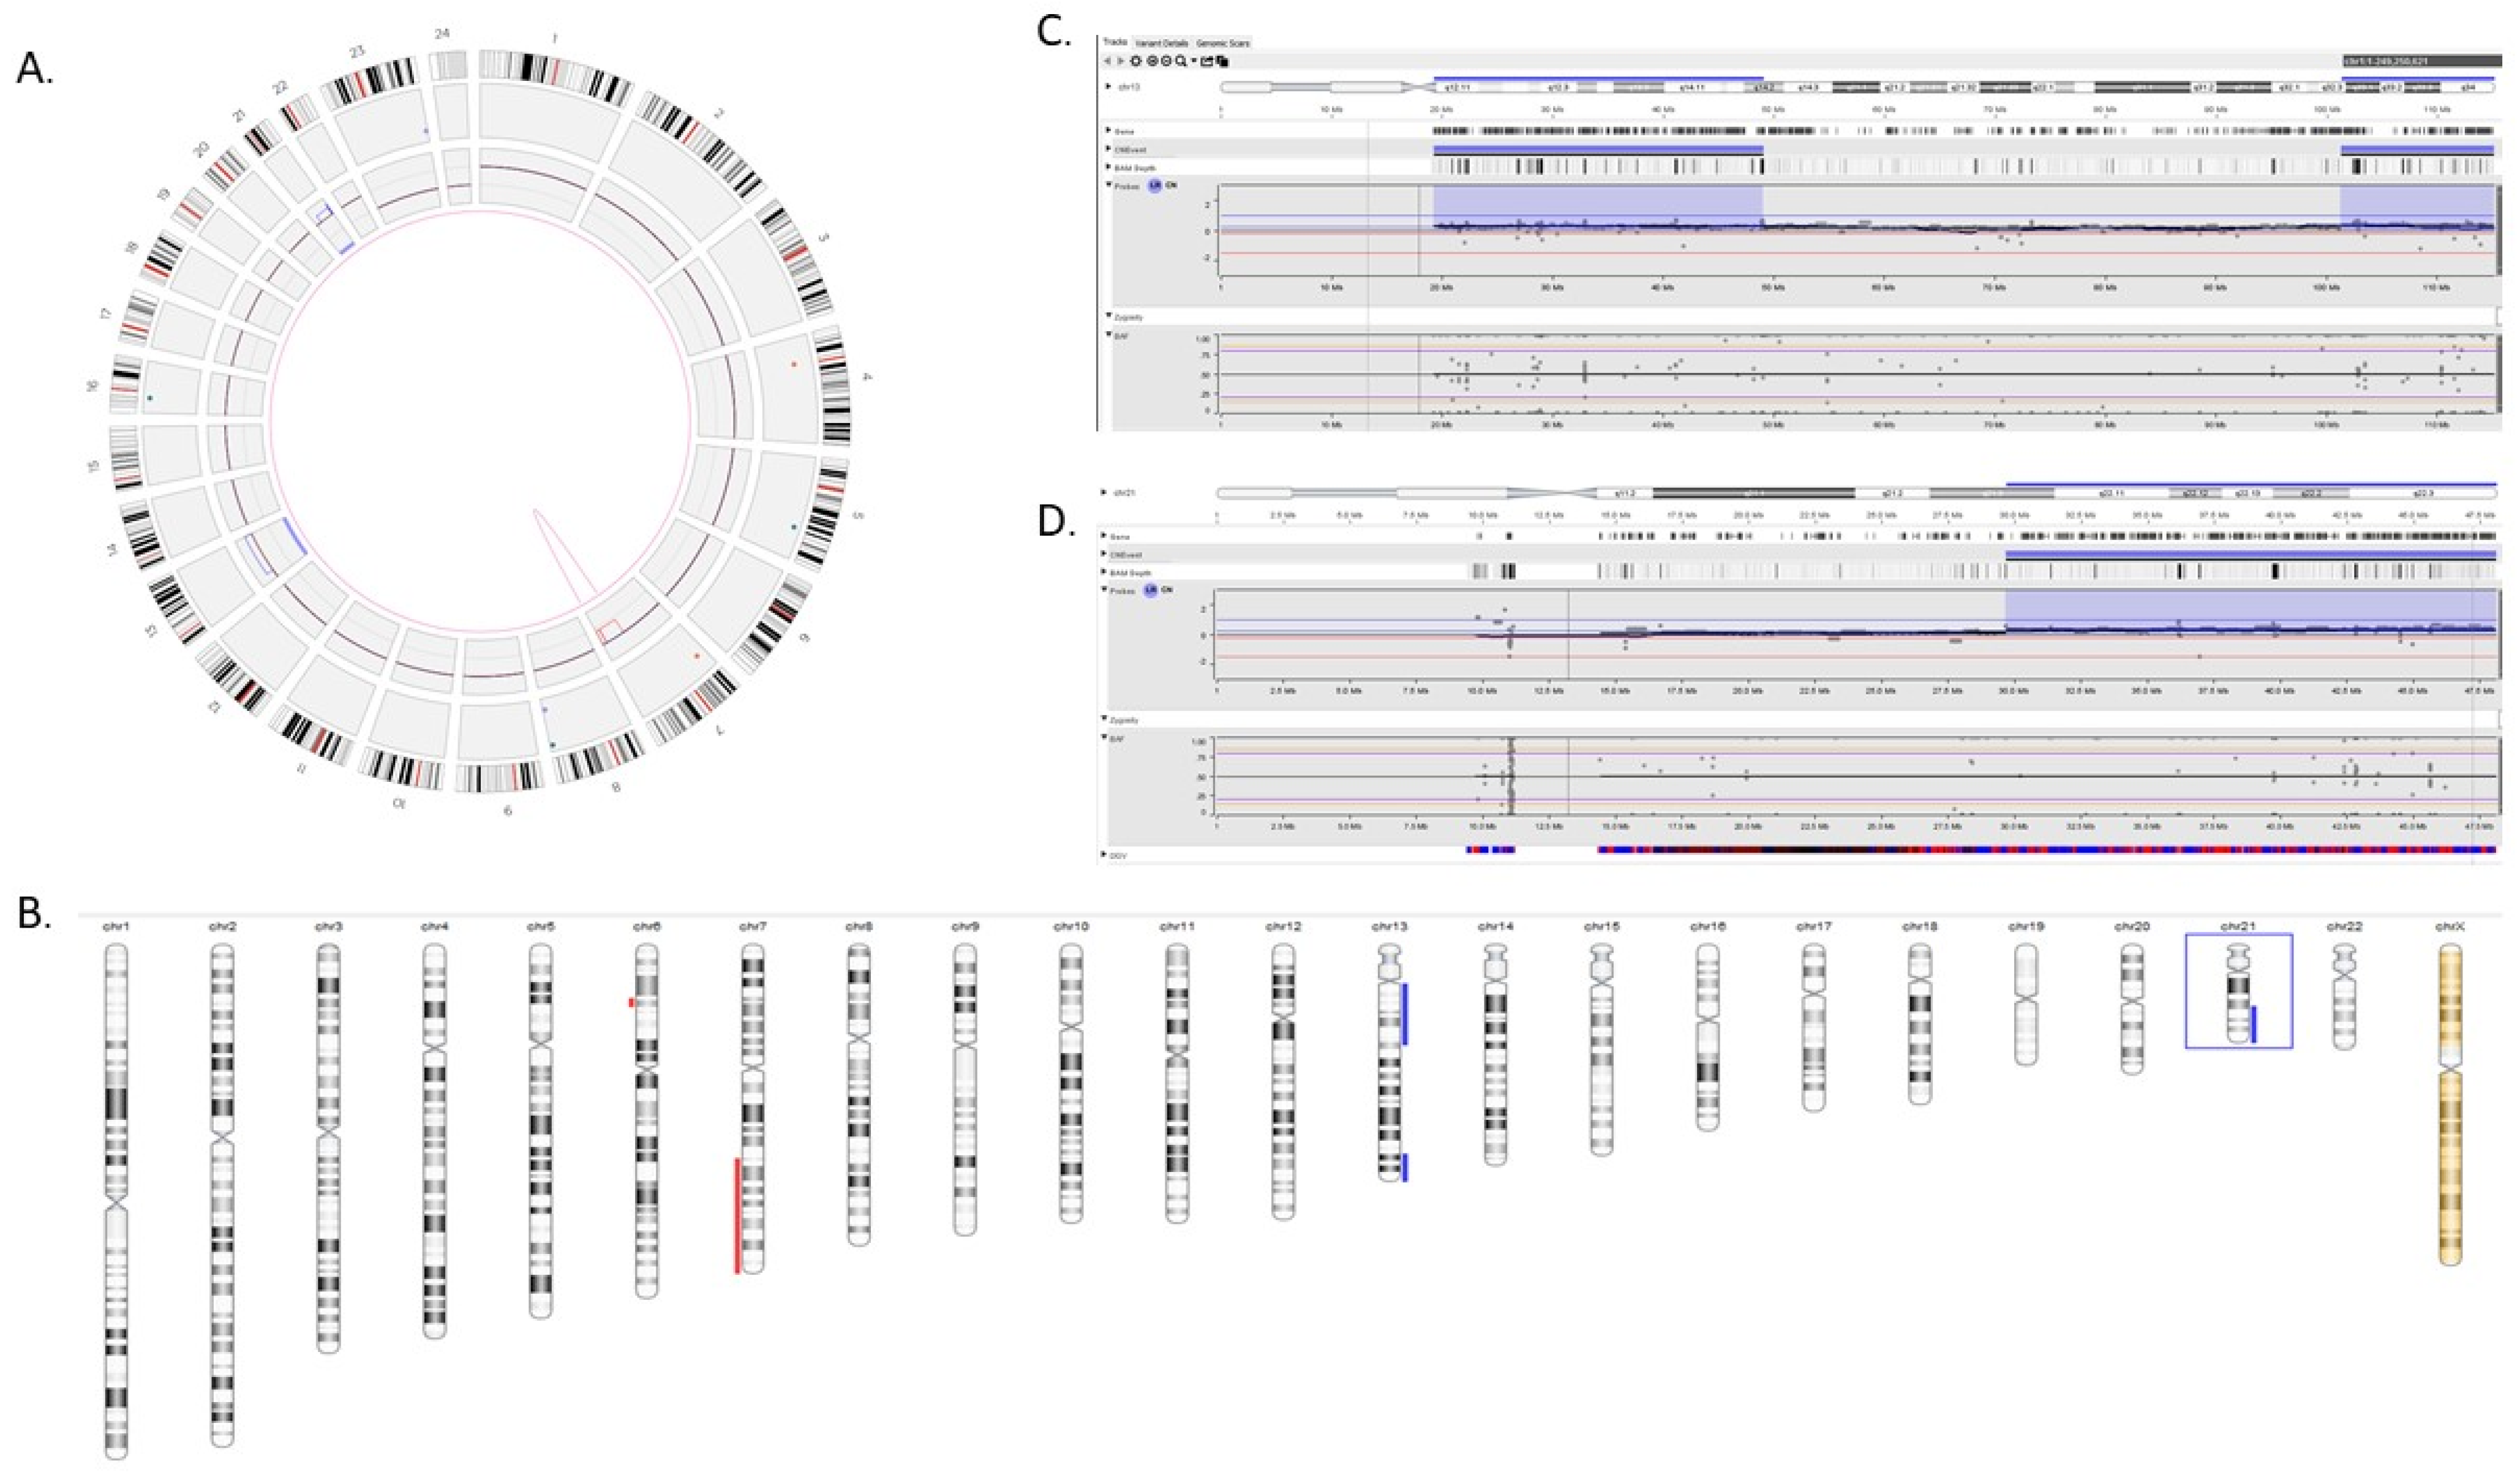
3.3. Comparison of HRD Scores between OGM and CMA in Gliomas
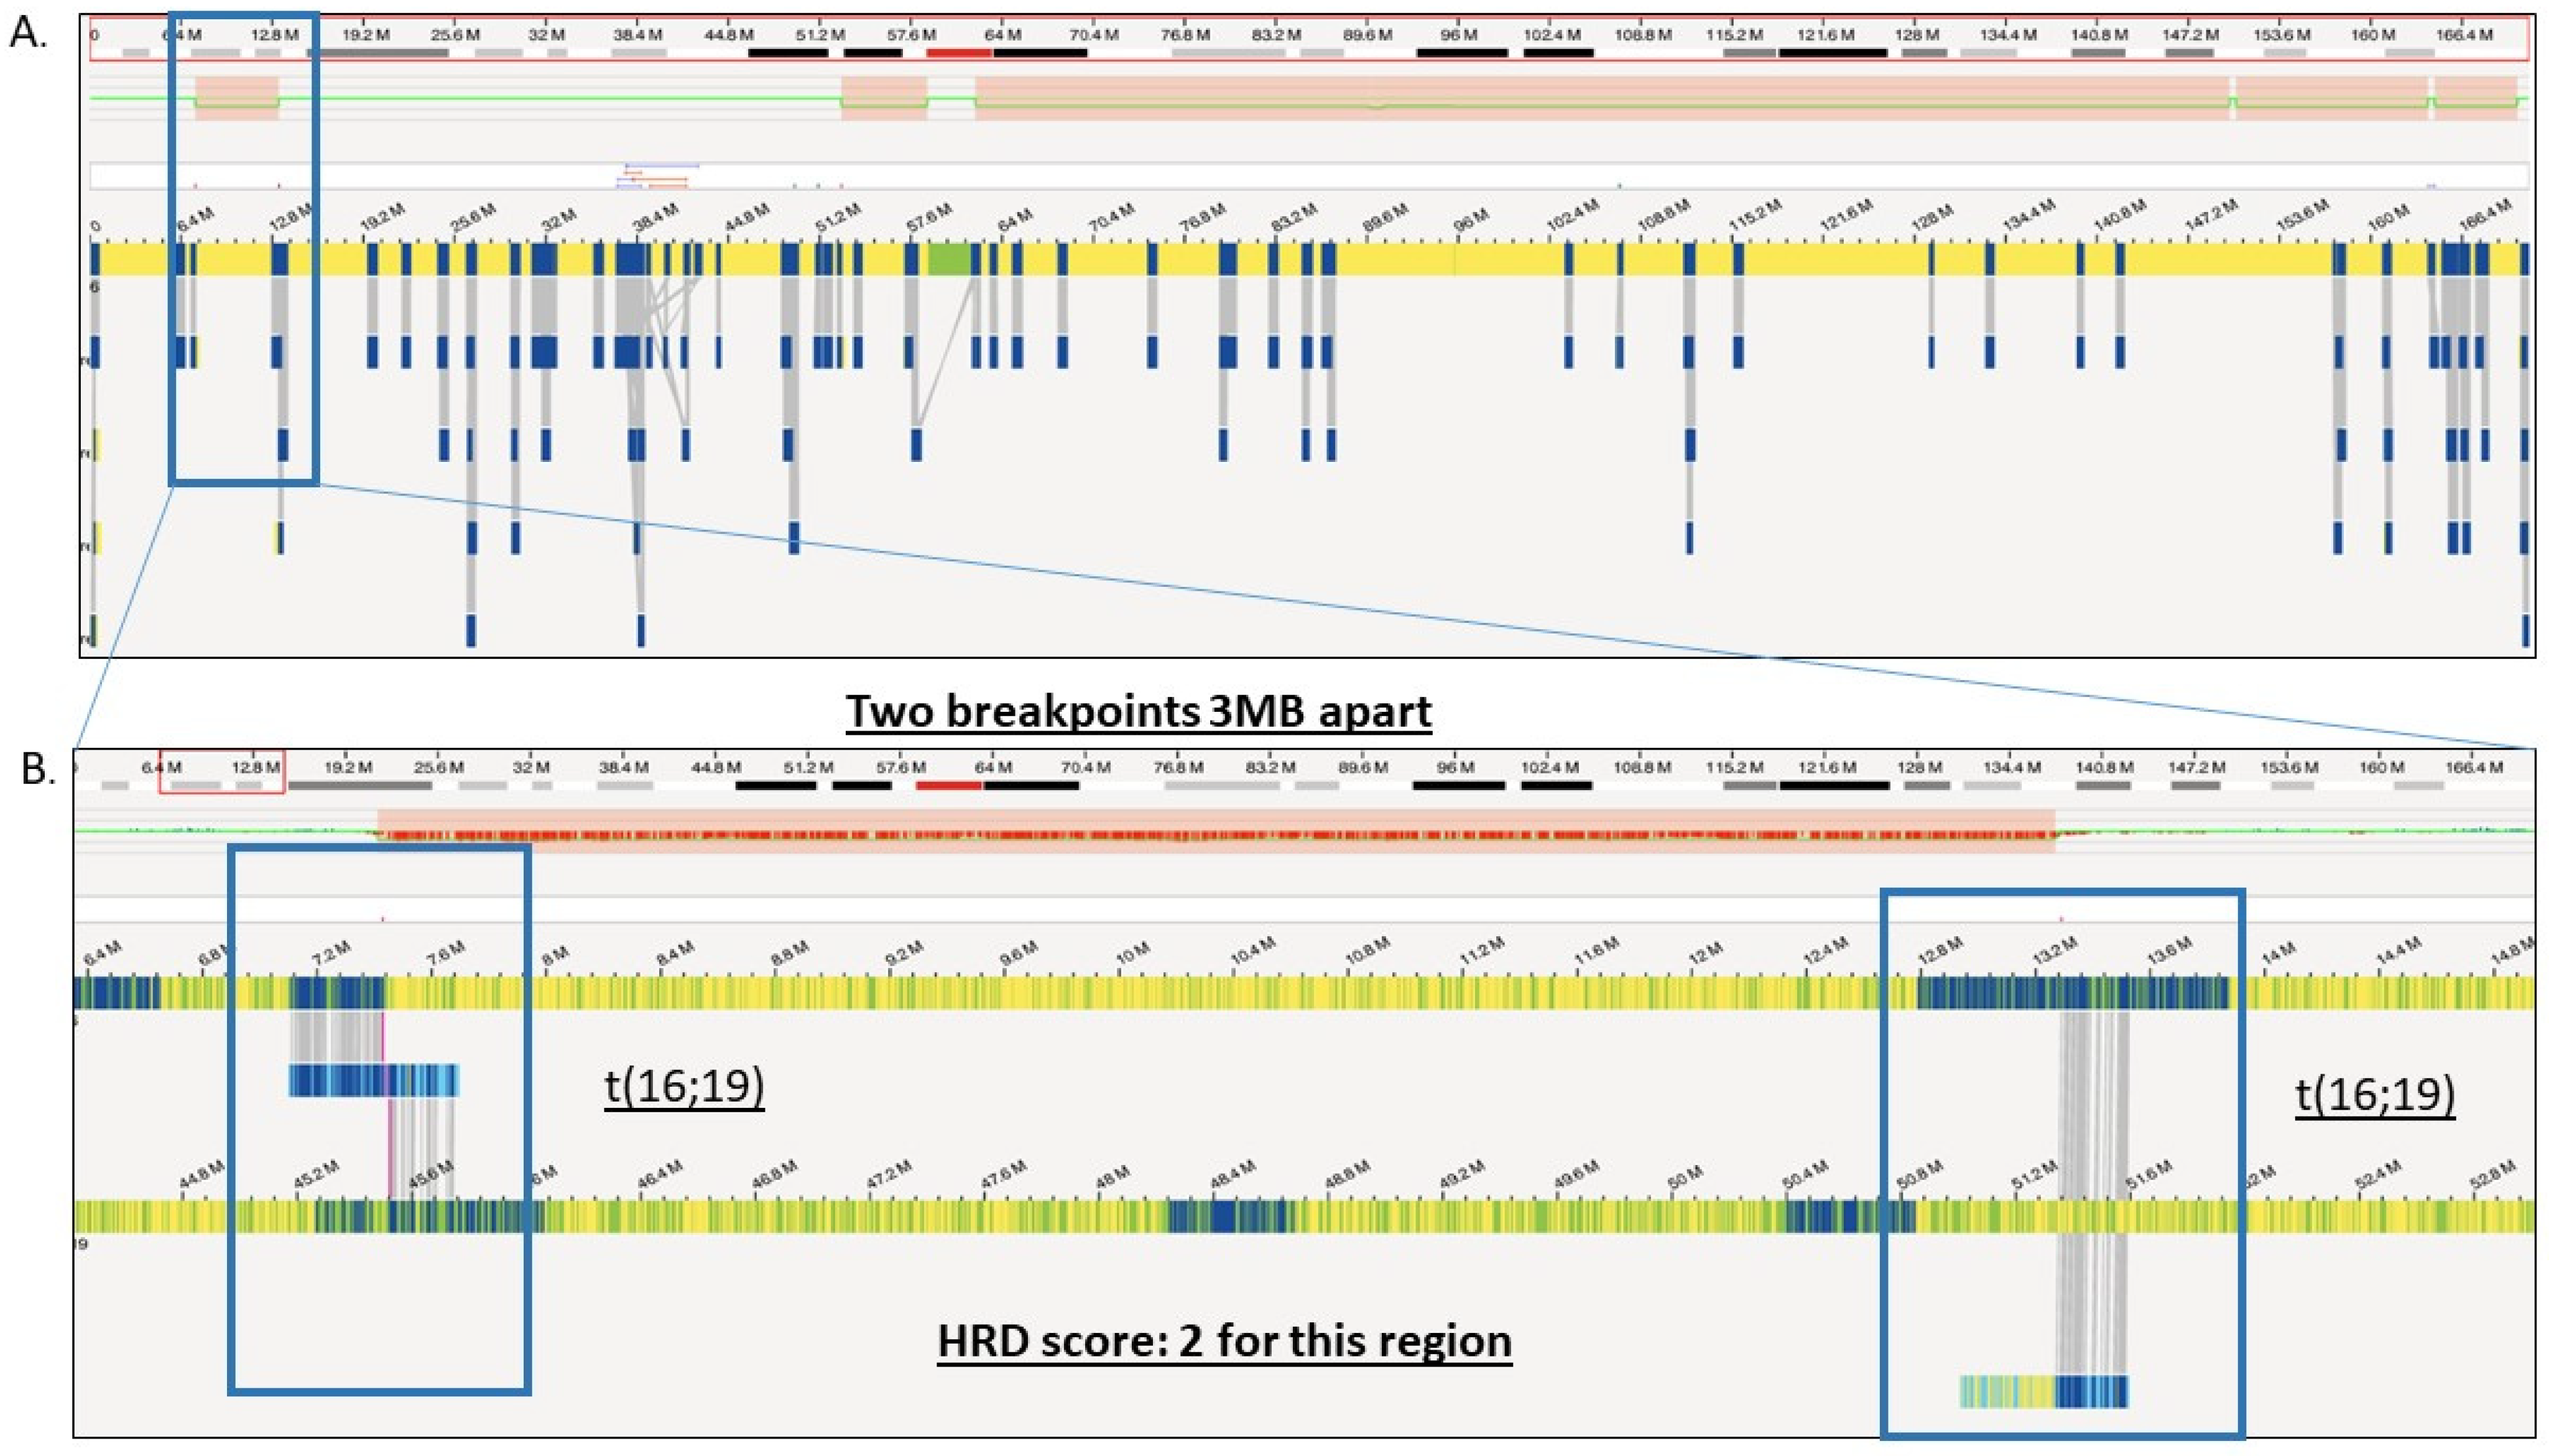
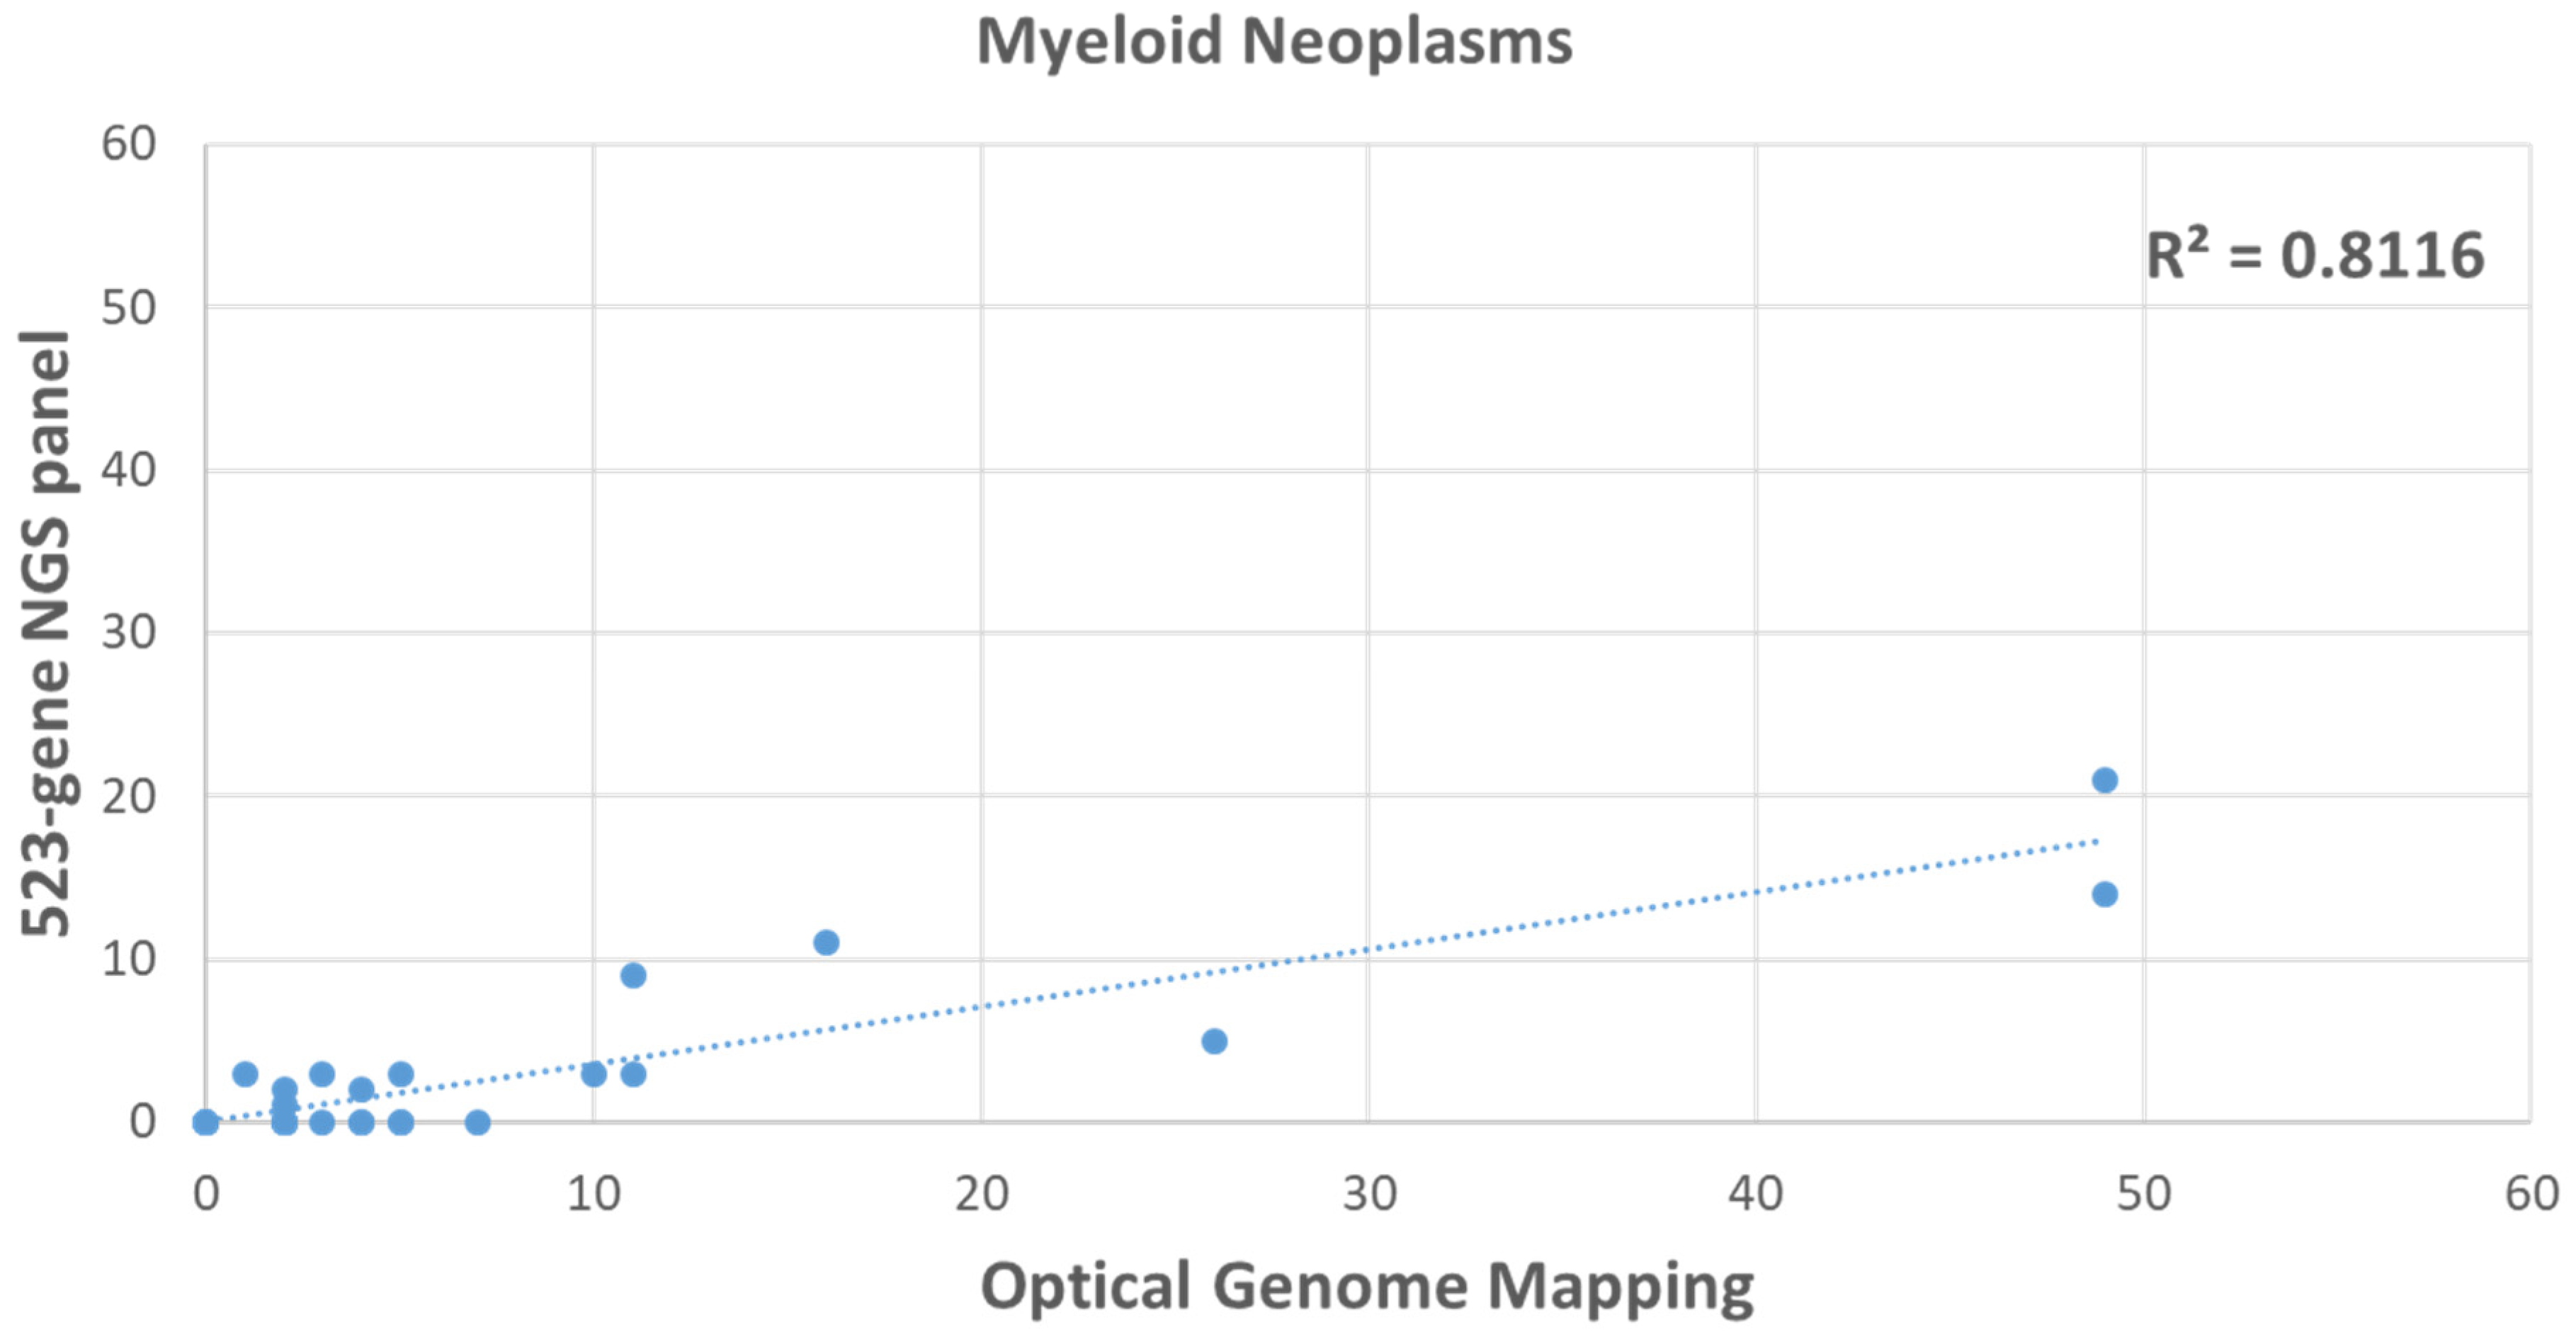
3.4. Comparison of HRD Scores between OGM and 523-Gene NGS Panel in Hematological Malignancy Cases
4. Discussion
Author Contributions
Funding
Institutional Review Board Statement
Informed Consent Statement
Data Availability Statement
Conflicts of Interest
References
- Tempero, M.A. NCCN Guidelines Updates: Pancreatic Cancer. J. Natl. Compr. Cancer Netw. 2019, 17, 603–605. [Google Scholar]
- Armstrong, D.K.; Alvarez, R.D.; Bakkum-Gamez, J.N.; Barroilhet, L.; Behbakht, K.; Berchuck, A.; Berek, J.S.; Chen, L.M.; Cristea, M.; DeRosa, M. Ovarian cancer, version 1.2019 featured updates to the NCCN guidelines. J. Natl. Compr. Cancer Netw. 2019, 17, 896–909. [Google Scholar] [CrossRef]
- Gradishar, W.J.; Moran, M.S.; Abraham, J.; Aft, R.; Agnese, D.; Allison, K.H.; Blair, S.L.; Burstein, H.J.; Dang, C.; Elias, A.D. NCCN guidelines® insights: Breast cancer, version 4.2021: Featured updates to the NCCN guidelines. J. Natl. Compr. Cancer Netw. 2021, 19, 484–493. [Google Scholar] [CrossRef]
- Tempero, M.A.; Malafa, M.P.; Al-Hawary, M.; Behrman, S.W.; Benson, A.B.; Cardin, D.B.; Chiorean, E.G.; Chung, V.; Czito, B.; Del Chiaro, M. Pancreatic adenocarcinoma, version 2.2021, NCCN clinical practice guidelines in oncology. J. Natl. Compr. Cancer Netw. 2021, 19, 439–457. [Google Scholar] [CrossRef]
- Armstrong, D.K.; Alvarez, R.D.; Bakkum-Gamez, J.N.; Barroilhet, L.; Behbakht, K.; Berchuck, A.; Chen, L.M.; Cristea, M.; DeRosa, M.; Eisenhauer, E.L. Ovarian cancer, version 2.2020, NCCN clinical practice guidelines in oncology. J. Natl. Compr. Cancer Netw. 2021, 19, 191–226. [Google Scholar] [CrossRef]
- Schaeffer, E.; Srinivas, S.; Antonarakis, E.S.; Armstrong, A.J.; Bekelman, J.E.; Cheng, H.; D’Amico, A.V.; Davis, B.J.; Desai, N.; Dorff, T. NCCN guidelines insights: Prostate cancer, version 1.2021: Featured updates to the NCCN guidelines. J. Natl. Compr. Cancer Netw. 2021, 19, 134–143. [Google Scholar] [CrossRef]
- Murai, J.; Zhang, Y.; Morris, J.; Ji, J.; Takeda, S.; Doroshow, J.H.; Pommier, Y. Rationale for poly(ADP-ribose) polymerase (PARP) inhibitors in combination therapy with camptothecins or temozolomide based on PARP trapping versus catalytic inhibition. J. Pharmacol. Exp. Ther. 2014, 349, 408–416. [Google Scholar] [CrossRef]
- Senra, J.M.; Telfer, B.A.; Cherry, K.E.; McCrudden, C.M.; Hirst, D.G.; O’Connor, M.J.; Wedge, S.R.; Stratford, I.J. Inhibition of PARP-1 by olaparib (AZD2281) increases the radiosensitivity of a lung tumor xenograft. Mol. Cancer Ther. 2011, 10, 1949–1958. [Google Scholar] [CrossRef]
- Heacock, M.L.; Stefanick, D.F.; Horton, J.K.; Wilson, S.H. Alkylation DNA damage in combination with PARP inhibition results in formation of S-phase-dependent double-strand breaks. DNA Repair 2010, 9, 929–936. [Google Scholar] [CrossRef]
- Stewart, M.D.; Merino Vega, D.; Arend, R.C.; Baden, J.F.; Barbash, O.; Beaubier, N.; Collins, G.; French, T.; Ghahramani, N.; Hinson, P.; et al. Homologous Recombination Deficiency: Concepts, Definitions, and Assays. Oncologist 2022, 27, 167–174. [Google Scholar] [CrossRef]
- Konstantinopoulos, P.A.; Ceccaldi, R.; Shapiro, G.I.; D’Andrea, A.D. Homologous Recombination Deficiency: Exploiting the Fundamental Vulnerability of Ovarian Cancer. Cancer Discov. 2015, 5, 1137–1154. [Google Scholar] [CrossRef] [PubMed]
- Takamatsu, S.; Brown, J.B.; Yamaguchi, K.; Hamanishi, J.; Yamanoi, K.; Takaya, H.; Kaneyasu, T.; Mori, S.; Mandai, M.; Matsumura, N. Utility of Homologous Recombination Deficiency Biomarkers Across Cancer Types. JCO Precis. Oncol. 2021, 5, 1270–1280. [Google Scholar] [CrossRef] [PubMed]
- Gou, R.; Dong, H.; Lin, B. Application and reflection of genomic scar assays in evaluating the efficacy of platinum salts and PARP inhibitors in cancer therapy. Life Sci. 2020, 261, 118434. [Google Scholar] [CrossRef] [PubMed]
- Takaya, H.; Nakai, H.; Takamatsu, S.; Mandai, M.; Matsumura, N. Homologous recombination deficiency status-based classification of high-grade serous ovarian carcinoma. Sci. Rep. 2020, 10, 2757. [Google Scholar] [CrossRef] [PubMed]
- Watkins, J.A.; Irshad, S.; Grigoriadis, A.; Tutt, A.N. Genomic scars as biomarkers of homologous recombination deficiency and drug response in breast and ovarian cancers. Breast Cancer Res. 2014, 16, 211. [Google Scholar] [CrossRef]
- Abkevich, V.; Timms, K.M.; Hennessy, B.T.; Potter, J.; Carey, M.S.; Meyer, L.A.; Smith-McCune, K.; Broaddus, R.; Lu, K.H.; Chen, J.; et al. Patterns of genomic loss of heterozygosity predict homologous recombination repair defects in epithelial ovarian cancer. Br. J. Cancer 2012, 107, 1776–1782. [Google Scholar] [CrossRef]
- Birkbak, N.J.; Wang, Z.C.; Kim, J.Y.; Eklund, A.C.; Li, Q.; Tian, R.; Bowman-Colin, C.; Li, Y.; Greene-Colozzi, A.; Iglehart, J.D.; et al. Telomeric allelic imbalance indicates defective DNA repair and sensitivity to DNA-damaging agents. Cancer Discov. 2012, 2, 366–375. [Google Scholar] [CrossRef]
- Popova, T.; Manié, E.; Rieunier, G.; Caux-Moncoutier, V.; Tirapo, C.; Dubois, T.; Delattre, O.; Sigal-Zafrani, B.; Bollet, M.; Longy, M.; et al. Ploidy and large-scale genomic instability consistently identify basal-like breast carcinomas with BRCA1/2 inactivation. Cancer Res. 2012, 72, 5454–5462. [Google Scholar] [CrossRef]
- Diossy, M.; Sztupinszki, Z.; Borcsok, J.; Krzystanek, M.; Tisza, V.; Spisak, S.; Rusz, O.; Timar, J.; Csabai, I.; Fillinger, J.; et al. A subset of lung cancer cases shows robust signs of homologous recombination deficiency associated genomic mutational signatures. NPJ Precis. Oncol. 2021, 5, 55. [Google Scholar] [CrossRef]
- Mansouri, A.; Hachem, L.D.; Mansouri, S.; Nassiri, F.; Laperriere, N.J.; Xia, D.; Lindeman, N.I.; Wen, P.Y.; Chakravarti, A.; Mehta, M.P.; et al. MGMT promoter methylation status testing to guide therapy for glioblastoma: Refining the approach based on emerging evidence and current challenges. Neuro-Oncology 2019, 21, 167–178. [Google Scholar] [CrossRef]
- Kayabolen, A.; Yilmaz, E.; Bagci-Onder, T. IDH Mutations in Glioma: Double-Edged Sword in Clinical Applications? Biomedicines 2021, 9, 799. [Google Scholar] [CrossRef]
- Csizmar, C.M.; Saliba, A.N.; Swisher, E.M.; Kaufmann, S.H. PARP Inhibitors and Myeloid Neoplasms: A Double-Edged Sword. Cancers 2021, 13, 6385. [Google Scholar] [CrossRef]
- Hanahan, D.; Weinberg, R.A. Hallmarks of cancer: The next generation. Cell 2011, 144, 646–674. [Google Scholar] [CrossRef]
- Zhang, S.; Peng, X.; Li, X.; Liu, H.; Zhao, B.; Elkabets, M.; Liu, Y.; Wang, W.; Wang, R.; Zhong, Y.; et al. BKM120 sensitizes glioblastoma to the PARP inhibitor rucaparib by suppressing homologous recombination repair. Cell Death Dis. 2021, 12, 546. [Google Scholar] [CrossRef] [PubMed]
- Gupta, S.K.; Smith, E.J.; Mladek, A.C.; Tian, S.; Decker, P.A.; Kizilbash, S.H.; Kitange, G.J.; Sarkaria, J.N. PARP Inhibitors for Sensitization of Alkylation Chemotherapy in Glioblastoma: Impact of Blood-Brain Barrier and Molecular Heterogeneity. Front. Oncol. 2019, 8, 670. [Google Scholar] [CrossRef] [PubMed]
- Gupta, S.K.; Kizilbash, S.H.; Carlson, B.L.; Mladek, A.C.; Boakye-Agyeman, F.; Bakken, K.K.; Pokorny, J.L.; Schroeder, M.A.; Decker, P.A.; Cen, L.; et al. Delineation of MGMT Hypermethylation as a Biomarker for Veliparib-Mediated Temozolomide-Sensitizing Therapy of Glioblastoma. J. Natl. Cancer Inst. 2015, 108, djv369. [Google Scholar] [CrossRef] [PubMed]
- Krutz, M.; Mcginnis, A.; Osborn, K.; Vesely, S.; Vidal, G.; Sung, S.; Ramkissoon, S.; Battiste, J. HOUT-14. Homologous recombination deficiency in patients with high grade gliomas. Neuro-Oncology 2018, 20 (Suppl. 6), vi116. [Google Scholar] [CrossRef]
- Sahajpal, N.S.; Mondal, A.K.; Tvrdik, T.; Hauenstein, J.; Shi, H.; Deeb, K.K.; Saxe, D.; Hastie, A.R.; Chaubey, A.; Savage, N.M.; et al. Clinical Validation and Diagnostic Utility of Optical Genome Mapping for Enhanced Cytogenomic Analysis of Hematological Neoplasms. J. Mol. Diagn. 2022, 24, 1279–1291. [Google Scholar] [CrossRef] [PubMed]
- Sahajpal, N.S.; Barseghyan, H.; Kolhe, R.; Hastie, A.; Chaubey, A. Optical Genome Mapping as a Next-Generation Cytogenomic Tool for Detection of Structural and Copy Number Variations for Prenatal Genomic Analyses. Genes 2021, 12, 398. [Google Scholar] [CrossRef]
- Neveling, K.; Mantere, T.; Vermeulen, S.; Oorsprong, M.; van Beek, R.; Kater-Baats, E.; Pauper, M.; van der Zande, G.; Smeets, D.; Weghuis, D.O.; et al. Next-generation cytogenetics: Comprehensive assessment of 52 hematological malignancy genomes by optical genome mapping. Am. J. Hum. Genet. 2021, 108, 1423–1435. [Google Scholar] [CrossRef]
- Mantere, T.; Neveling, K.; Pebrel-Richard, C.; Benoist, M.; van der Zande, G.; Kater-Baats, E.; Baatout, I.; van Beek, R.; Yammine, T.; Oorsprong, M.; et al. Optical genome mapping enables constitutional chromosomal aberration detection. Am. J. Hum. Genet. 2021, 108, 1409–1422. [Google Scholar] [CrossRef] [PubMed]
- Vanhuele, S.; Kirova, Y.; Hamy-Petit, A.S.; Rapinat, A.; Gentien, D.; Reyal, F.; Vincent-Salomon, A.; Eeckhoutte, A.; Rodrigues, M.; Popova, T.; et al. Optical Genome Mapping for detecting Homologous Recombination Deficiency (HRD) in human breast cancers. bioRxiv 2022. bioRxiv: 2022-12. [Google Scholar]
- Telli, M.L.; Timms, K.M.; Reid, J.; Hennessy, B.; Mills, G.B.; Jensen, K.C.; Szallasi, Z.; Barry, W.T.; Winer, E.P.; Tung, N.M.; et al. Homologous Recombination Deficiency (HRD) Score Predicts Response to Platinum-Containing Neoadjuvant Chemotherapy in Patients with Triple-Negative Breast Cancer. Clin. Cancer Res. 2016, 22, 3764–3773. [Google Scholar] [CrossRef] [PubMed]
- Min, A.; Kim, K.; Jeong, K.; Choi, S.; Kim, S.; Suh, K.J.; Lee, K.H.; Kim, S.; Im, S.A. Homologous repair deficiency score for identifying breast cancers with defective DNA damage response. Sci. Rep. 2020, 10, 12506. [Google Scholar] [CrossRef] [PubMed]


Disclaimer/Publisher’s Note: The statements, opinions and data contained in all publications are solely those of the individual author(s) and contributor(s) and not of MDPI and/or the editor(s). MDPI and/or the editor(s) disclaim responsibility for any injury to people or property resulting from any ideas, methods, instructions or products referred to in the content. |
© 2023 by the authors. Licensee MDPI, Basel, Switzerland. This article is an open access article distributed under the terms and conditions of the Creative Commons Attribution (CC BY) license (https://creativecommons.org/licenses/by/4.0/).
Share and Cite
Sahajpal, N.S.; Mondal, A.K.; Vashisht, A.; Singh, H.; Pang, A.W.C.; Saul, D.; Nivin, O.; Hilton, B.; DuPont, B.R.; Kota, V.; et al. Optical Genome Mapping: Integrating Structural Variations for Precise Homologous Recombination Deficiency Score Calculation. Genes 2023, 14, 1683. https://doi.org/10.3390/genes14091683
Sahajpal NS, Mondal AK, Vashisht A, Singh H, Pang AWC, Saul D, Nivin O, Hilton B, DuPont BR, Kota V, et al. Optical Genome Mapping: Integrating Structural Variations for Precise Homologous Recombination Deficiency Score Calculation. Genes. 2023; 14(9):1683. https://doi.org/10.3390/genes14091683
Chicago/Turabian StyleSahajpal, Nikhil Shri, Ashis K. Mondal, Ashutosh Vashisht, Harmanpreet Singh, Andy Wing Chun Pang, Daniel Saul, Omar Nivin, Benjamin Hilton, Barbara R. DuPont, Vamsi Kota, and et al. 2023. "Optical Genome Mapping: Integrating Structural Variations for Precise Homologous Recombination Deficiency Score Calculation" Genes 14, no. 9: 1683. https://doi.org/10.3390/genes14091683