Article

Transcriptomic Profiling of Meat Quality Traits of Skeletal Muscles of the Chinese Indigenous Huai Pig and Duroc Pig

1
College of Animal Science, Anhui Science and Technology University, Chuzhou 233100, China
2
Anhui Province Key Laboratory of Animal Nutritional Regulation and Health, Chuzhou 233100, China
3
Key Laboratory of Quality and Safety Control for Pork, Ministry of Agriculture and Rural, No. 9, Chuzhou 233100, China
*
Authors to whom correspondence should be addressed.
These authors contributed equally to this work.
Genes 2023, 14(8), 1548; https://doi.org/10.3390/genes14081548
Submission received: 28 June 2023 / Revised: 24 July 2023 / Accepted: 25 July 2023 / Published: 28 July 2023
(This article belongs to the Special Issue Advances in Pig Breeding and Genetics)

Abstract

:
The Huai pig is a well-known indigenous pig breed in China. The main advantages of Huai pigs over Western commercial pig breeds include a high intramuscular fat (IMF) content and good meat quality. There are significant differences in the meat quality traits of the same muscle part or different muscle parts of the same variety. To investigate the potential genetic mechanism underlying the meat quality differences in different pig breeds or muscle groups, longissimus dorsi (LD), psoas major (PM), and biceps femoris (BF) muscle tissues were collected from two pig breeds (Huai and Duroc). There were significant differences in meat quality traits and amino acid content. We assessed the muscle transcriptomic profiles using high-throughput RNA sequencing. The IMF content in the LD, PM, and BF muscles of Huai pigs was significantly higher than that in Duroc pigs (p < 0.05). Similarly, the content of flavor amino acids in the three muscle groups was significantly higher in Huai pigs than that in Duroc pigs (p < 0.05). We identified 175, 110, and 86 differentially expressed genes (DEGs) between the LD, PM, and BF muscles of the Huai and Duroc pigs, respectively. The DEGs of the different pig breeds and muscle regions were significantly enriched in the biological processes and signaling pathways related to muscle fiber type, IMF deposition, lipid metabolism, PPAR signaling, cAMP signaling, amino acid metabolism, and ECM–receptor interaction. Our findings might help improve pork yield by using the obtained DEGs for marker-assisted selection and providing a theoretical reference for evaluating and improving pork quality.

1. Introduction

Skeletal muscles are the main meat-producing tissue of pigs and have a unique cellular structure. Skeletal muscle fibers are the largest cells in mammals, accounting for 75–90% of the skeletal muscle tissue [1]. The number, size, and type of muscle fibers determine the basic characteristics of a muscle and its yield. Muscle fiber characteristics are closely related to pork meat color, pH, muscle tenderness, and intramuscular fat (IMF) content [2,3]. The IMF content affects muscle tenderness and flavor, with higher IMF content being associated with higher pork quality [4]. The type of muscle fiber is a key factor that affects pork quality. Muscle growth after birth mainly depends on the thickening and transformation of muscle fibers [5,6].
Pork quality is a quantitative trait controlled by micro-efficacious polygenes and belongs to the medium and high heritability traits that play a decisive role in varieties [7]. Meat quality traits differ significantly between breeds, especially between domestic and foreign breeds. Imported pig breeds, such as the Duroc, have a high growth rate, high glycolytic fiber content, and low IMF content [8]. Chinese indigenous pig breeds, such as the Huai, are characterized by high IMF content; high diameter of I, IIa, and IIb muscle fibers; and a high content of oxidized fibers [9,10]. Huang et al. [11] reported that Bama Xiang pigs have a high longissimus dorsi (LD) type I muscle fiber content, whereas Landrace pigs have a high glycolytic IIb muscle fiber content. Muscle fiber composition is a key factor causing differences in meat quality between Bama Xiang and Landrace pigs. The meat quality traits of different muscle groups within the same variety of pig are also significantly different. Moreover, the muscle fiber diameter and area of the LD muscle are significantly higher than those of the psoas major (PM) muscle [12,13]. Furthermore, the muscle fiber composition ratio of the same muscle group of the same variety or different muscle groups of the same variety affects pork meat quality. A better understanding of the genetic mechanisms underlying muscle fiber types is important for improving livestock and poultry meat quality.
Muscle growth is a complex physiological process, and a series of genes and other factors are important for accurately regulating it [14]. Transcriptomic studies using high-throughput sequencing technology have identified several transcription factors affecting pig muscle growth and gene regulatory networks regulating muscle production by comparing Chinese and foreign pig breeds. Xu et al. [15] compared the transcriptome data of the LD muscle of Yorkshire and Wei pigs, identified 717 differentially expressed genes (DEGs), and obtained four candidate genes related to fat metabolism (FABP3, PDK4, ACSL1, and UCP3). Shang et al. [16] conducted transcriptomic and proteomic sequencing on Tibetan, Wujin, and White pigs. They discovered that 20 genes related to muscle fiber formation, including CRYAB, FSCN1, and MAPK12, may play an important role in determining the postnatal growth rate of pigs. Zhao et al. [17] compared the LD muscles of Tongcheng and Yorkshire pig embryos from 30 days to 5 weeks after birth and discovered that DEGs regulating muscle development showed variety-specific differential expression patterns.
In this study, transcriptomic sequencing technology was used to analyze the meat quality traits of different muscle groups from Huai and Duroc pigs to further elucidate the differences in molecular regulatory mechanisms between breeds and muscle groups. Our data could provide an important reference for subsequent improvements in livestock and poultry meat quality as well as muscle production.

2. Materials and Methods

All experimental pigs were handled in strict accordance with the good animal practices of the People’s Republic of China Ethical Procedures and Guidelines for Animals and were approved by the Animal Management and Ethics Committee of Anhui University of Science and Technology (license number 2019-002).

2.1. Animal Sampling and Meat Composition Measurements

Huai and Duroc pigs were provided by the Anhui Haoxiang Agriculture and Animal Husbandry Co., Ltd., Bozhou, China. Notably, three healthy Huai and Duroc pigs were fed under the same conditions and slaughtered at 180 days of age. LD, PM, and biceps femoris (BF) muscle tissues between the left penultimate third and fourth ribs were collected. Some samples were used for determining meat quality traits. The remaining samples were frozen in liquid nitrogen immediately after being packaged in a freezing tube and then transferred to the laboratory for storage at −80 °C until used. The IMF content was measured using Soxhlet petroleum ether extraction [18].
The types and contents of amino acids in the LD, PM, and BF muscles of the Huai and Duroc pigs were determined according to a previously described method in Determination of Amino Acids in National Standard Food Safety (GB 5009.124-2016) [19].

2.2. Total RNA Extraction and Illumina Sequencing

Total RNA was extracted from muscle tissues using the TRIzol reagent (Thermo Fisher Scientific, Carlsbad, CA, USA). The concentration, purity, and integrity of total RNA were determined using a NanoDrop ND-2000 spectrophotometer (Thermo Fisher Scientific, Wilmington, DE, USA) and an Agilent Bioanalyzer 2100 (Agilent Technologies, Santa Clara, CA, USA), using the RNAClean XP Kit (Beckman Coulter, Inc., Kraemer Boulevard Brea, CA, USA) and the RNase-Free DNase Set (QIAGEN, GmBH, Frankfurt, Germany) for purification.
A transcriptome library was constructed by Shanghai Biotechnology Corporation (Shanghai, China). Referring to the NEBNext Ultra RNA Library Prep Kit for Illumina (New England Biolabs, Ipswich, MA, USA), the mRNA was purified by adsorption with Oligo (dT) magnetic beads, and fragmentation buffer was added to break the mRNA into short fragments. Subsequently, a cDNA strand was synthesized through reverse transcription using six-base random hexamers as a template, and a two-strand cDNA was synthesized by adding buffer, dNTPs, and DNA polymerase I. Thereafter, the double-stranded cDNA was purified using AMPure XP beads. The purified double-stranded cDNA was repaired at the end, and A as well as splice were added. AMPure XP beads were used for fragment size selection of double-stranded cDNA and PCR amplification was performed to construct cDNA library. Finally, all libraries were sequenced.
The raw data obtained were pretreated using Fastx, and low-quality reads, such as those with only 5′ and 3′ end joints, poly-N, or low overall quality, were removed to obtain clean reads. Using the Hisat2 (version 2.0.4) software [20], clean sequences were compared to the Sus scrofa reference genome (Sscrofa11.1) sequences to obtain the location information on the reference genome or gene to obtain mapped reads. Gene quantification of mapping results was performed using the StringTie (version:1.3.0) software [21]. The gene expression level is positively correlated with the abundance of transcripts, and the FPKM value is used in transcriptome sequencing to measure the expression level of each gene in the sample [18].
The DESeq software package in R was used for differential gene expression analyses. Significant DEGs are identified between any two groups based on the following thresholds: log2lfold-changel ≥ 1 and padj-value ≤ 0.05 (Benjamini and Hochberg methods) [22].

2.3. Functional Annotation

Gene Ontology (GO) and Kyoto Encyclopedia of Genes and Genomes (KEGG) analyses of DEGs were performed using the Bioconductor package clusterProfiler [23]. The obtained p values were adjusted according to Benjamini and Hochberg methods, and padj values ≤ 0.05 were considered significant.

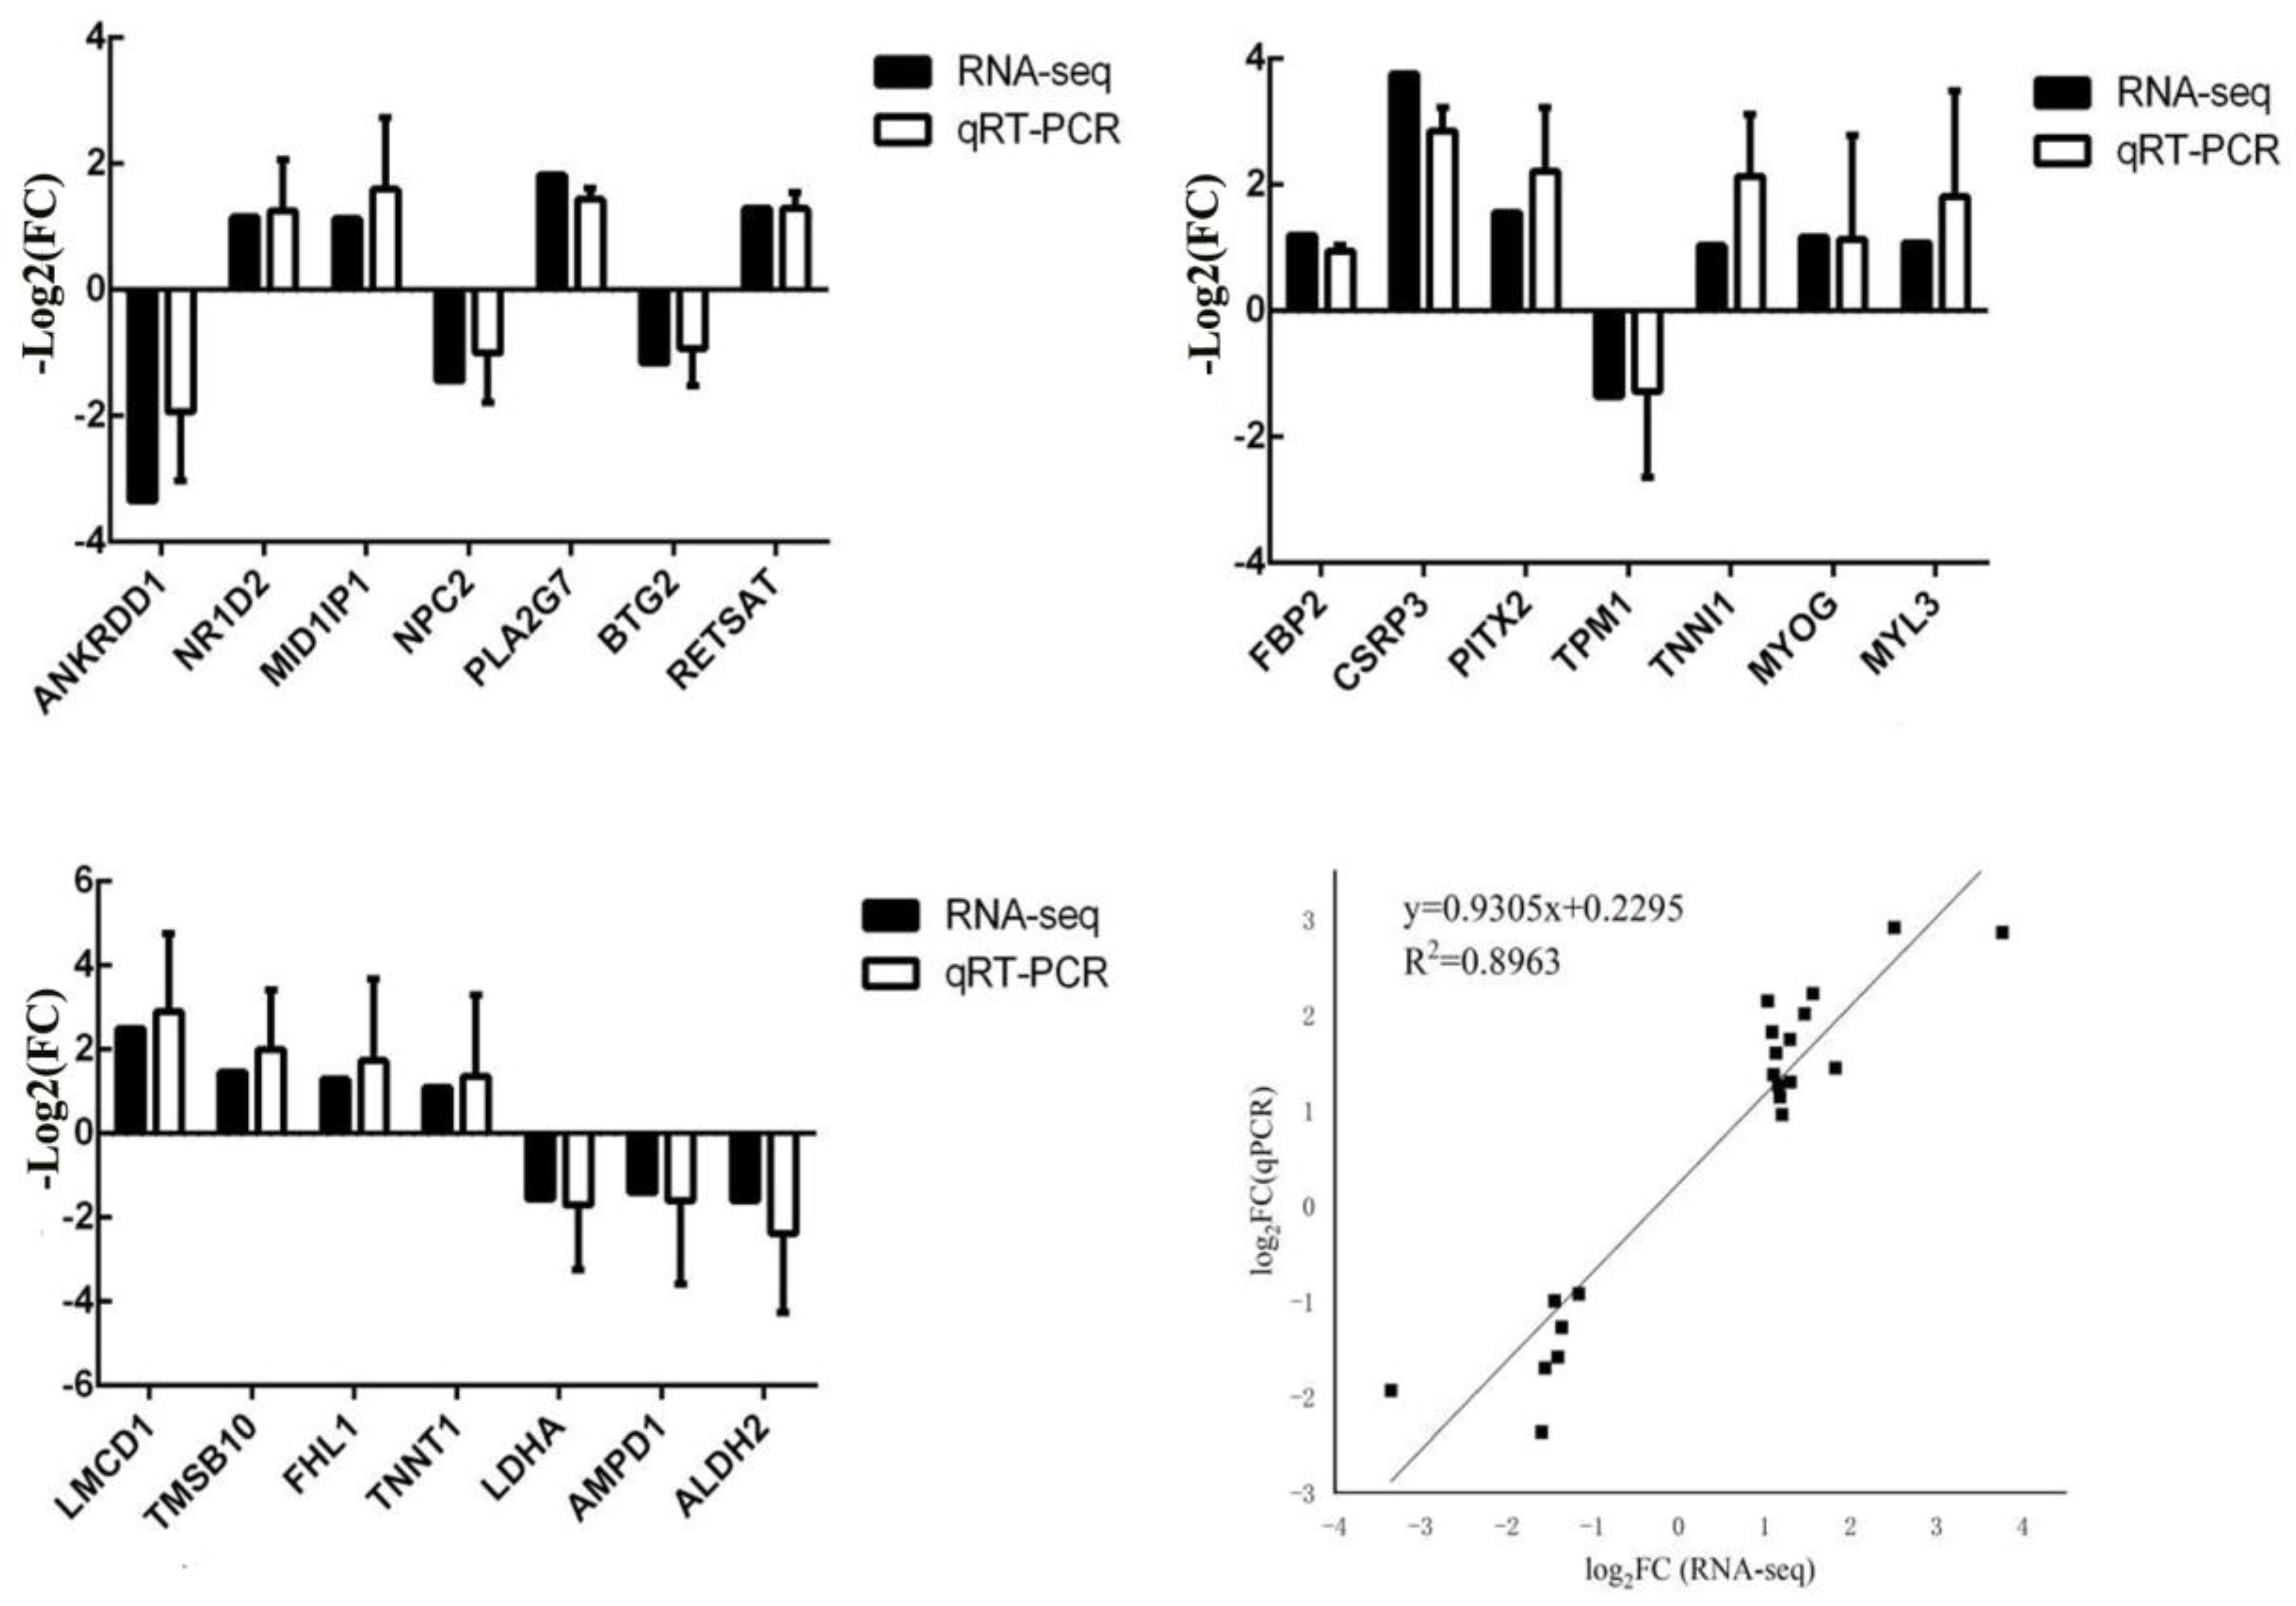
2.4. Real-Time Quantitative PCR

The differential expression patterns of genes detected in the transcriptome data were verified using RT-qPCR analyses. Notably, 21 DEGs were associated with muscle development.
Total RNA (50 µg) was extracted from LD, leg, and waist muscle tissue samples from different pig breeds using a TRIzol kit (Thermo Fisher, Shanghai, China). qPCR was performed on SYBR Green I-treated samples using Roche 96. Each qPCR assay was performed in a 20 µL volume consisting of 2 µL DNA template, 0.4 µL up- and downstream primers, 10 µL SYBR Premix Ex Taq II reverse transcriptase (Thermo Fisher, Shanghai, China), and 7.2 µL RNase-free ddH2O. The fluorescence quantitative results were calculated using the 2−ΔΔCt method, where ΔCt = Ct (target gene) − Ct (internal reference gene). Statistical analyses were performed using IBM SPASS 20.0 software, and the results are expressed as mean ± SD. The primer sequences are listed in Table S1. All samples were tested three times, and negative controls were set up for each test.

3. Results

3.1. Muscle Quality Analysis

The meat quality traits of the LD, PM, and BF muscles in the Huai and Duroc pigs were assessed. The a-value, hydraulic power, and elasticity of the LD, PM, and BF muscles of the Huai pigs were significantly higher than those of the Duroc pigs (p < 0.01). In contrast, the L-value, water loss, and cooking loss of the Huai pigs were significantly lower than those of the Duroc pigs (p < 0.01). The water content was significantly higher in Huai pigs than in Duroc pigs (p < 0.05). Furthermore, the IMF content in the LD and PM of Huai pigs was significantly higher than that in Duroc pigs (p < 0.01). The IMF of the BF in Huai pigs was significantly higher than that in Duroc pigs (p < 0.05) (Table 1, Table 2 and Table 3).

3.2. Amino Acid Composition and Content

The amino acid contents in the LD, PM, and BF muscles of Huai and Duroc pigs were measured. The levels of flavor amino acids (glutamic acid, aspartic acid, phenylalanine, alanine, glycine, and tyrosine) in the LD, PM, and BF muscles of Huai pigs were significantly higher than those in Duroc pigs (p < 0.05) (Table 4, Table 5 and Table 6).

3.3. Summary of RNA-Seq Results

Table 7 summarizes the RNA-seq results. The unique ratio following mapping to the reference genome (Sus scrofa, version 11.1) ranged between 84.19% and 87.77% with good alignment. Pearson’s correlation coefficient (R2) was used as an evaluation index for biological replicate correlation. The R2 for sample expression was 96.0% for HB1, HB2, and HB3; 93.0–96.0% for DLB1, DLB2, and DLB3; 95.0–96.0% for HY1, HY2, and HY3; 93.0–96.0% for DLY1, DLY2, and DLY3; 92.0–95.0% for HT1, HT2, and HT3; and 93.0–94.0% for DLT1, DLT2, and DLT3; thus confirming the robustness of the biological replicates and the reliability of the RNA-seq results (Figure 1).

3.4. Differential Expression Analysis

The edgeR [24] was used to identify DEGs. p < 0.05 and |log2FC| ≥ 1 were used as criteria to screen the DEGs between HB vs. DLB, HY vs. DLY, and HT vs. DLT. A total of 175, 110, and 86 DEGs were identified for the comparison between HB and DLB, HY and DLY, and HT and DLT, respectively. Of these DEGs, 76, 46, and 45 were upregulated and 99, 64, and 41 were downregulated, respectively (Figure 2a–d).
Venn diagram analysis of DEGs with an FPKM >1 was performed, and 9440 differentially co-expressed genes were screened from three different muscle tissues (HB vs. DLB, HY vs. DLY, and HT vs. DLT) of Huai and Duroc pigs. The resulting heatmap indicates that the three samples from different muscle tissues of Huai and Duroc pigs were in the same cluster. At least twice as many DEGs were observed in the different muscle tissues of Huai and Duroc pigs, which further confirmed the sampling accuracy and reliability in this study (Figure 3a–d).

3.5. Functional Enrichment Analysis

Functional enrichment analysis was performed for the three groups of DEGs screened using the GO database. The GO enrichment analysis was divided into three categories: biological processes, cellular components, and molecular functions. Figure 4 shows the 30 most significantly enriched GO terms for each group. For HB vs. DLB, 164 GO items were significantly enriched (p < 0.05), including “actomyosin”, “heat shock protein binding”, “steroid hormone-mediated signaling pathway”, and “regulation of lipid metabolic process” (Figure 4a). For HY vs. DLY, 107 GO items were significantly enriched (p < 0.05), including “regulation of calcium ion transport”, “steroid hormone-mediated signaling pathway”, “fat cell differentiation”, “G-protein coupled receptor binding”, and “muscle tissue development” (Figure 4b). For HT vs. DLT, 48 GO items were significantly enriched (p < 0.05), including “myofibril assembly”, “neuromuscular process”, “striated muscle cell development”, and “muscle cell development” (Figure 4c).
The KEGG analysis of the DEGs identified significantly enriched pathways at different developmental stages (Figure 5). For HB vs. DLB, 18 pathways were significantly enriched (p < 0.05), including the “glycine, serine, and threonine metabolism”, “arginine and proline metabolism”, and “ECM–receptor interaction” signaling pathways (Figure 5a). For HY vs. DLY, 23 pathways were significantly enriched (p < 0.05). These included the “alanine, aspartate, and glutamate metabolism”, “PPAR signaling pathway”, and “RIG-I-like receptor signaling pathway” signaling pathways (Figure 5b). For HT vs. DLT, 15 pathways were significantly enriched (p < 0.05), including the “hypertrophic cardiomyopathy (HCM)”, “cardiac muscle contraction”, and “TNF signaling” pathways (Figure 5c).

3.6. Validation of RNA-Seq Data Using qRT-PCR

DEGs were randomly selected, and qRT-PCR was used to verify the DEGs between the Huai and Duroc pigs. The qRT-PCR results were consistent with our RNA-seq data (Figure 6). The linear regression between DEGs data obtained from the qRT-PCR and RNA-seq results shows a high correlation (R2 = 0.8963), indicating the reliability of our RNA-seq results.

4. Discussion

Water and IMF, the most common traits of pork, contribute to pork juiciness, and the IMF content is highly correlated with flavor. The oxidized muscle fibers (MyHC I and MyHC Пa) had lower glycogen content, higher myoglobin and phospholipid content, and higher aerobic metabolic capacity than those of MyHC IIb. The metabolic activity and contractile characteristics of MyHC IIx were between those of the oxidized and glycolytic muscle fibers. In addition, the expression levels of MyHC I, MyHC IIa, and MyHC IIx were positively correlated with pH, flesh color, marblework, and IMF content, whereas MyHC IIb expression was inversely correlated with these parameters [25,26]. When the proportion of oxidized muscle fibers is high, the muscle fiber diameter is smaller, the flesh color and marbling scores are higher, the drip loss is reduced, and the IMF content as well as water retention are higher [27,28]. In this study, the L-value, drip loss, cooking loss, and hardness of the LD, PM, and BF muscles of the Huai pigs were shown to be significantly lower than those of the Duroc pigs (p < 0.05). In contrast, the hydraulic, elasticity, and IMF contents of the Huai pigs were significantly higher than those of the Duroc pigs (p < 0.05), which is consistent with results from previous studies [29,30]. Therefore, the meat quality of Huai pigs is better than that of Duroc pigs, and the different types of muscle fibers directly affect pork quality.
For same breed animals, the type of muscle fibers in different muscle groups also varies greatly. Most muscles are composed of both oxidized and glycolytic fibers. Deep muscles have a higher proportion of oxidized fibers than shallow muscles. The BF muscle is the largest muscle tissue, with a higher oxidation capacity and lower drip loss than the LD muscle. In addition, there are important differences in IMF content between the two muscles [31]. In pigs, the LD and BF are mainly composed of fast glycolytic fibers. The PM is mainly composed of rapidly oxidizing and intermediate fibers; therefore, the proportion of oxidized muscle fibers in the PM is significantly higher than that in the LD and BF muscles [32,33]. Furthermore, the IMF content in the PM is significantly higher than that in the LD and BF muscles. We also discovered that the IMF content of the PM muscle of Huai and Duroc pigs was significantly higher than that of the LD and BF muscles, respectively.
Proteins are synthesized from amino acids, and the category as well as content of amino acids directly affect the nutritional value and flavor of pig meat. Therefore, small amino acids are strongly related to the quality and flavor of pig meat. Flavor is a major determinant of meat quality and consumer purchasing decision. Amino acids that can present a special flavor are called flavor amino acids and include glutamic acid, aspartic acid, phenylalanine, alanine, glycine, and tyrosine. The content of these flavor amino acids has been suggested to be particularly important in the quality and taste of pork [34,35]. Glutamic acid forms umami, buffering acid, and base taste flavors and plays an important role in flavor amino acids [36]. Fatty acids, phospholipids, and flavor amino acids affect muscle flavor traits [37]. The content of flavor substances in oxidized muscle tissue is higher than that in glycolytic muscle tissue, which further confirms that muscles with a higher proportion of oxidized muscle fibers have a preferable flavor [38,39]. The content of flavor amino acids in the LD and BF muscles of the Huai pigs was significantly higher than that in the Duroc pigs (p < 0.05), which is consistent with previous results [19,40]. Therefore, the amino acid content might represent the main factor that causes differences in the flavor, odor, and meat quality between the Huai and Duroc pigs.
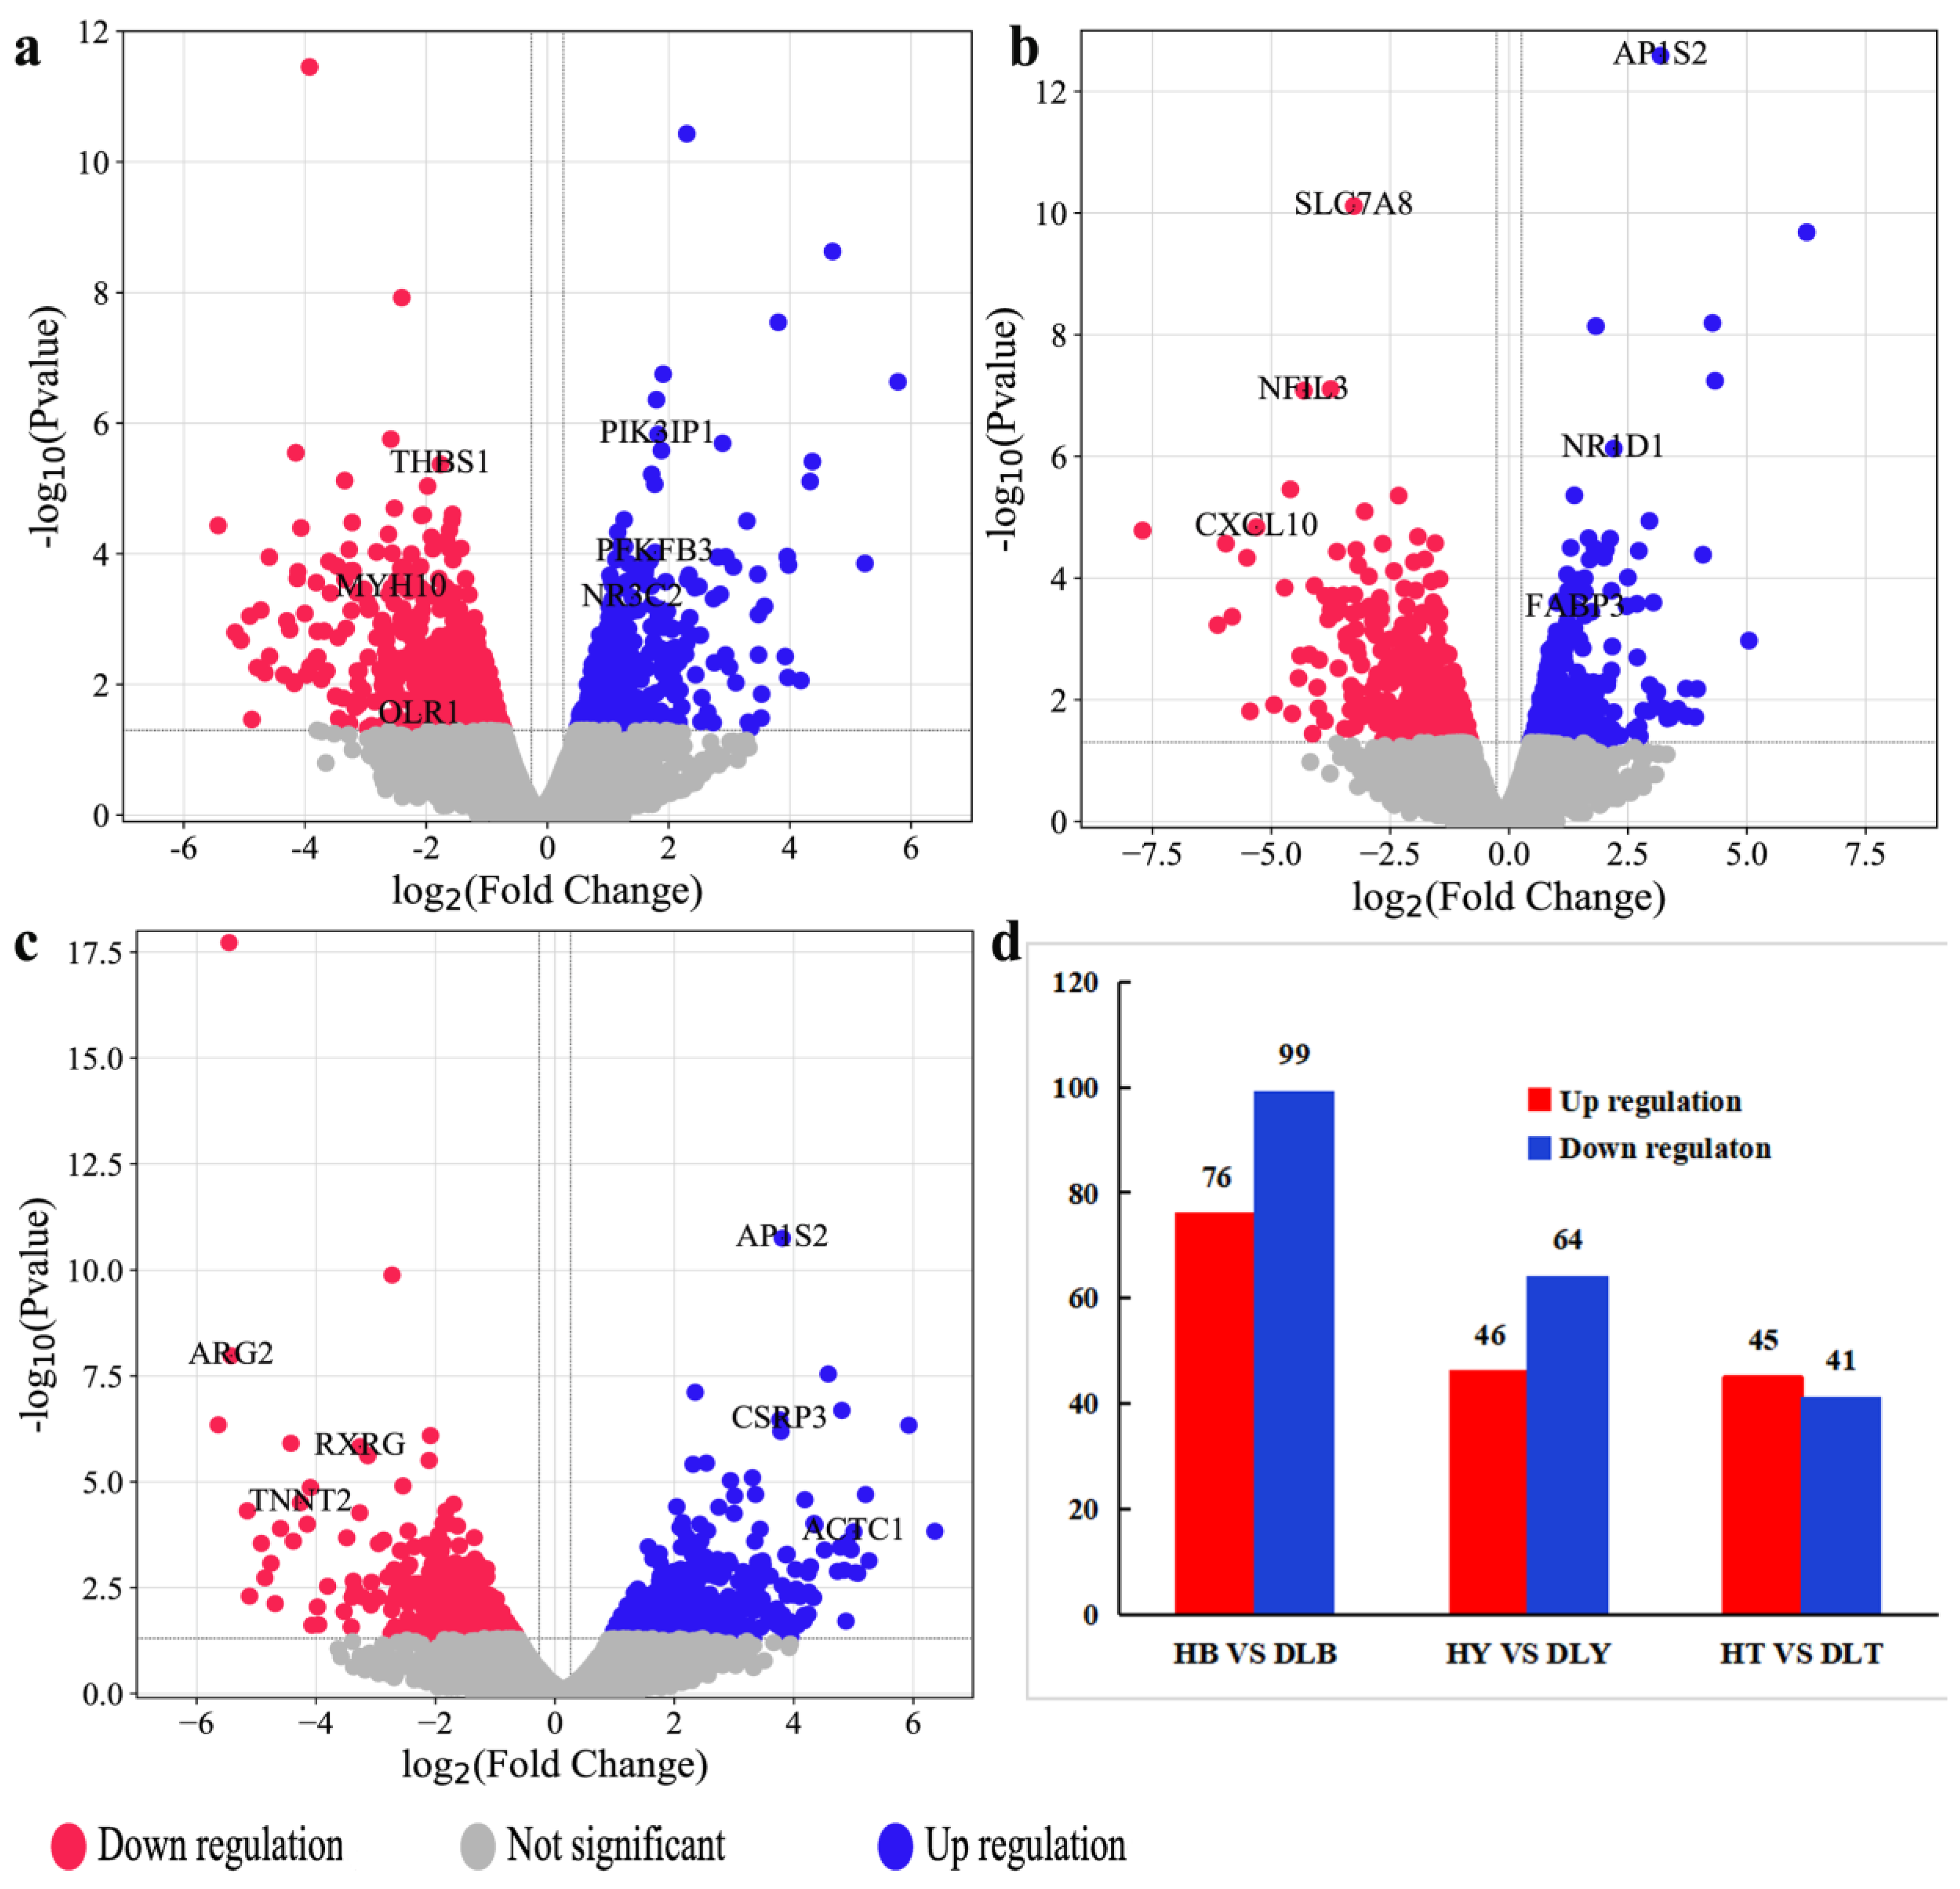
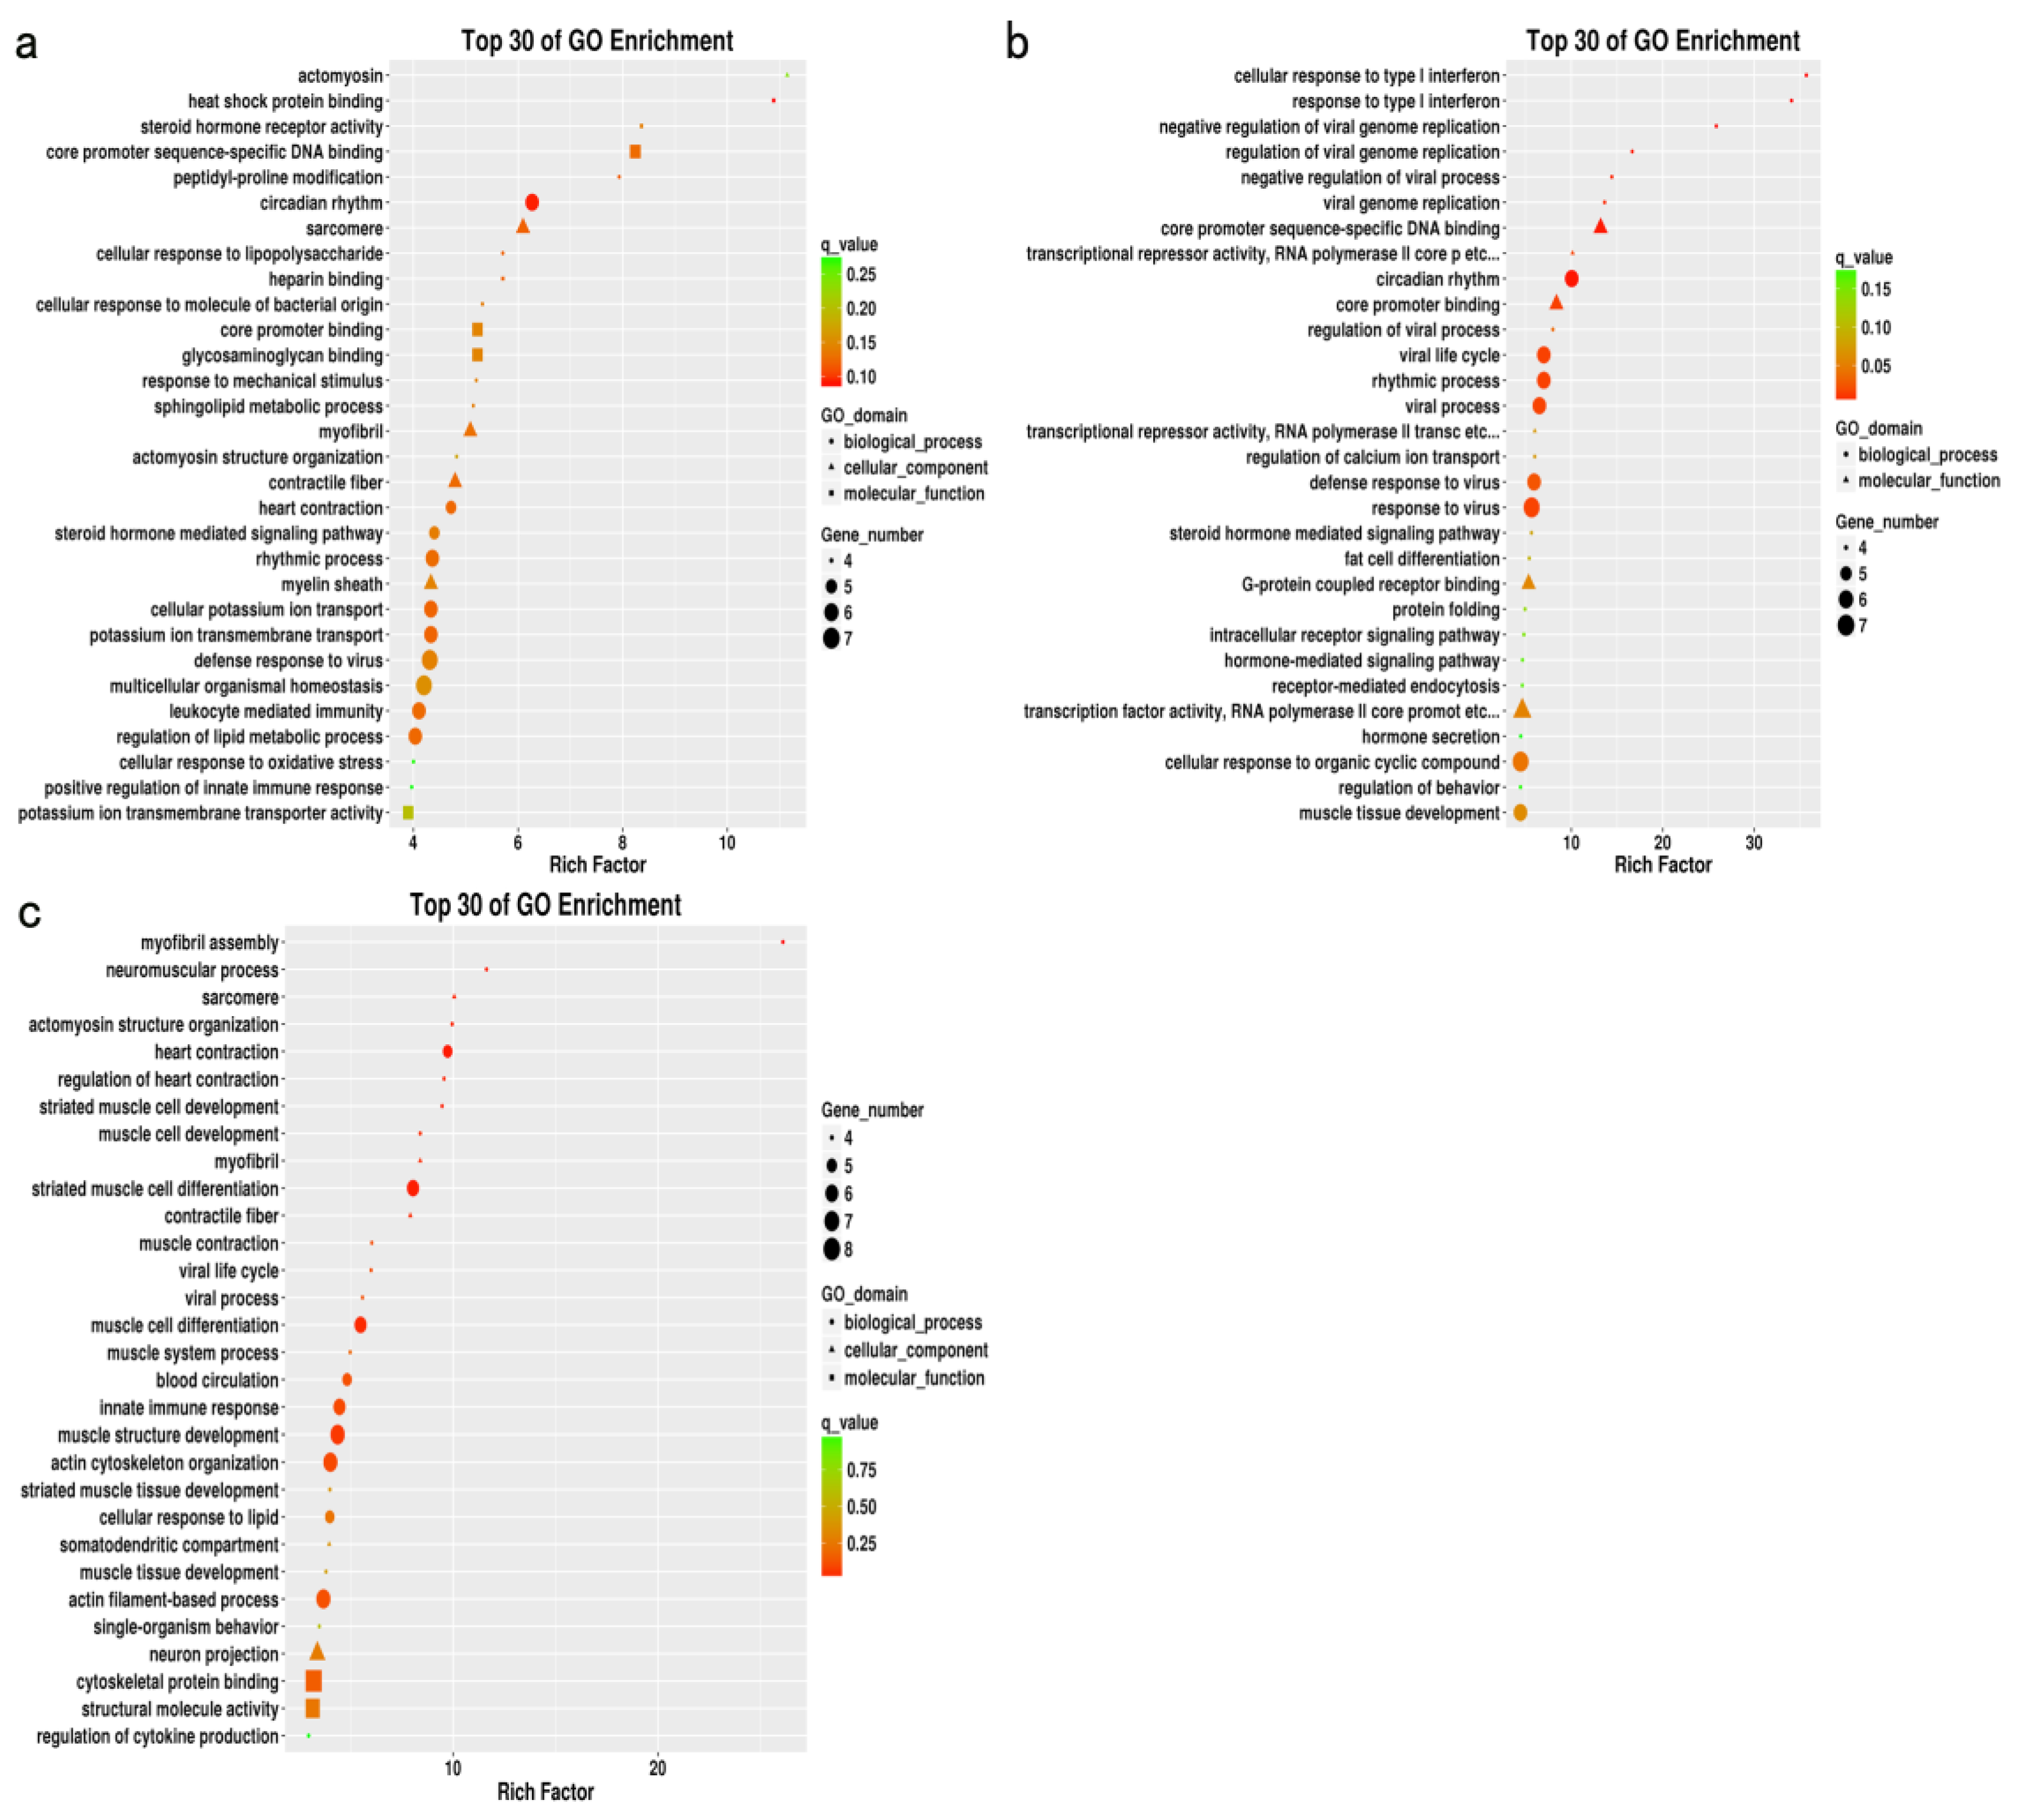
Animal muscle development is a complex process involving multiple coregulating genes and signaling pathways. GO enrichment analysis of the DEGs from different muscle groups of Huai and Duroc pigs revealed the biological processes closely related to muscle development, IMF, and lipid metabolism, including muscle tissue development, striated muscle cell differentiation, lipid metabolism regulation, and myofibril formation. Notably, seven DEGs (CSRP3, LMOD2, NR3C2, CXCL10, ACTC1, MYH10, and SPTLC3) related to meat quality, muscle development, and lipid metabolism were identified during these significantly enriched biological processes. Compared to the levels in Duroc pigs, CSRP3, LMOD2, and NR3C2 levels were significantly upregulated in the different muscle groups of the Huai pigs, whereas CXCL10, ACTC1, MYH10, and SPTLC3 levels were significantly downregulated. In addition, the expression levels of the same DEG differed across muscle groups within the same breed. CXCL10 and MYH10 are closely associated with muscle growth and development [41,42]. ACTC1 is a key gene involved in early myogenesis that also plays an important role in the growth and development of embryonic muscles; its low expression is conducive to muscle growth and development [43,44]. CSRP3 and LMOD2 play crucial roles in muscle fiber composition, can affect the distribution of muscle fiber types as well as meat quality, and have important positive regulatory effects [45,46]. SPTLC3 and NR3C2 play regulatory roles in lipid metabolism [47,48]. Our results showed that Huai pork was of higher quality than Duroc pork, based on six key regulatory genes identified to be related to pork quality traits and muscle development.
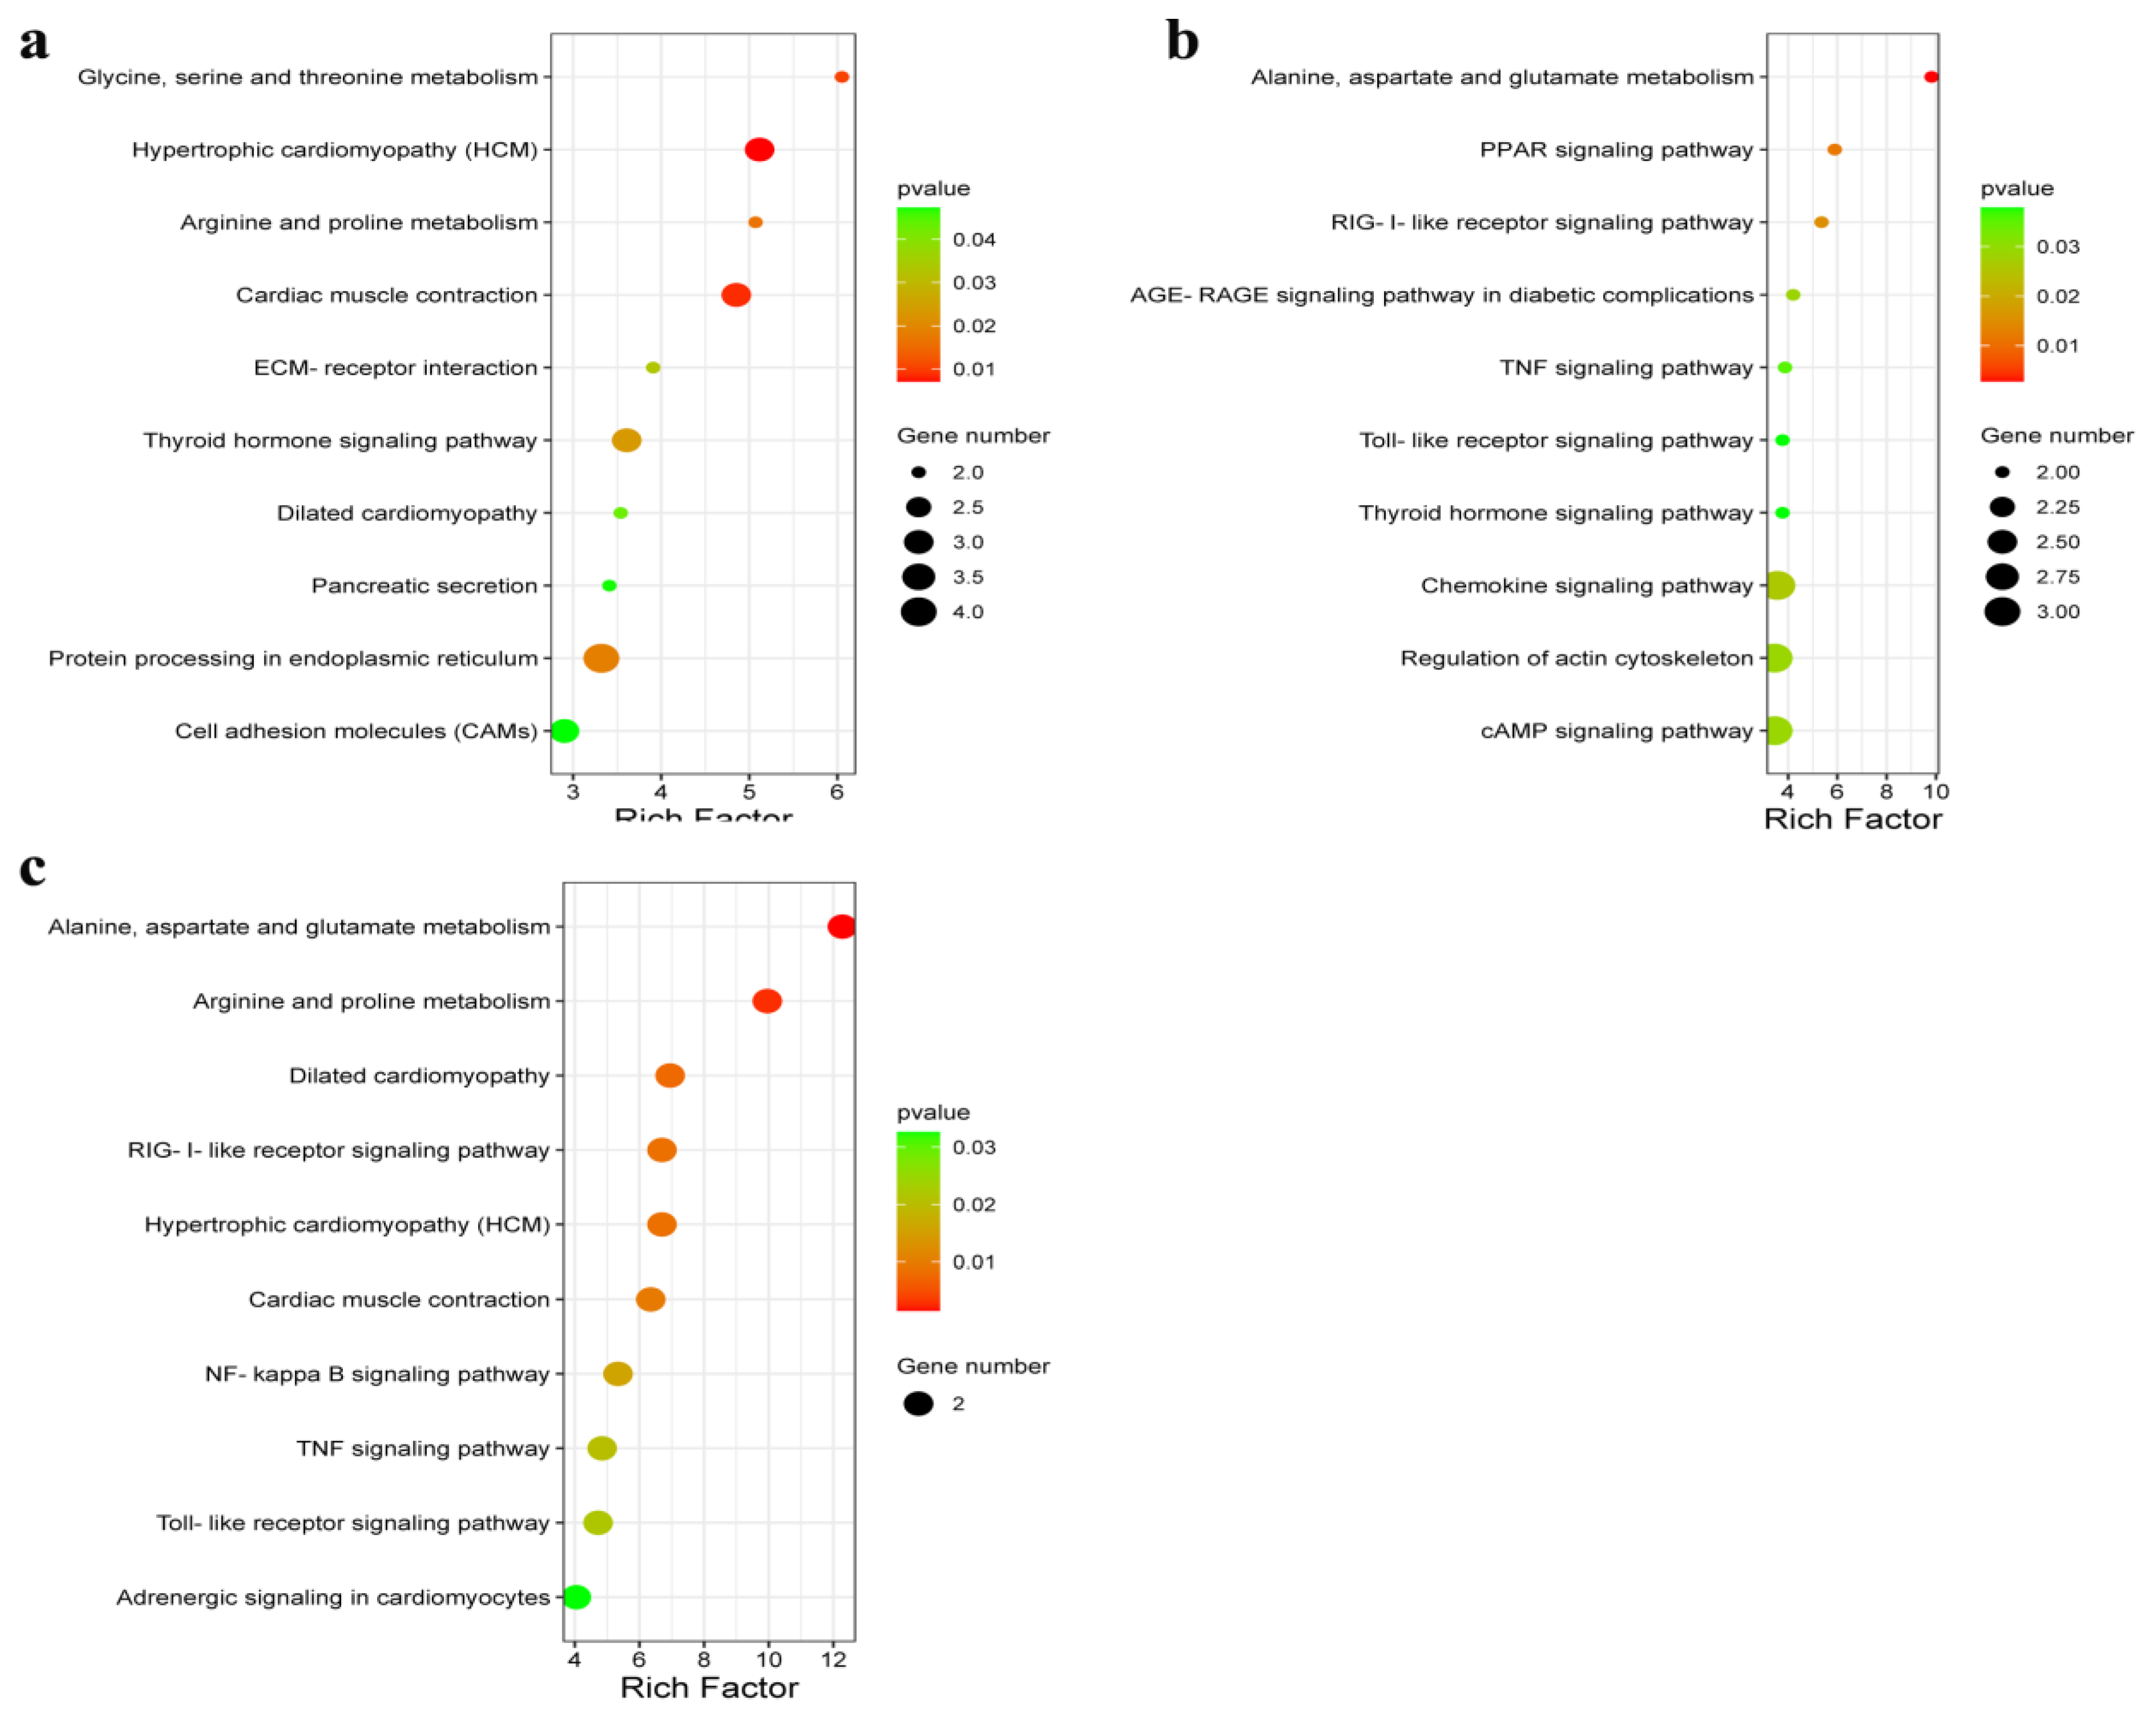
In this study, KEGG pathway analysis was used to assess the DEGs enriched in different muscle groups of Huai and Duroc pigs. The significantly enriched pathways were mainly associated with amino acid metabolism, PPAR signaling pathway, cAMP signaling pathway, and ECM–receptor interaction. The PPAR signaling pathway plays an important role in carbohydrate and lipid metabolism as well as muscle development and growth [49]. Alternatively, cAMP signaling promotes lipid metabolism and differentiation [50]. ECM–receptor interactions form a network with pathways related to lipid metabolism, thereby affecting IMF deposition [51,52]. In our analysis, Huai pigs exhibited higher expression levels of PIM1 and FABP3 and lower expression levels of OLR1, TNNT2, and THBS1 than those observed in Duroc pigs. PIM1 actively regulates myoblast function and skeletal muscle regeneration [53]. FABP3 and OLR1 play important roles in fat metabolism [54,55]. TNNT2 is positively correlated with IMF content [56]. THBS1 plays an important role in animal muscle growth and development [57]. These differences might have led to increased muscle mass in the Huai pigs compared to that observed in Duroc pigs.

5. Conclusions

Significant differences in meat quality and muscle fiber content were identified between different muscle groups of Huai and Duroc pigs. The proportion of oxidized muscle fibers in the different muscle groups of Huai pigs was significantly higher than that in Duroc pigs. The proportion of oxidized muscle fibers in the PM was significantly higher than that in the LD and BF muscles, whereas the IMF content in the PM was significantly higher than that in the LD and BF muscles. The differences in muscle fiber type and IMF content in muscles from Huai and Duroc pigs might impact meat quality traits, as reflected by the demand for different pork products and the need to improve pork yield.
In this study, the transcriptomes of LD, PM, and BF of Huai and Duroc pigs were comprehensively assessed. There were significant differences in meat quality, muscle fiber content, and IMF content between the two breeds. Several candidate genes (CSRP3, LMOD2, NR3C2, CXCL10, ACTC1, MYH10, SPTLC3) related to meat quality traits, muscle fibers, and IMF were identified. Our findings provide new insights into the regulatory mechanism of different meat quality traits associated with Huai and Duroc pigs and a theoretical reference for marker-assisted selection breeding based on DEGs to improve pork yield and quality in later stages.

Supplementary Materials

The following supporting information can be downloaded at: https://www.mdpi.com/article/10.3390/genes14081548/s1, Table S1: Primers used in qPCR for twenty-one genes. Table S2: Significant GO enrichment of the differentially expressed genes. Table S3: Significant KEGG terms of the differentially expressed genes.

Author Contributions

S.L., Y.G. (Youfang Gu) and X.L. made substantial contributions to the conception and design of the experiments and revised the manuscript. X.L., X.T., L.L. and R.L. made substantial contributions to the data analysis and interpretation and were involved in drafting the manuscript. Y.G. (Yafei Gao) and E.J. provided resources and helped with project administration. M.R. made substantial contributions to the writing—review and editing. All authors have read and agreed to the published version of the manuscript.

Funding

This work was funded by the key project of the Anhui Provincial Department of Education (KJ2021A0871), the National Natural Science Foundation of China (31672502), the talent introduction project of Anhui University of Science and Technology (DKYJ202105), and Major projects of natural science research in colleges and universities in Anhui Province (KJ2017ZD43).

Institutional Review Board Statement

Not applicable.

Informed Consent Statement

Not applicable.

Data Availability Statement

The original transcriptome sequencing data from the LD, BF, and PM muscles of Huai and Duroc pigs were uploaded to the NCBI database under the database entry number PRJNA962316.

Acknowledgments

We thank the personnel of the experimental farm and slaughterhouse. We thank the Shanghai Biotechnology Corporation for providing technical assistance for DEG and bioinformatics analyses.

Conflicts of Interest

The authors declare conflict of interest.

References

  1. Wang, T.; Xu, Y.Q.; Yuan, Y.X.; Xu, P.W.; Zhang, C.; Li, F.; Wang, L.-N.; Yin, C.; Zhang, L.; Cai, X.-C.; et al. Succinate induces skeletal muscle fiber remodeling via SUNCR1 signaling. EMBO Rep. 2019, 20, e47892. [Google Scholar] [CrossRef] [PubMed]
  2. Huang, C.; Zhong, L.; Zou, X.; Huang, Y.; Cai, L.; Ma, J. Evidence Against the Causal Relationship Between a Putative Cis-Regulatory Variant of MYH3 and Intramuscular Fat Content in Pigs. Front. Veter.-Sci. 2021, 8, 672852. [Google Scholar] [CrossRef] [PubMed]
  3. Lee, S.-H.; Kim, S.; Kim, J.-M. Genetic correlation between biopsied and post-mortem muscle fibre characteristics and meat quality traits in swine. Meat Sci. 2022, 186, 108735. [Google Scholar] [CrossRef] [PubMed]
  4. Miao, Z.; Wang, S.; Zhang, J.; Wei, P.; Guo, L.; Liu, D.; Wang, Y.; Shi, M. Identification and comparison of long non-conding RNA in Jinhua and Landrace pigs. Biochem. Biophys. Res. Commun. 2018, 506, 765–771. [Google Scholar] [CrossRef] [PubMed]
  5. Li, R.; Li, B.; Jiang, A.; Cao, Y.; Hou, L.; Zhang, Z.; Zhang, X.; Liu, H.; Kim, K.-H.; Wu, W. Exploring the lncRNAs Related to Skeletal Muscle Fiber Types and Meat Quality Traits in Pigs. Genes 2020, 11, 883. [Google Scholar] [CrossRef]
  6. Larson, L.; Lioy, J.; Johnson, J.; Medler, S. Transitional Hybrid Skeletal Muscle Fibers in Rat Soleus Development. J. Histochem. Cytochem. 2019, 67, 891–900. [Google Scholar] [CrossRef]
  7. Gao, G.; Gao, N.; Li, S.; Kuang, W.; Zhu, L.; Jiang, W.; Yu, W.; Guo, J.; Li, Z.; Yang, C.; et al. Genome-Wide Association Study of Meat Quality Traits in a Three-Way Crossbred Commercial Pig Population. Front. Genet. 2021, 12, 614087. [Google Scholar] [CrossRef]
  8. Madeira, M.; Lopes, P.; Costa, P.; Coelho, D.; Alfaia, C.; Prates, J. Reduced protein diets increase intramuscular fat of psoas major, a red muscle, in lean and fatty pig genotypes. Animal 2017, 11, 2094–2102. [Google Scholar] [CrossRef]
  9. Qiu, Y.-Q.; Yang, X.-F.; Ma, X.-Y.; Xiong, Y.-X.; Tian, Z.-M.; Fan, Q.-L.; Wang, L.; Jiang, Z.-Y. CIDE gene expression in adipose tissue, liver, and skeletal muscle from obese and lean pigs. J. Zhejiang Univ. Sci. B 2017, 18, 492–500. [Google Scholar] [CrossRef]
  10. Palma-Granados, P.; Haro, A.; Seiquer, I.; Lara, L.; Aguilera, J.F.; Nieto, R. Similar effects of lysine deficiency in muscle biochemical characteristics of fatty and lean piglets. J. Anim. Sci. 2017, 95, 3025–3036. [Google Scholar] [CrossRef] [Green Version]
  11. Huang, Y.N.; Ao, Q.W.; Jiang, Q.Y.; Guo, Y.F.; Lan, G.Q.; Jiang, H.S. Comparisons of different myosin heavy chain types, AMPK, and PGC-1α gene expression in the longissimus dorsi muscles in Bama Xiang and Landrace pigs. Genet. Mol. Res. 2016, 15, gmr.15028379. [Google Scholar] [CrossRef] [PubMed]
  12. Li, M.; Wu, H.; Luo, Z.; Xia, Y.; Guan, J.; Wang, T.; Gu, Y.; Chen, L.; Zhang, K.; Ma, J.; et al. An atlas of DNA methylomes in porcine adipose and muscle tissues. Nat. Commun. 2012, 3, 850. [Google Scholar] [CrossRef] [Green Version]
  13. Liu, Y.; Li, M.; Ma, J.; Zhang, J.; Zhou, C.; Wang, T.; Gao, X.; Li, X. Identification of differences in microRNA transcriptomes between porcine oxidative and glycolytic skeletal muscles. BMC Mol. Biol. 2013, 14, 7. [Google Scholar] [CrossRef] [PubMed] [Green Version]
  14. Hettmer, S.; Wagers, A.J. Muscling in: Uncovering the origins of rhabdomyosarcoma. Nat. Med. 2010, 16, 171–173. [Google Scholar] [CrossRef] [PubMed]
  15. Xu, J.; Wang, C.; Jin, E.; Gu, Y.; Li, S.; Li, Q. Identification of differentially expressed genes in longissimus dorsi muscle between Wei and Yorkshire pigs using RNA sequencing. Genes Genom. 2018, 40, 413–421. [Google Scholar] [CrossRef]
  16. Shang, P.; Wang, Z.; Chamba, Y.; Zhang, B.; Zhang, H.; Wu, C. A comparison of prenatal muscle transcriptome and proteome profiles between pigs with divergent growth phenotypes. J. Cell. Biochem. 2019, 120, 5277–5286. [Google Scholar] [CrossRef]
  17. Zhao, Y.; Li, J.; Liu, H.; Xi, Y.; Xue, M.; Liu, W.; Zhuang, Z.; Lei, M. Dynamic transcriptome profiles of skeletal muscle tissue across 11 developmental stages for both Tongcheng and Yorkshire pigs. BMC Genom. 2015, 16, 37. [Google Scholar] [CrossRef] [PubMed] [Green Version]
  18. Pertea, M.; Kim, D.; Pertea, G.M.; Leek, J.T.; Salzberg, S.L. Transcript-level expression analysis of RNA-seq experiments with HISAT, StringTie and Ballgown. Nat. Protoc. 2016, 11, 1650–1667. [Google Scholar] [CrossRef]
  19. Chen, Q.; Zhang, W.; Cai, J.; Ni, Y.; Xiao, L.; Zhang, J. Transcriptome analysis in comparing carcass and meat quality traits of Jiaxing Black Pig and Duroc × Duroc × Berkshire × Jiaxing Black Pig crosses. Gene 2022, 808, 145978. [Google Scholar] [CrossRef] [PubMed]
  20. Gerbens, F.; Verburg, F.J.; Van Moerkerk, H.T.B.; Engel, B.; Buist, W.; Veerkamp, J.H.; Pas, M.F.T. Associations of heart and adipocyte fatty acid-binding protein gene expression with intramuscular fat content in pigs. J. Anim. Sci. 2001, 79, 347–354. [Google Scholar] [CrossRef] [Green Version]
  21. Kim, D.; Langmead, B.; Salzberg, S.L. HISAT: A fast spliced aligner with low memory requirements. Nat. Methods 2015, 12, 357–360. [Google Scholar] [CrossRef] [Green Version]
  22. Robinson, M.D.; Oshlack, A. A scaling normalization method for differential expression analysis of RNA-seq data. Genome Biol. 2010, 11, R25. [Google Scholar] [CrossRef] [Green Version]
  23. Benjamini, Y.; Hochberg, Y. Controlling the False Discovery Rate: A Practical and Powerful Approach to Multiple Testing. J. R. Stat. Soc. Ser. B Methodol. 1995, 57, 289–300. [Google Scholar] [CrossRef]
  24. Yu, G.; Wang, L.-G.; Han, Y.; He, Q.-Y. clusterProfiler: An R Package for Comparing Biological Themes Among Gene Clusters. OMICS J. Integr. Biol. 2012, 16, 284–287. [Google Scholar] [CrossRef] [PubMed]
  25. Hausman, G.J.; Dodson, M.V.; Ajuwon, K.; Azain, M.; Barnes, K.M.; Guan, L.L.; Jiang, Z.; Poulos, S.P.; Sainz, R.D.; Smith, S.; et al. BOARD-INVITED REVIEW: The biology and regulation of preadipocytes and adipocytes in meat animals. J. Anim. Sci. 2009, 87, 1218–1246. [Google Scholar] [CrossRef] [PubMed] [Green Version]
  26. Joo, S.T.; Kim, G.D.; Hwang, Y.H.; Ryu, Y.C. Control of fresh meat quality through manipulation of muscle fiber characteristics. Meat Sci. 2013, 95, 828–836. [Google Scholar] [CrossRef]
  27. Schiaffino, S. Muscle fiber type diversity revealed by anti-myosin heavy chain antibodies. FEBS J. 2018, 285, 3688–3694. [Google Scholar] [CrossRef] [PubMed] [Green Version]
  28. Xu, D.; Wang, Y.; Jiao, N.; Qiu, K.; Zhang, X.; Wang, L.; Wang, L.; Yin, J. The coordination of dietary valine and isoleucine on water holding capacity, pH value and protein solubility of fresh meat in finishing pigs. Meat Sci. 2020, 163, 108074. [Google Scholar] [CrossRef]
  29. Guo, X.; Qin, B.; Yang, X.; Jia, J.; Niu, J.; Li, M.; Cai, C.; Zhao, Y.; Gao, P.; Du, M.; et al. Comparison of carcass traits, meat quality and expressions of MyHCs in muscles between Mashen and Large White pigs. Ital. J. Anim. Sci. 2019, 18, 1410–1418. [Google Scholar] [CrossRef] [Green Version]
  30. Wang, Y.; Thakali, K.; Morse, P.; Shelby, S.; Chen, J.; Apple, J.; Huang, Y. Comparison of Growth Performance and Meat Quality Traits of Commercial Cross-Bred Pigs Versus the Large Black Pig Breed. Animals 2021, 11, 200. [Google Scholar] [CrossRef]
  31. Lefaucheur, L.; Lebret, B.; Ecolan, P.; Louveau, I.; Damon, M.; Prunier, A.; Billon, Y.; Sellier, P.; Gilbert, H. Muscle characteristics and meat quality traits are affected by divergent selection on residual feed intake in pigs. J. Anim. Sci. 2011, 89, 996–1010. [Google Scholar] [CrossRef]
  32. Zhang, S.-H.; Zhu, L.; Wu, Z.-H.; Zhang, Y.; Tang, G.-Q.; Jiang, Y.-Z.; Li, M.-Z.; Bai, L.; Li, X.-W. Effect of muscle-fiber type on glycogenin-1 gene expression and its relationship with the glycolytic potential and pH of pork. Genet. Mol. Res. 2013, 12, 3383–3390. [Google Scholar] [CrossRef]
  33. Xu, Z.Y.; Yang, H.; Li, Y.; Xiong, Y.Z.; Zuo, B. Temporal expression of TnI fast and slow isoforms in biceps femoris and masseter muscle during pig growth. Animal 2010, 4, 1541–1546. [Google Scholar] [CrossRef] [PubMed]
  34. Kizawa, H.; Kou, I.; Iida, A.; Sudo, A.; Miyamoto, Y.; Fukuda, A.; Mabuchi, A.; Kotani, A.; Kawakami, A.; Yamamoto, S.; et al. An aspartic acid repeat polymorphism in asporin inhibits chondrogenesis and increases susceptibility to osteoarthritis. Nat. Genet. 2005, 37, 138–144. [Google Scholar] [CrossRef] [PubMed]
  35. Ruiz-Capillas, C.; Moral, A. Free amino acids in muscle of Norway lobster (Nephrops novergicus (L.)) in controlled and modified atmospheres during chilled storage. Food Chem. 2004, 86, 85–91. [Google Scholar] [CrossRef] [Green Version]
  36. Ramalingam, V.; Song, Z.; Hwang, I. The potential role of secondary metabolites in modulating the flavor and taste of the meat. Food Res. Int. 2019, 122, 174–182. [Google Scholar] [CrossRef] [PubMed]
  37. Khan, M.I.; Jo, C.; Tariq, M.R. Meat flavor precursors and factors influencing flavor precursors—A systematic review. Meat Sci. 2015, 110, 278–284. [Google Scholar] [CrossRef]
  38. Valin, C.; Touraille, C.; Vigneron, P.; Ashmore, C.R. Prediction of lamb meat quality traits based on muscle biopsy fibre typing. Meat Sci. 1982, 6, 257–263. [Google Scholar] [CrossRef] [PubMed]
  39. Cai, L.; Huang, Y.; Zhong, L.; Zou, X.; Ji, J.; Liu, X.; Huang, C.; Zeng, Q.; Yang, B.; Xiao, S.; et al. Using phenotypic and genotypic big data to investigate the effect of muscle fiber characteristics on meat quality and eating quality traits in pigs. Meat Sci. 2023, 198, 109122. [Google Scholar] [CrossRef] [PubMed]
  40. Liu, Y.; Yang, X.; Jing, X.; He, X.; Wang, L.; Liu, Y.; Liu, D. Transcriptomics Analysis on Excellent Meat Quality Traits of Skeletal Muscles of the Chinese Indigenous Min Pig Compared with the Large White Breed. Int. J. Mol. Sci. 2017, 19, 21. [Google Scholar] [CrossRef] [Green Version]
  41. Korbecki, J.; Kojder, K.; Kapczuk, P.; Kupnicka, P.; Gawrońska-Szklarz, B.; Gutowska, I.; Chlubek, D.; Baranowska-Bosiacka, I. The Effect of Hypoxia on the Expression of CXC Chemokines and CXC Chemokine Receptors—A Review of Literature. Int. J. Mol. Sci. 2021, 22, 843. [Google Scholar] [CrossRef] [PubMed]
  42. Kaewsatuan, P.; Poompramun, C.; Kubota, S.; Yongsawatdigul, J.; Molee, W.; Uimari, P.; Molee, A. Thigh muscle metabolic response is linked to feed efficiency and meat characteristics in slow-growing chicken. Poult. Sci. 2023, 102, 102741. [Google Scholar] [CrossRef] [PubMed]
  43. Boutilier, J.K.; Taylor, R.L.; Ram, R.; McNamara, E.; Nguyen, Q.; Goullée, H.; Chandler, D.; Mehta, M.; Balmer, L.; Laing, N.G.; et al. Variable cardiac α-actin (Actc1) expression in early adult skeletal muscle correlates with promoter methylation. Biochim. Biophys. Acta Gene Regul. Mech. 2017, 1860, 1025–1036. [Google Scholar] [CrossRef]
  44. Tsao, J.; Vernet, D.A.; Gelfand, R.; Kovanecz, I.; Nolazco, G.; Bruhn, K.W.; Gonzalez-Cadavid, N.F. Myostatin genetic inactivation inhibits myogenesis by muscle-derived stem cells in vitro but not when implanted in the mdx mouse muscle. Stem Cell Res. Ther. 2013, 4, 4. [Google Scholar] [CrossRef] [PubMed] [Green Version]
  45. Shan, Y.J.; Ji, G.G.; Zhang, M.; Liu, Y.F.; Tu, Y.J.; Ju, X.J.; Shu, J.T.; Zou, J.M. Use of transcriptome sequencing to explore the effect of CSRP3 on chicken myoblasts. J. Integr. Agric. 2023, 22, 1159–1171. [Google Scholar]
  46. Gokhin, D.S.; Fowler, V.M. Tropomodulin Capping of Actin Filaments in Striated Muscle Development and Physiology. J. Biomed. Biotechnol. 2011, 2011, 103069. [Google Scholar] [CrossRef] [Green Version]
  47. Faught, E.; Vijayan, M.M. The Mineralocorticoid Receptor Functions as a Key Glucose Regulator in the Skeletal Muscle of Zebrafish. Endocrinology 2022, 163, bqac149. [Google Scholar] [CrossRef]
  48. Kulus, M.; Borowiec, B.; Popis, M.; Celichowski, P.; Jeseta, M.; Bukowska, D.; Piotrowska-Kempisty, H.; Bruska, M.; Zabel, M.; Nowicki, M.; et al. Genes encoding proteins regulating fatty acid metabolism and cellular response to lipids are differentially expressed in porcine luminal epithelium during long-term culture. Med. J. Cell Biol. 2019, 7, 58–65. [Google Scholar] [CrossRef] [Green Version]
  49. Manickam, R.; Wahli, W. Roles of Peroxisome Proliferator-Activated Receptor β/δ in skeletal muscle physiology. Biochimie 2018, 136, 42–48. [Google Scholar] [CrossRef]
  50. Li, H.; Fong, C.; Chen, Y.; Cai, G.; Yang, M. Beta-adrenergic signals regulate adipogenesis of mouse mesenchymal stem cells via cAMP/PKA pathway. Mol. Cell. Endocrinol. 2010, 323, 201–207. [Google Scholar] [CrossRef]
  51. Li, D.; Li, F.; Jiang, K.; Zhang, M.; Han, R.; Jiang, R.; Li, Z.; Tian, Y.; Yan, F.; Kang, X.; et al. Integrative analysis of long noncoding RNA and mRNA reveals candidate lncRNAs responsible for meat quality at different physiological stages in Gushi chicken. PLoS ONE 2019, 14, e0215006. [Google Scholar] [CrossRef] [Green Version]
  52. Cui, H.X.; Liu, R.R.; Zhao, G.P.; Zheng, M.Q.; Chen, J.L.; Wen, J. Identification of differentially expressed genes and pathways for in-tramuscular fat deposition in pectoralis major tissues of fast-and slow-growing chickens. BMC Genom. 2012, 13, 213. [Google Scholar] [CrossRef] [Green Version]
  53. Liu, Y.; Shang, Y.; Yan, Z.; Li, H.; Wang, Z.; Liu, Z.; Li, Z. Pim1 kinase positively regulates myoblast behaviors and skeletal muscle regeneration. Cell Death Dis. 2019, 10, 773. [Google Scholar] [CrossRef] [PubMed] [Green Version]
  54. Li, B.; Qiao, L.; An, L.; Wang, W.; Liu, J.; Ren, Y.; Pan, Y.; Jing, J.; Liu, W. Transcriptome analysis of adipose tissues from two fat-tailed sheep breeds reveals key genes involved in fat deposition. BMC Genom. 2018, 19, 338. [Google Scholar] [CrossRef]
  55. Ge, W.; Zhang, W.; Zhang, Y.; Zheng, Y.; Li, F.; Wang, S.; Liu, J.; Tan, S.; Yan, Z.; Wang, L.; et al. A Single-cell Transcriptome Atlas of Cashmere Goat Hair Follicle Morphogenesis. Genom. Proteom. Bioinform. 2021, 19, 437–451. [Google Scholar] [CrossRef] [PubMed]
  56. Ropka-Molik, K.; Bereta, A.; Żukowski, K.; Tyra, M.; Piórkowska, K.; Żak, G.; Oczkowicz, M. Screening for candidate genes related with histological microstructure, meat quality and carcass characteristic in pig based on RNA-seq data. Asian-Australas J. Anim. Sci. 2018, 31, 1565–1574. [Google Scholar] [CrossRef]
  57. Wang, S.; Yi, X.; Wu, M.; Zhao, H.; Liu, S.; Pan, Y.; Li, Q.; Tang, X.; Zhu, Y.; Sun, X. Detection of key gene InDels in TGF-β pathway and its relationship with growth traits in four sheep breeds. Anim. Biotechnol. 2020, 32, 194–204. [Google Scholar] [CrossRef]
Figure 1. Heatmap of gene expression correlation.
Genes 14 01548 g001
Figure 2. Volcano scatterplot and the number of DEGs. (a) Volcano scatterplot of HB vs. DLB. (b) Volcano scatterplot of HY vs. DLY. (c) Volcano scatterplot of HT vs. DLT. (d) Number of DEGs between HB vs. DLB, HY vs. DLY, and HT vs. DLT.
Genes 14 01548 g002
Figure 3. Heatmaps of DEG expression levels among the three comparison groups, representing three biological replicates. (a) HB vs. DLB. (b) HY vs. DLY. (c) HT vs. DLT. (d) Venn diagram of differential genes with an FPKM > 1.
Genes 14 01548 g003
Figure 4. GO enrichment map of DEGs between HB vs. DLB, HY vs. DLY, and HT vs. DLT. (a) HB vs. DLB. (b) HY vs. DLY. (c) HT vs. DLT.
Genes 14 01548 g004
Figure 5. KEGG enrichment map of DEGs between HB vs. DLB, HY vs. DLY, and HT vs. DLT. (a) HB vs. DLB. (b) HY vs. DLY. (c) HT vs. DLT.
Genes 14 01548 g005
Figure 6. qPCR verification results of DEGs in different muscle tissues of different pig breeds.
Genes 14 01548 g006
Table 1. Comparison of muscle mass traits of LD muscle.
ItemHuai PigDuroc Pigs
pH45min6.20 ± 0.216.36 ± 0.31
L*39.04 ± 0.40 A41.70 ± 2.12 B
a*10.15 ± 0.50 A8.35 ± 1.39 B
b*2.43 ± 0.182.72 ± 0.61
Water-holding capacity (%)52.96 ± 1.34 A43.80 ± 2.44 B
Water content (%)73.81 ± 0.55 a72.26 ± 0.20 b
IMF (%)4.50 ± 0.13 A2.90 ± 0.07 B
Drip loss (%)1.44 ± 0.12 A2.01 ± 0.20 B
Cooking loss (%)54.12 ± 1.07 A59.39 ± 1.08 B
Hardness (g)505.67 ± 39.20 a585.14 ± 28.40 b
Elasticity (mm)5.60 ± 0.27 A3.12 ± 0.36 B
Note: different lowercase letters (a/b) indicate significant differences (p < 0.05), whereas different uppercase letters (A/B) indicate p < 0.01.
Table 2. Comparison of muscle mass traits of PM muscle.
ItemHuai PigDuroc Pigs
pH45min6.02 ± 0.075.91 ± 0.13
L*39.48 ± 0.92 A42.86 ± 0.93 B
a*14.83 ± 1.01 a13.48 ± 1.30 b
b*2.81 ± 0.443.27 ± 0.75
Water-holding capacity (%)50.36 ± 2.35 A41.01 ± 1.56 B
Water content (%)75.64 ± 0.3675.47 ± 0.30
IMF (%)2.35 ± 0.06 A1.68 ± 0.21 B
Drip loss (%)2.05 ± 0.18 A2.61 ± 0.17 B
Cooking loss (%)55.9 ± 0.63 A58.48 ± 0.85 B
Hardness (g)435.78 ± 35.01 A547.50 ± 26.99 B
Elasticity (mm)5.69 ± 0.18 A4.54 ± 0.32 B
Note: different lowercase letters (a/b) indicate significant differences (p < 0.05), whereas different uppercase letters (A/B) indicate p < 0.01.
Table 3. Comparison of muscle mass traits of BF muscle.
ItemHuai PigDuroc Pigs
pH45min6.40 ± 0.196.65 ± 0.25
L*38.19 ± 0.67 A42.94 ± 1.81 B
a*14.95 ± 0.91 A8.62 ± 0.89 B
b*2.52 ± 0.082.77 ± 0.28
Water-holding capacity (%)55.46 ± 1.99 A51.26 ± 5.23 B
Water content (%)74.76 ± 0.61 a73.09 ± 1.49 b
IMF (%)1.94 ± 0.01 a1.83 ± 0.29 b
Drip loss (%)2.79 ± 0.32 A3.08 ± 0.28 B
Cooking loss (%)57.49 ± 2.20 A59.53 ± 2.61 B
Hardness (g)681.11 ± 27.10 A936.56 ± 28.63 B
Elasticity (mm)6.98 ± 0.32 A3.37 ± 0.21 B
Note: different lowercase letters (a/b) indicate significant differences (p < 0.05), whereas different uppercase letters (A/B) indicate p < 0.01.
Table 4. Amino acid composition and content of LD muscle.
Amino AcidHuai PigDuroc Pigs
Valine (Val)1.19 ± 0.081.12 ± 0.03
Isoleucine (Ile)1.08 ± 0.061.04 ± 0.03
Leucine (Leu)2.02 ± 0.121.92 ± 0.03
Phenylalanine (Phe*)0.88 ± 0.050.86 ± 0.02
Threonine (Thr)1.13 ± 0.011.12 ± 0.04
Lysine (Lys)2.28 ± 0.122.11 ± 0.06
Methionine (Met)0.55 ± 0.010.60 ± 0.03
Aspartic acid (Asn*)2.46 ± 0.062.27 ± 0.05
Glutamic acid (Glu*)4.26 ± 0.054.08 ± 0.10
Proline (Pro)0.78 ± 0.020.74 ± 0.02
Glycine (Gly*)1.04 ± 0.080.99 ± 0.04
Alanine (Ala*)1.34 ± 0.131.27 ± 0.03
Serine (Ser)1.06 ± 0.081.01 ± 0.04
Tyrosine (Tyr*)0.88 ± 0.030.79 ± 0.01
Histidine (His)1.23 ± 0.101.15 ± 0.04
Arginine (Arg)1.56 ± 0.041.45 ± 0.03
Delicious amino acids12.67 ± 0.30 a12.04 ± 0.23 b
TAA∑24.64 ± 0.8223.38 ± 0.38
EAA∑9.14 ± 0.43 a8.78 ± 0.20 b
NEAA∑14.62 ± 0.34 a13.75 ± 0.18 b
Note: Different lowercase letters indicate significant differences (p < 0.05). EAA = essential amino acid; EAA Σ = Thr + Val + Met + Ile + Leu; DAA = delicious amino acid; DAA Σ = Asn + Glu + Phe + Gly + Ala + Tyr; NEAA = nonessential amino acid; NEAA Σ = Asp + Cys + Tyr, TAA = total amino acid.
Table 5. Amino acid composition and content of PF muscle.
Amino AcidHuai PigDuroc Pigs
Valine (Val)0.99 ± 0.051.04 ± 0.11
Isoleucine (Ile)0.89 ± 0.051.01 ± 0.05
Leucine (Leu)1.67 ± 0.041.77 ± 0.02
Phenylalanine (Phe*)0.74 ± 0.050.81 ± 0.08
Threonine (Thr)0.97 ± 0.041.04 ± 0.10
Lysine (Lys)1.91 ± 0.062.03 ± 0.16
Methionine (Met)0.49 ± 0.030.50 ± 0.03
Aspartic acid (Asn*)2.19 ± 0.162.05 ± 0.17
Glutamic acid (Glu*)3.82 ± 0.203.71 ± 0.05
Proline (Pro)0.75 ± 0.010.71 ± 0.02
Glycine (Gly*)0.91 ± 0.040.87 ± 0.07
Alanine (Ala*)1.14 ± 0.101.24 ± 0.20
Serine (Ser)0.88 ± 0.060.92 ± 0.11
Tyrosine (Tyr*)0.79 ± 0.060.76 ± 0.09
Histidine (His)0.97 ± 0.010.95 ± 0.06
Arginine (Arg)1.30 ± 0.081.43 ± 0.08
Delicious amino acids11.20 ± 0.19 a11.07 ± 0.62 b
TAA∑21.12 ± 0.5421.65 ± 1.22
EAA∑7.65 ± 0.308.20 ± 0.48
NEAA∑12.73 ± 0.2112.65 ± 0.66
Note: Different lowercase letters indicate significant differences (p < 0.05). EAA = essential amino acid; EAA Σ = Thr + Val + Met + Ile + Leu; DAA = delicious amino acid; DAA Σ = Asn + Glu + Phe + Gly + Ala + Tyr; NEAA = non-essential amino acid; NEAA Σ = Asp + Cys + Tyr, TAA = total amino acid.
Table 6. Amino acid composition and content of BM muscle.
Amino AcidHuai PigDuroc Pigs
Valine (Val)1.09 ± 0.081.06 ± 0.05
Isoleucine (Ile)0.98 ± 0.070.96 ± 0.05
Leucine (Leu)1.89 ± 0.021.85 ± 0.05
Phenylalanine (Phe*)0.84 ± 0.010.83 ± 0.01
Threonine (Thr)1.03 ± 0.081.06 ± 0.06
Lysine (Lys)2.07 ± 0.132.10 ± 0.05
Methionine (Met)0.59 ± 0.010.53 ± 0.02
Aspartic acid (Asn*)2.17 ± 0.461.95 ± 0.03
Glutamic acid (Glu*)4.03 ± 0.063.82 ± 0.04
Proline (Pro)0.76 ± 0.020.73 ± 0.01
Glycine (Gly*)0.95 ± 0.080.95 ± 0.01
Alanine (Ala*)1.34 ± 0.091.36 ± 0.12
Serine (Ser)0.99 ± 0.040.95 ± 0.05
Tyrosine (Tyr*)0.84 ± 0.020.74 ± 0.02
Histidine (His)1.18 ± 0.061.07 ± 0.13
Arginine (Arg)1.48 ± 0.051.42 ± 0.03
Delicious amino acids11.91 ± 0.18 a11.33 ± 0.14 b
TAA∑23.08 ± 0.5222.22 ± 0.45
EAA∑8.50 ± 0.398.40 ± 0.24
NEAA∑13.74 ± 0.2112.99 ± 0.24
Note: Different lowercase letters indicate significant differences (p < 0.05). EAA = essential amino acid; EAA Σ = Thr + Val + Met + Ile + Leu; DAA = delicious amino acid; DAA Σ = Asn + Glu + Phe + Gly + Ala + Tyr; NEAA = non-essential amino acid; NEAA Σ = Asp + Cys + Tyr, TAA = total amino acid.
Table 7. Summary statistics of the transcriptome.
Sample IDRaw ReadsClean ReadsClean RatioMapped ReadsUnique ReadsMapping Ratio
DLB141,662,90439,449,66494.69%32,,011,83131,699,87184.95%
DLB242,641,20840,724,09195.50%33,460,37933,143,64785.18%
DLB342,844,54840,865,65495.38%33,834,88033,551,31785.86%
DLT136,166,73034,115,83294.33%28,102,26927,842,62385.83%
DLT232,862,88030,900,71594.03%24,659,63424,370,83483.99%
DLT336,499,68434,467,15094.43%28,158,23527,911,41085.56%
DLY136,215,30634,496,88895.25%29,185,71628,958,24087.77%
DLY238,278,30236,163,12194.47%29,563,66029,269,44485.66%
DLY336,475,65434,576,21594.79%28,678,60728,433,86586.61%
HB132,091,12830,439,45394.85%24,749,00224,478,81384.81%
HB235,156,42433,446,96895.14%27,313,80527,025,33884.94%
HB338,263,95636,283,05394.82%29,247,88528,907,20284.19%
HT133,392,59031,752,95395.09%26,483,90826,236,79686.58%
HT237,773,53035,619,38294.30%29,582,33029,326,57486.66%
HT342,016,92439,639,58594.34%32,957,63232,665,89786.88%
HY140,655,38038,870,21395.61%32,297,75331,987,25285.97%
HY237,437,22835,804,11695.64%29,364,52429,045,35484.97%
HY338,432,31636,425,62994.78%29,474,70929,134,61384.46%
Disclaimer/Publisher’s Note: The statements, opinions and data contained in all publications are solely those of the individual author(s) and contributor(s) and not of MDPI and/or the editor(s). MDPI and/or the editor(s) disclaim responsibility for any injury to people or property resulting from any ideas, methods, instructions or products referred to in the content.

