
The Genetic Cross-Talk between Periodontitis and Chronic Kidney Failure Revealed by Transcriptomic Analysis
 , ,
, ,
Abstract
:1. Introduction
2. Materials and Methods
2.1. Datasets
2.2. Data Pre-Processing
2.3. Genes Differentially Expressed in PD (DEGs)
2.4. Cross-Talk Genes for PD and CKF
2.5. Cross-Talk Gene PPI Network Analysis
2.6. GSVA (Gene Set Variation Analysis) Analysis
2.7. Consensus Cluster Plus Analysis
2.8. Screening of Hub Cross-Talk Gene
2.9. Prediction of Cluster Risk Based on Hub Cross-Talk Genes
2.10. Hub Cross-Talk Gene in-Depth Analysis
2.11. Hub Cross-Talk Gene PPI and Pathway Network
3. Results
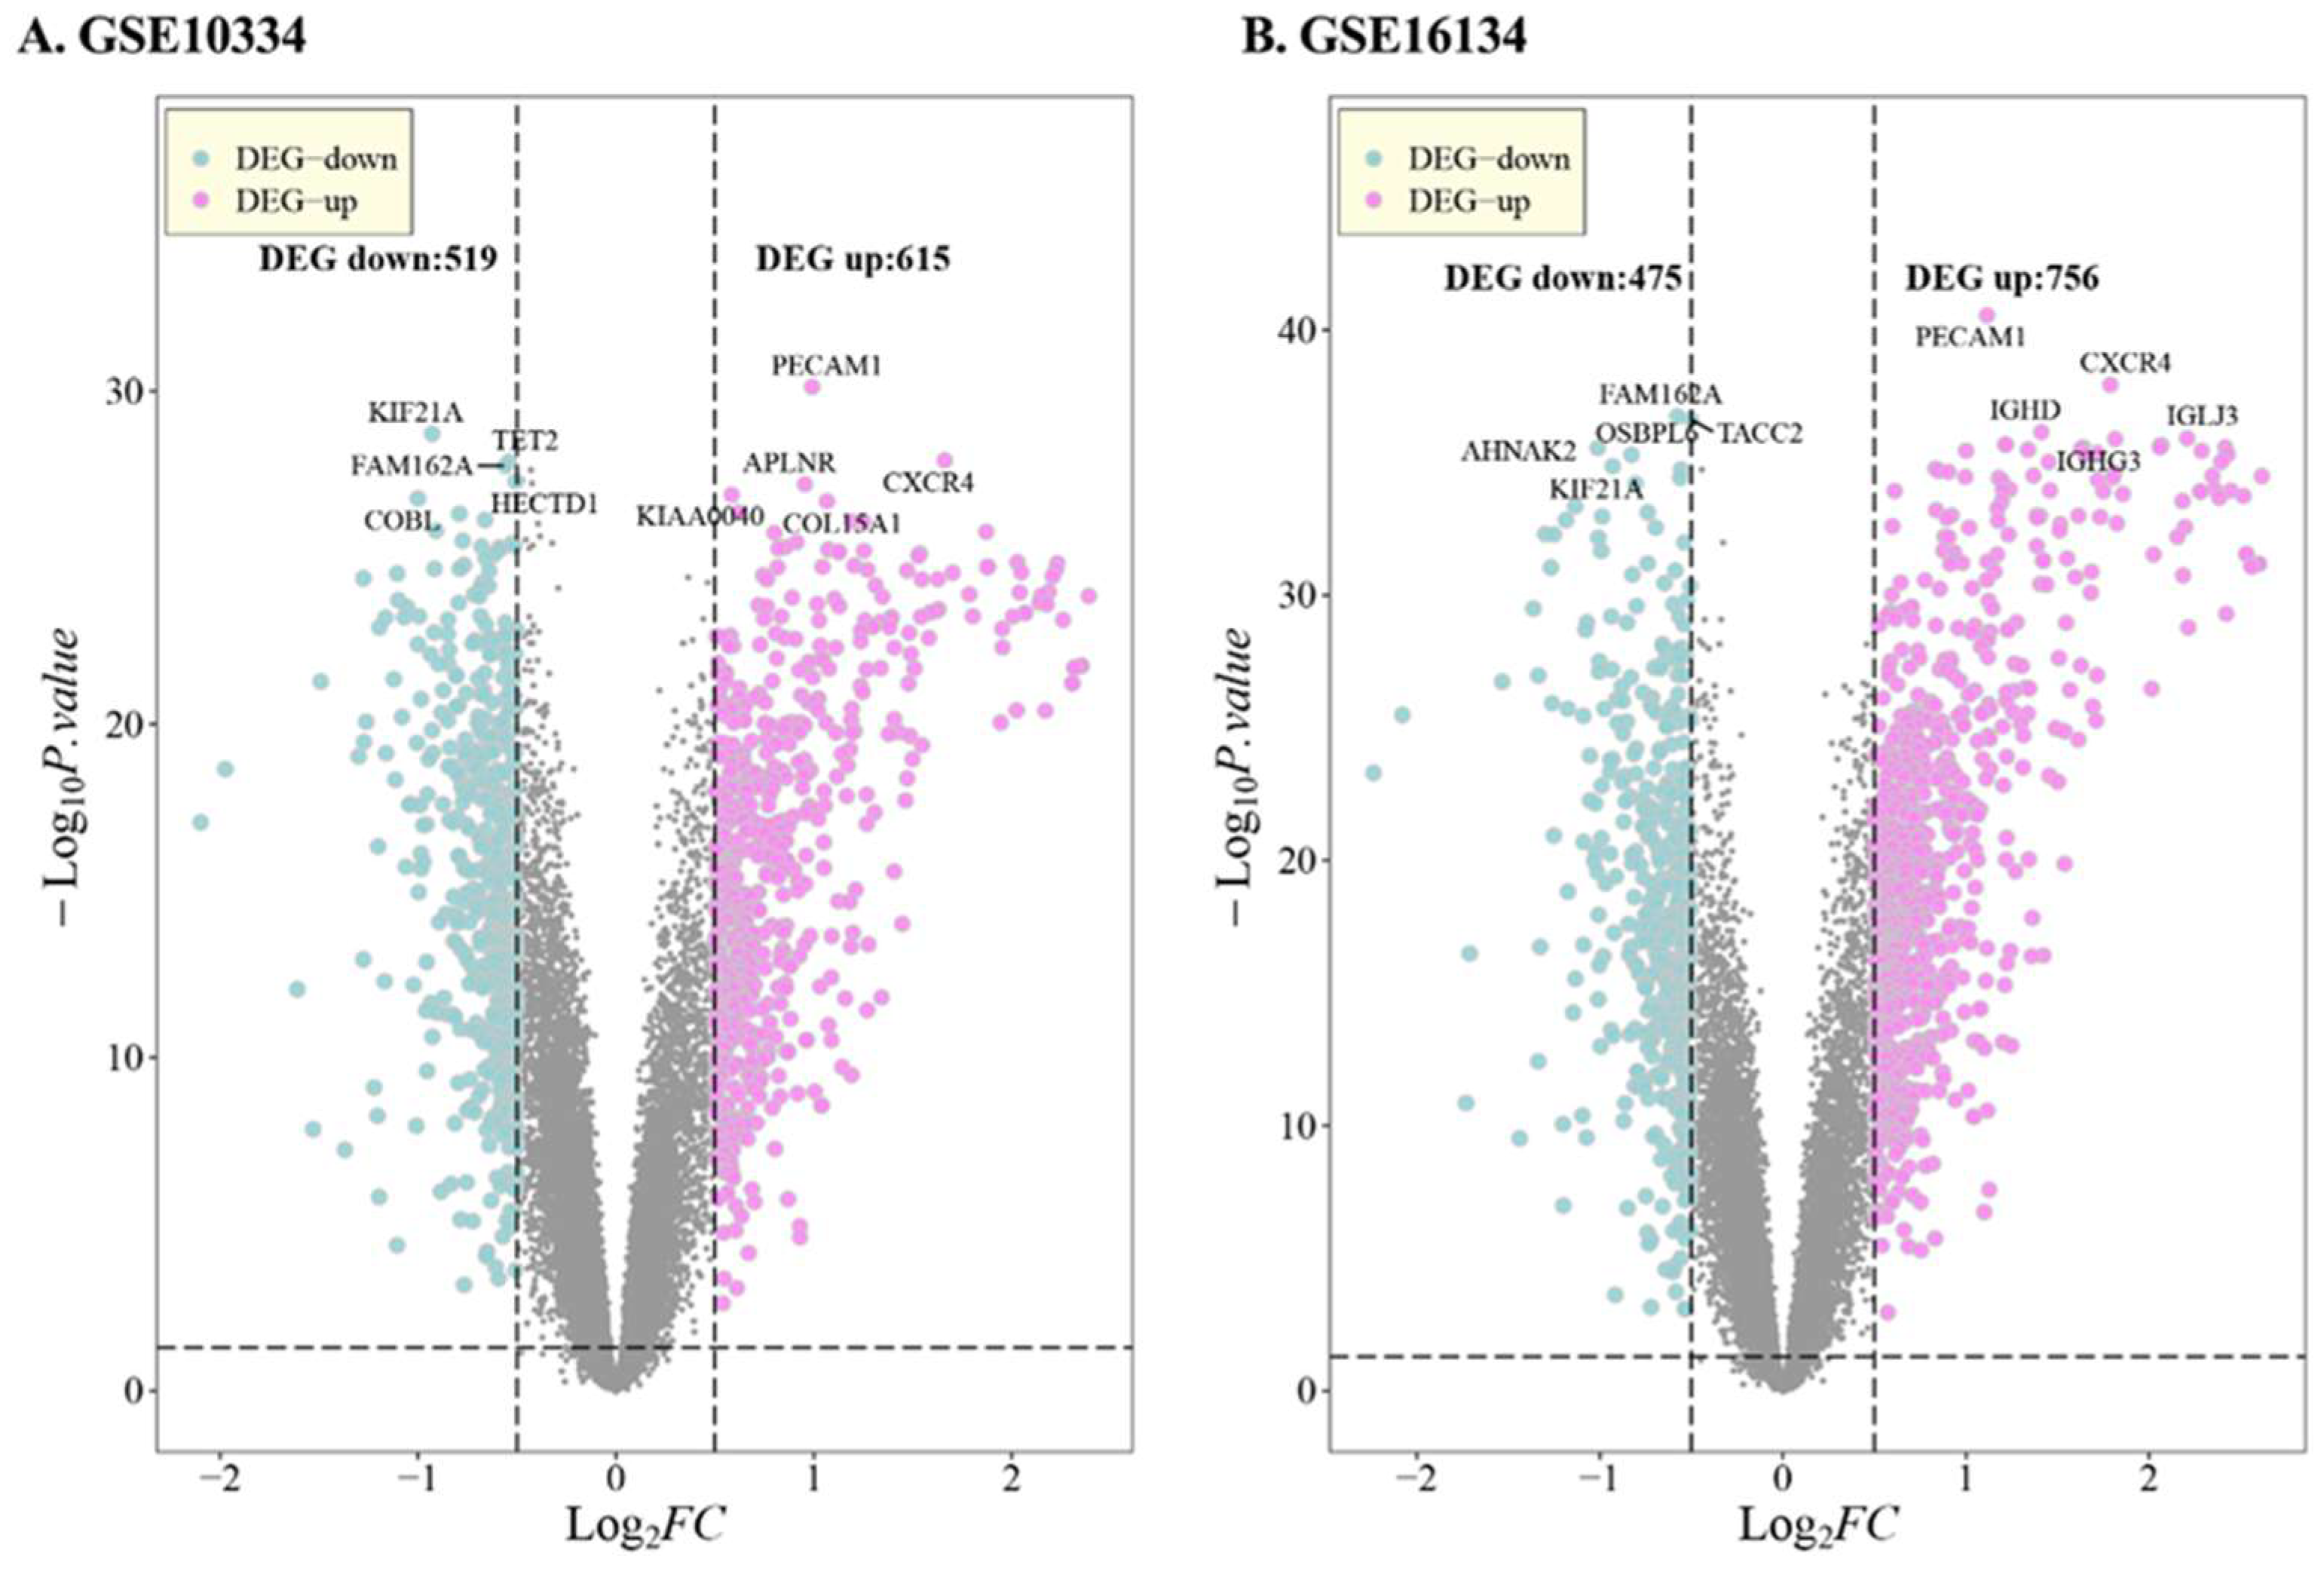
3.1. DEG in PD
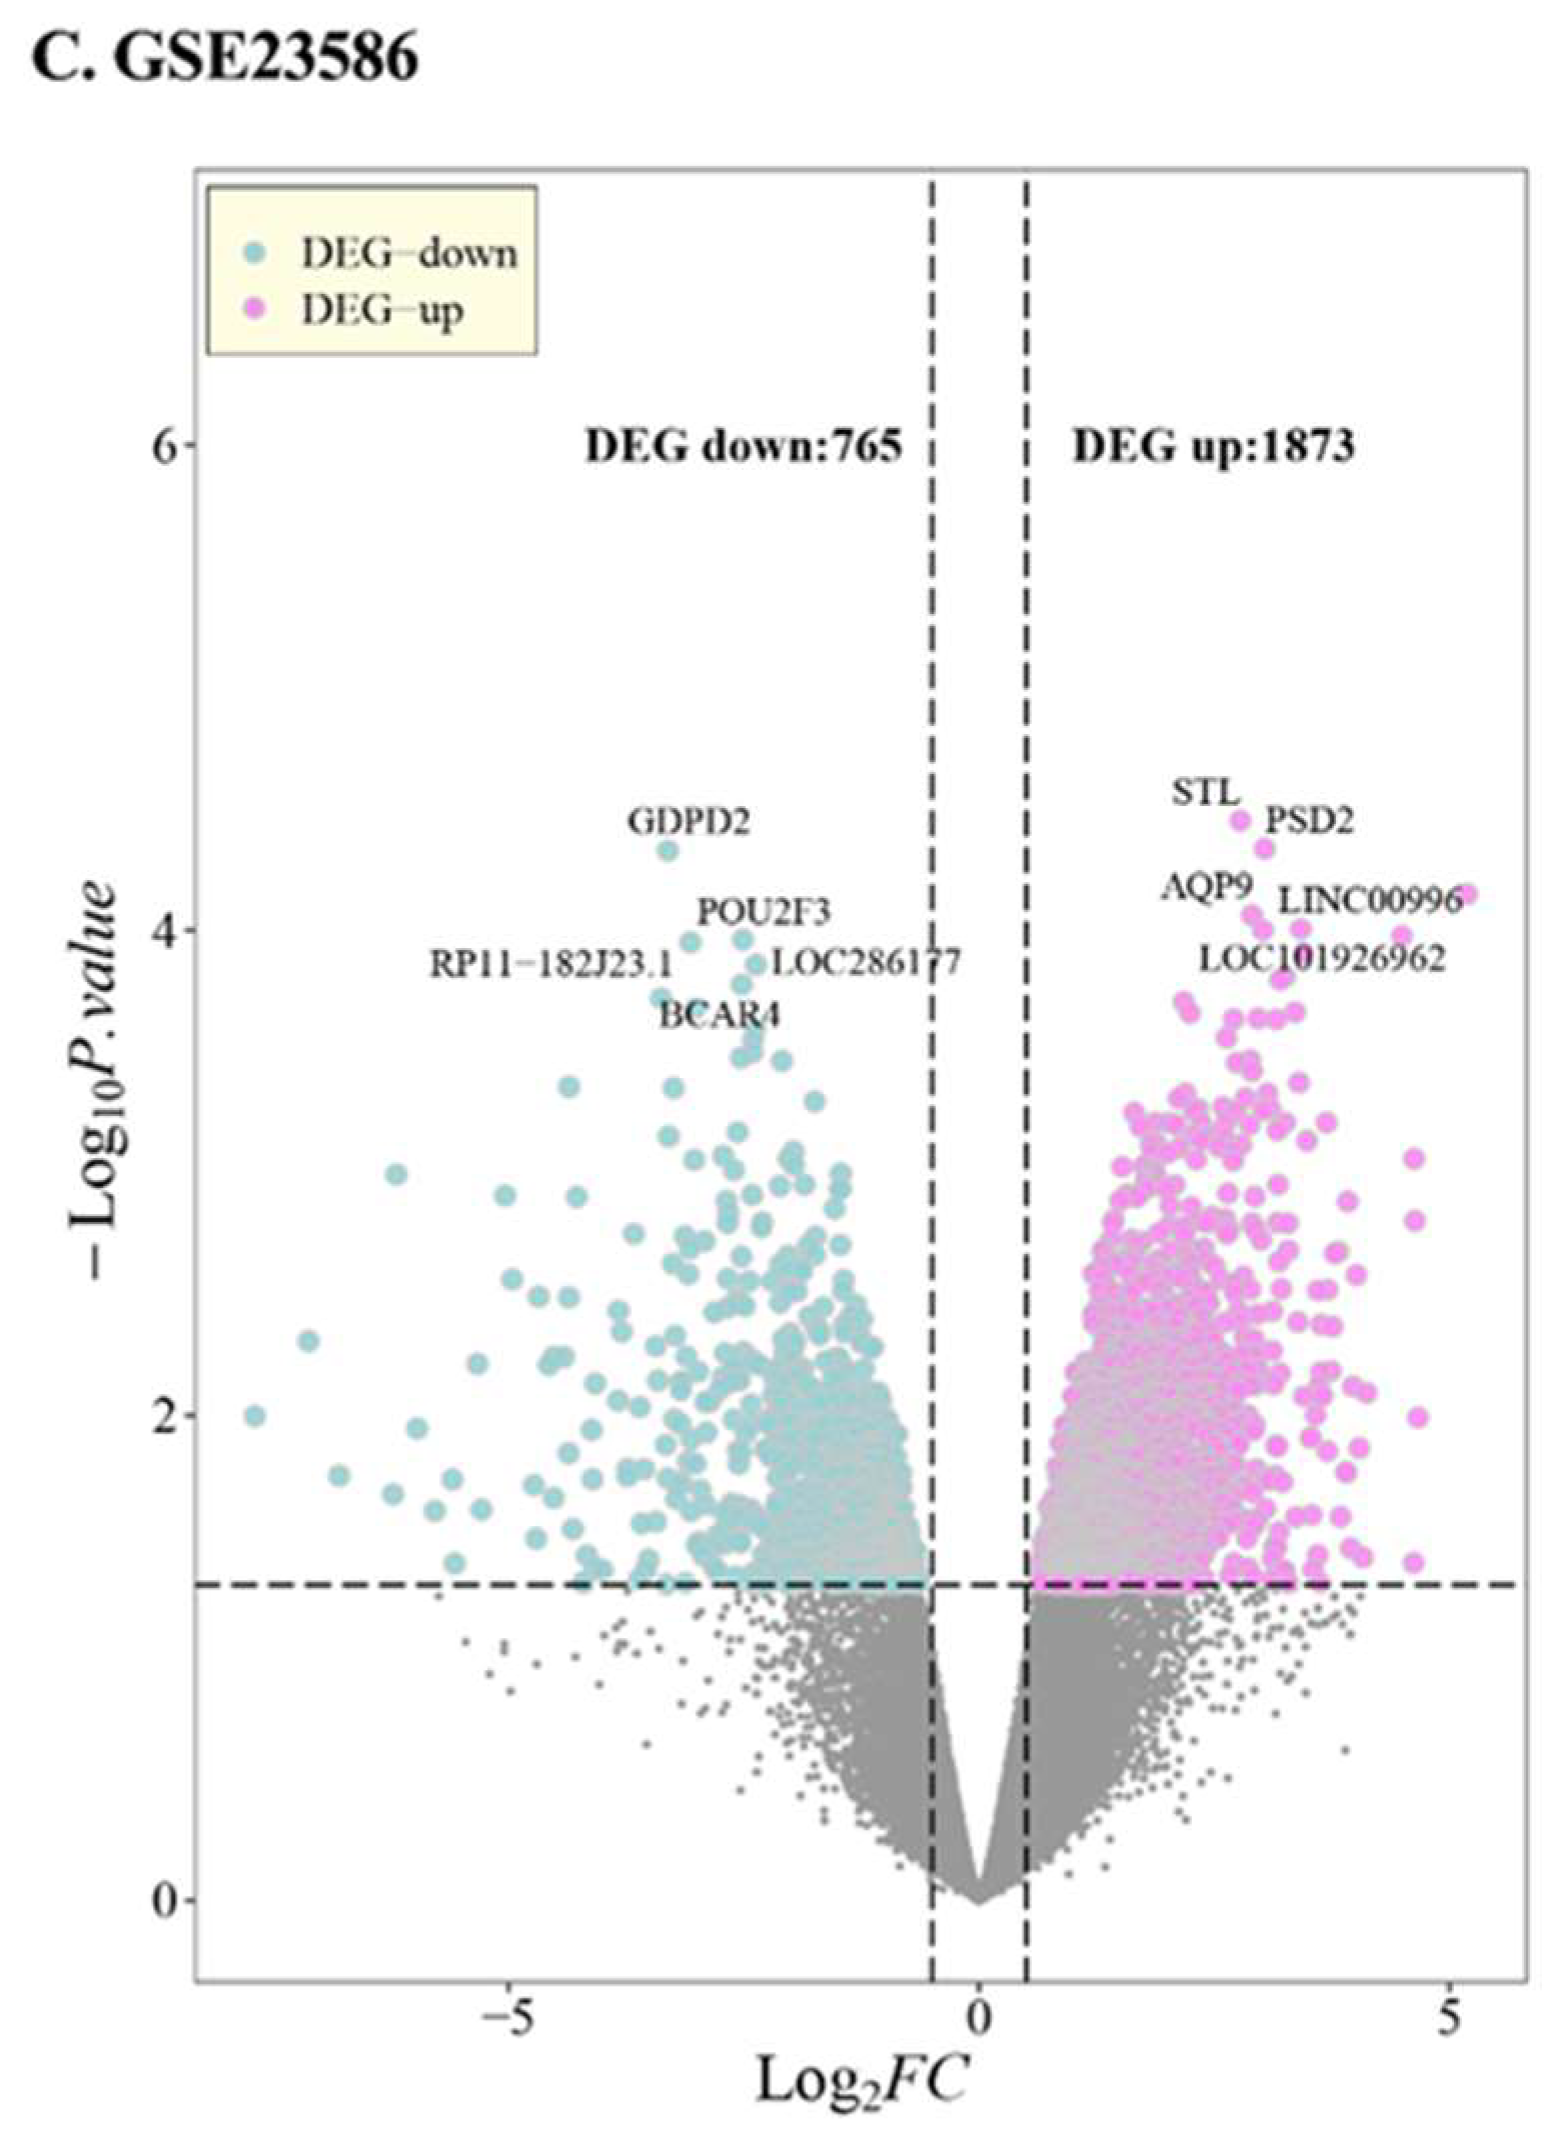
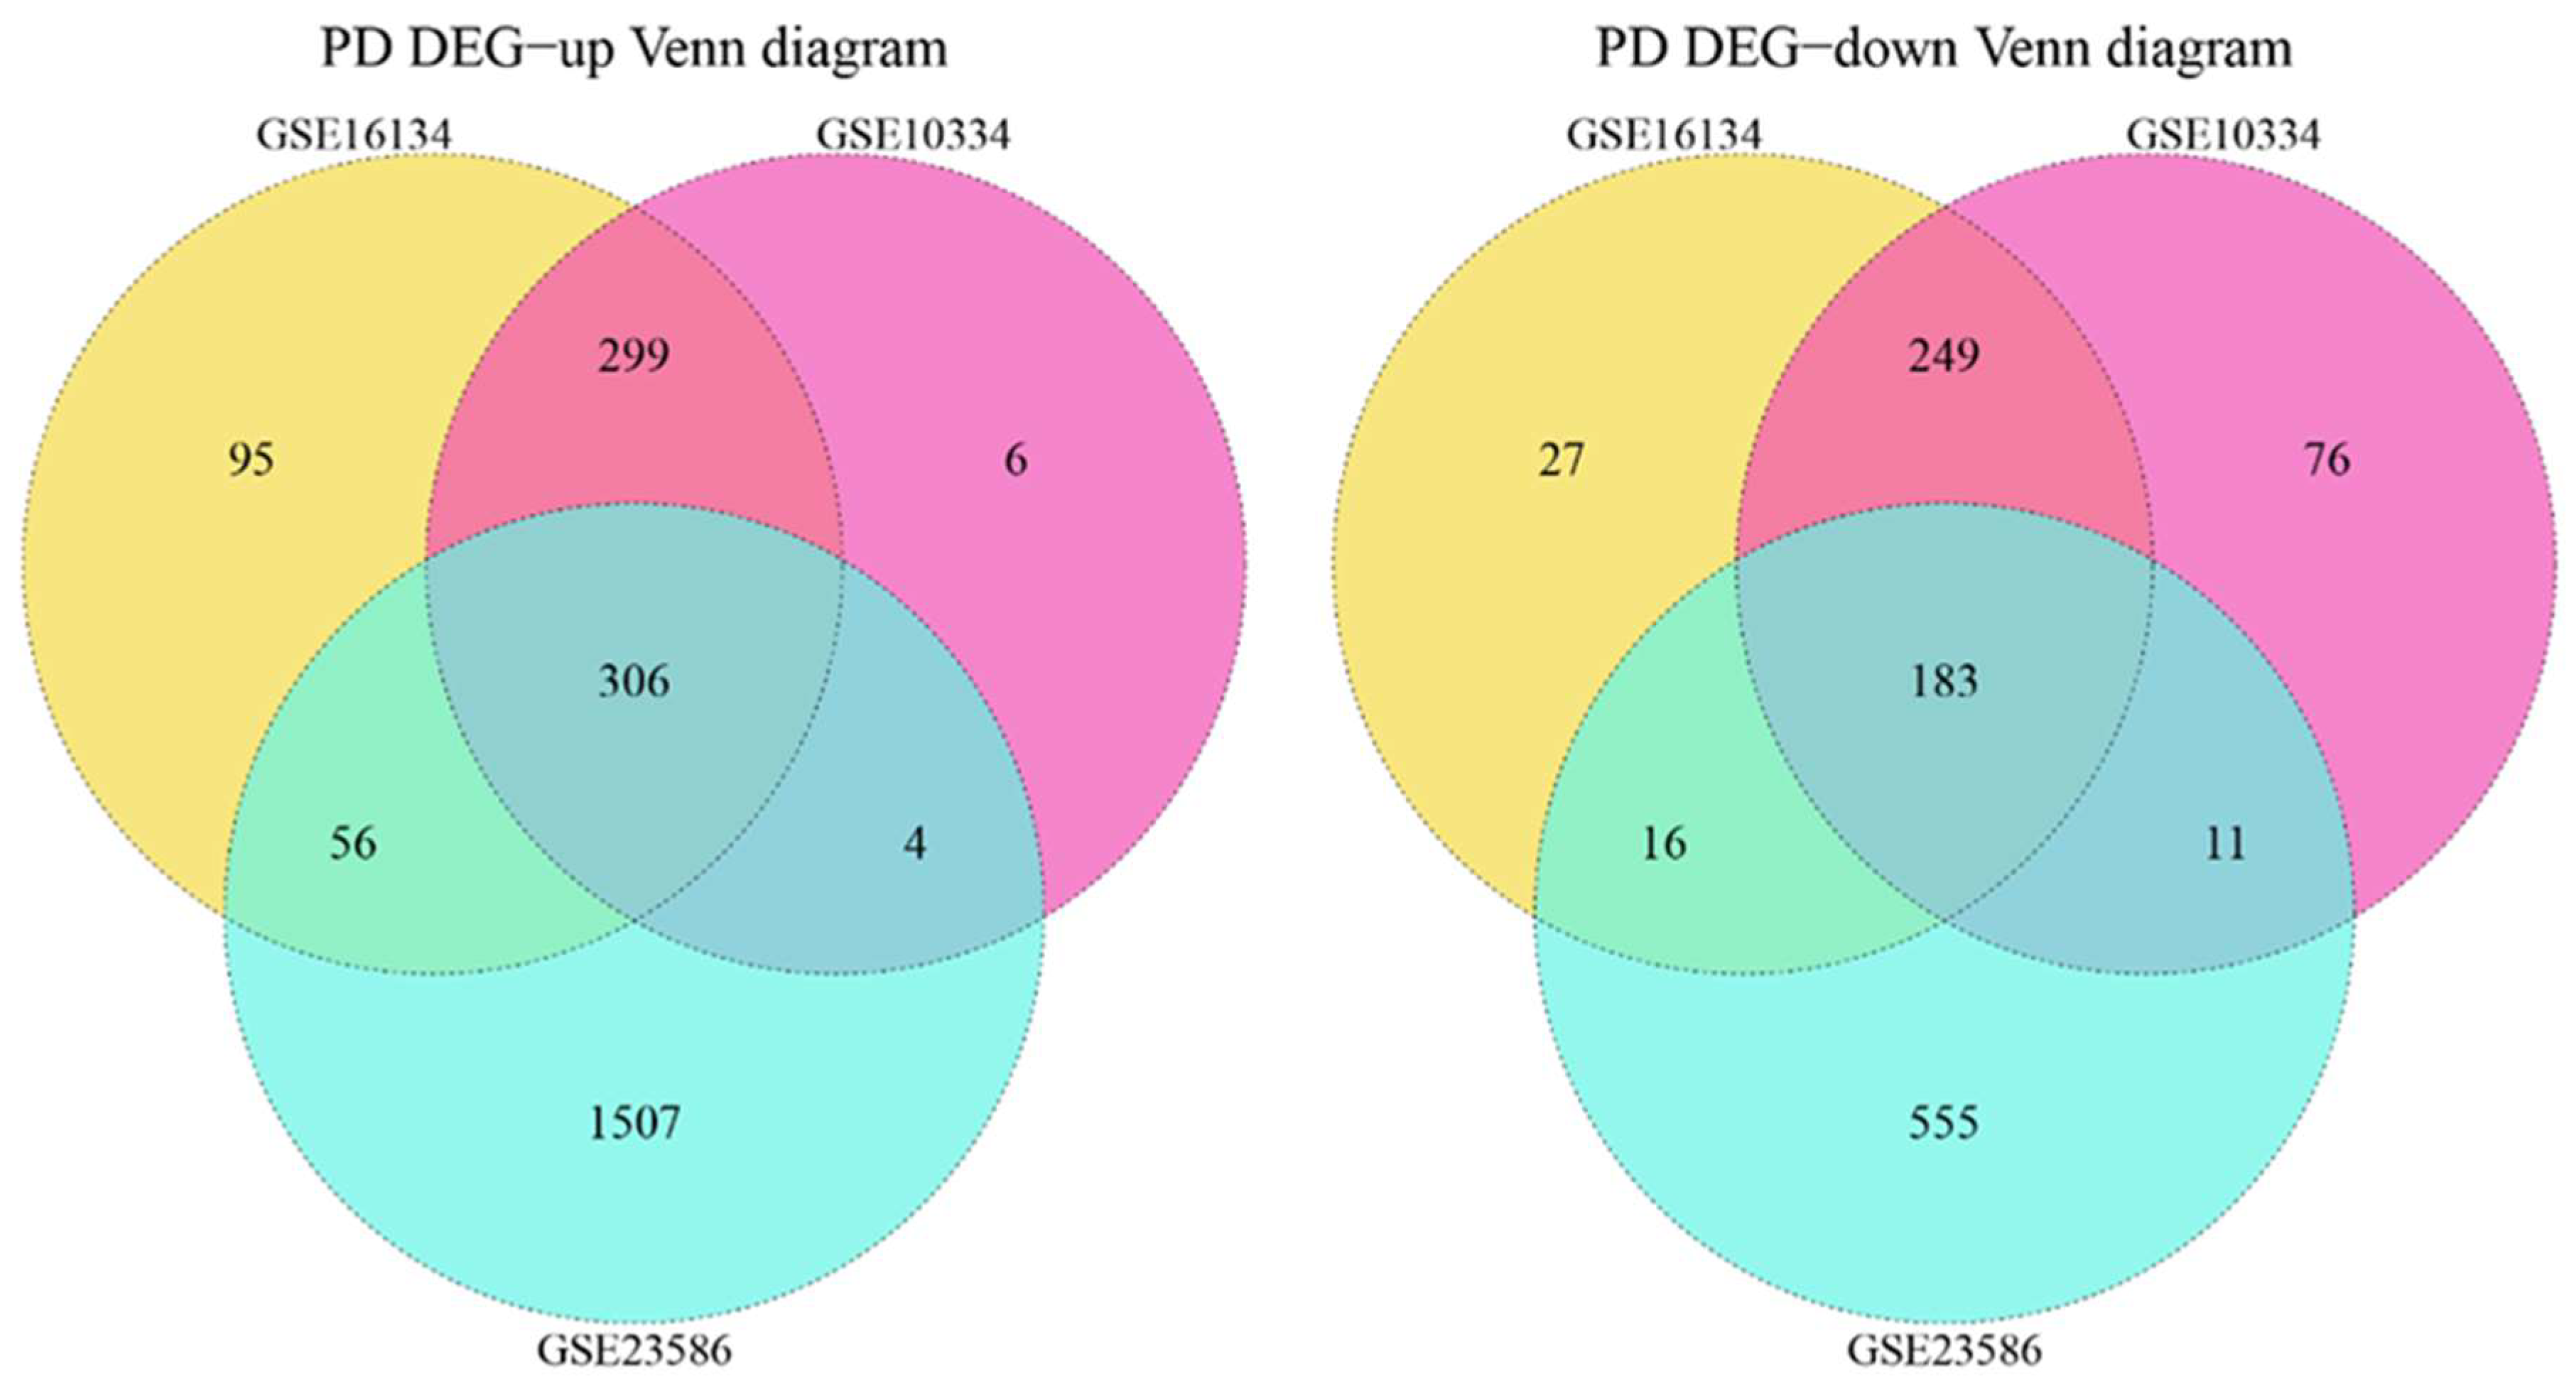
3.2. Cross-Talk Gene Analysis
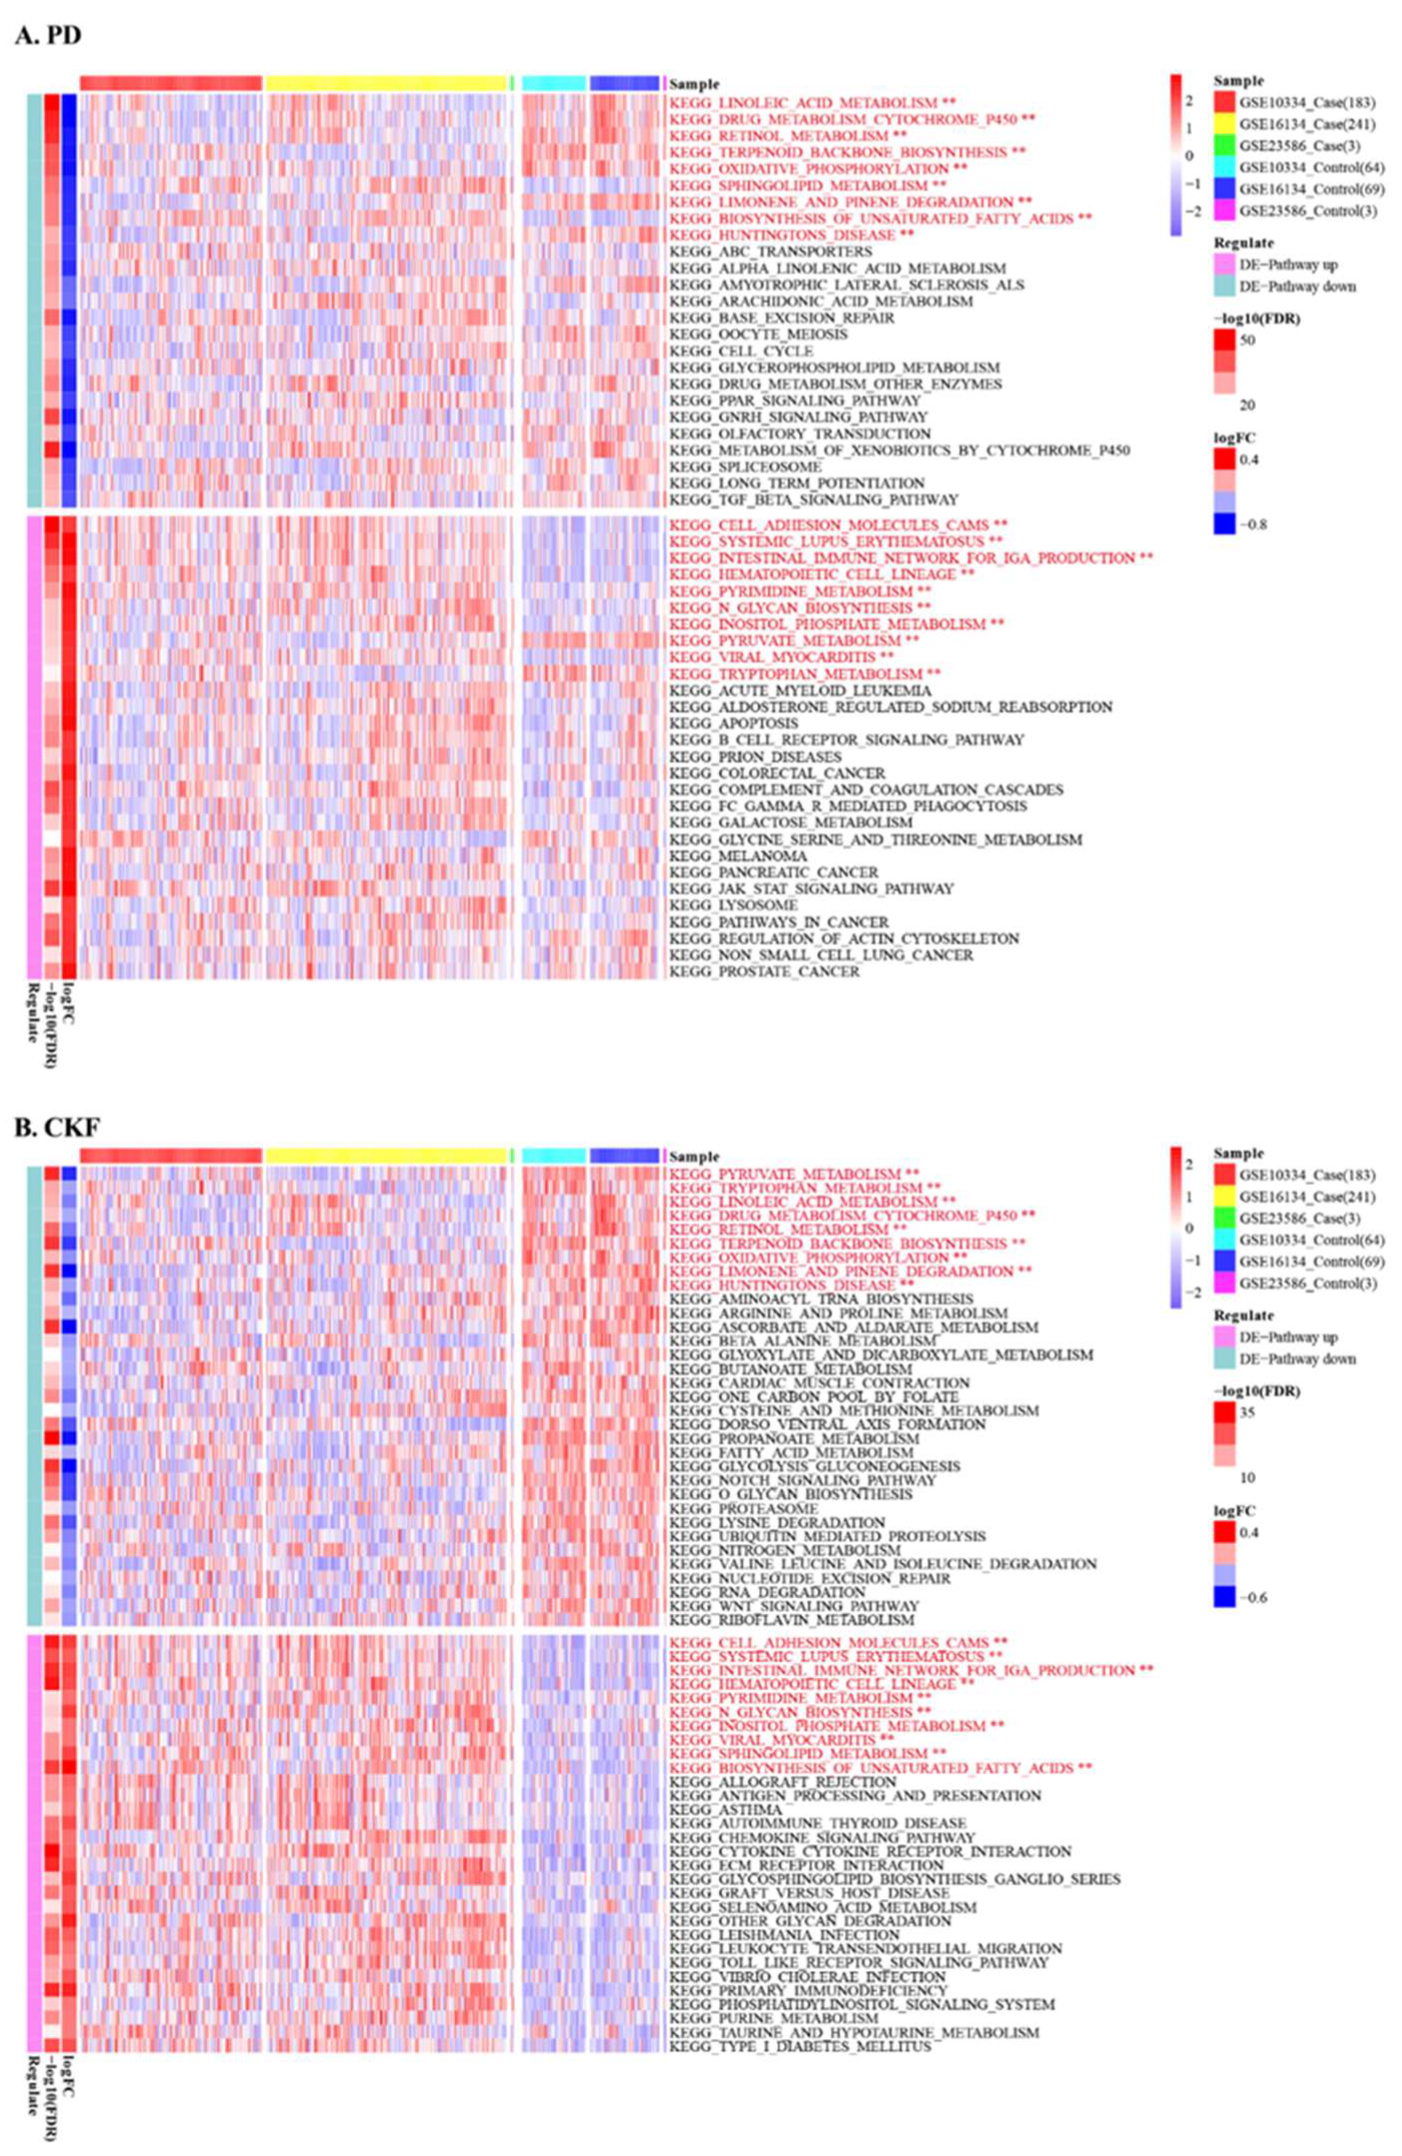
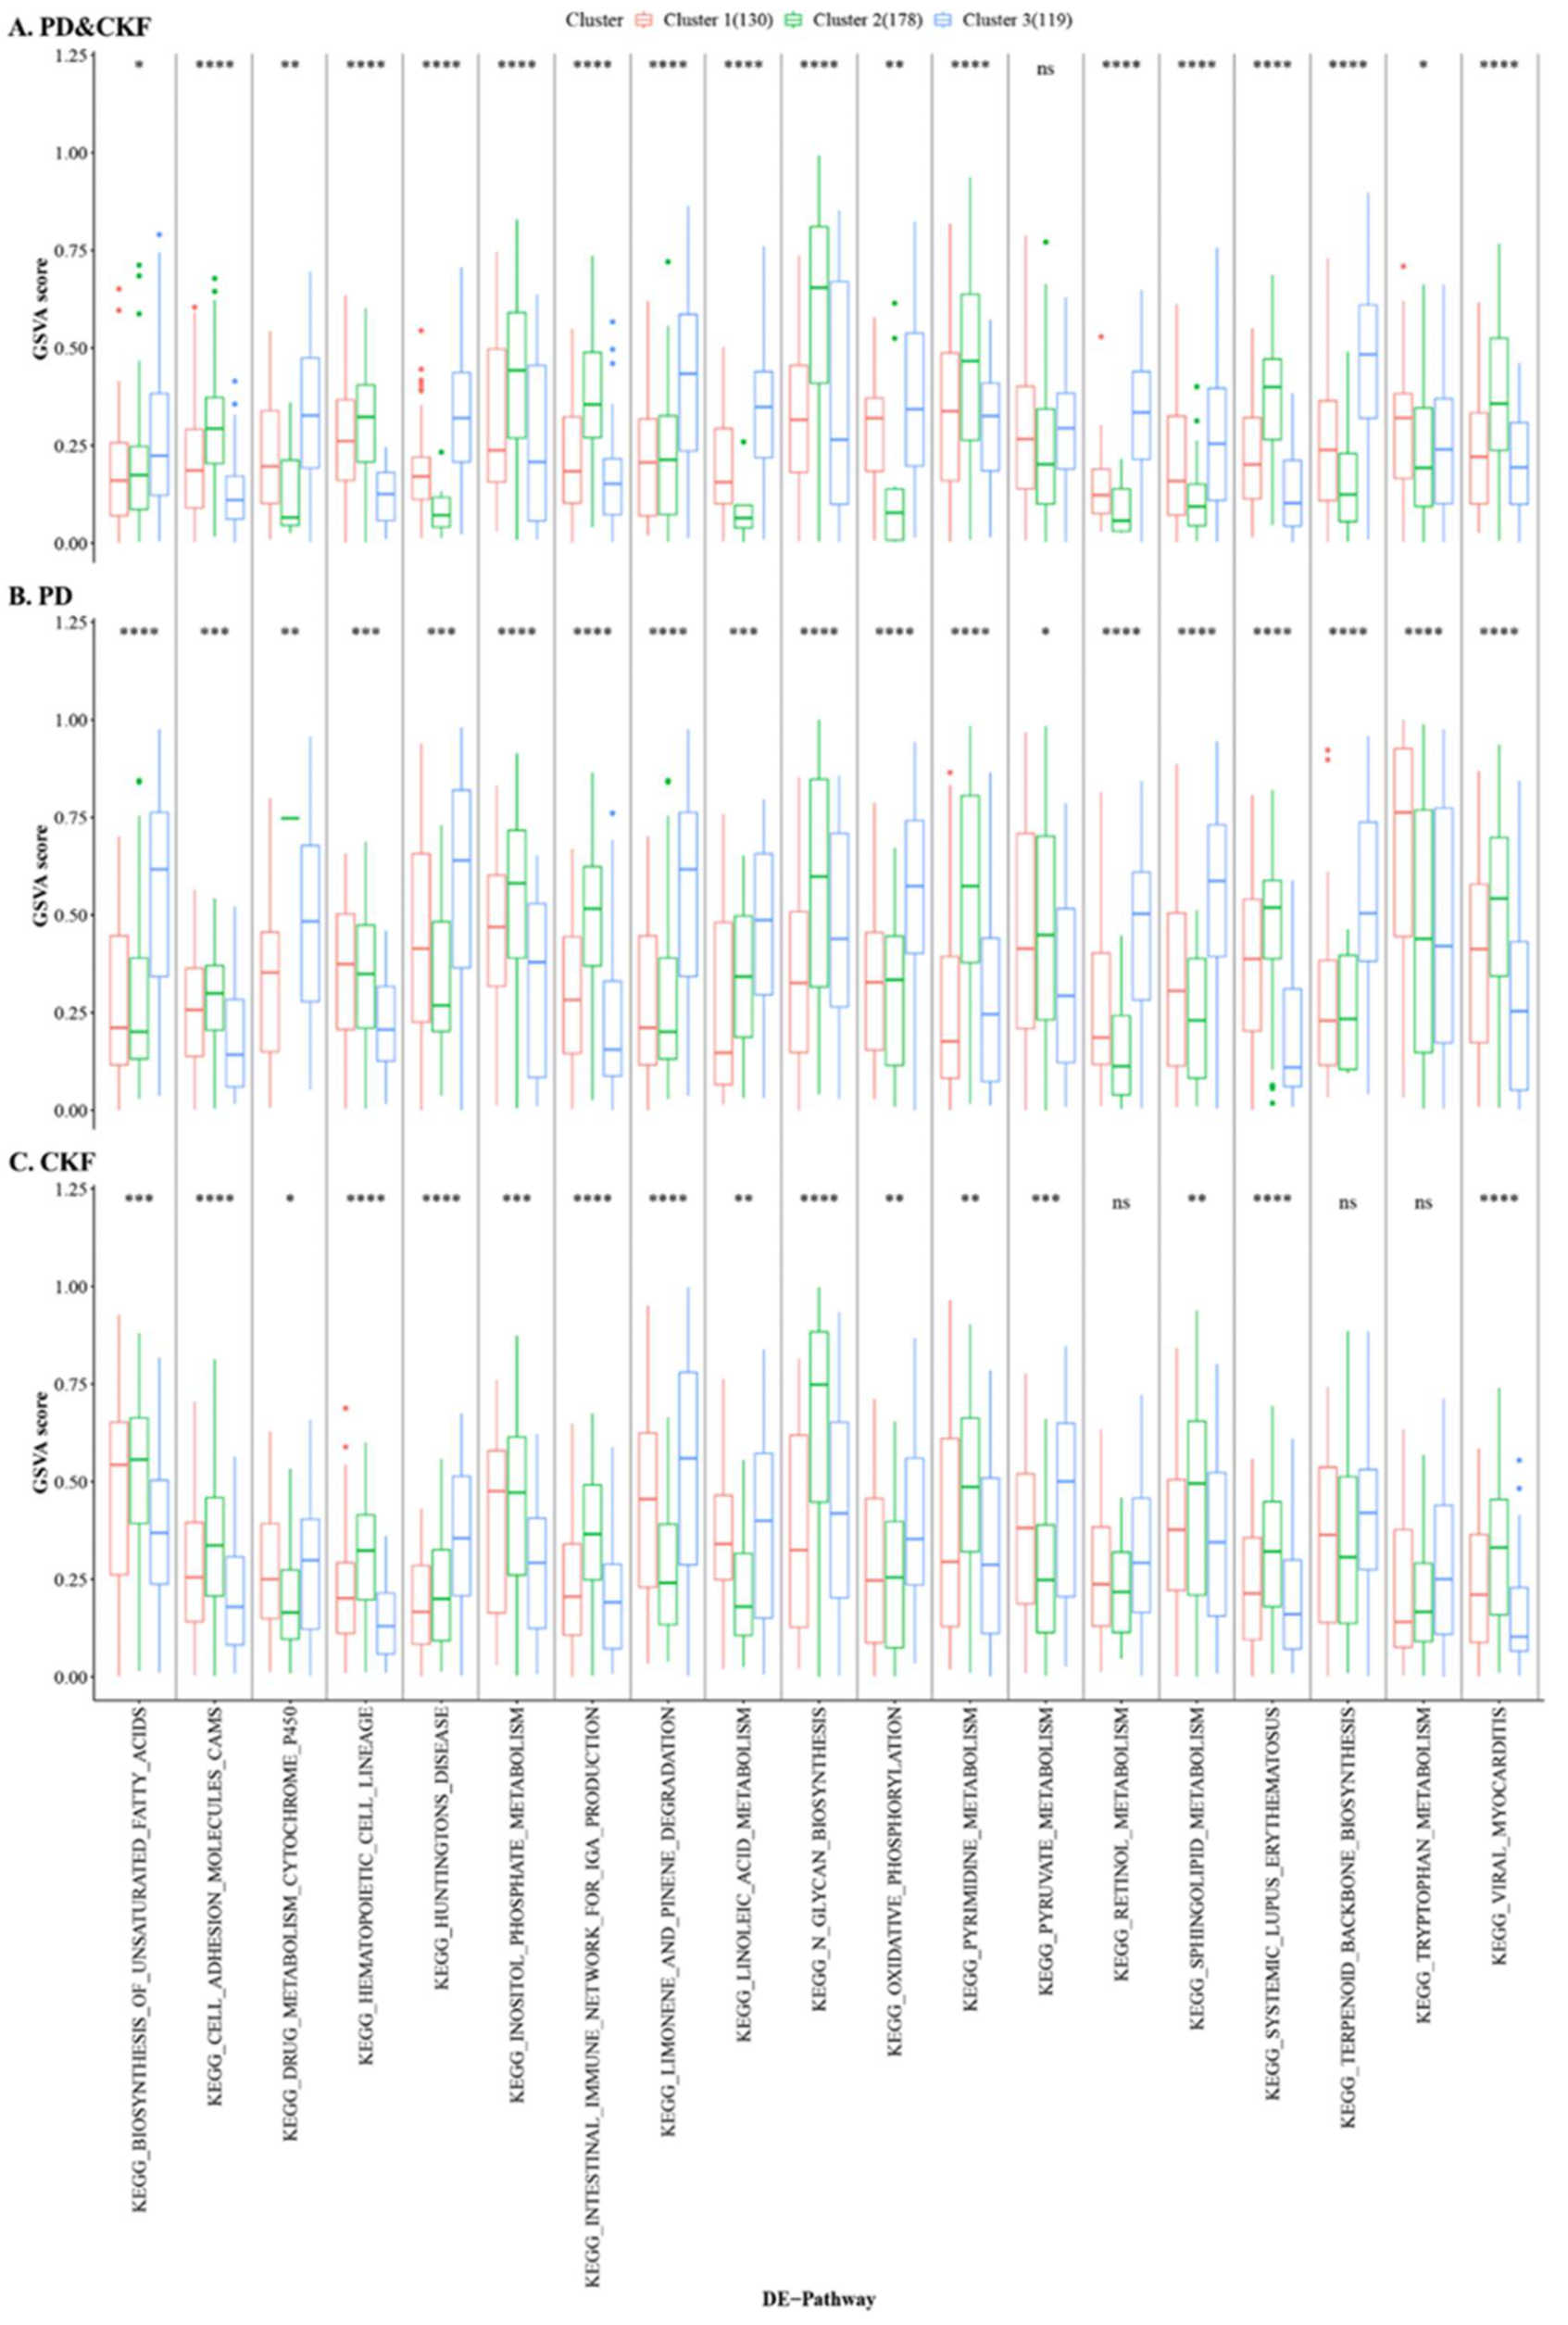
3.3. GSVA Analysis
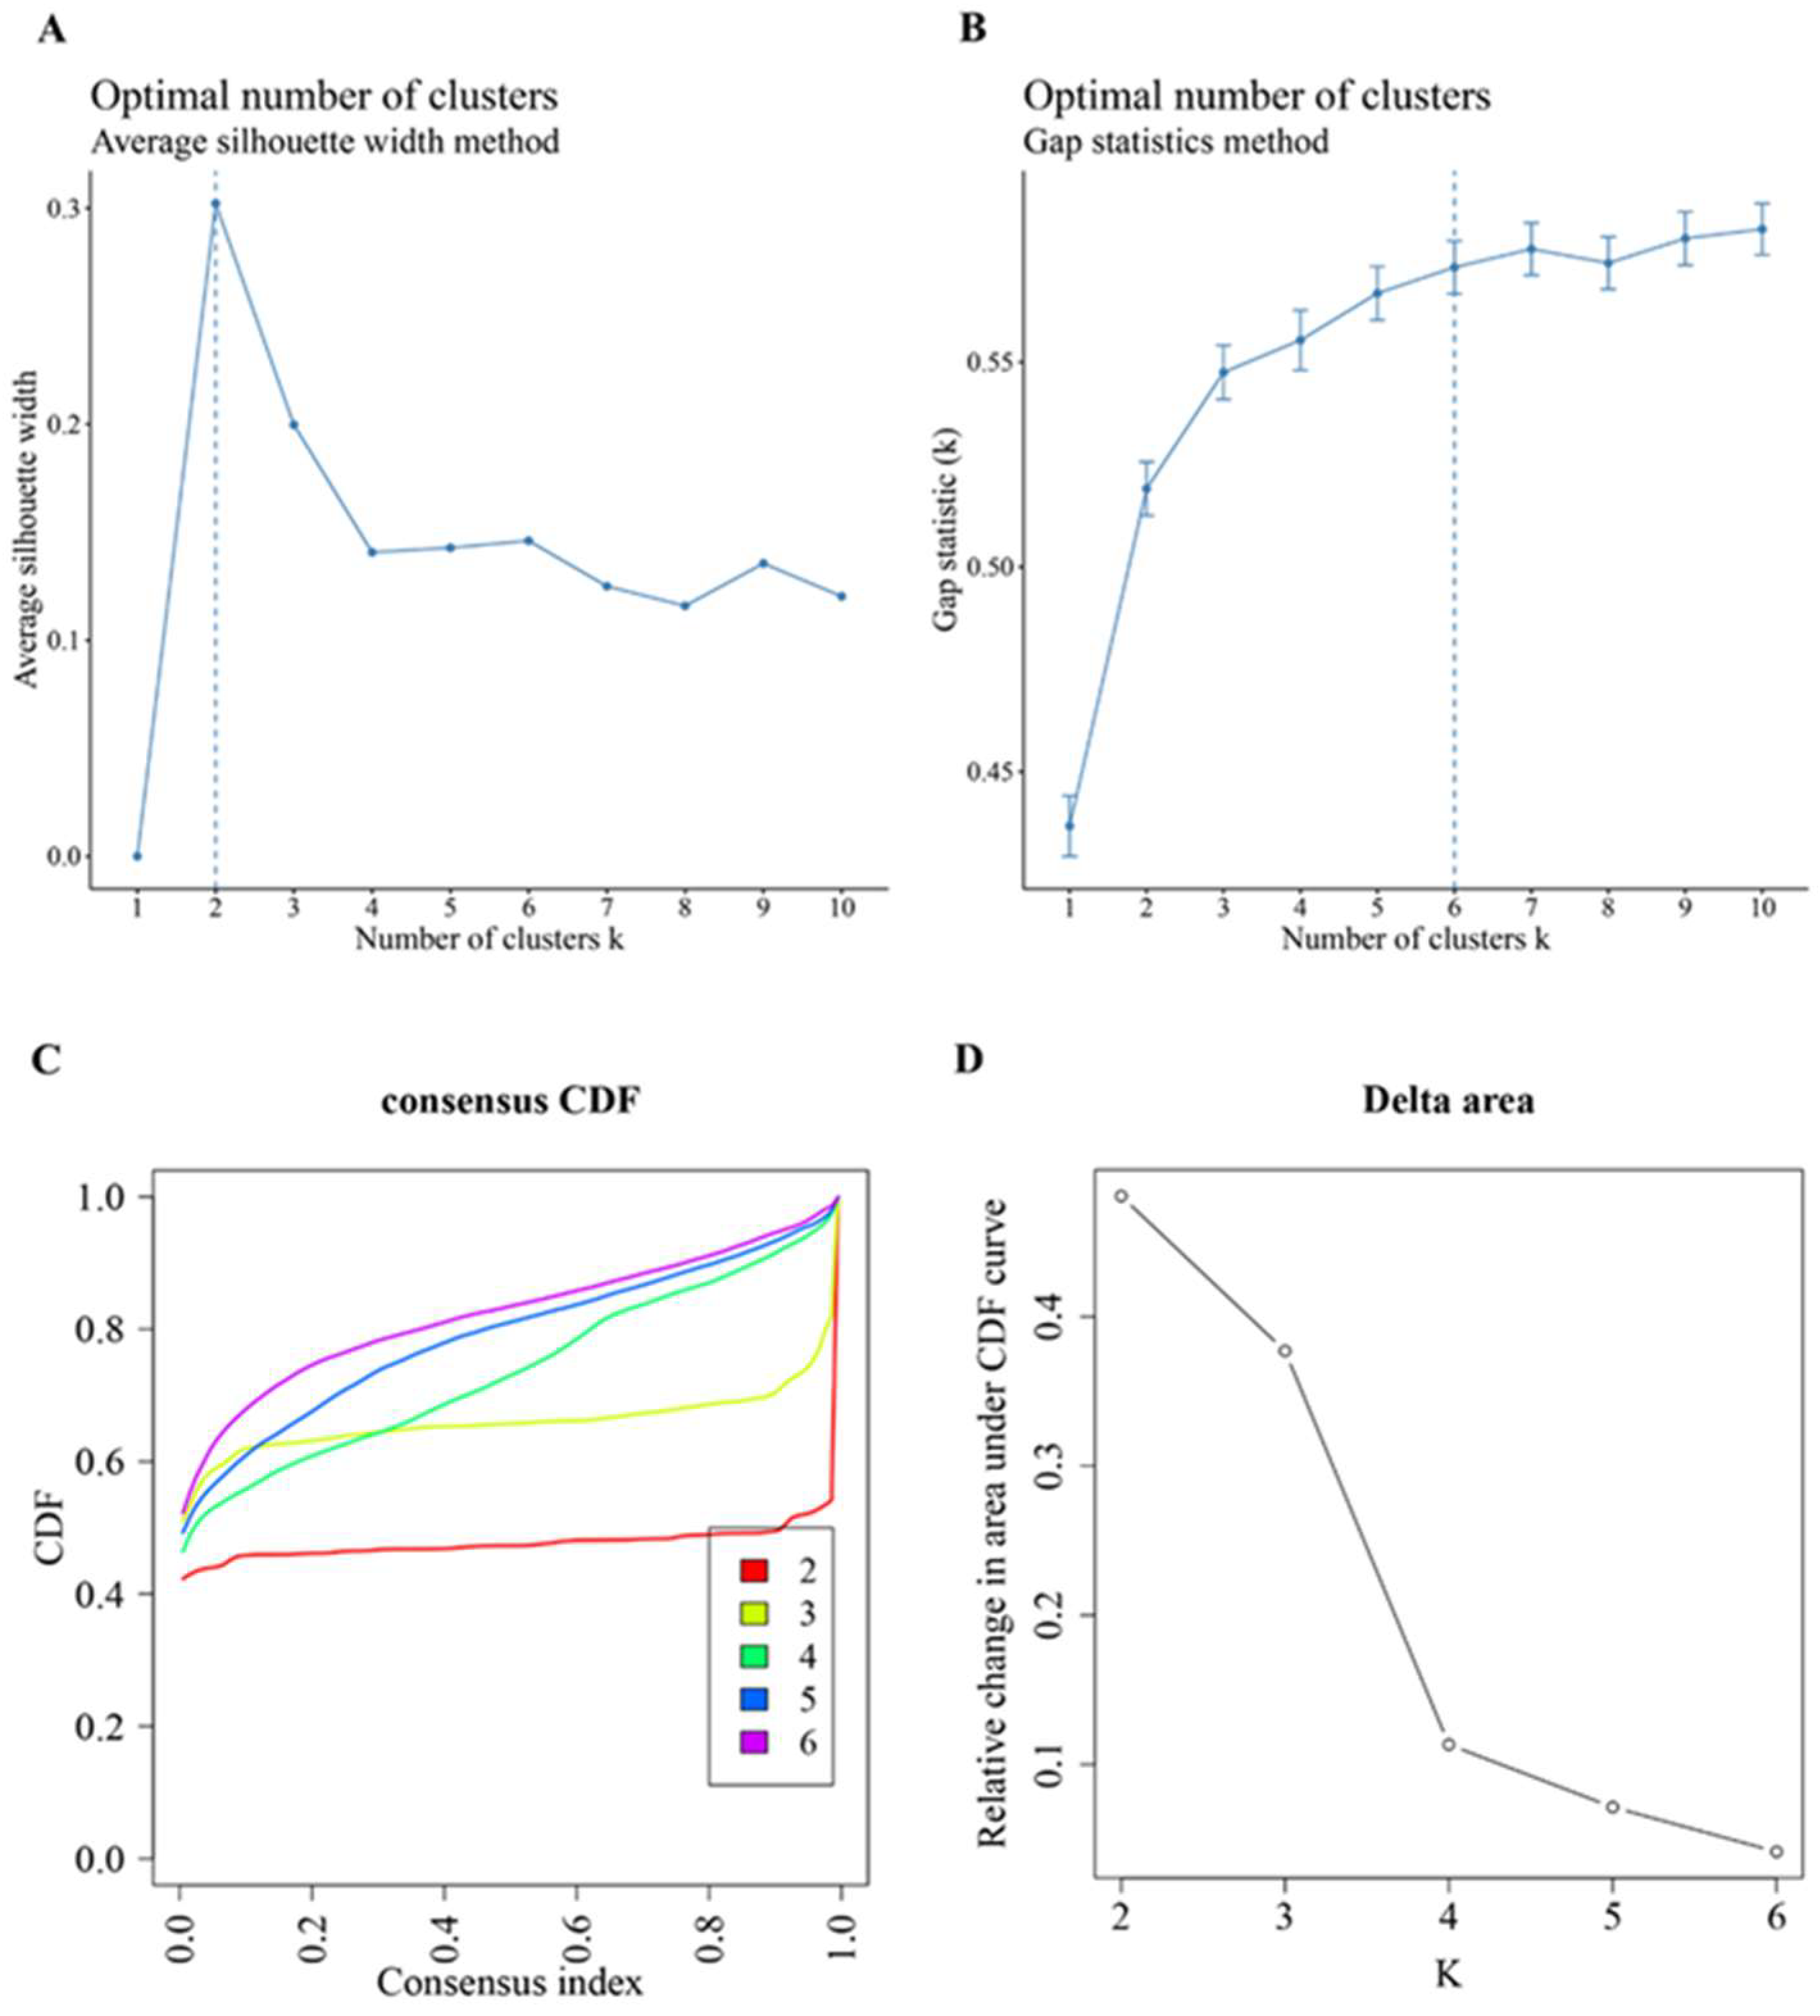
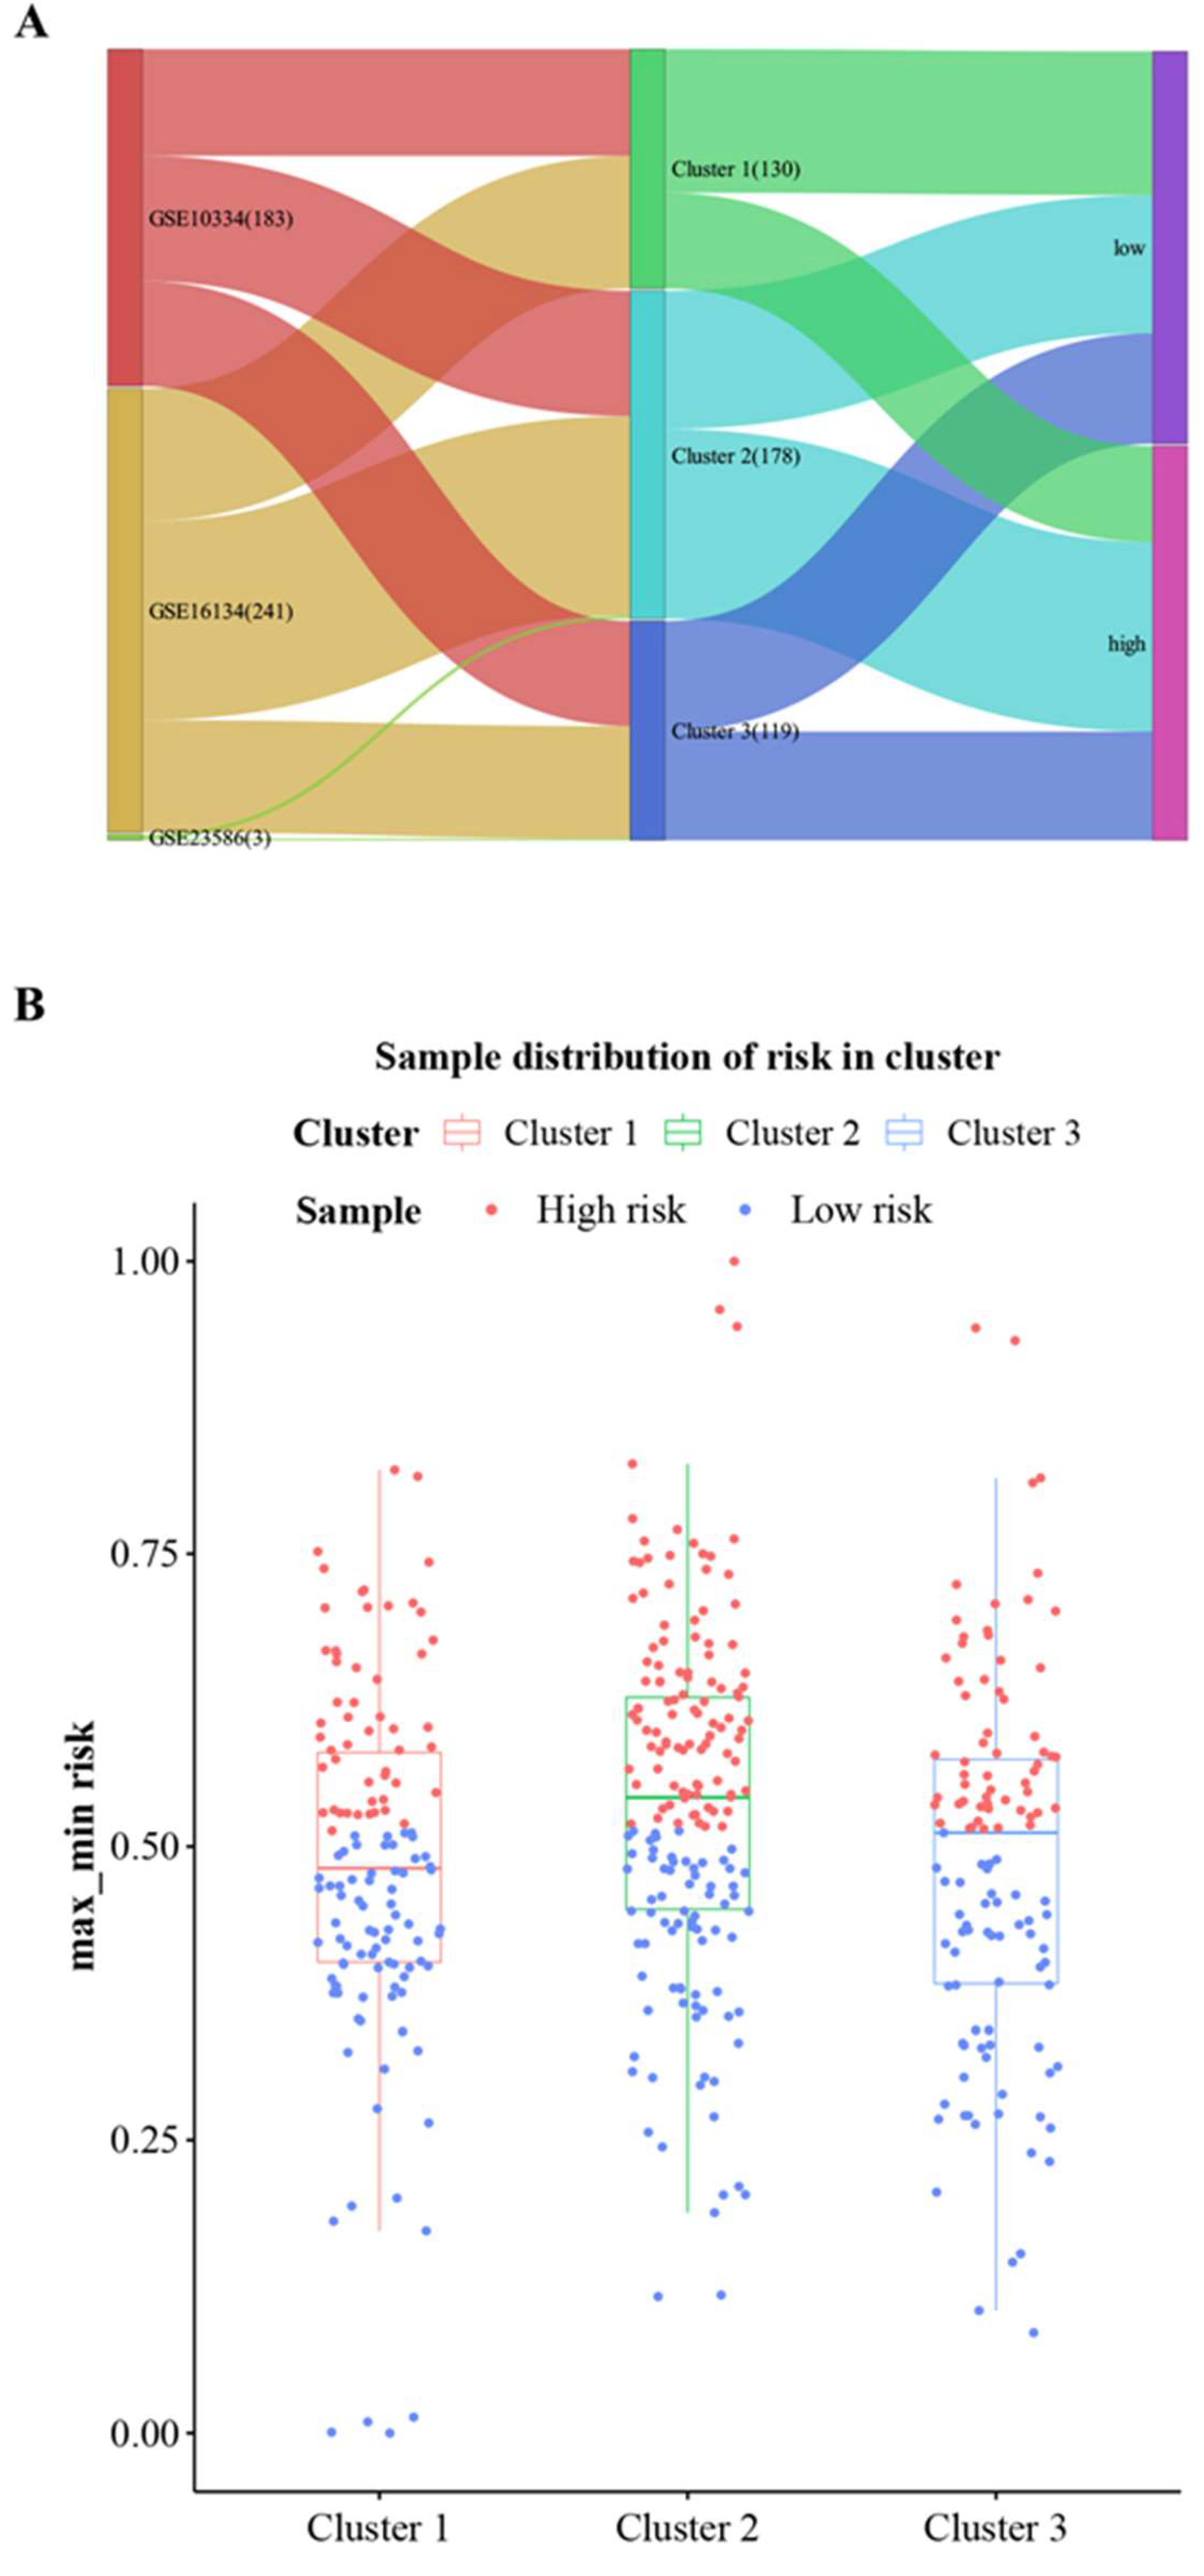
3.4. Consensus Cluster Plus Analysis
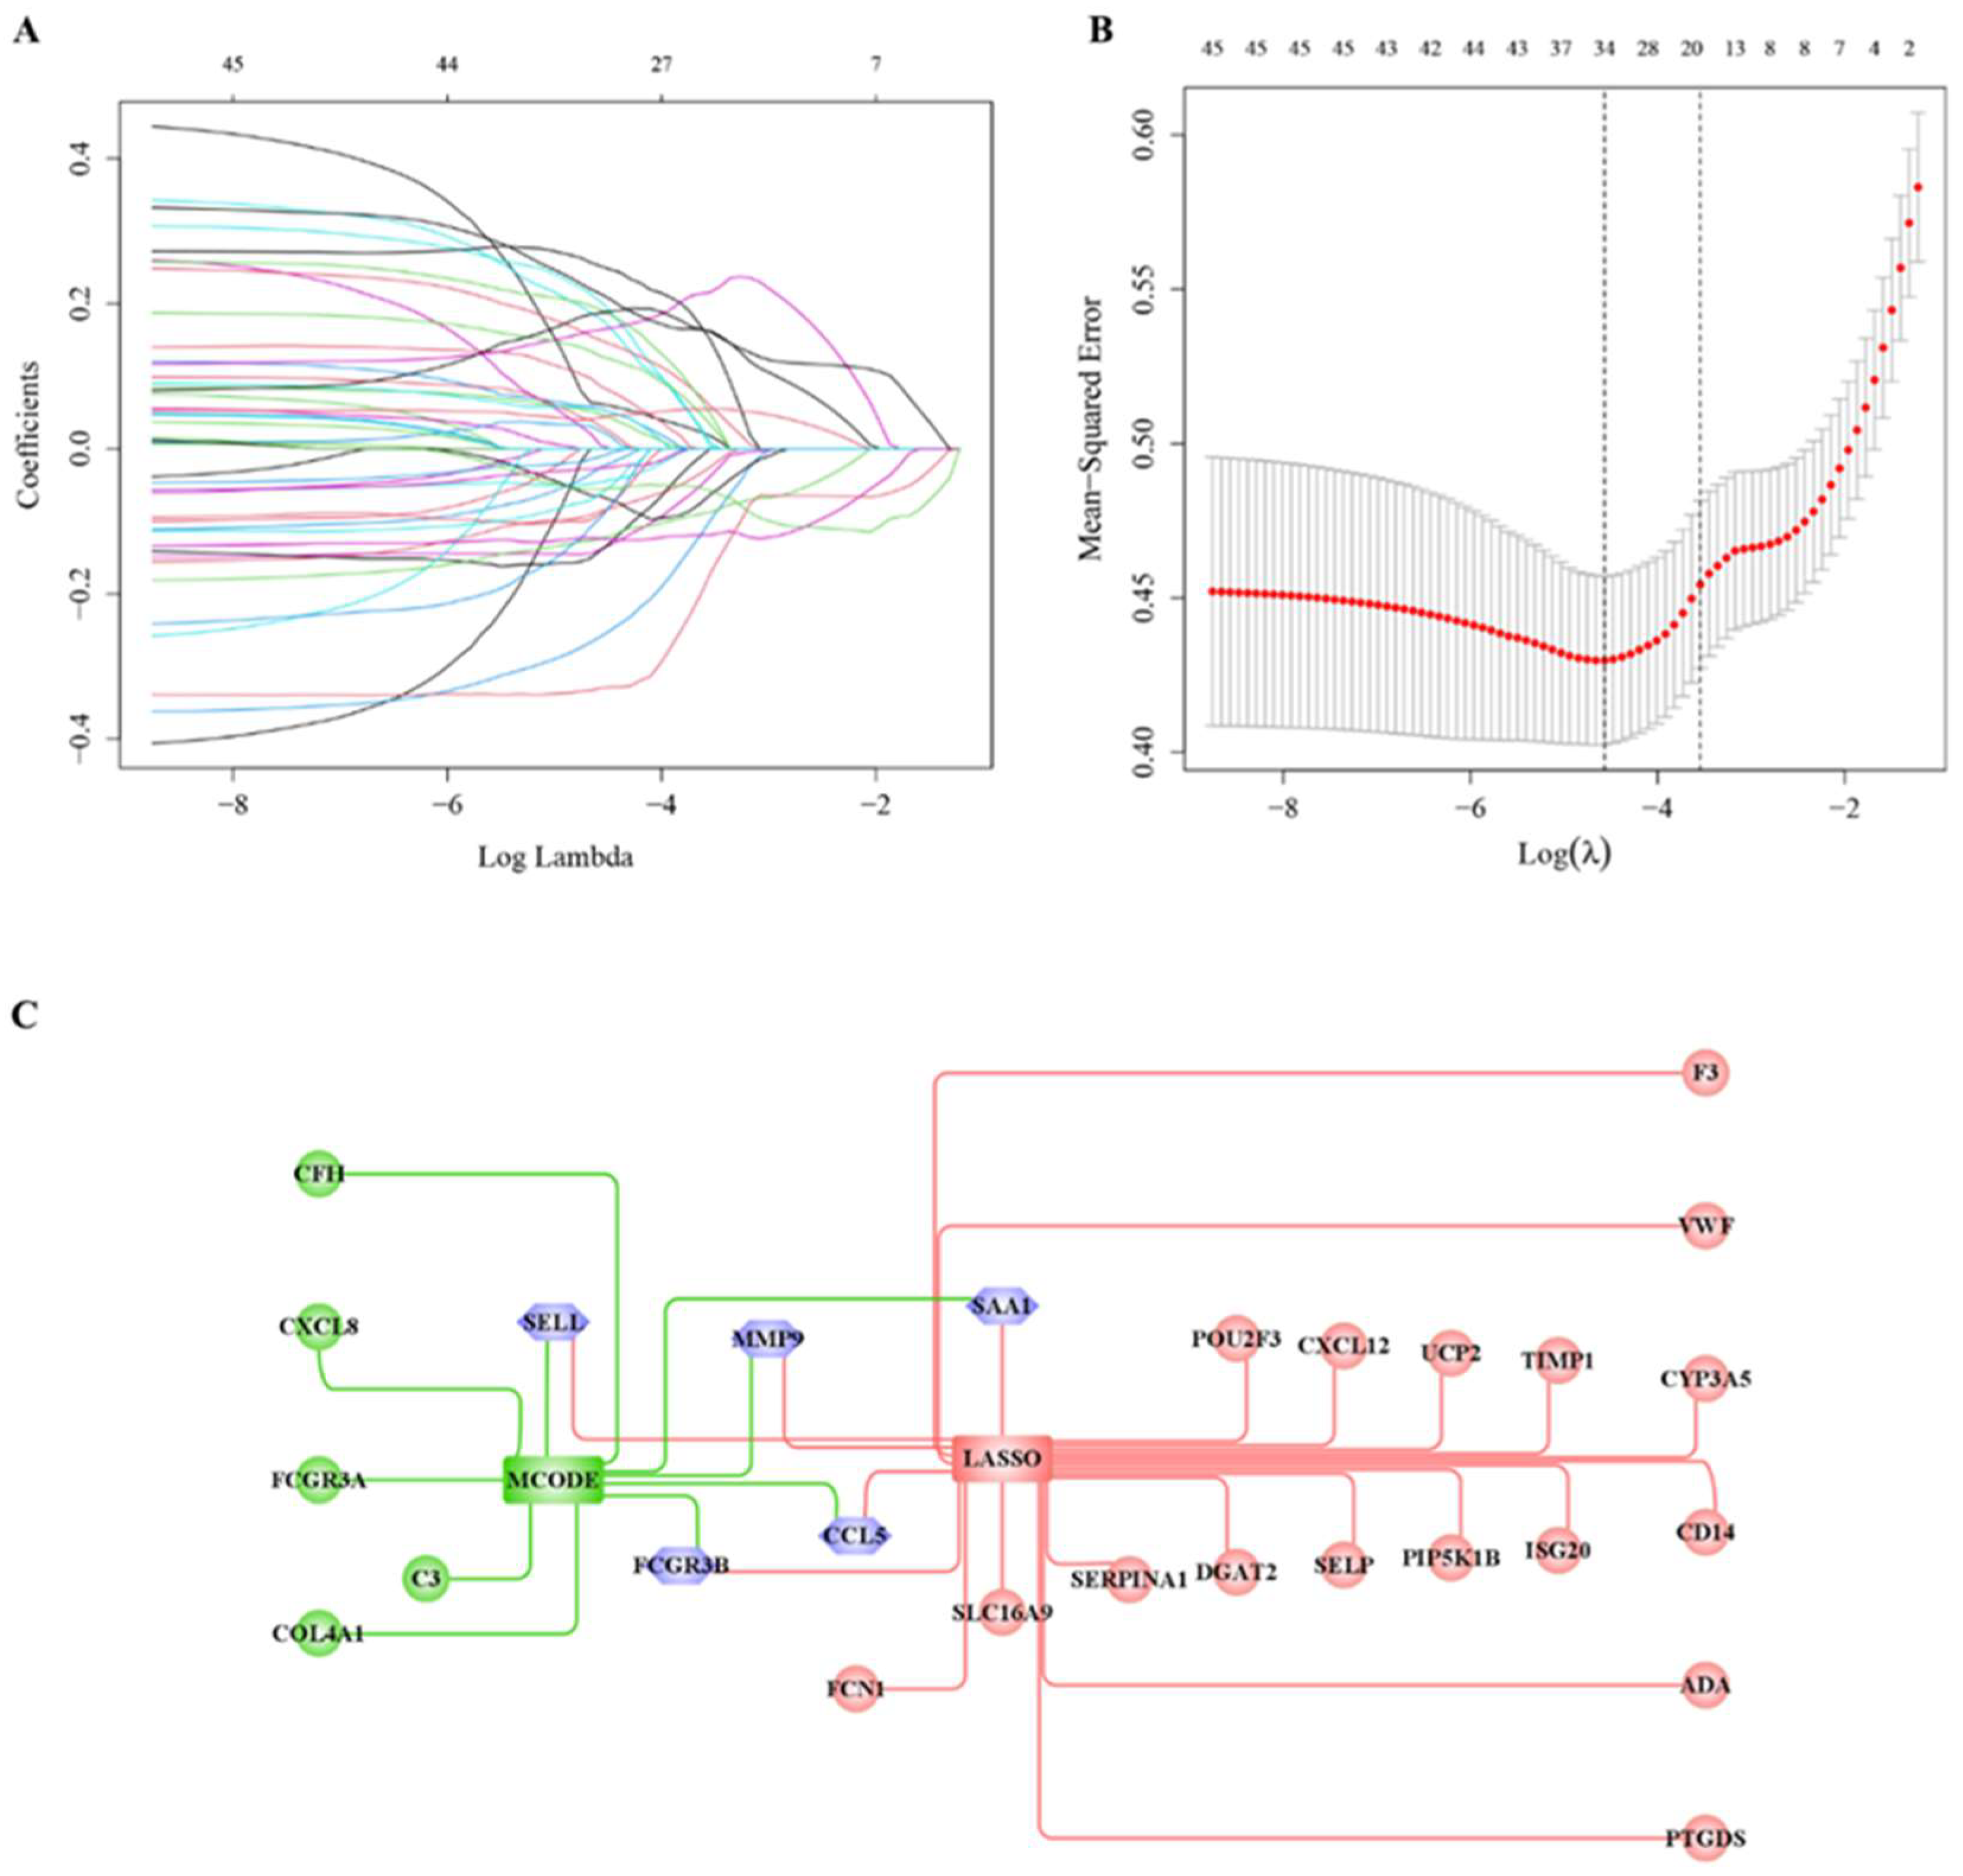
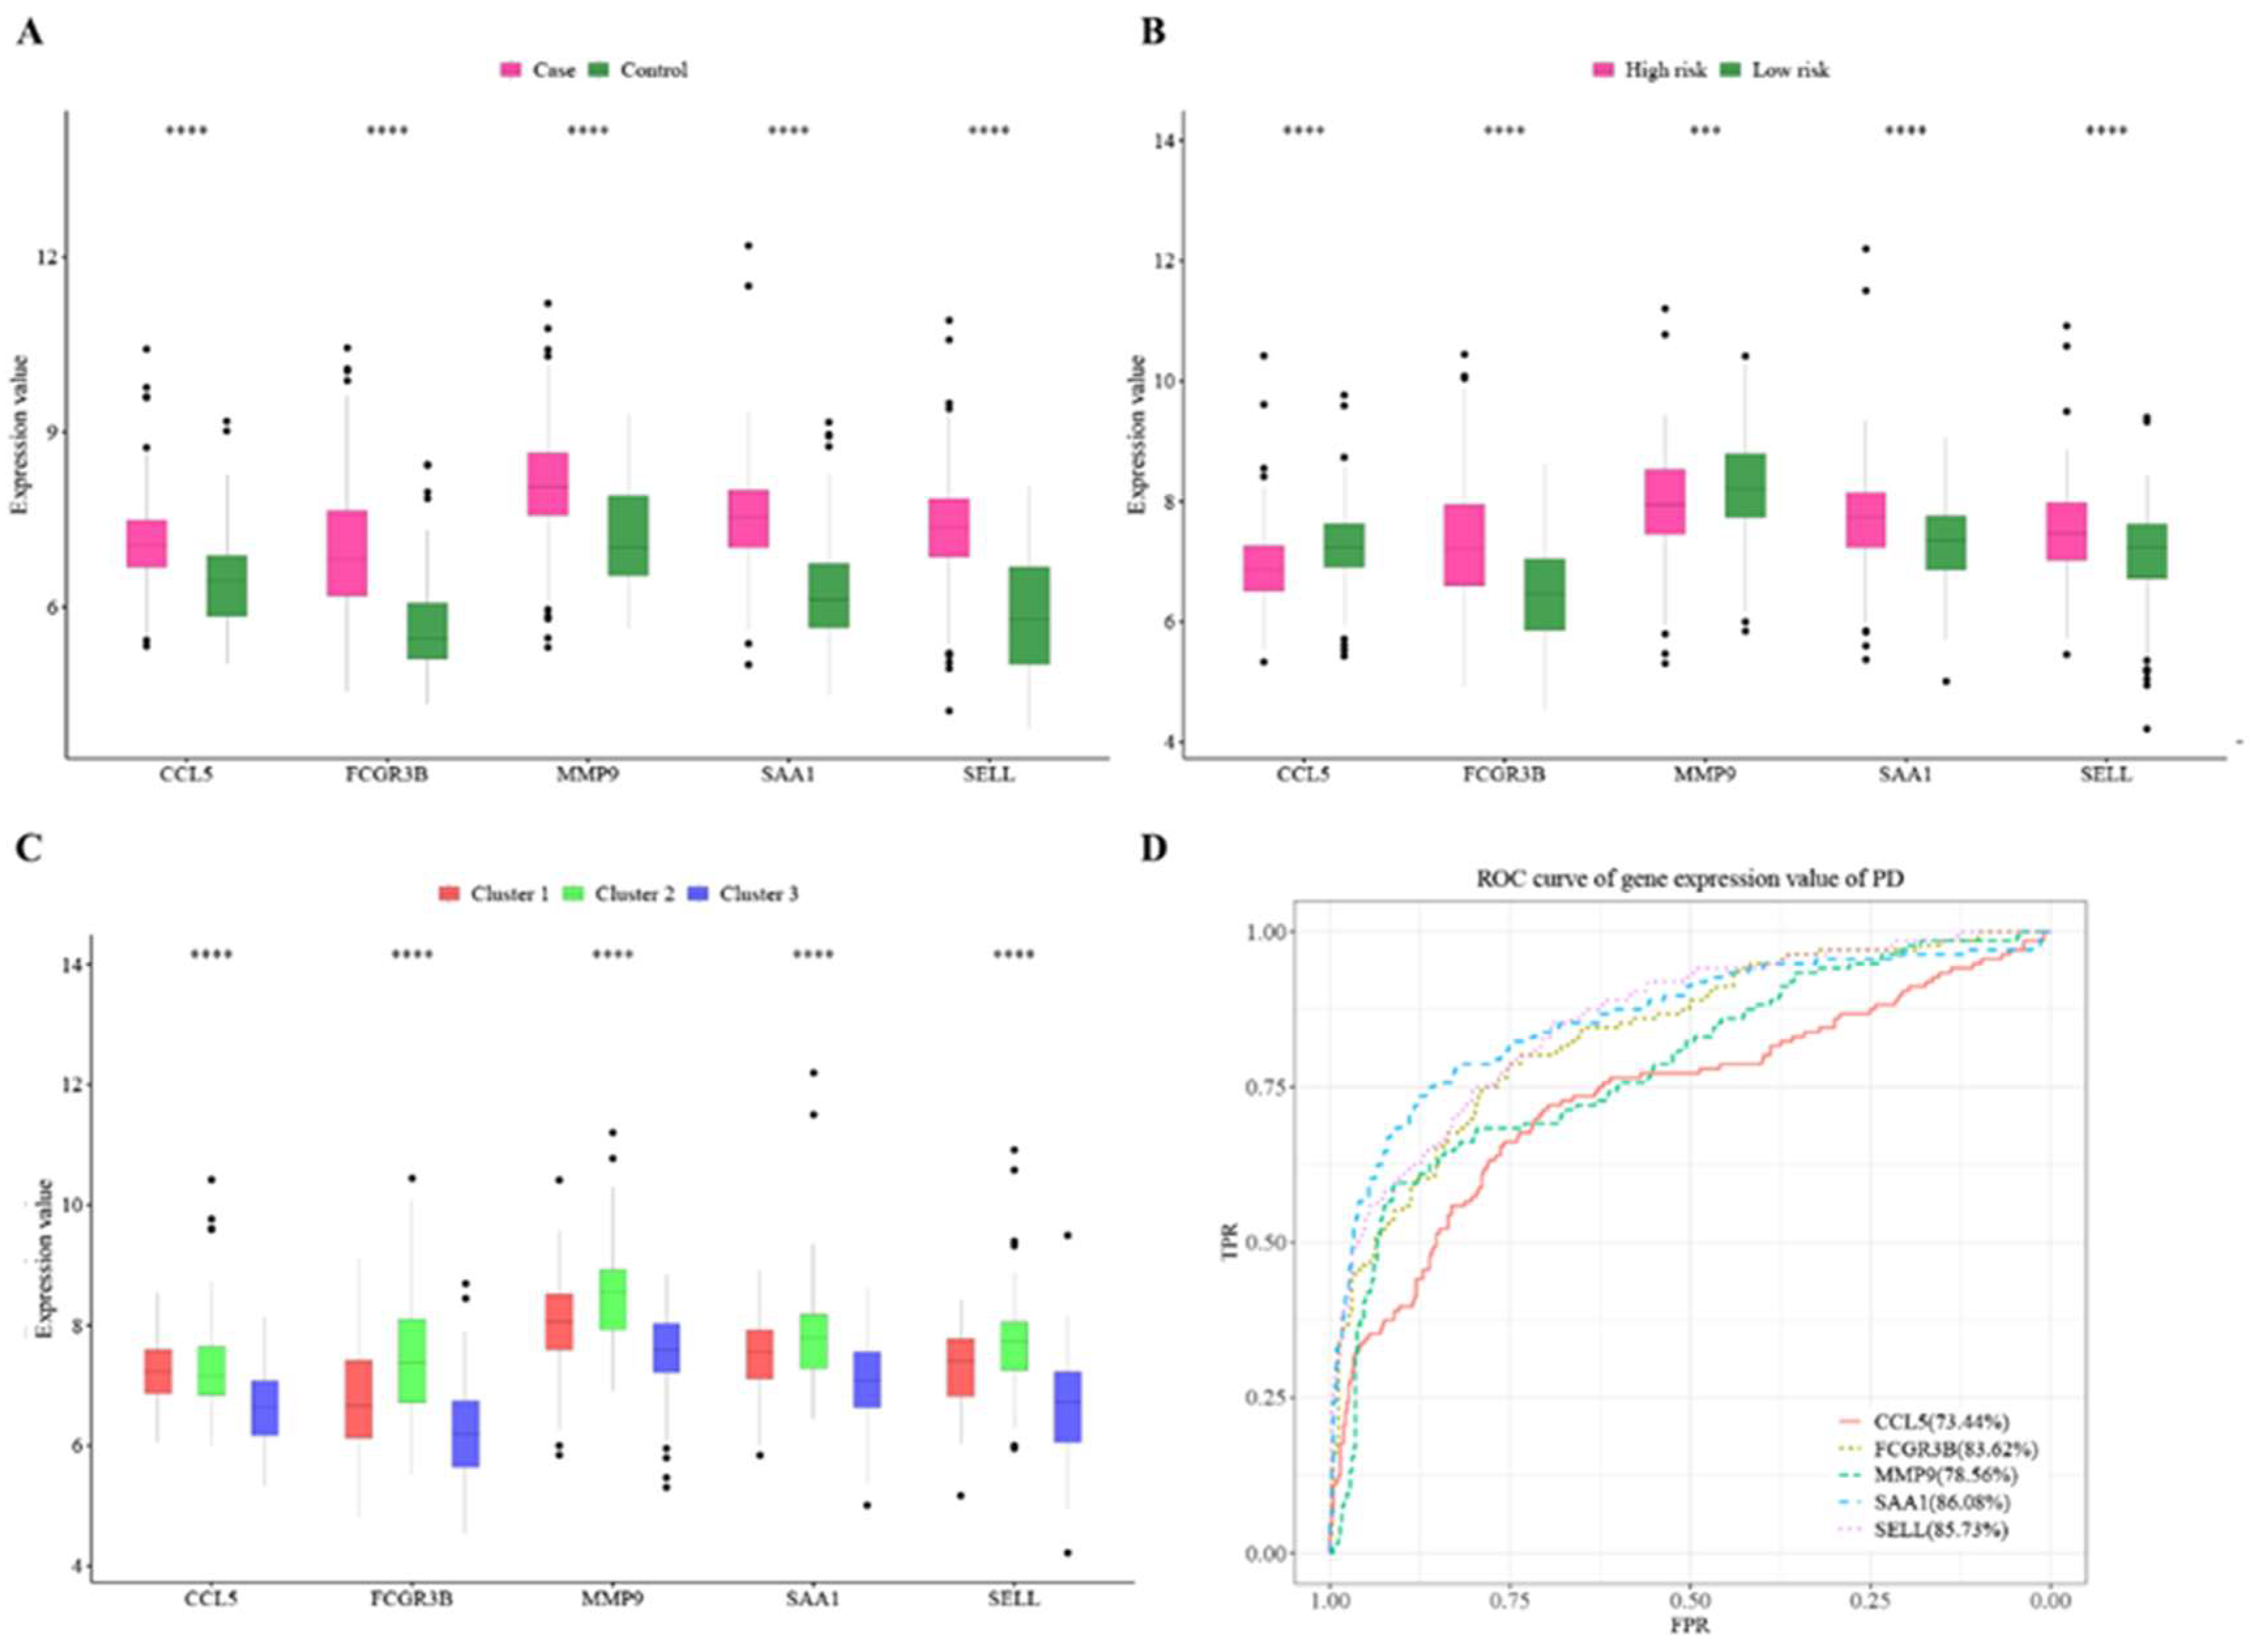
3.5. Hub Cross-Talk Gene Screening
3.6. Prediction of Cluster Risk Based on Hub Cross-Talk Genes
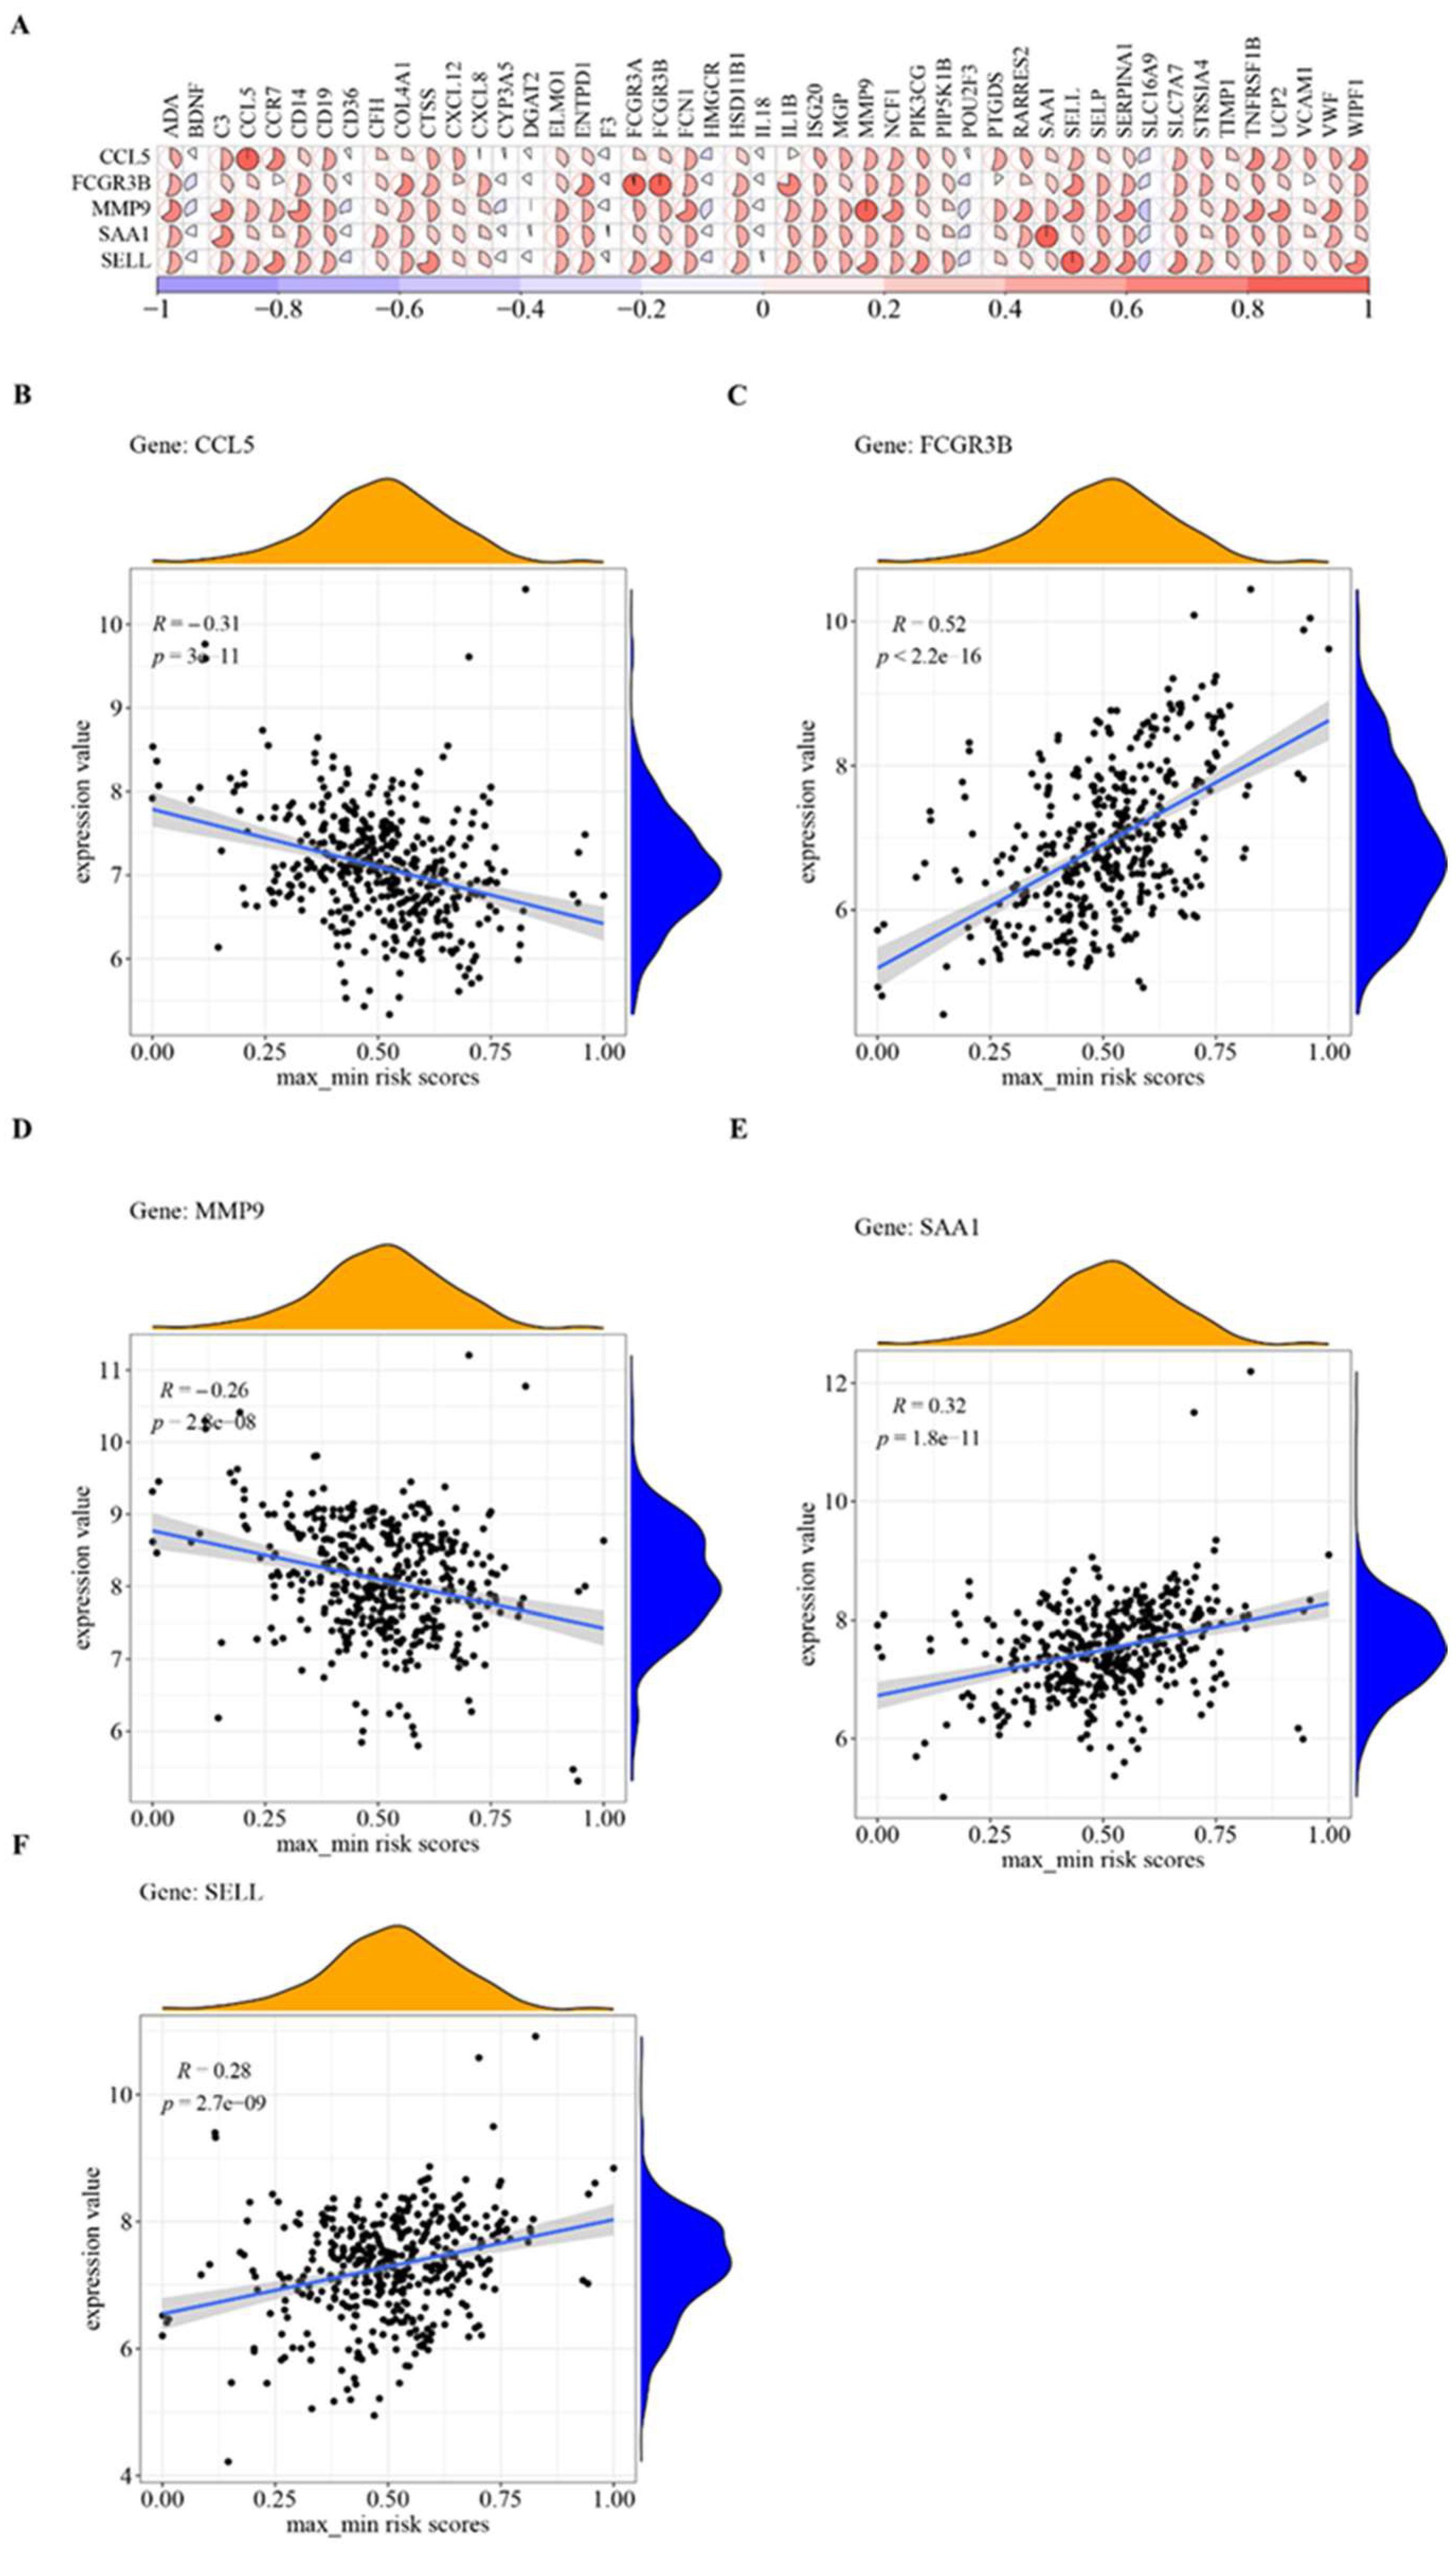
3.7. Hub Cross-Talk Genes
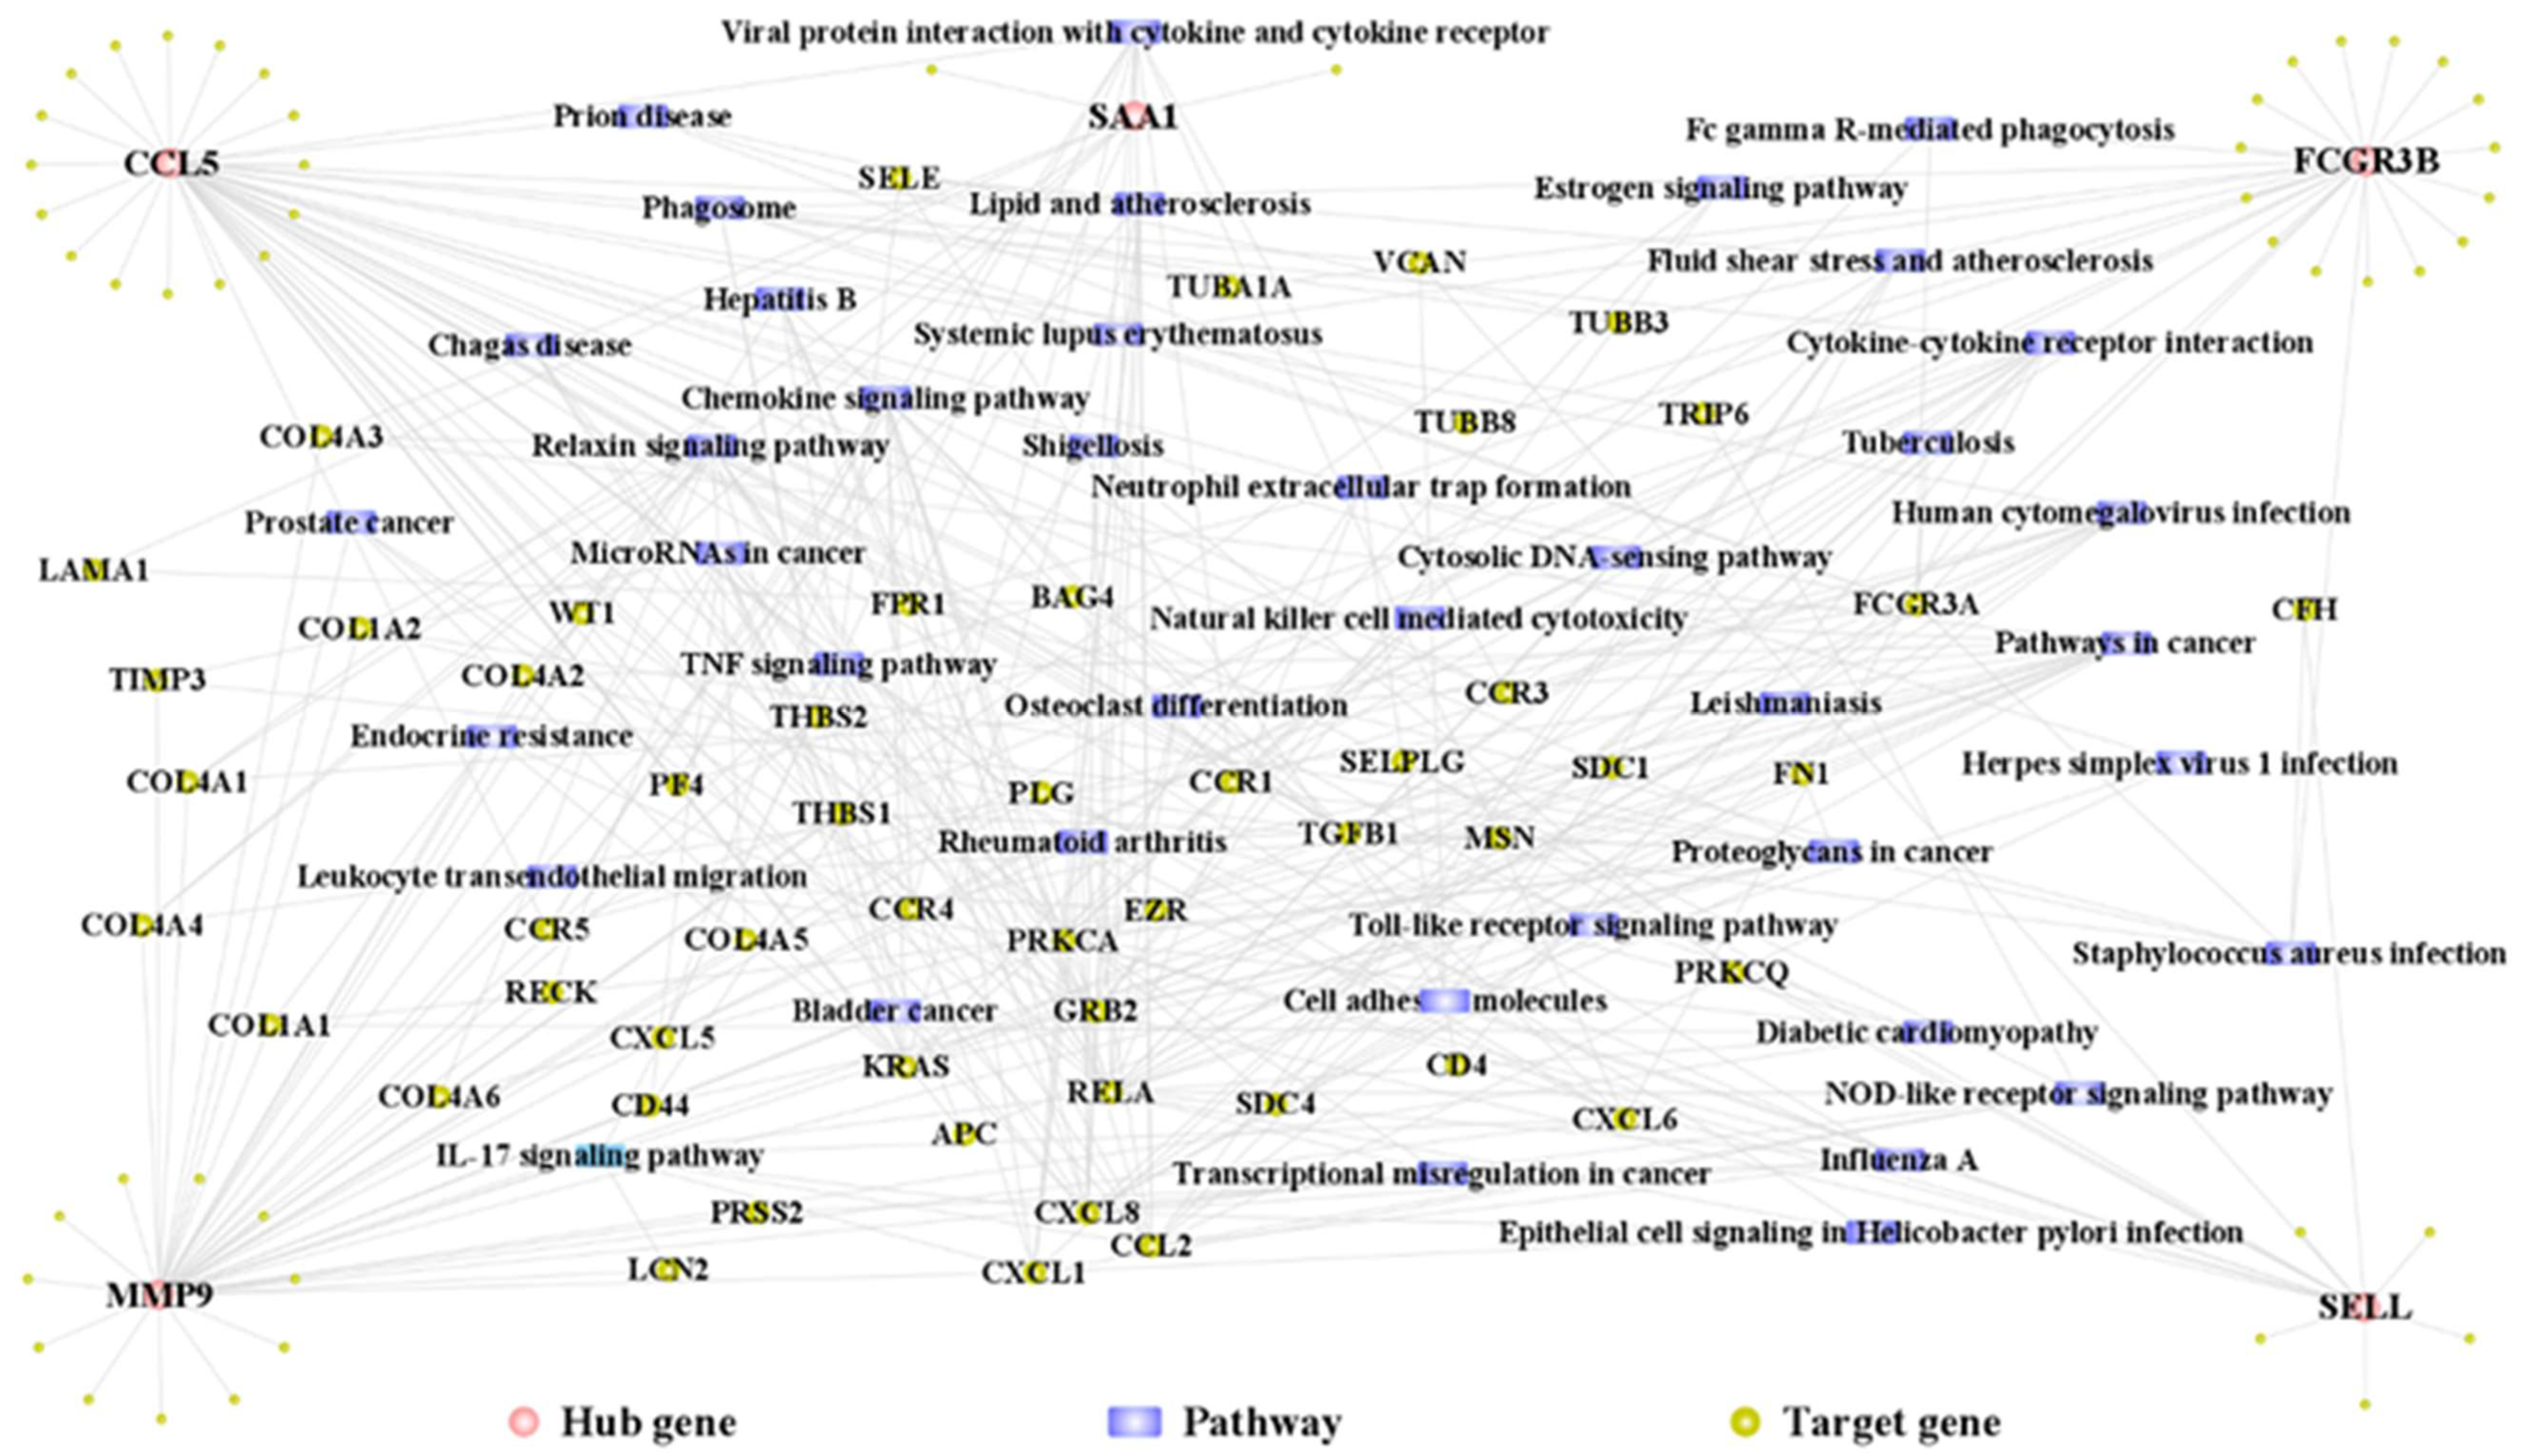
3.8. Hub Gene PPI Network and Pathway Network
4. Discussion
5. Conclusions
Author Contributions
Funding
Institutional Review Board Statement
Informed Consent Statement
Data Availability Statement
Conflicts of Interest
References
- Kinane, D.F.; Stathopoulou, P.G.; Papapanou, P.N. Periodontal diseases. Nat. Rev. Dis. Prim. 2017, 3, 17038. [Google Scholar] [CrossRef]
- Hajishengallis, G.; Chavakis, T. Local and systemic mechanisms linking periodontal disease and inflammatory comorbidities. Nat. Rev. Immunol. 2021, 21, 426–440. [Google Scholar] [CrossRef]
- Serni, L.; Caroti, L.; Barbato, L.; Nieri, M.; Serni, S.; Cirami, C.L.; Cairo, F. Association between chronic kidney disease and periodontitis. A systematic review and metanalysis. Oral Dis. 2021, 29, 40–50. [Google Scholar] [CrossRef]
- Schmalz, G.; Schiffers, N.; Schwabe, S.; Vasko, R.; Müller, G.A.; Haak, R.; Mausberg, R.F.; Ziebolz, D. Dental and periodontal health, and microbiological and salivary conditions in patients with or without diabetes undergoing haemodialysis. Int. Dent. J. 2017, 67, 186–193. [Google Scholar] [CrossRef] [PubMed]
- Parsegian, K.; Randall, D.; Curtis, M.; Ioannidou, E. Association between periodontitis and chronic kidney disease. Periodontology 2022, 89, 114–124. [Google Scholar] [CrossRef] [PubMed]
- Schmalz, G.; Dietl, M.; Vasko, R.; Muller, G.; Rothermund, L.; Keller, F.; Ziebolz, D.; Rasche, F. Dialysis vintage time has the strongest correlation to psychosocial pattern of oral health-related quality of life—A multicentre cross-sectional study. Med. Oral Patol. Oral Cir. Bucal. 2018, 23, e698–e706. [Google Scholar] [CrossRef]
- Schmalz, G.; Patschan, S.; Patschan, D.; Ziebolz, D. Oral health-related quality of life in adult patients with end-stage kidney diseases undergoing renal replacement therapy—A systematic review. BMC Nephrol. 2020, 21, 154. [Google Scholar] [CrossRef] [PubMed]
- Li, L.; Zhang, Y.-L.; Liu, X.-Y.; Meng, X.; Zhao, R.-Q.; Ou, L.-L.; Li, B.-Z.; Xing, T. Periodontitis Exacerbates and Promotes the Progression of Chronic Kidney Disease Through Oral Flora, Cytokines, and Oxidative Stress. Front. Microbiol. 2021, 12, 656372. [Google Scholar] [CrossRef] [PubMed]
- Yang, J.; Chen, T.; Zhu, Y.; Bai, M.; Li, X. Causal Inference Between Chronic Periodontitis and Chronic Kidney Disease: A Bidirectional Mendelian Randomization Analysis in a European Population. Front. Genet. 2021, 12, 676136. [Google Scholar] [CrossRef]
- Hickey, N.; Shalamanova, L.; Whitehead, K.A.; Dempsey-Hibbert, N.; Van Der Gast, C.; Taylor, R.L. Exploring the putative interactions between chronic kidney disease and chronic periodontitis. Crit. Rev. Microbiol. 2020, 46, 61–77. [Google Scholar] [CrossRef]
- Shimizu, Y.; Yamanashi, H.; Kitamura, M.; Miyata, J.; Nonaka, F.; Nakamichi, S.; Saito, T.; Nagata, Y.; Maeda, T. Association between periodontitis and chronic kidney disease by functional atherosclerosis status among older Japanese individuals: A cross-sectional study. J. Clin. Periodontol. 2022, 50, 430–439. [Google Scholar] [CrossRef] [PubMed]
- Sharma, P.; Dietrich, T.; Ferro, C.J.; Cockwell, P.; Chapple, I.L. Association between periodontitis and mortality in stages 3–5 chronic kidney disease: NHANES III and linked mortality study. J. Clin. Periodontol. 2016, 43, 104–113. [Google Scholar] [CrossRef] [PubMed] [Green Version]
- Li, S.; Liu, X.; Zhou, Y.; Acharya, A.; Savkovic, V.; Xu, C.; Wu, N.; Deng, Y.; Hu, X.; Li, H.; et al. Shared genetic and epigenetic mechanisms between chronic periodontitis and oral squamous cell carcinoma. Oral Oncol. 2018, 86, 216–224. [Google Scholar] [CrossRef] [PubMed] [Green Version]
- Ning, W.; Ma, Y.; Li, S.; Wang, X.; Pan, H.; Wei, C.; Zhang, S.; Bai, D.; Liu, X.; Deng, Y.; et al. Shared Molecular Mechanisms between Atherosclerosis and Periodontitis by Analyzing the Transcriptomic Alterations of Peripheral Blood Monocytes. Comput. Math. Methods Med. 2021, 2021, 1498431. [Google Scholar] [CrossRef] [PubMed]
- Liu, S.; Fu, Y.; Ziebolz, D.; Li, S.; Schmalz, G.; Li, F. Transcriptomic analysis reveals pathophysiological relationship between chronic obstructive pulmonary disease (COPD) and periodontitis. BMC Med Genom. 2022, 15, 130. [Google Scholar] [CrossRef]
- Kitamura, M.; Mochizuki, Y.; Miyata, Y.; Obata, Y.; Mitsunari, K.; Matsuo, T.; Ohba, K.; Mukae, H.; Yoshimura, A.; Nishino, T.; et al. Pathological Characteristics of Periodontal Disease in Patients with Chronic Kidney Disease and Kidney Transplantation. Int. J. Mol. Sci. 2019, 20, 3413. [Google Scholar] [CrossRef] [Green Version]
- Schmalz, G.; Hübscher, A.E.; Angermann, H.; Schmidt, J.; Schmickler, J.; Legler, T.J.; Ziebolz, D. High prevalence of periodontitis in blood donors and the possibility of questionnaire-based screening—Results of a cross-sectional study. Transfus. Med. 2019, 29, 394–400. [Google Scholar] [CrossRef]
- Zeng, Z.; Lan, T.; Wei, Y.; Wei, X. CCL5/CCR5 axis in human diseases and related treatments. Genes Dis. 2022, 9, 12–27. [Google Scholar] [CrossRef]
- Shih, Y.-S.; Fu, E.; Fu, M.M.; Lin, F.-G.; Chiu, H.-C.; Shen, E.-C.; Chiang, C.-Y. Association of CCL5 and CCR5 Gene Polymorphisms With Periodontitis in Taiwanese. J. Periodontol. 2014, 85, 1596–1602. [Google Scholar] [CrossRef]
- Jiang, Z.; Shi, Y.; Zhao, W.; Zhou, L.; Zhang, B.; Xie, Y.; Zhang, Y.; Tan, G.; Wang, Z. Association between chronic periodontitis and the risk of Alzheimer’s disease: Combination of text mining and GEO dataset. BMC Oral Health 2021, 21, 466. [Google Scholar] [CrossRef]
- Repeke, C.E.; Ferreira, S.B.; Claudino, M.; Silveira, E.M.; de Assis, G.F.; Avila-Campos, M.J.; Silva, J.S.; Garlet, G.P. Evidences of the cooperative role of the chemokines CCL3, CCL4 and CCL5 and its receptors CCR1+ and CCR5+ in RANKL+ cell migration throughout experimental periodontitis in mice. Bone 2010, 46, 1122–1130. [Google Scholar] [CrossRef] [PubMed]
- Wallquist, C.; Mansouri, L.; Norrbäck, M.; Hylander, B.; Jacobson, S.H.; Larsson, T.E.; Lundahl, J. Associations of Fibroblast Growth Factor 23 with Markers of Inflammation and Leukocyte Transmigration in Chronic Kidney Disease. Nephron 2018, 138, 287–295. [Google Scholar] [CrossRef] [PubMed] [Green Version]
- Qiu, Y.; Cao, Y.; Tu, G.; Li, J.; Su, Y.; Fang, F.; Zhang, X.; Cang, J.; Rong, R.; Luo, Z. Myeloid-Derived Suppressor Cells Alleviate Renal Fibrosis Progression via Regulation of CCL5-CCR5 Axis. Front. Immunol. 2021, 12, 698894. [Google Scholar] [CrossRef] [PubMed]
- Böger, C.A.; Fischereder, M.; Deinzer, M.; Aslanidis, C.; Schmitz, G.; Stubanus, M.; Banas, B.; Krüger, B.; Riegger, G.A.; Krämer, B.K. RANTES gene polymorphisms predict all-cause and cardiac mortality in type 2 diabetes mellitus hemodialysis patients. Atherosclerosis 2005, 183, 121–129. [Google Scholar] [CrossRef] [PubMed]
- Lee, Y.H.; Bae, S.-C.; Seo, Y.H.; Kim, J.-H.; Choi, S.J.; Ji, J.D.; Song, G.G. Association between FCGR3B copy number variations and susceptibility to autoimmune diseases: A meta-analysis. Inflamm. Res. 2015, 64, 983–991. [Google Scholar] [CrossRef]
- Song, G.G.; Lee, Y.H. Associations between FCGR2A rs1801274, FCGR3A rs396991, FCGR3B NA1/NA2 polymorphisms and periodontitis: A meta-analysis. Mol. Biol. Rep. 2013, 40, 4985–4993. [Google Scholar] [CrossRef]
- Zhang, Z.; Zheng, Y.; Bian, X.; Wang, M.; Chou, J.; Liu, H.; Wang, Z. Identification of Key Genes and Pathways Associated with Oxidative Stress in Periodontitis. Oxidative Med. Cell. Longev. 2022, 2022, 9728172. [Google Scholar] [CrossRef]
- Arnold, M.L.; Kainz, A.; Hidalgo, L.G.; Eskandary, F.; Kozakowski, N.; Wahrmann, M.; Haslacher, H.; Oberbauer, R.; Heilos, A.; Spriewald, B.M.; et al. Functional Fc γ receptor gene polymorphisms and donor-specific antibody-triggered microcirculation inflammation. Am. J. Transplant. 2018, 18, 2261–2273. [Google Scholar] [CrossRef] [Green Version]
- Kanamaru, Y.; Nakao, A.; Shirato, I.; Okumura, K.; Ogawa, H.; Tomino, Y.; Ra, C. Chronic Graft-versus-Host Autoimmune Disease in Fc Receptor γ chain-deficient Mice Results in Lipoprotein Glomerulopathy. J. Am. Soc. Nephrol. 2002, 13, 1527–1533. [Google Scholar] [CrossRef] [Green Version]
- Vandooren, J.; van den Steen, P.E.; Opdenakker, G. Biochemistry and molecular biology of gelatinase B or matrix metalloproteinase-9 (MMP-9): The next decade. Crit. Rev. Biochem. Mol. Biol. 2013, 48, 222–272. [Google Scholar] [CrossRef]
- Isola, G.; Polizzi, A.; Ronsivalle, V.; Alibrandi, A.; Palazzo, G.; Giudice, A.L. Impact of Matrix Metalloproteinase-9 during Periodontitis and Cardiovascular Diseases. Molecules 2021, 26, 1777. [Google Scholar] [CrossRef]
- Li, X.; Lu, J.; Teng, W.; Zhao, C.; Ye, X. Quantitative Evaluation of MMP-9 and TIMP-1 Promoter Methylation in Chronic Periodontitis. DNA Cell Biol. 2018, 37, 168–173. [Google Scholar] [CrossRef] [PubMed]
- Kim, H.; Kim, S.; Jeon, S.; Kim, S.; Cho, H.; Choi, Y. Diagnostic and Prognostic ability of salivary MMP-9 and S100A8 for periodontitis. J. Clin. Periodontol. 2020, 47, 1191–1200. [Google Scholar] [CrossRef] [PubMed]
- Cheng, Z.; Limbu, M.H.; Wang, Z.; Liu, J.; Liu, L.; Zhang, X.; Chen, P.; Liu, B. MMP-2 and 9 in Chronic Kidney Disease. Int. J. Mol. Sci. 2017, 18, 776. [Google Scholar] [CrossRef] [Green Version]
- Rašić, S.; Rebić, D.; Hasić, S.; Rašić, I.; Šarac, M.D. Influence of Malondialdehyde and Matrix Metalloproteinase-9 on Progression of Carotid Atherosclerosis in Chronic Renal Disease with Cardiometabolic Syndrome. Mediat. Inflamm. 2015, 2015, 614357. [Google Scholar] [CrossRef] [PubMed] [Green Version]
- Sack, G.H. Serum Amyloid A (SAA) Proteins. Subcell Biochem. 2020, 94, 421–436. [Google Scholar] [CrossRef]
- Kim, Y.-G.; Kim, M.; Kang, J.H.; Kim, H.J.; Park, J.-W.; Lee, J.-M.; Suh, J.-Y.; Kim, J.-Y.; Lee, Y. Transcriptome sequencing of gingival biopsies from chronic periodontitis patients reveals novel gene expression and splicing patterns. Hum. Genom. 2016, 10, 28. [Google Scholar] [CrossRef] [Green Version]
- Gonzalez, O.; Kirakodu, S.; Novak, M.; Stromberg, A.; Orraca, L.; Gonzalez-Martinez, J.; Burgos, A.; Ebersole, J. Comparative analysis of microbial sensing molecules in mucosal tissues with aging. Immunobiology 2018, 223, 279–287. [Google Scholar] [CrossRef] [Green Version]
- Zhang, F.; Zhou, X.; Zou, H.; Liu, L.; Li, X.; Ruan, Y.; Xie, Y.; Shi, M.; Xiao, Y.; Wang, Y.; et al. SAA1 is transcriptionally activated by STAT3 and accelerates renal interstitial fibrosis by inducing endoplasmic reticulum stress. Exp. Cell Res. 2021, 408, 112856. [Google Scholar] [CrossRef] [PubMed]
- Kelly, K.J.; Kluve-Beckerman, B.; Zhang, J.; Dominguez, J.H. Intravenous cell therapy for acute renal failure with serum amyloid A protein-reprogrammed cells. Am. J. Physiol. Physiol. 2010, 299, F453–F464. [Google Scholar] [CrossRef]
- Kelly, K.J.; Zhang, J.; Han, L.; Wang, M.; Zhang, S.; Dominguez, J.H. Intravenous renal cell transplantation with SAA1-positive cells prevents the progression of chronic renal failure in rats with ischemic-diabetic nephropathy. Am. J. Physiol. Physiol. 2013, 305, F1804–F1812. [Google Scholar] [CrossRef] [Green Version]
- Shao, B.; de Boer, I.; Tang, C.; Mayer, P.S.; Zelnick, L.; Afkarian, M.; Heinecke, J.W.; Himmelfarb, J. A Cluster of Proteins Implicated in Kidney Disease Is Increased in High-Density Lipoprotein Isolated from Hemodialysis Subjects. J. Proteome Res. 2015, 14, 2792–2806. [Google Scholar] [CrossRef] [Green Version]
- Holzer, M.; Birner-Gruenberger, R.; Stojakovic, T.; El-Gamal, D.; Binder, V.; Wadsack, C.; Heinemann, A.; Marsche, G. Uremia Alters HDL Composition and Function. J. Am. Soc. Nephrol. 2011, 22, 1631–1641. [Google Scholar] [CrossRef] [PubMed] [Green Version]
- Malinowski, D.; Zawadzka, M.; Safranow, K.; Droździk, M.; Pawlik, A. SELL and GUCY1A1 Gene Polymorphisms in Patients with Unstable Angina. Biomedicines 2022, 10, 2494. [Google Scholar] [CrossRef]
- Macey, M.G.; McCarthy, D.A.; Howells, G.L.; Curtis, M.A.; King, G.; Newland, A.C. Multiparameter flow cytometric analysis of polymorphonuclear leucocytes in whole blood from patients with adult rapidly progressive periodontitis reveals low expression of the adhesion molecule L-selectin (Cd62L). Cytometry 1998, 34, 152–158. [Google Scholar] [CrossRef]
- Krugluger, W.; Nell, A.; Solar, P.; Matejka, M.; Boltz-Nitulescu, G. Influence of sE-selectin and L-selectin on the regulation of cell migration during chronic periodontitis. J. Periodontal Res. 1995, 30, 198–203. [Google Scholar] [CrossRef]
- Watanabe, Y.; Inoue, T.; Okada, H.; Kotaki, S.; Kanno, Y.; Kikuta, T.; Suzuki, H. Impact of Selectin Gene Polymorphisms on Rapid Progression to End-Stage Renal Disease in Patients with IgA Nephropathy. Intern. Med. 2006, 45, 947–951. [Google Scholar] [CrossRef] [PubMed] [Green Version]
- Rabb, H.; Postler, G. Leucocyte adhesion molecules in ischaemic renal injury: Kidney specific paradigms? Clin. Exp. Pharmacol. Physiol. 1998, 25, 286–291. [Google Scholar] [CrossRef] [PubMed]
- Geng, X.; Wang, W.; Feng, Z.; Liu, R.; Cheng, X.; Shen, W.; Dong, Z.; Cai, G.; Chen, X.; Hong, Q.; et al. Identification of key genes and pathways in diabetic nephropathy by bioinformatics analysis. J. Diabetes Investig. 2019, 10, 972–984. [Google Scholar] [CrossRef]
- Lalla, E.; Papapanou, P.N. Diabetes mellitus and periodontitis: A tale of two common interrelated diseases. Nat. Rev. Endocrinol. 2011, 7, 738–748. [Google Scholar] [CrossRef]
- Fabbri, L.M.; Rabe, K.F. From COPD to chronic systemic inflammatory syndrome? Lancet 2007, 370, 797–799. [Google Scholar] [CrossRef] [PubMed]
- Liu, J.; Zhang, B.; Zhu, G.; Liu, C.; Wang, S.; Zhao, Z. Discovering genetic linkage between periodontitis and type 1 diabetes: A bioinformatics study. Front. Genet. 2023, 14, 1147819. [Google Scholar] [CrossRef] [PubMed]
- Piñero, J.; Saüch, J.; Sanz, F.; Furlong, L.I. The DisGeNET cytoscape app: Exploring and visualizing disease genomics data. Comput. Struct. Biotechnol. J. 2021, 19, 2960–2967. [Google Scholar] [CrossRef] [PubMed]
- Li, S.; Zhou, C.; Xu, Y.; Wang, Y.; Li, L.; Pelekos, G.; Ziebolz, D.; Schmalz, G.; Qin, Z. Similarity and Potential Relation Between Periimplantitis and Rheumatoid Arthritis on Transcriptomic Level: Results of a Bioinformatics Study. Front. Immunol. 2021, 12, 702661. [Google Scholar] [CrossRef] [PubMed]


| Series | GSE10334 | GSE16134 | GSE23586 | |
|---|---|---|---|---|
| Periodontitis (PD) | Platform | GPL570 | ||
| Case sample | 183 | 241 | 3 | |
| Control sample | 64 | 69 | 3 | |
| Total sample | 247 | 310 | 6 | |
| Limma analysis | ||||
| |Log FC| | |Log FC| > 0.5 | |||
| p-value | p-value < 0.05 | |||
| DEG-up | 615 | 756 | 1873 | |
| DEG-down | 519 | 475 | 765 | |
| DEG-Total | 1134 | 1231 | 2638 | |
| Gene | Log FC | p-Value | ||||
|---|---|---|---|---|---|---|
| GSE10334 | GSE16134 | GSE23586 | GSE10334 | GSE16134 | GSE23586 | |
| ADA | 6.50 × 10⁻¹ | 7.46 × 10⁻¹ | 1.33 | 7.69 × 10⁻²¹ | 2.39 × 10⁻²⁸ | 3.20 × 10⁻² |
| C3 | 1.10 | 1.18 | 3.17 | 1.72 × 10⁻²⁴ | 1.54 × 10⁻³³ | 1.60 × 10⁻³ |
| CCL5 | 6.04 × 10⁻¹ | 6.47 × 10⁻¹ | 1.61 | 7.55 × 10⁻⁹ | 5.75 × 10⁻¹² | 4.68 × 10⁻² |
| CCR7 | 6.66 × 10⁻¹ | 6.36 × 10⁻¹ | 1.59 | 3.23 × 10⁻⁹ | 6.63 × 10⁻¹⁰ | 1.75 × 10⁻² |
| CD14 | 8.48 × 10⁻¹ | 9.50 × 10⁻¹ | 3.12 | 6.37 × 10⁻¹⁴ | 4.79 × 10⁻²¹ | 3.90 × 10⁻² |
| CD19 | 1.11 | 1.28 | 3.61 | 5.10 × 10⁻²³ | 1.06 × 10⁻²⁹ | 7.54 × 10⁻³ |
| CFH | 5.91 × 10⁻¹ | 5.86 × 10⁻¹ | 2.31 | 4.68 × 10⁻¹³ | 1.31 × 10⁻¹⁵ | 3.86 × 10⁻² |
| COL4A1 | 1.02 | 1.16 | 2.32 | 3.75 × 10⁻²¹ | 1.31 × 10⁻³¹ | 3.29 × 10⁻² |
| CTSS | 8.01 × 10⁻¹ | 8.91 × 10⁻¹ | 1.63 | 4.92 × 10⁻¹⁹ | 6.29 × 10⁻²⁸ | 3.68 × 10⁻² |
| CXCL12 | 9.27 × 10⁻¹ | 1.05 | 2.60 | 1.76 × 10⁻²⁰ | 1.42 × 10⁻²⁹ | 4.14 × 10⁻³ |
| CXCL8 | 1.27 | 1.20 | 2.91 | 3.76 × 10⁻¹² | 7.13 × 10⁻¹⁴ | 4.62 × 10⁻² |
| ELMO1 | 8.16 × 10⁻¹ | 9.14 × 10⁻¹ | 1.02 | 1.96 × 10⁻²⁵ | 6.66 × 10⁻³² | 4.81 × 10⁻² |
| ENTPD1 | 8.54 × 10⁻¹ | 1.02 | 1.64 | 2.58 × 10⁻²³ | 2.86 × 10⁻³³ | 1.45 × 10⁻² |
| FCGR3A | 1.09 | 1.21 | 3.78 | 3.00 × 10⁻¹¹ | 4.97 × 10⁻¹⁶ | 2.14 × 10⁻³ |
| FCGR3B | 1.21 | 1.27 | 3.28 | 9.16 × 10⁻¹⁶ | 2.54 × 10⁻²⁰ | 1.61 × 10⁻³ |
| FCN1 | 1.00 | 1.08 | 1.29 | 2.30 × 10⁻²¹ | 8.58 × 10⁻²⁹ | 3.49 × 10⁻² |
| HSD11B1 | 9.27 × 10⁻¹ | 9.58 × 10⁻¹ | 1.85 | 2.40 × 10⁻²² | 1.73 × 10⁻²⁹ | 2.07 × 10⁻² |
| IL1B | 1.05 | 1.01 | 1.92 | 2.04 × 10⁻¹⁶ | 3.57 × 10⁻¹⁸ | 1.19 × 10⁻² |
| ISG20 | 7.26 × 10⁻¹ | 8.74 × 10⁻¹ | 1.68 | 3.84 × 10⁻¹⁰ | 8.88 × 10⁻¹⁵ | 3.85 × 10⁻² |
| MGP | 5.95 × 10⁻¹ | 6.71 × 10⁻¹ | 2.19 | 1.59 × 10⁻¹³ | 4.12 × 10⁻²⁰ | 4.70 × 10⁻⁴ |
| MMP9 | 8.56 × 10⁻¹ | 9.19 × 10⁻¹ | 2.46 | 5.94 × 10⁻¹³ | 1.00 × 10⁻¹⁶ | 9.14 × 10⁻³ |
| NCF1 | 7.16 × 10⁻¹ | 8.27 × 10⁻¹ | 2.68 | 1.12 × 10⁻¹⁵ | 1.98 × 10⁻²⁰ | 6.67 × 10⁻³ |
| PIK3CG | 5.58 × 10⁻¹ | 6.23 × 10⁻¹ | 2.73 | 2.18 × 10⁻¹⁵ | 2.07 × 10⁻²⁰ | 2.67 × 10⁻² |
| PIP5K1B | 6.23 × 10⁻¹ | 7.19 × 10⁻¹ | 1.68 | 6.77 × 10⁻¹⁹ | 6.56 × 10⁻²⁴ | 6.55 × 10⁻³ |
| PTGDS | 8.20 × 10⁻¹ | 8.89 × 10⁻¹ | 1.93 | 7.83 × 10⁻¹³ | 1.82 × 10⁻¹⁶ | 1.26 × 10⁻² |
| RARRES2 | 8.46 × 10⁻¹ | 9.29 × 10⁻¹ | 2.12 | 1.44 × 10⁻²⁰ | 9.84 × 10⁻²⁸ | 9.29 × 10⁻³ |
| SAA1 | 1.24 | 1.23 | 3.90 | 1.58 × 10⁻²³ | 1.98 × 10⁻²⁹ | 1.71 × 10⁻² |
| SELL | 1.38 | 1.51 | 3.02 | 1.24 × 10⁻²³ | 3.62 × 10⁻³³ | 5.52 × 10⁻⁴ |
| SELP | 8.01 × 10⁻¹ | 8.34 × 10⁻¹ | 1.56 | 1.82 × 10⁻²⁶ | 1.72 × 10⁻³⁵ | 4.48 × 10⁻² |
| SERPINA1 | 5.78 × 10⁻¹ | 5.85 × 10⁻¹ | 1.42 | 2.20 × 10⁻²³ | 4.20 × 10⁻³⁰ | 3.61 × 10⁻² |
| SLC7A7 | 7.76 × 10⁻¹ | 8.67 × 10⁻¹ | 2.31 | 1.33 × 10⁻¹⁸ | 2.27 × 10⁻²⁴ | 1.11 × 10⁻² |
| ST8SIA4 | 5.70 × 10⁻¹ | 6.97 × 10⁻¹ | 1.59 | 3.84 × 10⁻¹⁶ | 5.58 × 10⁻²³ | 4.43 × 10⁻² |
| TIMP1 | 6.26 × 10⁻¹ | 7.30 × 10⁻¹ | 1.72 | 9.10 × 10⁻⁹ | 6.98 × 10⁻¹³ | 3.45 × 10⁻² |
| TNFRSF1B | 5.51 × 10⁻¹ | 6.22 × 10⁻¹ | 1.50 | 7.83 × 10⁻¹² | 1.30 × 10⁻¹⁶ | 1.30 × 10⁻³ |
| UCP2 | 7.46 × 10⁻¹ | 8.40 × 10⁻¹ | 1.54 | 1.88 × 10⁻¹⁴ | 2.37 × 10⁻²⁰ | 2.18 × 10⁻² |
| VCAM1 | 5.95 × 10⁻¹ | 7.02 × 10⁻¹ | 1.94 | 7.10 × 10⁻⁹ | 1.13 × 10⁻¹³ | 2.28 × 10⁻² |
| VWF | 5.35 × 10⁻¹ | 5.46 × 10⁻¹ | 2.14 | 2.46 × 10⁻²³ | 7.51 × 10⁻²⁷ | 2.95 × 10⁻² |
| WIPF1 | 5.80 × 10⁻¹ | 6.59 × 10⁻¹ | 1.92 | 3.55 × 10⁻²¹ | 3.85 × 10⁻³⁰ | 6.90 × 10⁻³ |
| BDNF | −5.09 × 10⁻¹ | −5.87 × 10⁻¹ | −1.55 | 2.20 × 10⁻¹⁸ | 1.25 × 10⁻²⁸ | 7.00 × 10⁻³ |
| CD36 | −6.54 × 10⁻¹ | −6.38 × 10⁻¹ | −1.42 | 2.57 × 10⁻¹⁴ | 4.02 × 10⁻¹⁶ | 6.56 × 10⁻³ |
| CYP3A5 | −8.03 × 10⁻¹ | −8.32 × 10⁻¹ | −1.29 | 3.17 × 10⁻¹⁹ | 3.92 × 10⁻²³ | 3.45 × 10⁻² |
| DGAT2 | −5.03 × 10⁻¹ | −5.23 × 10⁻¹ | −1.83 | 2.41 × 10⁻¹⁷ | 3.19 × 10⁻²¹ | 2.00 × 10⁻² |
| F3 | −5.31 × 10⁻¹ | −5.50 × 10⁻¹ | −1.25 | 3.53 × 10⁻⁹ | 3.76 × 10⁻¹¹ | 4.29 × 10⁻² |
| HMGCR | −8.73 × 10⁻¹ | −8.66 × 10⁻¹ | −1.92 | 9.71 × 10⁻²² | 6.44 × 10⁻²⁴ | 4.90 × 10⁻² |
| IL18 | −7.40 × 10⁻¹ | −7.46 × 10⁻¹ | −1.58 | 8.67 × 10⁻¹⁵ | 3.78 × 10⁻¹⁶ | 3.50 × 10⁻² |
| POU2F3 | −5.59 × 10⁻¹ | −5.42 × 10⁻¹ | −2.51 | 8.94 × 10⁻²⁴ | 1.25 × 10⁻²⁹ | 1.09 × 10⁻⁴ |
| SLC16A9 | −1.12 | −1.18 | −3.33 | 4.46 × 10⁻²² | 1.91 × 10⁻²⁶ | 1.32 × 10⁻² |
| Gene | Degree | ASPL | B C | C C | T C | Regulate |
|---|---|---|---|---|---|---|
| VCAM1 | 446 | 2.344697 | 0.770665 | 0.426494 | 0.004915 | up |
| NCF1 | 49 | 3.736742 | 0.078767 | 0.267613 | 0.035714 | up |
| SERPINA1 | 43 | 3.720644 | 0.08476 | 0.268771 | 0.051163 | up |
| C3 | 37 | 3.535038 | 0.07269 | 0.282882 | 0.038038 | up |
| CCL5 | 34 | 3.441288 | 0.065354 | 0.290589 | 0.039642 | up |
| PIK3CG | 33 | 3.628788 | 0.053927 | 0.275574 | 0.046832 | up |
| WIPF1 | 33 | 3.543561 | 0.084819 | 0.282202 | 0.039627 | up |
| MMP9 | 32 | 4.431818 | 0.052143 | 0.225641 | 0.043586 | up |
| CD14 | 30 | 4.618371 | 0.055554 | 0.216527 | 0.033333 | up |
| HMGCR | 30 | 4.064394 | 0.05172 | 0.246039 | 0.055556 | down |
| TNFRSF1B | 29 | 4.044508 | 0.084218 | 0.247249 | 0.035632 | up |
| COL4A1 | 29 | 4.441288 | 0.049476 | 0.22516 | 0.043478 | up |
| CD19 | 25 | 3.616477 | 0.044886 | 0.276512 | 0.063333 | up |
| ADA | 21 | 3.657197 | 0.03425 | 0.273433 | 0.077922 | up |
| IL1B | 21 | 3.554924 | 0.049995 | 0.2813 | 0.068027 | up |
| PTGDS | 20 | 4.046402 | 0.029722 | 0.247133 | 0.075 | up |
| FCGR3B | 19 | 3.838068 | 0.029941 | 0.260548 | 0.068421 | up |
| UCP2 | 19 | 4.025568 | 0.041251 | 0.248412 | 0.084211 | up |
| CD36 | 19 | 3.679924 | 0.052201 | 0.271745 | 0.073227 | down |
| CFH | 18 | 3.405303 | 0.041513 | 0.29366 | 0.060847 | up |
| FCGR3A | 18 | 3.595644 | 0.036871 | 0.278114 | 0.07037 | up |
| VWF | 18 | 3.828598 | 0.031001 | 0.261192 | 0.079365 | up |
| ELMO1 | 17 | 5.481061 | 0.028221 | 0.182446 | 0.117647 | up |
| BDNF | 17 | 3.839015 | 0.033603 | 0.260483 | 0.066176 | down |
| FCN1 | 15 | 4.96875 | 0.023011 | 0.201258 | 0.066667 | up |
| SELL | 15 | 3.477273 | 0.028549 | 0.287582 | 0.088889 | up |
| HSD11B1 | 14 | 4.594697 | 0.023016 | 0.217642 | 0.071429 | up |
| CXCL12 | 10 | 3.697917 | 0.01378 | 0.270423 | 0.158333 | up |
| SELP | 10 | 4.05303 | 0.01282 | 0.246729 | 0.14 | up |
| TIMP1 | 10 | 4.071023 | 0.014054 | 0.245639 | 0.1 | up |
| F3 | 10 | 3.885417 | 0.017238 | 0.257373 | 0.116667 | down |
| CXCL8 | 9 | 3.692235 | 0.014482 | 0.270839 | 0.117117 | up |
| IL18 | 9 | 5.522727 | 0.013221 | 0.18107 | 0.222222 | down |
| SAA1 | 8 | 4.737689 | 0.005895 | 0.211073 | 0.144531 | up |
| CTSS | 8 | 5.995265 | 0.01322 | 0.166798 | 0.125 | up |
| CCR7 | 4 | 1 | 1 | 1 | 0 | up |
| SLC16A9 | 4 | 1 | 1 | 1 | 0 | down |
| PIP5K1B | 3 | 5.605114 | 0.003786 | 0.178409 | 0.333333 | up |
| CYP3A5 | 3 | 1 | 1 | 1 | 0 | down |
| SLC7A7 | 2 | 1 | 1 | 1 | 0 | up |
| ST8SIA4 | 2 | 5.831439 | 0.001894 | 0.171484 | 0.5 | up |
| DGAT2 | 2 | 4.117424 | 6.53 × 10⁻⁴ | 0.24287 | 0.666667 | down |
| POU2F3 | 2 | 1 | 1 | 1 | 0 | down |
| ENTPD1 | 1 | 1 | 0 | 1 | 0 | up |
| MGP | 1 | 1 | 0 | 1 | 0 | up |
Disclaimer/Publisher’s Note: The statements, opinions and data contained in all publications are solely those of the individual author(s) and contributor(s) and not of MDPI and/or the editor(s). MDPI and/or the editor(s) disclaim responsibility for any injury to people or property resulting from any ideas, methods, instructions or products referred to in the content. |
© 2023 by the authors. Licensee MDPI, Basel, Switzerland. This article is an open access article distributed under the terms and conditions of the Creative Commons Attribution (CC BY) license (https://creativecommons.org/licenses/by/4.0/).
Share and Cite
Ren, D.; Ebert, T.; Kreher, D.; Ernst, B.L.V.; de Fallois, J.; Schmalz, G. The Genetic Cross-Talk between Periodontitis and Chronic Kidney Failure Revealed by Transcriptomic Analysis. Genes 2023, 14, 1374. https://doi.org/10.3390/genes14071374
Ren D, Ebert T, Kreher D, Ernst BLV, de Fallois J, Schmalz G. The Genetic Cross-Talk between Periodontitis and Chronic Kidney Failure Revealed by Transcriptomic Analysis. Genes. 2023; 14(7):1374. https://doi.org/10.3390/genes14071374
Chicago/Turabian StyleRen, Dandan, Thomas Ebert, Deborah Kreher, Bero Luke Vincent Ernst, Jonathan de Fallois, and Gerhard Schmalz. 2023. "The Genetic Cross-Talk between Periodontitis and Chronic Kidney Failure Revealed by Transcriptomic Analysis" Genes 14, no. 7: 1374. https://doi.org/10.3390/genes14071374