Article

Identifying Genetic Architecture of Carcass and Meat Quality Traits in a Ningxiang Indigenous Pig Population

1
College of Animal Science and Technology, Hunan Agricultural University, Changsha 410128, China
2
Laboratory of Animal Nutrition Physiology and Metabolism, The Chinese Academy of Sciences, The Institute of Subtropical Agriculture, Changsha 410128, China
3
Center of Ningxiang Animal Husbandry and Fishery Affairs, Ningxiang 410625, China
4
College of Animal Science and Technology, China Agricultural University, Beijing 100091, China
*
Authors to whom correspondence should be addressed.
Genes 2023, 14(7), 1308; https://doi.org/10.3390/genes14071308
Submission received: 11 May 2023 / Revised: 16 June 2023 / Accepted: 19 June 2023 / Published: 21 June 2023
(This article belongs to the Special Issue Genetics and Genomics of Pig Breeding)

Abstract

:
Ningxiang pig is a breed renowned for its exceptional meat quality, but it possesses suboptimal carcass traits. To elucidate the genetic architecture of meat quality and carcass traits in Ningxiang pigs, we assessed heritability and executed a genome-wide association study (GWAS) concerning carcass length, backfat thickness, meat color parameters (L.LD, a.LD, b.LD), and pH at two postmortem intervals (45 min and 24 h) within a Ningxiang pig population. Heritability estimates ranged from moderate to high (0.30~0.80) for carcass traits and from low to high (0.11~0.48) for meat quality traits. We identified 21 significant SNPs, the majority of which were situated within previously documented QTL regions. Furthermore, the GRM4 gene emerged as a pleiotropic gene that correlated with carcass length and backfat thickness. The ADGRF1, FKBP5, and PRIM2 genes were associated with carcass length, while the NIPBL gene was linked to backfat thickness. These genes hold the potential for use in selective breeding programs targeting carcass traits in Ningxiang pigs.

1. Introduction

Carcass and meat quality traits are of paramount economic significance in the livestock industry. Carcass traits encompass backfat thickness (BFT), carcass length (CL), and other traits. Generally speaking, elevated body size in length and height is associated with heightened meat production. Compared to imported commercial breeds, most indigenous Chinese breeds exhibit smaller body sizes and lower meat production [1]. However, Chinese indigenous pig breeds possess superior meat quality and fat deposition, outperforming imported or crossbred pigs [2,3]. Notably, meat color and intramuscular fat deposition directly influence consumer perception and exhibit moderate-to-high heritability [4,5]. Previous studies have reported that “acid meat”, PSE (pale, soft, and exudative), and DFD (dark, firm, and dry) meat are seldom observed in indigenous pigs [6,7,8]. Meat color, tenderness, and water loss rate undergo the most significant changes, with the breed and pre- and postslaughter management being the primary factors contributing to PSE and DFD in pork [9]. Research indicates that the pH, drip loss, and meat color (lightness, redness, yellowness) of indigenous pigs surpass those of commercial pigs. Genetically, a few major genes have been identified as being associated with inferior meat quality, such as the HALn gene (Halothane, or RYRI gene) and the RN (Renderment napole) gene, which profoundly impact PSE meat and acid meat [10,11].
The genetic architecture characterizes the phenotype alterations resulting from genetic variation, with specific research areas encompassing the number of variations impacting traits, population occurrence frequency, the genetic effect’s scope, and relationships with other genes (additive and interactive effects) or environmental factors [12,13]. Exploring the genetic architecture of complex quantitative traits aids in the detection of novel single-nucleotide polymorphisms (SNPs) or genes associated with these traits. A genome-wide association study (GWAS) represents a prevalent approach for comprehending the genetic architecture of quantitative traits and for discovering new genes. Prior research has identified numerous candidate genes associated with economic traits, such as carcass traits [14,15], meat quality traits [5,16], and reproductive traits [17,18]. While Ningxiang pig is renowned for its meat quality and disease resistance, it exhibits a suboptimal growth rate and lean meat percentage. Deciphering the genetic architecture of these economic traits could facilitate the genetic enhancement of Ningxiang pigs’ shortcomings while preserving their advantages through marker-assisted selection, ultimately benefiting the Ningxiang pig industry. In this study, we performed a GWAS on carcass and meat quality traits within a Ningxiang pig population, identifying several candidate genes related to these traits, which hold the potential for implementation in Ningxiang pig breeding programs.

2. Materials and Methods

2.1. Phenotypes and Genotyping

Phenotypic data were collected for Ningxiang pigs (n = 508, including 21 females and 487 males) that were slaughtered at a predetermined age (180 ± 5 days) from the Ningxiang Chu Weixiang Slaughterhouse and Meat Processing, LLC (Ningxiang, Hunan Province, China). Carcass traits included left half carcass weight (LW), carcass oblique length (COL), carcass length (CL), and backfat thickness (BFT), measured by the national technical regulation for testing of carcass traits in lean-type pig (NY/T 825-2004). Meat quality traits, such as three meat color parameters (L.LD, a.LD, b.LD) of longissimus dorsi (i.e., lightness, redness, and yellowness) at 45 min after slaughter and pH of longissimus dorsi at two postmortem time points (45 min and 24 h), were assessed following the national technical regulation for determination of pork quality (NY/T 821-2019). Detailed measurement results and methods for carcass and meat quality traits are presented in Table 1 and Table S1.
Genomic DNA was extracted from muscle tissue using standard phenol chloroform method, and the DNA was dissolved in TE buffer. The Nanodrop 2000 spectrophotometer was used to measure the concentration and purity of DNA samples. The samples with A260/280 ratio between 1.7~2.0 were genotyped using the GeneSeek Genomic Profiling (GGP) version 2 Porcine 50K SNP chip (Neogen Corporation, Lincoln, NE, USA), which comprises 50,697 SNP loci.

2.2. Genotype Imputation and Quality Control

To reduce the missing genotype rate, we employed Beagle5.4 software [19] to impute the missing genotypes. Subsequently, quality control was conducted using PLINK v1.9 [20] with the following criterion: (1) SNP call rate ≥ 90%; (2) minor allele frequency (MAF) ≥ 1%; (3) Hardy–Weinberg equilibrium (HWE) testing p-value ≤ 10−6; (4) on autosomes with known positions. After quality control, 537 and 14,812 SNPs were removed due to HWE and MAF thresholds, respectively. Additionally, 4197 SNPs located on the sex chromosome or with unknown chromosome positions were excluded. Ultimately, 31,106 SNPs distributed across 18 autosomes remained for association analysis (Figure S1). More details about the SNP distribution are presented in Table S2.

2.3. Statistical Method

2.3.1. Estimation of Genetic Parameters

The heritabilities and genetic correlations for the studied traits were estimated using the multiple-traits model of the HIBLUP software [21]. The model follows [21]:
y = X b + R r + i = 1 k Z i u i + e ; r ~ N 0 , I σ r 2 ; u i ~ N 0 , K i σ i 2 ; e ~ N ( 0 , I σ e 2 )
where y is the vector of phenotypic data; X and R are the design matrix for fixed effects (including covariates) and environmental random effects, respectively; b and r are the vector of corresponding and estimated effects. Zi is the design matrix for the i-th genetic random effect and ui is the vector of its responding genetic effects. Ki is the additive genetic relationship matrix, I is an identity matrix, and e is the vector of residual errors. The heritability (h2), genetic correlation (rA), and phenotypic correlation (rP) are calculated by σ a 2 σ a 2 + σ e 2 , C o v ( a 1 , a 2 ) σ a 1 2 σ a 2 2 , and C o v ( p 1 , p 2 ) σ p 1 2 σ p 2 2 , where σ a 2 and σ e 2 are the additive genetic variance and residual variance, respectively. Cov(a1, a2) is the additive effect covariance between a1 and a2 traits, and Cov(p1, p2) is the phenotypic covariance between p1 and p2 traits.

2.3.2. Principal Component Analysis

To avoid hidden population stratification causing false positives in GWAS, we used imputed genotypes to perform principal component analysis (PCA) with PLINK v1.9 (command: --pca). The results depicted in Figure S2 suggest that this population may have population stratification, and PCs need to be added for correction.

2.3.3. Genome-Wide Association Study

GWAS was conducted using the rMVP package [22]. Sex was treated as fixed effects, and CW and five PCs were treated as covariates. We assessed the association between phenotypes and each SNP across the genome under the following linear mixed model (MLM) [23,24]:
y = X b + Z a + u + e ; u ~ N ( 0 , G σ a 2 ) ; e ~ N ( 0 , I σ e 2 )
where y is a vector of phenotypic observations, b is a vector of fixed effects (included sex, CW, and 5 PCs), a is a vector of SNP effects; u is a vector of random polygenic effects with a covariance structure; e is a vector of residual errors. X, Z are the design matrix of fixed and SNP effects, respectively. σ a 2 and σ e 2 are additive genetic and residual variances, respectively. I is an identity matrix, and G is the genomic relationship matrix calculated by the following [25]:
G = Z D Z j = 1 k 2 p j ( 1 p j )
where Z is the matrix related to genotypes of each SNP (encoded 0, 1, 2 for AA, AB, and BB, respectively); D is a diagonal matrix of weights for SNP variance; k is the number of SNPs; pj is the minor allele frequency at j-th loci. The genome-wide and suggestive significant thresholds were 0.05/NSNP and 1/NSNP, respectively. The proportion of variance explained (PVE) by a SNP was defined as follows [26]:
P V E = 2 α ^ 2 M A F ( 1 M A F ) 2 α ^ 2 M A F ( 1 M A F ) + ( s e ( α ^ ) ) 2 2 N M A F ( 1 M A F )
where α ^ is the effect size for SNP marker, MAF is the minor allele frequency for SNP marker, s e ( α ^ ) is standard error of effect size for SNP marker, and N is the sample size.

2.4. Linkage Disequilibrium Analysis

To detect the linkage disequilibrium (LD) between significant SNPs, SNPs centering on each significant SNP was utilized to conduct LD analysis using the LDblockShow software (v 1.40) [27].

2.5. Candidate Genes Related to Significant SNPs

To identify candidate genes near the significant SNPs, we examined the annotated genes within a 500 kb radius round each SNP in the Sus scrofa 11.1 genome, using the biomaRt package (https://bioconductor.org/packages/3.15/bioc/html/biomaRt.html accessed on 5 July 2022). To annotate significant SNPs located in previously mapped QTLs in pigs, all QTL data in pigs were downloaded from the animal QTLdatabase. (https://www.animalgenome.org/cgi-bin/QTLdb/SS/download?file=gbpSS_11.1 accessed on 5 July 2022). Kyoto Encyclopedia of Genes and Genomes (KEGG) and Gene Ontology (GO) analyses were employed to identify related pathways. KEGG and GO analyses were performed using KOBAS [28] and AmiGO2 (http://amigo.geneontology.org/amigo/ accessed on 5 July 2022). To obtain more comprehensive gene enrichment results, we used the Homo Sapiens database for GO and KEGG pathway enrichment. The Benjamini–Hochberg procedure was used to correct the significance of the enriched terms, with p-adj < 0.05 as the significant threshold.

3. Results

3.1. Descriptive Statistics of Phenotypes

Descriptive statistics of carcass and meat quality traits of Ningxiang pigs are presented in Table 1. All phenotypic data conformed to the Gaussian distribution before GWAS (Figure S3). Substantial phenotypic variations were observed, with the coefficient of variation (CV) ranging from 4.74% to 41.75% for the eight traits.

3.2. Estimates of Genetic Parameters

The estimates of the heritabilities of these traits and the phenotypic and genetic correlations between them are shown in Table 2. In phenotype correlations, CL and COL were significantly negatively correlated with BFT (r = −0.12, p < −0.001; r = −0.16, p < −0.001), and except L.LD (lightness), carcass and meat color traits exhibited an extremely significant negative or positive correlation. L.LD only demonstrated a significant negative correlation with two pH traits, and positive correlations with a.LD and b.LD. BFT also exhibited a negative correlation with CL and COL in genetic correlations. CL showed a negative correlation with pH traits and a positive correlation with L.LD. In this study, the heritabilities (±SE) of carcass traits were moderate to high and ranged from 0.47 (±0.07) to 0.80 (±0.07), and meat quality traits demonstrated low-to-high heritability, ranging from 0.11 (±0.07) to 0.44 (±0.08).

3.3. GWAS Results and Gene Annotation

After quality control, 31,106 SNPs were available for subsequent GWAS. The average physical distance between two neighboring SNPs was approximately 71 kb and ranged from 55 kb (SSC7) to 82 kb (SSC1) (Table S2). Single-marker tests using MLM were performed to identify genetic markers associated with these traits at the genome-wide significant level (threshold = 0.05/31,106). The GWAS results are presented in Figure 1, Figure 2 and Figure S4, as well as Table 3 and Table S3. By adding five PCs as covariates, the Q-Q plots of p-values and the computed genomic inflation factors (λ) indicated no evidence of population stratification.

3.3.1. Carcass Trait

For CL and COL, 15 and 6 genome-wide significant SNPs were identified on SSC7, respectively (Table 3a). ALGA0040227 was the most significant SNP for CL and COL traits, contributing 14.35% and 8.38% to the phenotypic variance. Among all the significant SNPs, eight loci were intergenic (located within GRM4, MLIP, FKBP5, PRIM2, TINAG, and ZNF76, respectively). Additionally, the most significant SNPs were intron variants; a few belonged to unknown variants (INRA0024788, WU_10.2_7_48537179, and WU_10.2_7_36255497). For BFT, there were five genome-wide significant SNPs identified and distributed on SSC2, SSC7, SSC8, SSC16, and SSC18, respectively (Figure 1C), WU_10.2_18_56654365 was the most significant SNP, contributing 12.66% to the phenotypic variance. Two SNPs (WU_10.2_18_56654365, WU_10.2_16_23509998) were located within the HECW1 and NIPBL genes, respectively.

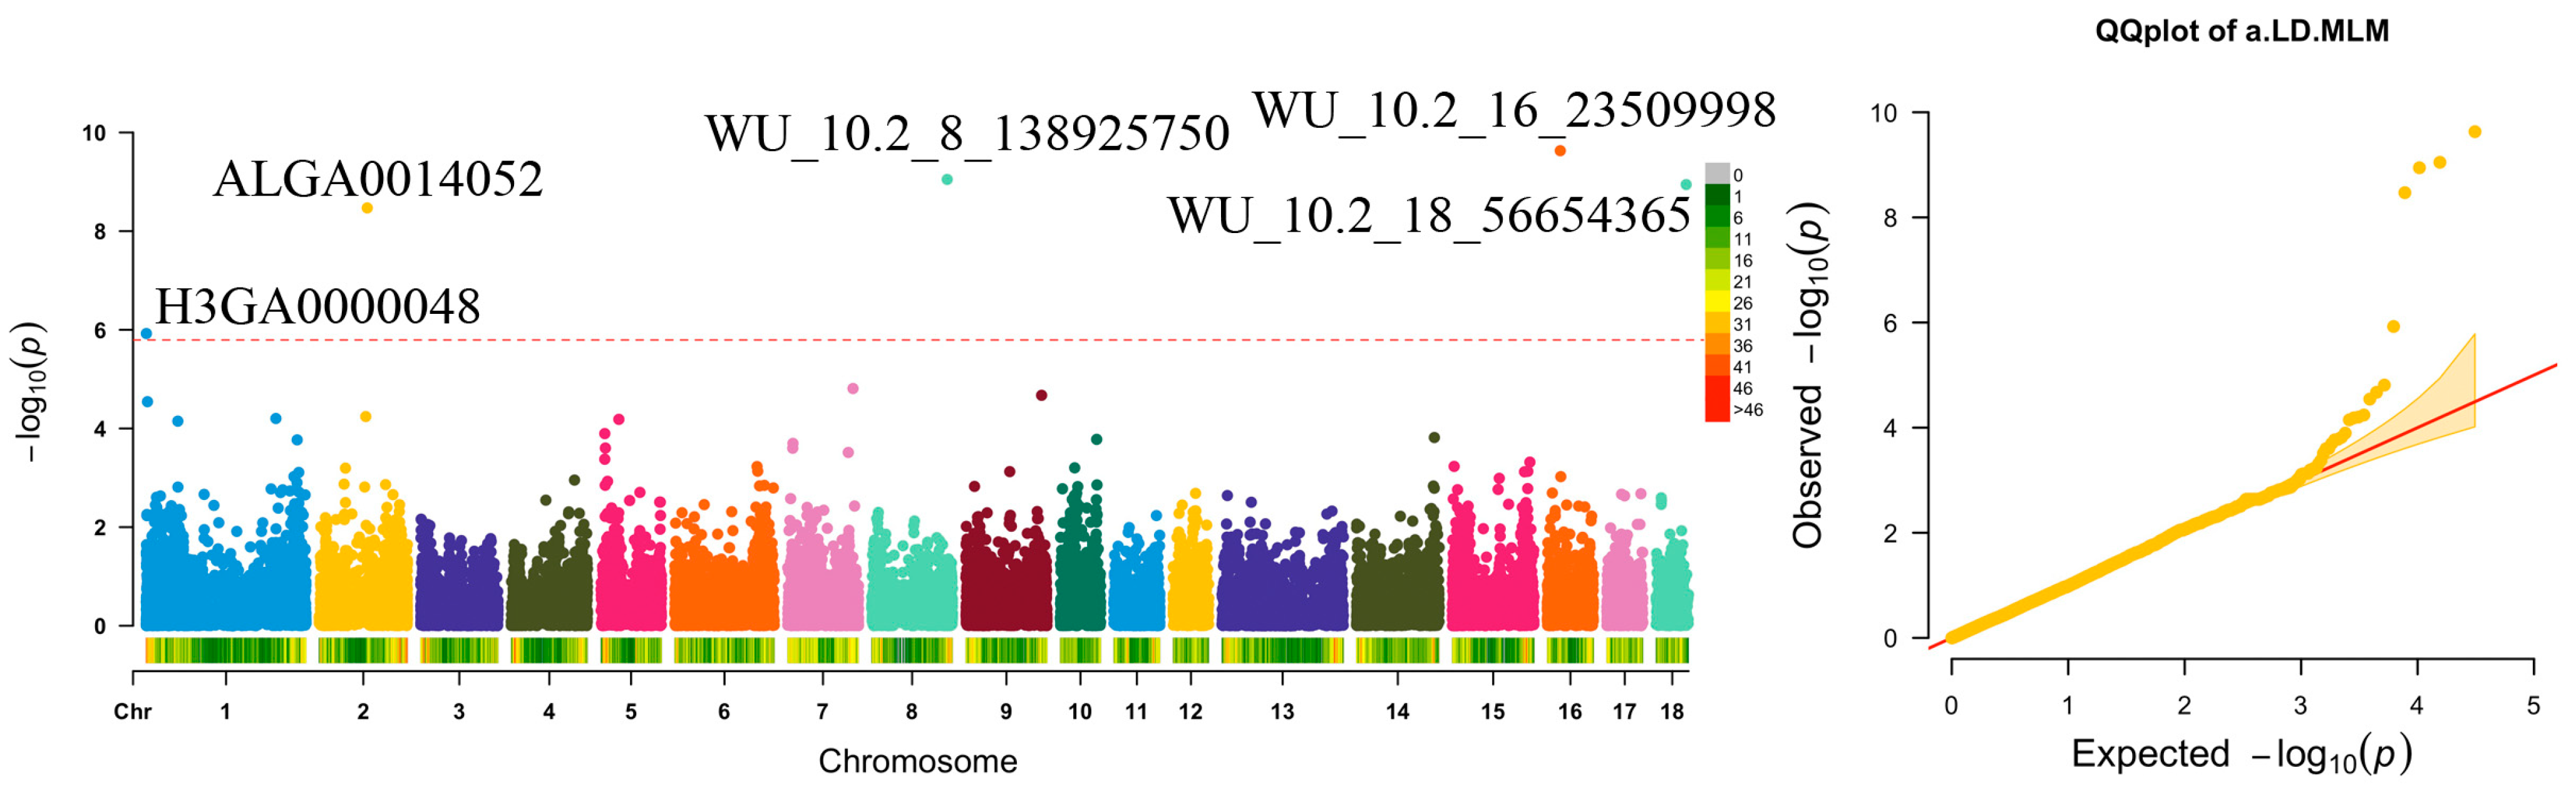
3.3.2. Meat Quality Trait

Only the a.LD trait identified five genome-wide level significant SNPs, located on SSC1, SSC2, SSC8, SSC16, and SSC18, respectively. The most significant SNP was WU_10.2_16_23509998, located on SSC16 (Figure 2 and Table 3b), contributing 7.95% of the phenotypic variance. Four of these loci (WU_10.2_16_23509998, WU_10.2_8_138925750, WU_10.2_18_56654365, and ALGA0014052) were also associated with BFT. No significant SNPs were found for the other traits in this study (Figure S4).

3.4. LD Block Analysis

Twelve LD blocks were identified in regions 26.50–50.28 Mb on SSC7, but only one block included two genome-wide significant SNPs and indicated strong LD (R2 = 1). LD block analysis revealed that the multiple significant SNPs on SSC7 associated with CL spanned 146.72 kb (R2 = 0.3) (Figure 3).

3.5. Functional Enrichment Results

To annotate the potential SNPs, candidate genes overlapping with the extended genomic regions were selected for GO term enrichment analysis. A total of 135 genes were identified in carcass traits (CL, COL, and BFT) and 32 genes in meat color a.LD (redness). However, only 10 SNPs were located within 8 genes. (Top 10 GO terms shown in Figure 4a–d, KEGG pathway shown in Table S4).

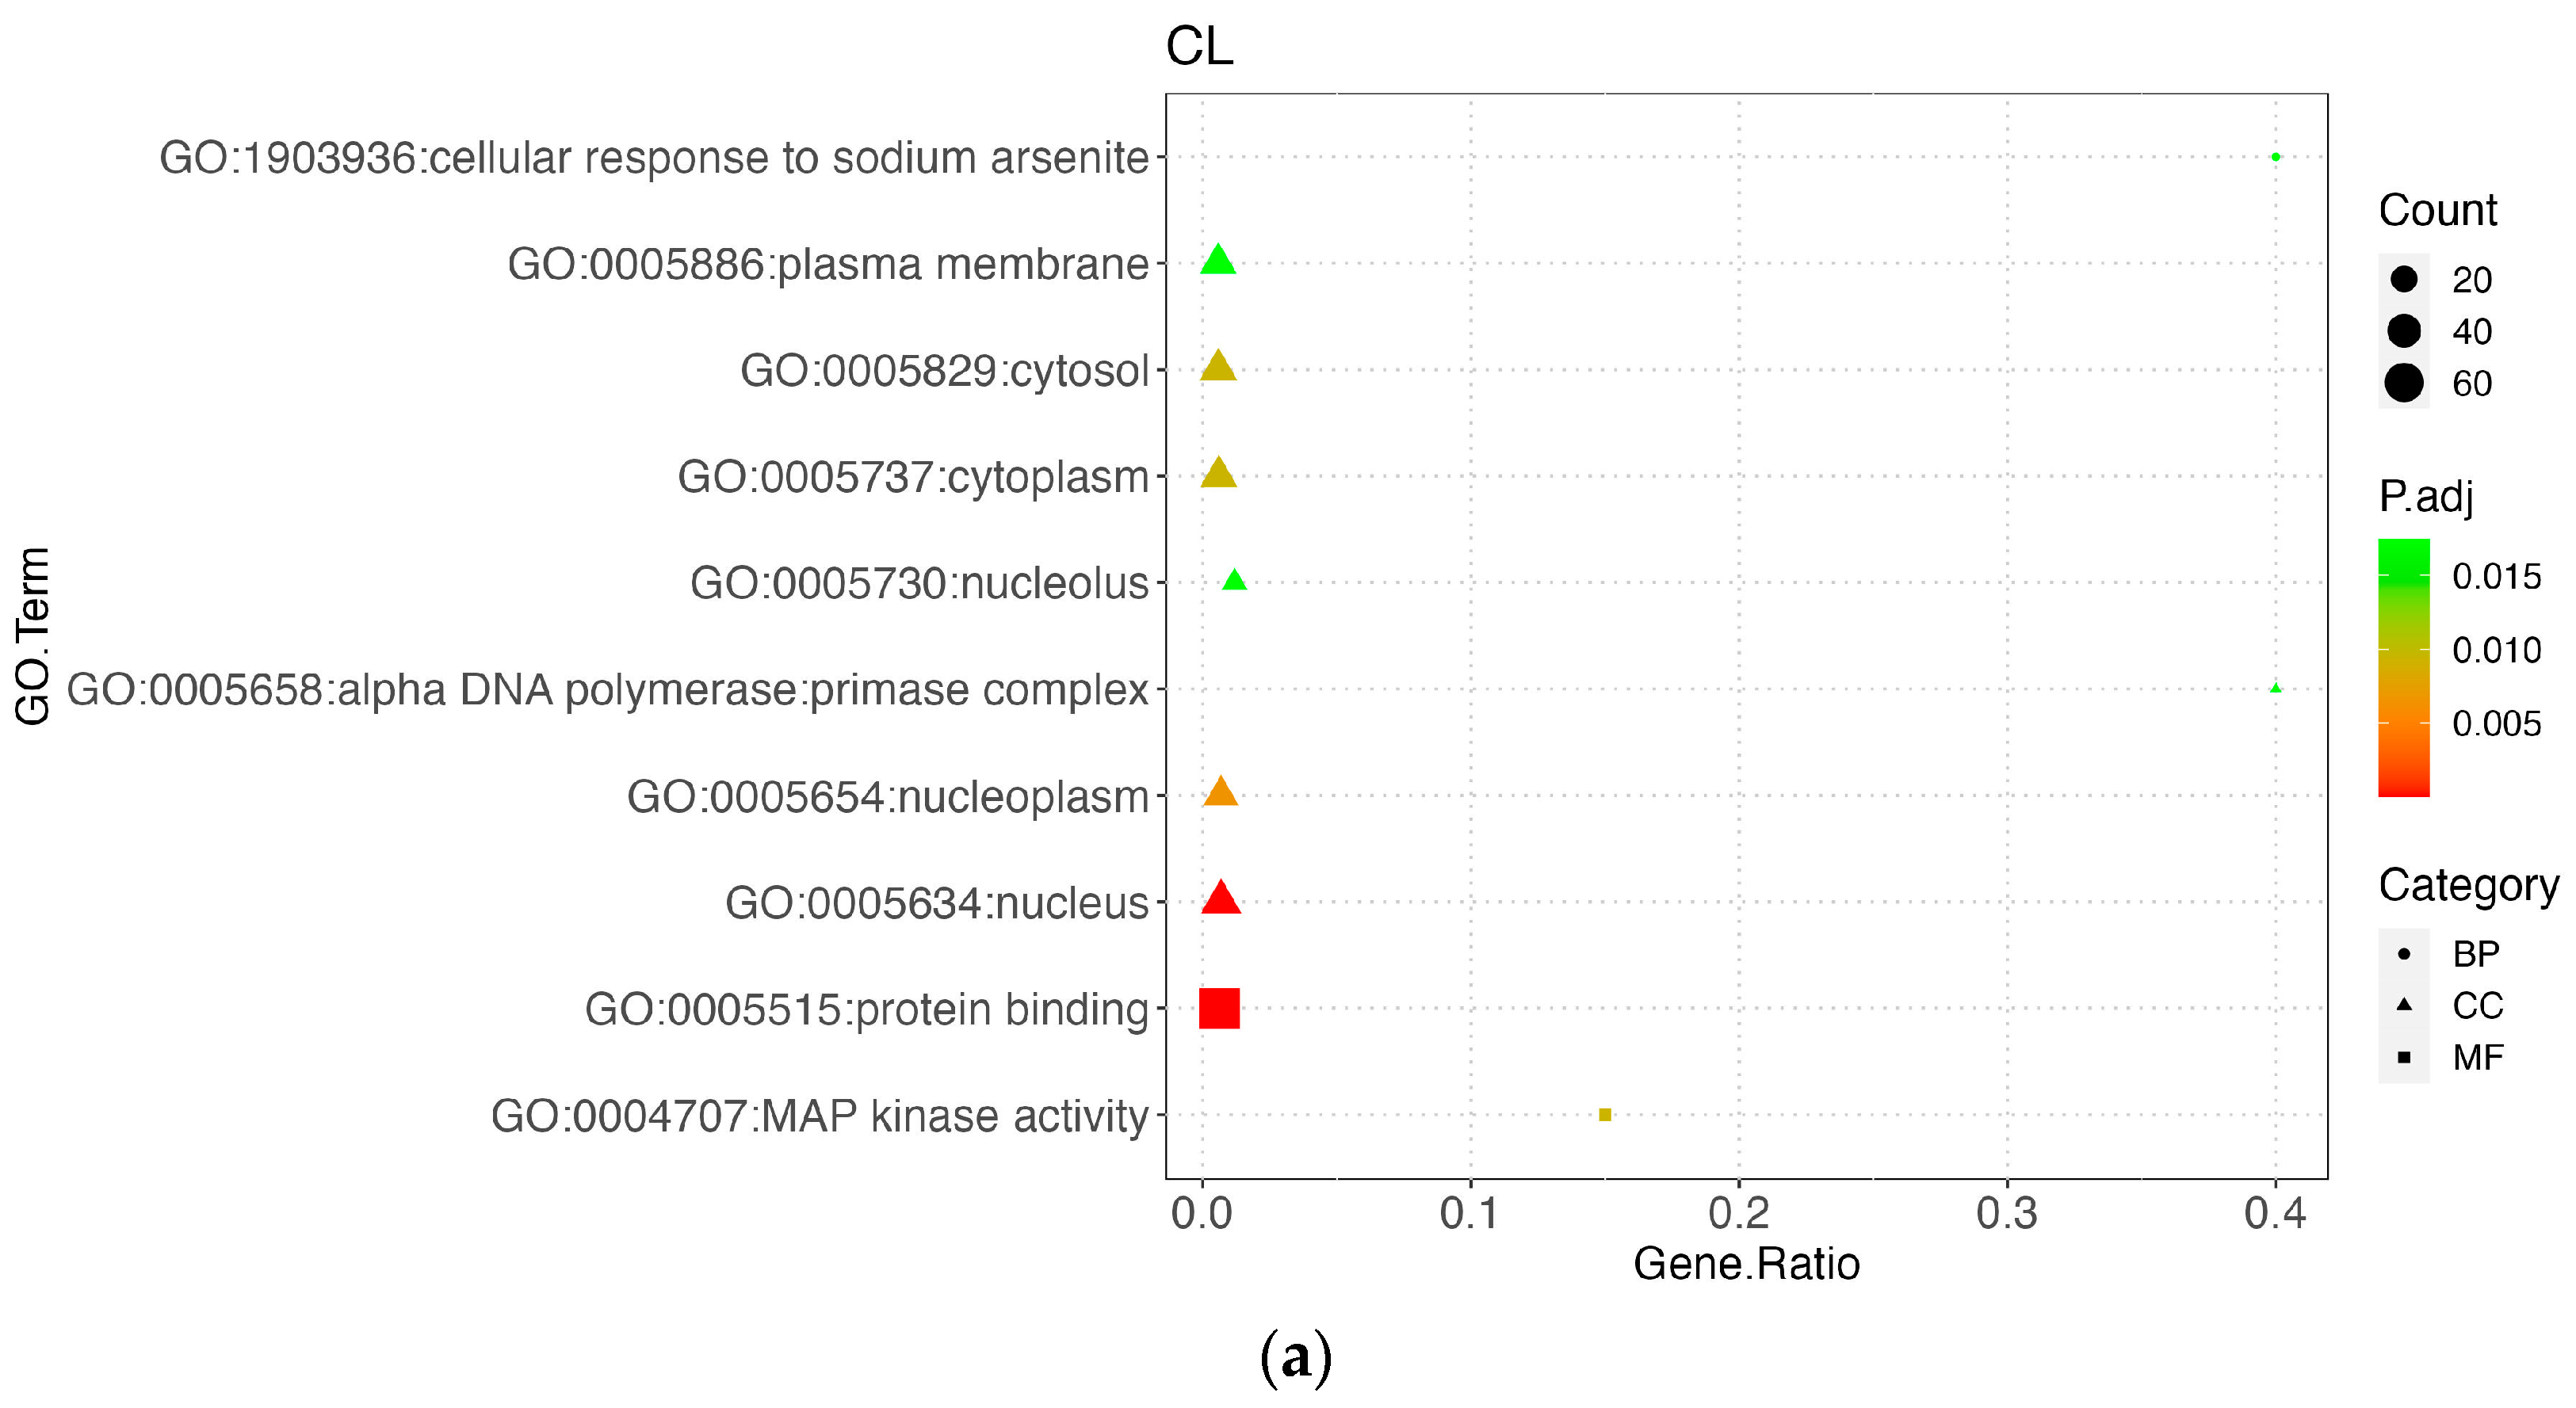
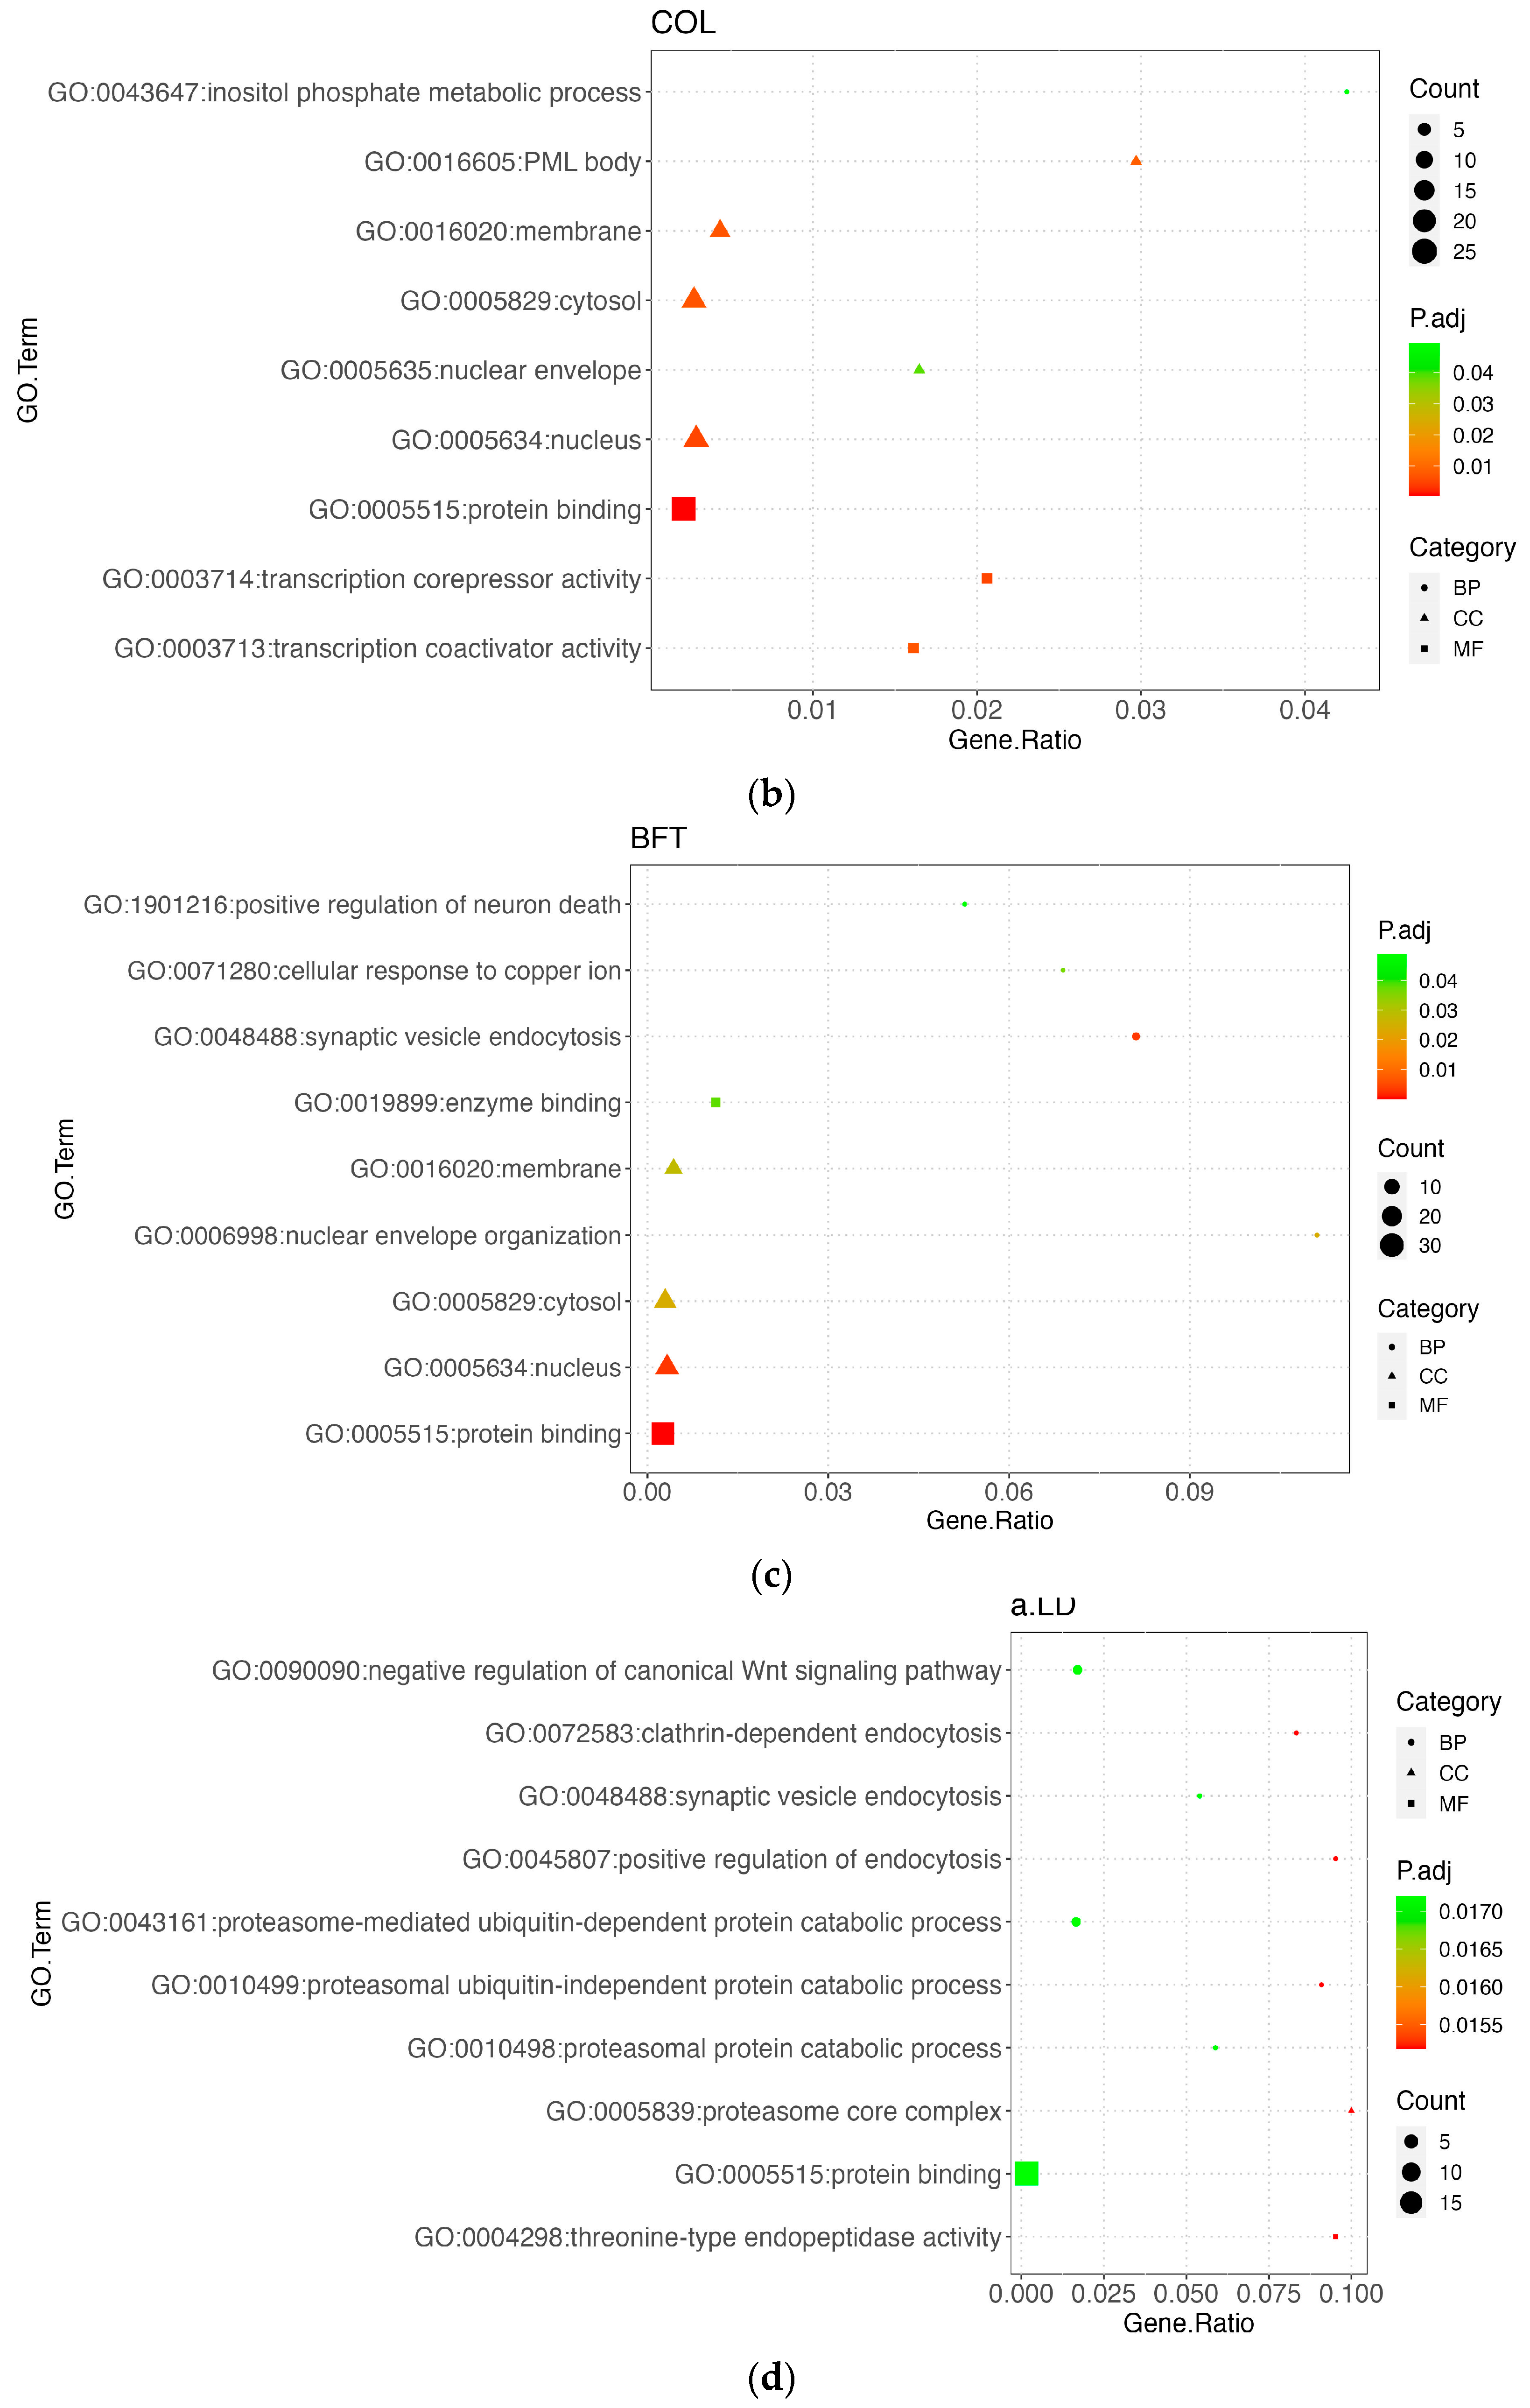
3.5.1. Carcass Trait

A total of 112 genes overlapped with or were close to the significant SNP loci for the CL trait. Most of these genes were significantly enriched in GO terms of biological processes (BP), followed by cellular components (CC). There were three significant KEGG pathways: amyotropic lateral sclerosis (ALS), spliceosome, and cellular sensitivity.
For COL, there were 37 potential genes within these genomic regions. For BFT, there were 43 genes within 1Mb genomic regions, and these genes were significantly enriched in only one pathway (Glutamatergic synapse). Protein binding (GO:0005515) was the most enriched GO term among the three carcass traits (Figure 4a–c).

3.5.2. Meat Quality Trait

Thirty-two genes were used for enrichment analysis for a.LD, and biological process (BP) was the most enriched category in the top 10 GO terms (Figure 4d). Proteasome and RNA transport were the only two significant KEGG pathways.

4. Discussion

In this study, the heritability of carcass traits ranged from 0.47 to 0.80, while meat quality traits ranged from 0.11 to 0.44. The genetic parameters obtained in this study for carcass and meat quality traits demonstrated congruence with previous studies [29,30,31]. Carcass and meat quality are the livestock industry’s most crucial economic target traits. The Ningxiang pig, celebrated for its superior meat quality and robust disease resistance, nonetheless manifests a suboptimal growth rate, a relatively short body length, and a lean meat percentage. Furthermore, backfat thickness (BFT), a significant component of carcass traits, substantially influences reproduction and meat production performances [14,32]. To maintain consistency with consumer demands, reducing backfat thickness and improving lean meat percentage and growth rate have become the goals of breeders [33]. Concurrently, keeping high-quality pork is also essential. A significant negative correlation was discerned between BFT and body length in phenotypic and genetic correlation results. Most Chinese indigenous pig breeds were shorter than the imported breeds but had thicker BFT [34]. Ningxiang pigs, a famous obese pig breed, have a BFT (41.61 mm) thicker than commercial breeds [15,35], and are comparable to Chinese indigenous obese breeds [36]. In this study, the average carcass length (81.35 cm) was shorter, and BFT (41.61 mm) was thicker than commercial breeds [4]. Concerning meat quality traits, meat color mainly described three parameters, namely L, a, and b, denoting lightness, redness, and yellowness, respectively. Redness is associated with myoglobin content, with elevated myoglobin presenting increased redness [37]. A previous study found the meat color of Ningxiang pigs comparable to that of Chinese Sutai pigs [38]. Compared to Duroc pigs, Ningxiang pigs exhibited higher redness, yellowness, and lightness [35]. In phenotypic correlation, most carcass traits and pH traits showed a significant negative correlation with meat color traits, while genetic correlation differed. pH45min and pH24h were negatively genetically correlated with redness, and yellowness, respectively. The study revealed that low acidity could affect meat color, structure, and tenderness [39], consistent with our team’s previous report [40]. Additionally, there was a negative correlation between lightness and BFT. Yuan et al. reported that polymorphisms in the DGAT1 gene affected meat color, known for its role in fat deposition [41].
In this study, we performed a GWAS in a Ningxiang population to explore the genetic architecture of carcass and meat quality traits. We identified 21 genome-wide significant SNPs and several candidate genes for carcass traits (CL, COL, BFT) and one meat quality trait (a.LD). We identified some novel SNPs and genes potentially associated with these traits, which had no research previously. Therefore, it is essential to conduct GWAS in different pig breeds to identify more genes underlying the complex traits, which would benefit Ningxiang pig breeding programs. Previous studies concluded that some SNP-containing annotated genes were highly associated with carcass and meat quality traits. Notably, we found that some SNPs exhibited pleiotropy in multiple traits. Watanabe et al. [42] indicated that numerous pleiotropy loci, SNPs, or genes existed between traits with solid correlations, especially within the same domain. For example, CL was highly correlated with COL in phenotype and genetics; we identified six SNPs for two traits, and ALGA0040227 was also an important site for BFT. A total of 113 reported QTLs were within this genomic region, with 3 associated with carcass length [43,44], 16 QTLs related to backfat thickness [45,46], and 3 QTLs associated with meat color [16,47]. ALGA0040227 was closest to the GRM4 (Glutamate metabotropic receptor 4) gene. Metabolic glutamate (mGlu) receptors are a family of G protein-coupled receptors that regulate cell physiology throughout the nervous system [48]. GRM4 belongs to a subtype of the Metabotropic glutamate receptor family, and is mainly involved in maintaining the stability of the internal environment of central nervous system cells [49]. This gene plays an important role in various cancers, such as melanoma [50], breast cancer [51], and osteosarcoma [52]. Osteosarcoma is the most common primary malignant tumor of bone, which occurs in the long bones of the limbs and tends to occur at the peak of adolescent growth [53]. Maya et al. [54] found that GRM4 played an important role in driving osteosarcoma by regulating the noncellular autonomous mechanism of IL-23, which opened up a new direction for treatment. Additionally, Wang et al. [14] indicated that the GRM4 gene may play an essential role in adipogenesis by activating MAPK activity.
In this study, all significant SNPs were located within or near several genes (HMGA1, MLIP, UNC5CL, ADGRF1, FKBP5, PRIM2, TINAG, TMC3, SNCA, SRSF3, ZNF76, and ERMARD). Some of these genes have been reported to be associated with interesting phenotypes. For example, The HMGA1 (high-mobility group AT-hook 1) gene is a nonhistone chromatin structural protein characterized by the absence of transcriptional activity, and belongs to the high-mobility family A, which comprises three members: HMGA1, HMGA2, and HMGA3. This gene plays a vital role in osteoblast commitment and mediates the function of NFIX by transcriptionally activating canonical Wnt signaling [55]. Moreover, the HMGA1 gene is a vital regulator of the insulin receptor (INSR) gene [56]. This gene has been reported to be related to many traits. For example, Ding et al. [15], Wang et al. [14], and Kim et al. [57] reported that HMGA1 was associated with fat deposition traits in pigs. Additionally, this gene has been reported to be associated with obesity [58], diabetes [59], and metabolic syndrome [56] in humans. Gong et al. [60] and Liu et al. [61] reported that this gene was associated with growth traits (e.g., cannon circumference and body length) and body size in pigs. Otto et al. [62] identified that the HMGA1 gene affected the measurement of meat color. In this study, BFT and carcass length traits also exhibited strong phenotypic and genetic correlations. The ADGRF1 gene, also known as the GPR110 gene, is a member of the adhesion GPCR family, and functions as a receptor of N-docosahexaenoyl ethanolamine [63]. Hidaka et al. [64] suggested that synaptamide/GPR110 signaling negatively regulates osteoclastogenesis. This gene has also been reported to be associated with carcass length in pigs [65]. PRIM2 (DNA primase subunit 2, also named PRIM2A) encodes 58 kDa protein containing a 4Fe-4S cofactor that forms a heterodimeric DNA primase with PRIM1, a small subunit of DNA primase [66]. Wang et al. [67] identified the PRIM2 gene as associated with body length. The FKBP5 gene (FKBP prolyl isomerase 5, all named AIG61, FKBP54) encodes the FKBP5 protein, an immunoaffinity protein with multiple biological functions. Lu et al. [68] found that the FKBP5 gene is involved in NF-kB and Akt signaling pathways, which regulate and control osteoclasts differentiation and development. They also pointed out that the FKBP5V55L mutation is related to osteoclastogenesis and function, which affects the development of Paget’s disease. This gene is a potential candidate for skeletal muscle development. The MLIP (Muscular A-type Lamin interacting protein, also called MMCKR or CIP) gene encodes alternatively spliced variants (23–57 kDa) with several novel structural motifs not found in other proteins, and is highly expressed in heart, skeletal, and smooth muscle [69]. Huang et al. [70] identified it as a candidate gene for the forming of exterior traits (facial wrinkles) in Chinese Erhualian pigs.
Furthermore, few studies have investigated these genes in livestock or their association with interesting phenotypes, such as TMC3 (transmembrane channel-like 3), SNCA (α-synuclein), TINAG (Tubulointerstitial nephritis antigen, also named TIN-AG) and ZNF76 (Zinc finger protein 76) genes. The TINag gene encodes an extracellular matrix protein, TINag, which is expressed in tubular basement membranes [71]. Most studies on this gene have focused on disease. For instance, Tong et al. [71] identified a mutation in TINAG as a prognostic biology marker for pectus excavatum (PE). Jakowlev et al. [1] suggested that TINAG might be a potential susceptibility gene for hand osteoarthritis. The UNC5CL gene (all called MUXA, ZUD) is a member of the UNC5 family, and has a unique death and ZU5 domain in its molecular structure. It is also involved in immunity and inflammation [72]. This gene has been extensively implicated in mucosal diseases [73,74].
For the BFT trait, we identified five candidate genes (HECW1, NIPBL, SNCA, TMEM174, GRM4), of which four were also found in a.LD, including HECW1, NIPBL, SNCA, TMEM174 genes. Additionally, two significant SNPs were located within NIPBL (nipped-B-like protein cohesin loading factor) and HECW1 (HECT, C2, and WW domain-containing E3 ubiquitin protein ligase 1, also called NEDL1), respectively. The NIPBL encodes the homolog of Nipped-B-like protein and colon tumor susceptibility 2-type sister chromatid cohesion proteins, facilitating enhancer–promoter interaction of remote enhancers. It is highly expressed in the lung, spleen, and subcutaneous adipose tissue. This study discovered that the NIPBL gene was enriched in embryo development, such as embryonic viscerocranium morphogenesis (GO:0048703) and embryonic digestive tract morphogenesis (GO:0048557). Alonso-Gil et al. [75] reported that low-level NIPBL seriously affects genome folding. In farm animals, this gene has been reported to be associated with limb development in Qinchuan cattle [76], milk traits in Chinese dairy cattle [77], and adipogenesis in Duroc pigs [78]. HECW1 was highly expressed in the kidney and ovary and is one of nine HECT ubiquitin-like ligase NEDD4 family members. No studies have shown that this gene is related to traits of interest. The other two genes, SNCA and TMEM174 (Transmembrane protein 174), are also unrelated to fat deposition or meat color formation.
Meat color is a significant factor affecting consumer preferences. Redness, yellowness, and lightness serve as primary indicators of meat color. Factors influencing meat color include pigment sources such as myoglobin, hemoglobin, cytochrome C, and muscle structure [79]. In this study, we identified significant loci for only one meat color trait (a.LD), with candidate genes associated with iron ion transport, mitochondrial cytochrome c oxidase assembly, and negative regulation of myoblast differentiation. However, the obtained genes have no studies about meat color.
We searched the pig QTL database based on SNP and QTL locations to assess whether this study’s SNPs associated with carcass and meat quality traits replicated any previously known QTLs. We identified 21 SNPs associated with carcass and meat quality traits within genomic regions. The top 10 traits with the highest enrichment are shown in Table S5, with average daily gain exhibiting the highest enrichment among all traits. Reported QTLs associated with carcass traits were found in genomic regions for CL and COL. Average backfat thickness, fat cut percentage, and intramuscular fat content were related to fatness and meat quality for BFT. Some QTLs for meat color traits (L, a, and b) were also identified in the a.LD genomic region.

5. Conclusions

Through a genome-wide association study on carcass and meat quality traits in a Ningxiang pig population, we detected 21 SNPs associated with the traits of interest and identified several candidate genes related to these SNPs. GRM4 emerged as a potential pleiotropic gene associated with carcass length and BFT. HMGA1, ADGRF1, FKBP5, and PRIM2 genes were identified as associated with carcass length, while the NIPBL gene was associated with BFT. These findings contribute to a better understanding of the genetic architecture of carcass and meat quality traits in Ningxiang pigs and hold the potential for application in inbreeding programs.

Supplementary Materials

The following are available online at: https://www.mdpi.com/article/10.3390/genes14071308/s1, Figure S1: SNP density after quality control; Figure S2: Principal component analysis of 508 animals; Figure S3: Phenotypic distribution of eight traits, Sd represents standard deviation; Figure S4: Manhattan and Q-Q plots for 4 traits (b.LD, L.LD, pH45min, pH24h). The red line is the genome-wide threshold (0.05/31,106). The −log10(p-value) of each SNP (y-axis) across the chromosomes (x-axis), along with the corresponding Q-Q plots. The λ represents genomic inflation factors. Table S1: Abbreviation and measurement method description in this study; Table S2: Distribution of SNPs before, and after quality control and the average distance between adjacent SNPs on each chromosome; Table S3: The genome-level significant and possible candidate genes for carcass and meat quality traits; Table S4: Enrichment of KEGG pathway in Homo Sapiens dataset; Table S5: Top 10 traits with the highest enrichment QTLs number.

Author Contributions

Writing—original draft and data analysis, S.Y.; data curation, G.S.; review and editing, N.G.; data curation, H.G.; resources, Q.Z. (Qinghua Zeng); investigation, P.L.; supervision and editing, Q.Z. (Qin Zhang); supervision, K.X.; project administration, J.H. All authors have read and agreed to the published version of the manuscript.

Funding

This research was funded by the Strategic Priority Research Program of the Chinese Academy of Sciences (Precision Seed Design and Breeding, XDA24030204), the Special Fund for the Construction of Innovative Provinces in Hunan (Grant number 2021NK1009), Hunan Provincial Natural Science Foundations of China (Grant numbers 2022JJ30286, 2021JJ40254).

Institutional Review Board Statement

The animal study protocol was approved by the Ethics Association of Hunan Agricultural University (approval number 2020047).

Informed Consent Statement

Not applicable.

Data Availability Statement

The data presented in this study are available on request from the corresponding author.

Acknowledgments

We are grateful to the Ningxiang Chu Weixiang Slaughterhouse and Meat Processing, LLC (Hunan Province, China) for providing samples and helping to collect samples and phenotypic data.

Conflicts of Interest

The authors declare no conflict of interest.

References

  1. Yang, J.; Huang, L.; Yang, M.; Fan, Y.; Li, L.; Fang, S.; Deng, W.; Cui, L.; Zhang, Z.; Ai, H.; et al. Possible Introgression of the VRTN Mutation Increasing Vertebral Number, Carcass Length and Teat Number from Chinese Pigs into European Pigs. Sci. Rep. 2016, 6, 19240. [Google Scholar] [CrossRef] [PubMed] [Green Version]
  2. Chen, Q.; Zhang, W.; Cai, J.; Ni, Y.; Xiao, L.; Zhang, J. Transcriptome Analysis in Comparing Carcass and Meat Quality Traits of Jiaxing Black Pig and Duroc × Duroc × Berkshire × Jiaxing Black Pig Crosses. Gene 2022, 808, 145978. [Google Scholar] [CrossRef] [PubMed]
  3. Wang, Y.; Thakali, K.; Morse, P.; Shelby, S.; Chen, J.; Apple, J.; Huang, Y. Comparison of Growth Performance and Meat Quality Traits of Commercial Cross-Bred Pigs versus the Large Black Pig Breed. Animals 2021, 11, 200. [Google Scholar] [CrossRef] [PubMed]
  4. Khanal, P.; Maltecca, C.; Schwab, C.; Gray, K.; Tiezzi, F. Genetic Parameters of Meat Quality, Carcass Composition, and Growth Traits in Commercial Swine. J. Anim. Sci. 2019, 97, 3669–3683. [Google Scholar] [CrossRef] [PubMed]
  5. Fernández-Barroso, M.Á.; Silió, L.; Rodríguez, C.; Palma-Granados, P.; López, A.; Caraballo, C.; Sánchez-Esquiliche, F.; Gómez-Carballar, F.; García-Casco, J.M.; Muñoz, M. Genetic Parameter Estimation and Gene Association Analyses for Meat Quality Traits in Open-air Free-range Iberian Pigs. J. Anim. Breed. Genet. 2020, 137, 581–598. [Google Scholar] [CrossRef]
  6. Huang, Y.; Zhou, L.; Zhang, J.; Liu, X.; Zhang, Y.; Cai, L.; Zhang, W.; Cui, L.; Yang, J.; Ji, J.; et al. A Large-Scale Comparison of Meat Quality and Intramuscular Fatty Acid Composition among Three Chinese Indigenous Pig Breeds. Meat Sci. 2020, 168, 108182. [Google Scholar] [CrossRef]
  7. Jiang, Y.Z.; Zhu, L.; Tang, G.Q.; Li, M.Z.; Jiang, A.A.; Cen, W.M.; Xing, S.H.; Chen, J.N.; Wen, A.X.; He, T.; et al. Carcass and Meat Quality Traits of Four Commercial Pig Crossbreeds in China. Genet. Mol. Res. 2012, 11, 4447–4455. [Google Scholar] [CrossRef]
  8. Jiang, Y.-Z.; Zhu, L.; Li, F.-Q.; Li, X.-W. Carcass Composition and Meat Quality of Indigenous Yanan Pigs of China. Genet. Mol. Res. 2012, 11, 166–173. [Google Scholar] [CrossRef]
  9. Adzitey, F.; Nurul, H. Pale Soft Exudative (PSE) and Dark Firm Dry (DFD) Meats: Causes and Measures to Reduce These Incidences: A Mini Review. Int. Food Res. J. 2011, 18, 11–20. [Google Scholar]
  10. Hamilton, D.N.; Ellis, M.; Miller, K.D.; McKeith, F.K.; Parrett, D.F. The Effect of the Halothane and Rendement Napole Genes on Carcass and Meat Quality Characteristics of Pigs. J. Anim. Sci. 2000, 78, 2862. [Google Scholar] [CrossRef] [Green Version]
  11. Scheffler, T.L.; Gerrard, D.E. Mechanisms Controlling Pork Quality Development: The Biochemistry Controlling Postmortem Energy Metabolism. Meat Sci. 2007, 77, 7–16. [Google Scholar] [CrossRef] [PubMed]
  12. Timpson, N.J.; Greenwood, C.M.T.; Soranzo, N.; Lawson, D.J.; Richards, J.B. Genetic Architecture: The Shape of the Genetic Contribution to Human Traits and Disease. Nat. Rev. Genet. 2018, 19, 110–124. [Google Scholar] [CrossRef] [PubMed] [Green Version]
  13. Mackay, T.F.C. The Genetic Architecture of Quantitative Traits. Annu. Rev. Genet. 2001, 35, 303–339. [Google Scholar]
  14. Wang, H.; Wang, X.; Yan, D.; Sun, H.; Chen, Q.; Li, M.; Dong, X.; Pan, Y.; Lu, S. Genome-Wide Association Study Identifying Genetic Variants Associated with Carcass Backfat Thickness, Lean Percentage and Fat Percentage in a Four-Way Crossbred Pig Population Using SLAF-Seq Technology. BMC Genom. 2022, 23, 594. [Google Scholar] [CrossRef]
  15. Ding, R.; Zhuang, Z.; Qiu, Y.; Ruan, D.; Wu, J.; Ye, J.; Cao, L.; Zhou, S.; Zheng, E.; Huang, W.; et al. Identify Known and Novel Candidate Genes Associated with Backfat Thickness in Duroc Pigs by Large-Scale Genome-Wide Association Analysis. J. Anim. Sci. 2022, 100, skac012. [Google Scholar] [CrossRef] [PubMed]
  16. Cho, I.-C.; Yoo, C.-K.; Lee, J.-B.; Jung, E.-J.; Han, S.-H.; Lee, S.-S.; Ko, M.-S.; Lim, H.-T.; Park, H.-B. Genome-Wide QTL Analysis of Meat Quality-Related Traits in a Large F2 Intercross between Landrace and Korean Native Pigs. Genet. Sel. Evol. 2015, 47, 7. [Google Scholar] [CrossRef] [Green Version]
  17. Suwannasing, R.; Duangjinda, M.; Boonkum, W.; Taharnklaew, R.; Tuangsithtanon, K. The Identification of Novel Regions for Reproduction Trait in Landrace and Large White Pigs Using a Single Step Genome-Wide Association Study. Asian-Australas. J. Anim. Sci. 2018, 31, 1852–1862. [Google Scholar] [CrossRef] [Green Version]
  18. Wang, Y.; Ding, X.; Tan, Z.; Xing, K.; Yang, T.; Pan, Y.; Wang, Y.; Mi, S.; Sun, D.; Wang, C. Genome-Wide Association Study for Reproductive Traits in a Large White Pig Population. Anim. Genet. 2018, 49, 127–131. [Google Scholar] [CrossRef] [Green Version]
  19. Browning, B.L.; Zhou, Y.; Browning, S.R. A One-Penny Imputed Genome from Next-Generation Reference Panels. Am. J. Hum. Genet. 2018, 103, 338–348. [Google Scholar] [CrossRef] [Green Version]
  20. Purcell, S.; Neale, B.; Todd-Brown, K.; Thomas, L.; Ferreira, M.A.R.; Bender, D.; Maller, J.; Sklar, P.; de Bakker, P.I.W.; Daly, M.J.; et al. PLINK: A Tool Set for Whole-Genome Association and Population-Based Linkage Analyses. Am. J. Hum. Genet. 2007, 81, 559–575. [Google Scholar] [CrossRef] [Green Version]
  21. Yin, L.; Zhang, H.; Tang, Z.; Yin, D.; Fu, Y.; Yuan, X.; Li, X.; Liu, X.; Zhao, S. HIBLUP: An Integration of Statistical Models on the BLUP Framework for Efficient Genetic Evaluation Using Big Genomic Data. Nucleic Acids Res. 2023, 51, gkad074. [Google Scholar] [CrossRef]
  22. Yin, L.; Zhang, H.; Tang, Z.; Xu, J.; Yin, D.; Zhang, Z.; Yuan, X.; Zhu, M.; Zhao, S.; Li, X.; et al. rMVP: A Memory-Efficient, Visualization-Enhanced, and Parallel-Accelerated Tool for Genome-Wide Association Study. Genom. Proteom. Bioinform. 2021, 19, 619–628. [Google Scholar] [CrossRef]
  23. Yu, J.; Pressoir, G.; Briggs, W.H.; Vroh Bi, I.; Yamasaki, M.; Doebley, J.F.; McMullen, M.D.; Gaut, B.S.; Nielsen, D.M.; Holland, J.B.; et al. A Unified Mixed-Model Method for Association Mapping That Accounts for Multiple Levels of Relatedness. Nat. Genet. 2006, 38, 203–208. [Google Scholar] [CrossRef]
  24. Price, A.L.; Patterson, N.J.; Plenge, R.M.; Weinblatt, M.E.; Shadick, N.A.; Reich, D. Principal Components Analysis Corrects for Stratification in Genome-Wide Association Studies. Nat. Genet. 2006, 38, 904–909. [Google Scholar] [CrossRef]
  25. VanRaden, P.M. Efficient Methods to Compute Genomic Predictions. J. Dairy Sci. 2008, 91, 4414–4423. [Google Scholar] [CrossRef] [PubMed] [Green Version]
  26. Teslovich, T.M.; Musunuru, K.; Smith, A.V.; Edmondson, A.C.; Stylianou, I.M.; Koseki, M.; Pirruccello, J.P.; Ripatti, S.; Chasman, D.I.; Willer, C.J.; et al. Biological, Clinical and Population Relevance of 95 Loci for Blood Lipids. Nature 2010, 466, 707–713. [Google Scholar] [CrossRef] [Green Version]
  27. Dong, S.-S.; He, W.-M.; Ji, J.-J.; Zhang, C.; Guo, Y.; Yang, T.-L. LDBlockShow: A Fast and Convenient Tool for Visualizing Linkage Disequilibrium and Haplotype Blocks Based on Variant Call Format Files. Brief. Bioinform. 2021, 22, bbaa227. [Google Scholar] [CrossRef]
  28. Bu, D.; Luo, H.; Huo, P.; Wang, Z.; Zhang, S.; He, Z.; Wu, Y.; Zhao, L.; Liu, J.; Guo, J.; et al. KOBAS-i: Intelligent Prioritization and Exploratory Visualization of Biological Functions for Gene Enrichment Analysis. Nucleic Acids Res. 2021, 49, W317–W325. [Google Scholar] [CrossRef] [PubMed]
  29. Gjerlaug-Enger, E.; Aass, L.; Ødegård, J.; Vangen, O. Genetic Parameters of Meat Quality Traits in Two Pig Breeds Measured by Rapid Methods. Animal 2010, 4, 1832–1843. [Google Scholar] [CrossRef] [PubMed] [Green Version]
  30. Sonesson, A.K.; de Greef, K.H.; Meuwissen, T.H.E. Genetic Parameters and Trends of Meat Quality, Carcass Composition and Performance Traits in Two Selected Lines of Large White Pigs. Livest. Prod. Sci. 1998, 57, 23–32. [Google Scholar] [CrossRef]
  31. Lee, J.-H.; Song, K.-D.; Lee, H.-K.; Cho, K.-H.; Park, H.-C.; Park, K.-D. Genetic Parameters of Reproductive and Meat Quality Traits in Korean Berkshire Pigs. Asian Australas. J. Anim. Sci. 2015, 28, 1388–1393. [Google Scholar] [CrossRef] [PubMed] [Green Version]
  32. Filha, W.S.A.; Bernardi, M.L.; Wentz, I.; Bortolozzo, F.P. Reproductive Performance of Gilts According to Growth Rate and Backfat Thickness at Mating. Anim. Reprod. Sci. 2010, 121, 139–144. [Google Scholar] [CrossRef]
  33. Gozalo-Marcilla, M.; Buntjer, J.; Johnsson, M.; Batista, L.; Diez, F.; Werner, C.R.; Chen, C.-Y.; Gorjanc, G.; Mellanby, R.J.; Hickey, J.M.; et al. Genetic Architecture and Major Genes for Backfat Thickness in Pig Lines of Diverse Genetic Backgrounds. Genet. Sel. Evol. 2021, 53, 76. [Google Scholar] [CrossRef]
  34. Song, B.; Zheng, C.; Zheng, J.; Zhang, S.; Zhong, Y.; Guo, Q.; Li, F.; Long, C.; Xu, K.; Duan, Y.; et al. Comparisons of Carcass Traits, Meat Quality, and Serum Metabolome between Shaziling and Yorkshire Pigs. Anim. Nutr. 2022, 8, 125–134. [Google Scholar] [CrossRef]
  35. Suzuki, K.; Irie, M.; Kadowaki, H.; Shibata, T.; Kumagai, M.; Nishida, A. Genetic Parameter Estimates of Meat Quality Traits in Duroc Pigs Selected for Average Daily Gain, Longissimus Muscle Area, Backfat Thickness, and Intramuscular Fat Content. J. Anim. Sci. 2005, 83, 2058–2065. [Google Scholar] [CrossRef] [Green Version]
  36. Tian, W.; Lan, G.; Zhang, L.; Wang, L.; Liang, J.; Liu, X. Detection of DKK3 and CCR1 Genes Polymorphisms and Their Association with Backfat Thickness in Being Black Pigs. Acta Vet. Zootech. Sin. 2022, 53, 2083–2093. [Google Scholar]
  37. Kim, G.-D.; Jeong, J.-Y.; Hur, S.-J.; Yang, H.-S.; Jeon, J.-T.; Joo, S.-T. The Relationship between Meat Color (CIE L* and A*), Myoglobin Content, and Their Influence on Muscle Fiber Characteristics and Pork Quality. Korean J. Food Sci. Anim. Resour. 2010, 30, 626–633. [Google Scholar] [CrossRef] [Green Version]
  38. Liu, H.; Hou, L.; Zhou, W.; Wang, B.; Han, P.; Gao, C.; Niu, P.; Zhang, Z.; Li, Q.; Huang, R.; et al. Genome-Wide Association Study and FST Analysis Reveal Four Quantitative Trait Loci and Six Candidate Genes for Meat Color in Pigs. Front. Genet. 2022, 13, 768710. [Google Scholar] [CrossRef]
  39. Tomasevic, I.; Djekic, I.; Font-i-Furnols, M.; Terjung, N.; Lorenzo, J.M. Recent Advances in Meat Color Research. Curr. Opin. Food Sci. 2021, 41, 81–87. [Google Scholar] [CrossRef]
  40. Liao, Y.; Gao, H.; Zhang, Y.; Yin, S.; Xu, K.; He, J. Genome-Wide Association Analysis of Post-Mortem pH and Meat Color Traits in Ningxiang Pigs. Chin. J. Anim. Sci. 2021, 57, 174–181. [Google Scholar]
  41. Yuan, Z.; Li, J.; Li, J.; Gao, X.; Gao, H.; Xu, S. Effects of DGAT1 Gene on Meat and Carcass Fatness Quality in Chinese Commercial Cattle. Mol. Biol. Rep. 2013, 40, 1947–1954. [Google Scholar] [CrossRef] [PubMed]
  42. Watanabe, K.; Stringer, S.; Frei, O.; Umićević Mirkov, M.; de Leeuw, C.; Polderman, T.J.C.; van der Sluis, S.; Andreassen, O.A.; Neale, B.M.; Posthuma, D. A Global Overview of Pleiotropy and Genetic Architecture in Complex Traits. Nat. Genet. 2019, 51, 1339–1348. [Google Scholar] [CrossRef]
  43. Rohrer, G.A.; Keele, J.W. Identification of Quantitative Trait Loci Affecting Carcass Composition in Swine: II. Muscling and Wholesale Product Yield Traits. J. Anim. Sci. 1998, 76, 2255–2262. [Google Scholar] [CrossRef] [PubMed]
  44. Liu, G.; Jennen, D.G.J.; Tholen, E.; Juengst, H.; Kleinwächter, T.; Hölker, M.; Tesfaye, D.; Un, G.; Schreinemachers, H.-J.; Murani, E.; et al. A Genome Scan Reveals QTL for Growth, Fatness, Leanness and Meat Quality in a Duroc-Pietrain Resource Population. Anim. Genet. 2007, 38, 241–252. [Google Scholar] [CrossRef]
  45. Nagamine, Y.; Visscher, P.M.; Haley, C.S. QTL Detection and Allelic Effects for Growth and Fat Traits in Outbred Pig Populations. Genet. Sel. Evol. 2004, 36, 83–96. [Google Scholar] [CrossRef] [PubMed]
  46. Demeure, O.; Sanchez, M.P.; Riquet, J.; Iannuccelli, N.; Demars, J.; Fève, K.; Kernaleguen, L.; Gogué, J.; Billon, Y.; Caritez, J.C.; et al. Exclusion of the Swine Leukocyte Antigens as Candidate Region and Reduction of the Position Interval for the Sus Scrofa Chromosome 7 QTL Affecting Growth and Fatness. J. Anim. Sci. 2005, 83, 1979–1987. [Google Scholar] [CrossRef] [Green Version]
  47. Stratz, P.; Baes, C.; Rückert, C.; Preuss, S.; Bennewitz, J. A Two-Step Approach to Map Quantitative Trait Loci for Meat Quality in Connected Porcine F(2) Crosses Considering Main and Epistatic Effects. Anim. Genet. 2013, 44, 14–23. [Google Scholar] [CrossRef]
  48. Stansley, B.J.; Conn, P.J. Neuropharmacological Insight from Allosteric Modulation of mGlu Receptors. Trends Pharmacol. Sci. 2019, 40, 240–252. [Google Scholar] [CrossRef]
  49. Pang, Y.; Zhao, J.; Fowdur, M.; Liu, Y.; Wu, H.; He, M. To Explore the Mechanism of the GRM4 Gene in Osteosarcoma by RNA Sequencing and Bioinformatics Approach. Med. Sci. Monit. Basic Res. 2018, 24, 16–25. [Google Scholar] [CrossRef] [Green Version]
  50. Wan, Z.; Sun, R.; Liu, Y.-W.; Li, S.; Sun, J.; Li, J.; Zhu, J.; Moharil, P.; Zhang, B.; Ren, P.; et al. Targeting Metabotropic Glutamate Receptor 4 for Cancer Immunotherapy. Sci. Adv. 2021, 7, eabj4226. [Google Scholar] [CrossRef]
  51. Xiao, B.; Chen, D.; Zhou, Q.; Hang, J.; Zhang, W.; Kuang, Z.; Sun, Z.; Li, L. Glutamate Metabotropic Receptor 4 (GRM4) Inhibits Cell Proliferation, Migration and Invasion in Breast Cancer and Is Regulated by miR-328-3p and miR-370-3p. BMC Cancer 2019, 19, 891. [Google Scholar] [CrossRef] [Green Version]
  52. Zhang, Z.; Li, N.; Wei, X.; Chen, B.; Zhang, Y.; Zhao, Y.; Hu, X.; Hou, S. GRM4 Inhibits the Proliferation, Migration, and Invasion of Human Osteosarcoma Cells through Interaction with CBX4. Biosci. Biotechnol. Biochem. 2020, 84, 279–289. [Google Scholar] [CrossRef]
  53. Kansara, M.; Teng, M.W.; Smyth, M.J.; Thomas, D.M. Translational Biology of Osteosarcoma. Nat. Rev. Cancer 2014, 14, 722–735. [Google Scholar] [CrossRef]
  54. Kansara, M.; Thomson, K.; Pang, P.; Dutour, A.; Mirabello, L.; Acher, F.; Pin, J.-P.; Demicco, E.G.; Yan, J.; Teng, M.W.L.; et al. Infiltrating Myeloid Cells Drive Osteosarcoma Progression via GRM4 Regulation of IL23. Cancer Discov. 2019, 9, 1511–1519. [Google Scholar] [CrossRef] [PubMed] [Green Version]
  55. Wu, X.; Wang, X.; Shan, L.; Zhou, J.; Zhang, X.; Zhu, E.; Yuan, H.; Wang, B. High-Mobility Group At-Hook 1 Mediates the Role of Nuclear Factor I/X in Osteogenic Differentiation Through Activating Canonical Wnt Signaling. Stem Cells 2021, 39, 1349–1361. [Google Scholar] [CrossRef] [PubMed]
  56. Chiefari, E.; Tanyolaç, S.; Iiritano, S.; Sciacqua, A.; Capula, C.; Arcidiacono, B.; Nocera, A.; Possidente, K.; Baudi, F.; Ventura, V.; et al. A Polymorphism of HMGA1 Is Associated with Increased Risk of Metabolic Syndrome and Related Components. Sci. Rep. 2013, 3, 1491. [Google Scholar] [CrossRef] [PubMed] [Green Version]
  57. Kim, K.S.; Lee, J.J.; Shin, H.Y.; Choi, B.H.; Lee, C.K.; Kim, J.J.; Cho, B.W.; Kim, T.-H. Association of Melanocortin 4 Receptor (MC4R) and High Mobility Group AT-Hook 1 (HMGA1) Polymorphisms with Pig Growth and Fat Deposition Traits. Anim. Genet. 2006, 37, 419–421. [Google Scholar] [CrossRef]
  58. Arce-Cerezo, A.; García, M.; Rodríguez-Nuevo, A.; Crosa-Bonell, M.; Enguix, N.; Peró, A.; Muñoz, S.; Roca, C.; Ramos, D.; Franckhauser, S.; et al. HMGA1 Overexpression in Adipose Tissue Impairs Adipogenesis and Prevents Diet-Induced Obesity and Insulin Resistance. Sci. Rep. 2015, 5, 14487. [Google Scholar] [CrossRef] [Green Version]
  59. Foti, D.; Chiefari, E.; Fedele, M.; Iuliano, R.; Brunetti, L.; Paonessa, F.; Manfioletti, G.; Barbetti, F.; Brunetti, A.; Croce, C.M.; et al. Lack of the Architectural Factor HMGA1 Causes Insulin Resistance and Diabetes in Humans and Mice. Nat. Med. 2005, 11, 765–773. [Google Scholar] [CrossRef] [PubMed]
  60. Gong, H.; Xiao, S.; Li, W.; Huang, T.; Huang, X.; Yan, G.; Huang, Y.; Qiu, H.; Jiang, K.; Wang, X.; et al. Unravelling the Genetic Loci for Growth and Carcass Traits in Chinese Bamaxiang Pigs Based on a 1.4 Million SNP Array. J. Anim. Breed. Genet. 2019, 136, 3–14. [Google Scholar] [CrossRef] [PubMed]
  61. Liu, H.; Song, H.; Jiang, Y.; Jiang, Y.; Zhang, F.; Liu, Y.; Shi, Y.; Ding, X.; Wang, C. A Single-Step Genome Wide Association Study on Body Size Traits Using Imputation-Based Whole-Genome Sequence Data in Yorkshire Pigs. Front. Genet. 2021, 12, 629049. [Google Scholar] [CrossRef]
  62. Otto, G.; Roehe, R.; Looft, H.; Thoelking, L.; Knap, P.W.; Rothschild, M.F.; Plastow, G.S.; Kalm, E. Associations of DNA Markers with Meat Quality Traits in Pigs with Emphasis on Drip Loss. Meat Sci. 2007, 75, 185–195. [Google Scholar] [CrossRef]
  63. Zhu, X.; Qian, Y.; Li, X.; Xu, Z.; Xia, R.; Wang, N.; Liang, J.; Yin, H.; Zhang, A.; Guo, C.; et al. Structural Basis of Adhesion GPCR GPR110 Activation by Stalk Peptide and G-Proteins Coupling. Nat. Commun. 2022, 13, 5513. [Google Scholar] [CrossRef] [PubMed]
  64. Hidaka, S.; Mouri, Y.; Akiyama, M.; Miyasaka, N.; Nakahama, K. GPR110, a Receptor for Synaptamide, Expressed in Osteoclasts Negatively Regulates Osteoclastogenesis. Prostaglandins Leukot. Essent. Fat. Acids 2022, 182, 102457. [Google Scholar] [CrossRef]
  65. Falker-Gieske, C.; Blaj, I.; Preuß, S.; Bennewitz, J.; Thaller, G.; Tetens, J. GWAS for Meat and Carcass Traits Using Imputed Sequence Level Genotypes in Pooled F2-Designs in Pigs. G3 Genes|Genomes|Genet. 2019, 9, 2823–2834. [Google Scholar] [CrossRef] [Green Version]
  66. Yuan, B.; Liao, F.; Shi, Z.-Z.; Ren, Y.; Deng, X.-L.; Yang, T.-T.; Li, D.-Y.; Li, R.-F.; Pu, D.-D.; Wang, Y.-J.; et al. Dihydroartemisinin Inhibits the Proliferation, Colony Formation and Induces Ferroptosis of Lung Cancer Cells by Inhibiting PRIM2/SLC7A11 Axis. OTT 2020, 13, 10829–10840. [Google Scholar] [CrossRef]
  67. Wang, L.; Zhang, L.; Yan, H.; Liu, X.; Li, N.; Liang, J.; Pu, L.; Zhang, Y.; Shi, H.; Zhao, K.; et al. Genome-Wide Association Studies Identify the Loci for 5 Exterior Traits in a Large White × Minzhu Pig Population. PLoS ONE 2014, 9, e103766. [Google Scholar] [CrossRef]
  68. Lu, B.; Jiao, Y.; Wang, Y.; Dong, J.; Wei, M.; Cui, B.; Sun, Y.; Wang, L.; Zhang, B.; Chen, Z.; et al. A FKBP5 Mutation Is Associated with Paget’s Disease of Bone and Enhances Osteoclastogenesis. Exp. Mol. Med. 2017, 49, e336. [Google Scholar] [CrossRef] [PubMed] [Green Version]
  69. Ahmady, E.; Deeke, S.A.; Rabaa, S.; Kouri, L.; Kenney, L.; Stewart, A.F.R.; Burgon, P.G. Identification of a Novel Muscle A-Type Lamin-Interacting Protein (MLIP). J. Biol. Chem. 2011, 286, 19702–19713. [Google Scholar] [CrossRef] [Green Version]
  70. Huang, T.; Zhang, M.; Yan, G.; Huang, X.; Chen, H.; Zhou, L.; Deng, W.; Zhang, Z.; Qiu, H.; Ai, H.; et al. Genome-Wide Association and Evolutionary Analyses Reveal the Formation of Swine Facial Wrinkles in Chinese Erhualian Pigs. Aging 2019, 11, 4672–4687. [Google Scholar] [CrossRef]
  71. Tong, X.; Li, G.; Feng, Y. TINAG Mutation as a Genetic Cause of Pectus Excavatum. Med. Hypotheses 2020, 137, 109557. [Google Scholar] [CrossRef] [PubMed]
  72. Heinz, L.X.; Rebsamen, M.; Rossi, D.C.; Staehli, F.; Schroder, K.; Quadroni, M.; Gross, O.; Schneider, P.; Tschopp, J. The Death Domain-Containing Protein Unc5CL Is a Novel MyD88-Independent Activator of the pro-Inflammatory IRAK Signaling Cascade. Cell Death Differ. 2012, 19, 722–731. [Google Scholar] [CrossRef] [PubMed] [Green Version]
  73. Wu, C.; Hu, Z.; He, Z.; Jia, W.; Wang, F.; Zhou, Y.; Liu, Z.; Zhan, Q.; Liu, Y.; Yu, D.; et al. Genome-Wide Association Study Identifies Three New Susceptibility Loci for Esophageal Squamous-Cell Carcinoma in Chinese Populations. Nat. Genet. 2011, 43, 679–684. [Google Scholar] [CrossRef] [PubMed]
  74. Shah, R.; Verma, S.; Bhat, A.; Rasool Bhat, G.; Sharma, V.; Sharma, I.; Singh, H.; Kaul, S.; Rai, E.; Sharma, S. Newly Identified Genetic Variant Rs2294693 in UNC5CL Gene Is Associated with Decreased Risk of Esophageal Carcinoma in the J&K Population–India. BIOCELL 2021, 45, 665–670. [Google Scholar] [CrossRef]
  75. Alonso-Gil, D.; Cuadrado, A.; Giménez-Llorente, D.; Rodríguez-Corsino, M.; Losada, A. Different NIPBL Requirements of Cohesin-STAG1 and Cohesin-STAG2. Nat. Commun. 2023, 14, 1326. [Google Scholar] [CrossRef]
  76. Li, N. SNPS Detection of PSMC3 Gene and the Relationship with Body Measutement and Carcass Traits in Qichuan Cattle. Master’s Thesis, Northwest A&F University, Yangling, China, 2015. [Google Scholar]
  77. Jiang, L.; Liu, X.; Yang, J.; Wang, H.; Jiang, J.; Liu, L.; He, S.; Ding, X.; Liu, J.; Zhang, Q. Targeted Resequencing of GWAS Loci Reveals Novel Genetic Variants for Milk Production Traits. BMC Genom. 2014, 15, 1105. [Google Scholar] [CrossRef] [Green Version]
  78. Kim, E.-S.; Ros-Freixedes, R.; Pena, R.N.; Baas, T.J.; Estany, J.; Rothschild, M.F. Identification of Signatures of Selection for Intramuscular Fat and Backfat Thickness in Two Duroc Populations1. J. Anim. Sci. 2015, 93, 3292–3302. [Google Scholar] [CrossRef] [Green Version]
  79. Hughes, J.M.; Clarke, F.M.; Purslow, P.P.; Warner, R.D. Meat Color Is Determined Not Only by Chromatic Heme Pigments but Also by the Physical Structure and Achromatic Light Scattering Properties of the Muscle. Compr. Rev. Food Sci. Food Saf. 2020, 19, 44–63. [Google Scholar] [CrossRef] [Green Version]
Figure 1. Manhattan and Q-Q plots for three carcass traits. (AC) are CL, COL, and BFT traits, respectively. The red dashed line is the genome-wide threshold −log10(0.05/31,106). Because of the overlap of SNPs, some significant SNPs in CL trait are not marked. The λ represents genomic inflation factors. The red arrow indicates significant SNP loci.
Genes 14 01308 g001
Figure 2. Manhattan and Q-Q plots s for meat trait (a.LD). The dashed red line is the genome-wide threshold −log10(0.05/31,106). The λ represents genomic inflation factors.
Genes 14 01308 g002
Figure 3. The LD block in the significantly associated region on SSC7. LD blocks are marked with triangles. Values in boxes are LD (r2) between SNP pairs. From 31161760 to 32150539, only two significant SNPs, M1Ga0010006 and WU_10.2_7_36255497, are within the LD block, and their LD value is 1. The dashed red line represents 0.05/31,106 threshold, and the red dot represents genome-wide level SNP.
Genes 14 01308 g003
Figure 4. The GO enrichments of CL (a), COL (b), BFT (c) and a.LD (d) traits. Different shapes represent different categories: circle represents biological process (BP), triangle represents cellular component (CC), and square represents molecular function (MF).
Genes 14 01308 g004aGenes 14 01308 g004b
Table 1. Summary statistics for carcass and meat quality traits in Ningxiang pigs.
TraitnMax.Min.Mean ± SDC.V.
CL (cm)50896.4068.5081.35 ± 4.695.77
COL (cm)50886.5034.1066.11 ± 6.169.32
BFT (mm)48571.0616.1741.61 ± 8.2819.90
L.LD50858.7334.8044.73 ± 3.848.58
a.LD50816.171.346.53 ± 2.6139.97
b.LD50810.530.144.00 ± 1.6741.75
pH45min5086.965.466.28 ± 0.314.94
pH24h5086.875.465.91 ± 0.284.74
Table 2. Heritability estimates and genetic and phenotypic correlation coefficients among studied traits.
TraitCLCOLBFTpH45minpH24hL.LDa.LDb.LD
CL0.80 (0.06)0.87−0.53−0.22−0.270.25−0.050.14
COL0.82 ***0.47 (0.07)−0.530.08−0.470.07−0.410.50
BFT−0.12 **−0.16 ***0.48 (0.08)0.07−0.08−0.320.07−0.32
pH45min0.010.02−0.040.14 (0.11)0.100.27−0.390.41
pH24h−0.05−0.090.120.37 ***0.30 (0.09)0.450.42−0.37
L.LD0.06−0.03−0.07−0.24 ***−0.2 ***0.11 (0.07)0.38−0.08
a.LD−0.11 *−0.28 ***0.18 ***−0.07−0.040.31 ***0.44 (0.08)−0.23
b.LD0.27 ***0.32 ***−0.18 ***0.09−0.24 ***0.24 ***0.030.19 (0.09)
Lower triangle numbers are phenotypic correlation, upper are genetic correlation, and the diagonal line represents heritability (±SE) of each trait. “***”, “**”, and “*” indicate p < 0.001, p < 0.01, and p < 0.05, respectively.
Table 3. (a) The genome-level significant SNPs and possible candidate genes for carcass traits. (b) The genome-level significant SNPs and possible candidate genes for meat quality traits.
(a)
TraitSNP (Rsid)CHRPOS (bp)ConsequenceMAFPVE (%)P-adjNearest GeneDIS (bp)
CLALGA0040227
(rs80983858)
730,176,520Downstream gene variant0.3914.358.05 × 10−19GRM42785
ALGA0040238
(rs80815545)
730,197,014Intron variant0.3612.984.72 × 10−11GRM4Within
INRA0024788
(–––)
730,31,7219–––0.3610.082.16 × 10−13HMGA13191
ALGA0039917
(rs81397589)
726,737,102Intron variant0.197.021.25 × 10−9MLIPWithin
ALGA0040777
(rs80845178)
736,323,988Intergenic variant0.446.289.85 × 10−9UNC5CL8213
ALGA0040243
(rs80942143)
730,213,771Intron variant0.255.694.97 × 10−8GRM4Within
WU_10.2_7_48537179
(–––)
741,877,149–––0.425.665.39 × 10−8ADGRF123,492
ASGA0032589
(rs80869188)
731,450,019Intron variant0.325.132.36 × 10−7FKBP5Within
H3GA0020641
(rs80975871)
728,521,421Intron variant0.114.924.17 × 10−7PRIM2Within
ALGA0039880
(rs80928470)
726,501,975Intron variant0.114.865.04 × 10−7TINAGWithin
ALGA0041948
(rs80997002)
750,283,279Intergenic variant0.474.776.30 × 10−7TMC399,190
ALGA0040370
(rs81397836)
732,328,188Intergenic variant0.484.601.02 × 10−6SRSF329,608
M1GA0010006
(rs80946246)
731,161,760Intron variant0.314.551.16 × 10−6ZNF76Within
WU_10.2_7_36255497
(–––)
731,181,718––––0.314.551.16 × 10−6ZNF76Within
MARC0060950
(rs80924014)
746,569,153Upstream gene variant0.164.441.58 × 10−6TMEM14A51,421
COLALGA0040227
(rs80983858)
730,176,520Downstream gene variant0.398.382.67 × 10−25GRM42785
ALGA0040238
(rs80815545)
730,197,014Intron variant0.367.513.17 × 10−10GRM4Within
ALGA0039880
(rs80928470)
726,501,975Intron variant0.115.754.19 × 10−7TINAGWithin
H3GA0020641
(rs80975871)
728,521,421Intron variant0.115.142.30 × 10−7PRIM2Within
ALGA0039917
(rs81397589)
726,737,102Intron variant0.194.884.74 × 10−7MLIPWithin
INRA0024788730,317,219–––0.364.639.33 × 10−7HMGA13191
BFTWU_10.2_18_56654365
(–––)
1851,759,775–––0.1212.665.80 × 10−16HECW1Within
WU_10.2_16_23509998
(–––)
1622,361,911–––0.1212.381.27 × 10−15NIPBLWithin
WU_10.2_8_138925750
(–––)
8129,537,879–––0.1211.944.37 × 10−15SNCA266,751
ALGA0014052
(rs81360052)
282,412,427Intron variant, noncoding transcript variant0.147.724.52 × 10−10TMEM17475,272
ALGA0040227
(rs80983858)
730,176,520Downstream gene variant0.395.016.14 × 10−7GRM42785
(b)
TraitSNPCHRPOS (bp)ConsequenceMAFPVE (%)P-adjNearest GeneDIS (bp)
a.LDWU_10.2_16_23509998
(–––)
1622,361,911–––0.127.942.34 × 10−10NIPBLWithin
WU_10.2_8_138925750
(–––)
8129,537,879–––0.127.448.95 × 10−10SNCA266,751
WU_10.2_18_56654365
(–––)
1851,759,775–––0.127.361.14 × 10−9HECW1Within
ALGA0014052
(rs81360052)
282,412,427Intron variant, noncoding transcript variant0.146.953.38 × 10−9TMEM17475,272
H3GA0000048
(rs80803041)
1493,510Intergenic variant0.014.751.19 × 10−6ERMARD19,168
Disclaimer/Publisher’s Note: The statements, opinions and data contained in all publications are solely those of the individual author(s) and contributor(s) and not of MDPI and/or the editor(s). MDPI and/or the editor(s) disclaim responsibility for any injury to people or property resulting from any ideas, methods, instructions or products referred to in the content.

