Article

Chromosome-Level Genome Assembly Provides Insights into the Evolution of the Special Morphology and Behaviour of Lepturacanthus savala

College of Fisheries, Guangdong Ocean University, Zhanjiang 524088, China
*
Author to whom correspondence should be addressed.
Genes 2023, 14(6), 1268; https://doi.org/10.3390/genes14061268
Submission received: 11 May 2023 / Revised: 13 June 2023 / Accepted: 13 June 2023 / Published: 15 June 2023
(This article belongs to the Special Issue Genetic Improvement of Aquatic Species)

Abstract

:
Savalani hairtail Lepturacanthus savala is a widely distributed fish along the Indo-Western Pacific coast, and contributes substantially to trichiurid fishery resources worldwide. In this study, the first chromosome-level genome assembly of L. savala was obtained by PacBio SMRT-Seq, Illumina HiSeq, and Hi-C technologies. The final assembled L. savala genome was 790.02 Mb with contig N50 and scaffold N50 values of 19.01 Mb and 32.77 Mb, respectively. The assembled sequences were anchored to 24 chromosomes by using Hi-C data. Combined with RNA sequencing data, 23,625 protein-coding genes were predicted, of which 96.0% were successfully annotated. In total, 67 gene family expansions and 93 gene family contractions were detected in the L. savala genome. Additionally, 1825 positively selected genes were identified. Based on a comparative genomic analysis, we screened a number of candidate genes associated with the specific morphology, behaviour-related immune system, and DNA repair mechanisms in L. savala. Our results preliminarily revealed mechanisms underlying the special morphological and behavioural characteristics of L. savala from a genomic perspective. Furthermore, this study provides valuable reference data for subsequent molecular ecology studies of L. savala and whole-genome analyses of other trichiurid fishes.

1. Introduction

Fish have the highest species diversity among vertebrates and highly diverse morphological and ecological properties [1]. More than 32,000 living fish species have been recorded to date [2]. Their size, morphology, physiological and behavioural characteristics, and adaptability vary greatly [3]. This variation has generated substantial interest in the development of genomic resources and assays of functionally important genes in fishes. With the development of genome sequencing and analytical methods, more and more genomic features of various fishes have been reported [4,5], such as zebrafish Danio rerio [6], tiger puffer Takifugu rubripes [7], yellowfin seabream Acanthopagrus latus [8], and giant grouper Epinephelus lanceolatus [9], etc. However, the substantial variation in biological properties and habitats is expected to correspond to significant differences in genome structure among different fishes [10]. Therefore, exploring the genomic evolution and adaptive mechanisms of various fishes has become a focus of animal genome research [11,12]. In particular, the genomes of wild fishes with special biological, behavioural, and ecological characteristics have gained widespread attention.
During long-term evolution, some fishes have undergone substantial divergence in morphology, habits, behavioural traits, and survival and propagation strategies [13,14]. These traits often involve complex evolution of the genome and related developmental mechanisms. For example, cave fish commonly exhibit a series of specific phenotypic changes, including eye degeneration, pigment loss, and increases in taste buds and mechanosensory organs [15,16]. McGaugh et al. [17] identified candidate genes that cause eye degeneration by sequencing the genome of the Mexican tetra Astyanax mexicanus. A genomic analysis of the elephant shark Callorhinchus milii showed that the SCPP (secreted calcium-binding phosphoprotein) gene loss explains the absence of hard bones in the endoskeleton of cartilaginous fishes [18]. In the tiger tail seahorse Hippocampus comes, the disappearance of its ventral fins may be related to the TBX4 gene loss, which regulates hindlimb formation [19]. Moreover, the high expression of the expanded astacin metalloprotease gene family in the brood pouch of male H. comes contributed to its pregnancy [19]. Based on comparative genomic analyses, the accelerated evolution of genes involved in the growth hormone and insulin-like growth factor 1 axis was revealed to be an important driving factor for the rapid growth and large size of ocean sunfish Mola mola [20]. In comparative genomic analyses of Siamese fighting fish Betta splendens and its five variants, a large number of single nucleotide polymorphisms (SNPs) and genes related to aggressive behaviour have been detected [21]. Recently, Zhao et al. [22] reported that fast-swimming fishes (e.g., southern bluefin tuna Thunnus maccoyii, Pacific bluefin tuna Thunnus orientalis, swordfish Xiphias gladius, and large yellow croaker Larimichthys crocea) have more haemoglobin genes than relatively slow-moving fishes (e.g., ocean sunfish Mola mola, tongue sole Cynoglossus semilaevis, and H. comes). These research advances provide insights into the formation of unique phenotypic and behavioural traits in wild fishes at the genomic level.
The Savalani hairtail Lepturacanthus savala (Cuvier, 1829), which belongs to the family Trichiuridae (Teleostei, Perciformes), is a benthopelagic fish widely distributed in the tropical and subtropical waters of the Indo-West Pacific region [23,24]. It is one of the main fishing targets for bottom trawls, shore seines, and bag nets in the coastal countries of Asia [25]. In China, L. savala can be found in the East China and South China Seas, and is abundant in the northern South China Sea [26]. Based on a routine fishery resources survey, the annual catch of L. savala was one-quarter to one-fifth of the total annual catch of trichiurids in the northern South China Sea (approximately 300,000 t, 2010–2021), supporting an important commercial marine fishery. In some Indian Ocean countries, L. savala is also a major fishery resource [27]. In the period of 1999 to 2009, the annual catch of this species in Pakistani coastal waters ranged from 31,623 t to 20,375 t [28]. L. savala is a popular hairtail fish and contributes substantially to the world trichiurid fisheries, second only to the genus Trichiurus.
Similar to other trichiurid fishes, the body of L. savala is remarkably elongated and strongly compressed, with a ribbon-like shape. Its total length generally ranges from 30 to 87 cm (maximum about 100 cm) [29], and the number of vertebrae (135 to 141) [30] exceeds that of most teleost fishes (mainly 21 to 56) [31]. Both the ventral and caudal fins of L. savala are absent, with a whip-elongated tail that is grey-black at the end [32]. The first anal-fin spine is large, its length half of the diameter of the eye, and the two small canine teeth on the upper jaw project forward [25]. These taxonomic traits distinguish L. savala from other trichiurid species. As a ferocious predatory fish, L. savala occupies a high trophic level in the marine food chain [33]. It not only has extremely sharp teeth, but also has strong swimming ability [26]. Moreover, the long-distance migratory behaviour of L. savala [34] is supported by its excellent swimming motility [35]. L. savala is relatively derived and is in a special evolutionary position in the family Trichiuridae. L. savala is also clearly distinguished from other teleost fishes and can be considered a special case in the genetic evolution of teleosts. Previous studies of L. savala have mainly focused on fishery resources [28,36], biological characteristics [32], feeding habits [37], mitochondrial DNA [38], and population genetics [39]. However, the molecular mechanisms underlying the evolution of its unique traits have not yet been addressed. Therefore, genomic studies of L. savala are needed to elucidate the evolutionary mechanisms underlying its particular morphological and behavioural traits, and also to unravel the molecular determinants of the formation of this special group of trichiurid fishes.
In this study, we combined Illumina short reads, PacBio long reads, and Hi-C sequencing data to obtain a chromosome-level genome assembly of L. savala. RNA sequencing of muscle, liver, and heart tissues was performed using PacBio and Illumina platforms to assist in the structural and functional annotations of the genome. Finally, we performed the comparative analyses and searched for the signature of positive selection in genomic data for L. savala and other fish species to investigate phylogenetic relationships, divergence times, and gene family contraction and expansion. Our findings clarify the evolutionary mechanisms underlying specific features of L. savala at the genome-wide level, and provide important genomic resources and new perspectives for exploring the genomic evolution of trichiurid fishes.

2. Materials and Methods

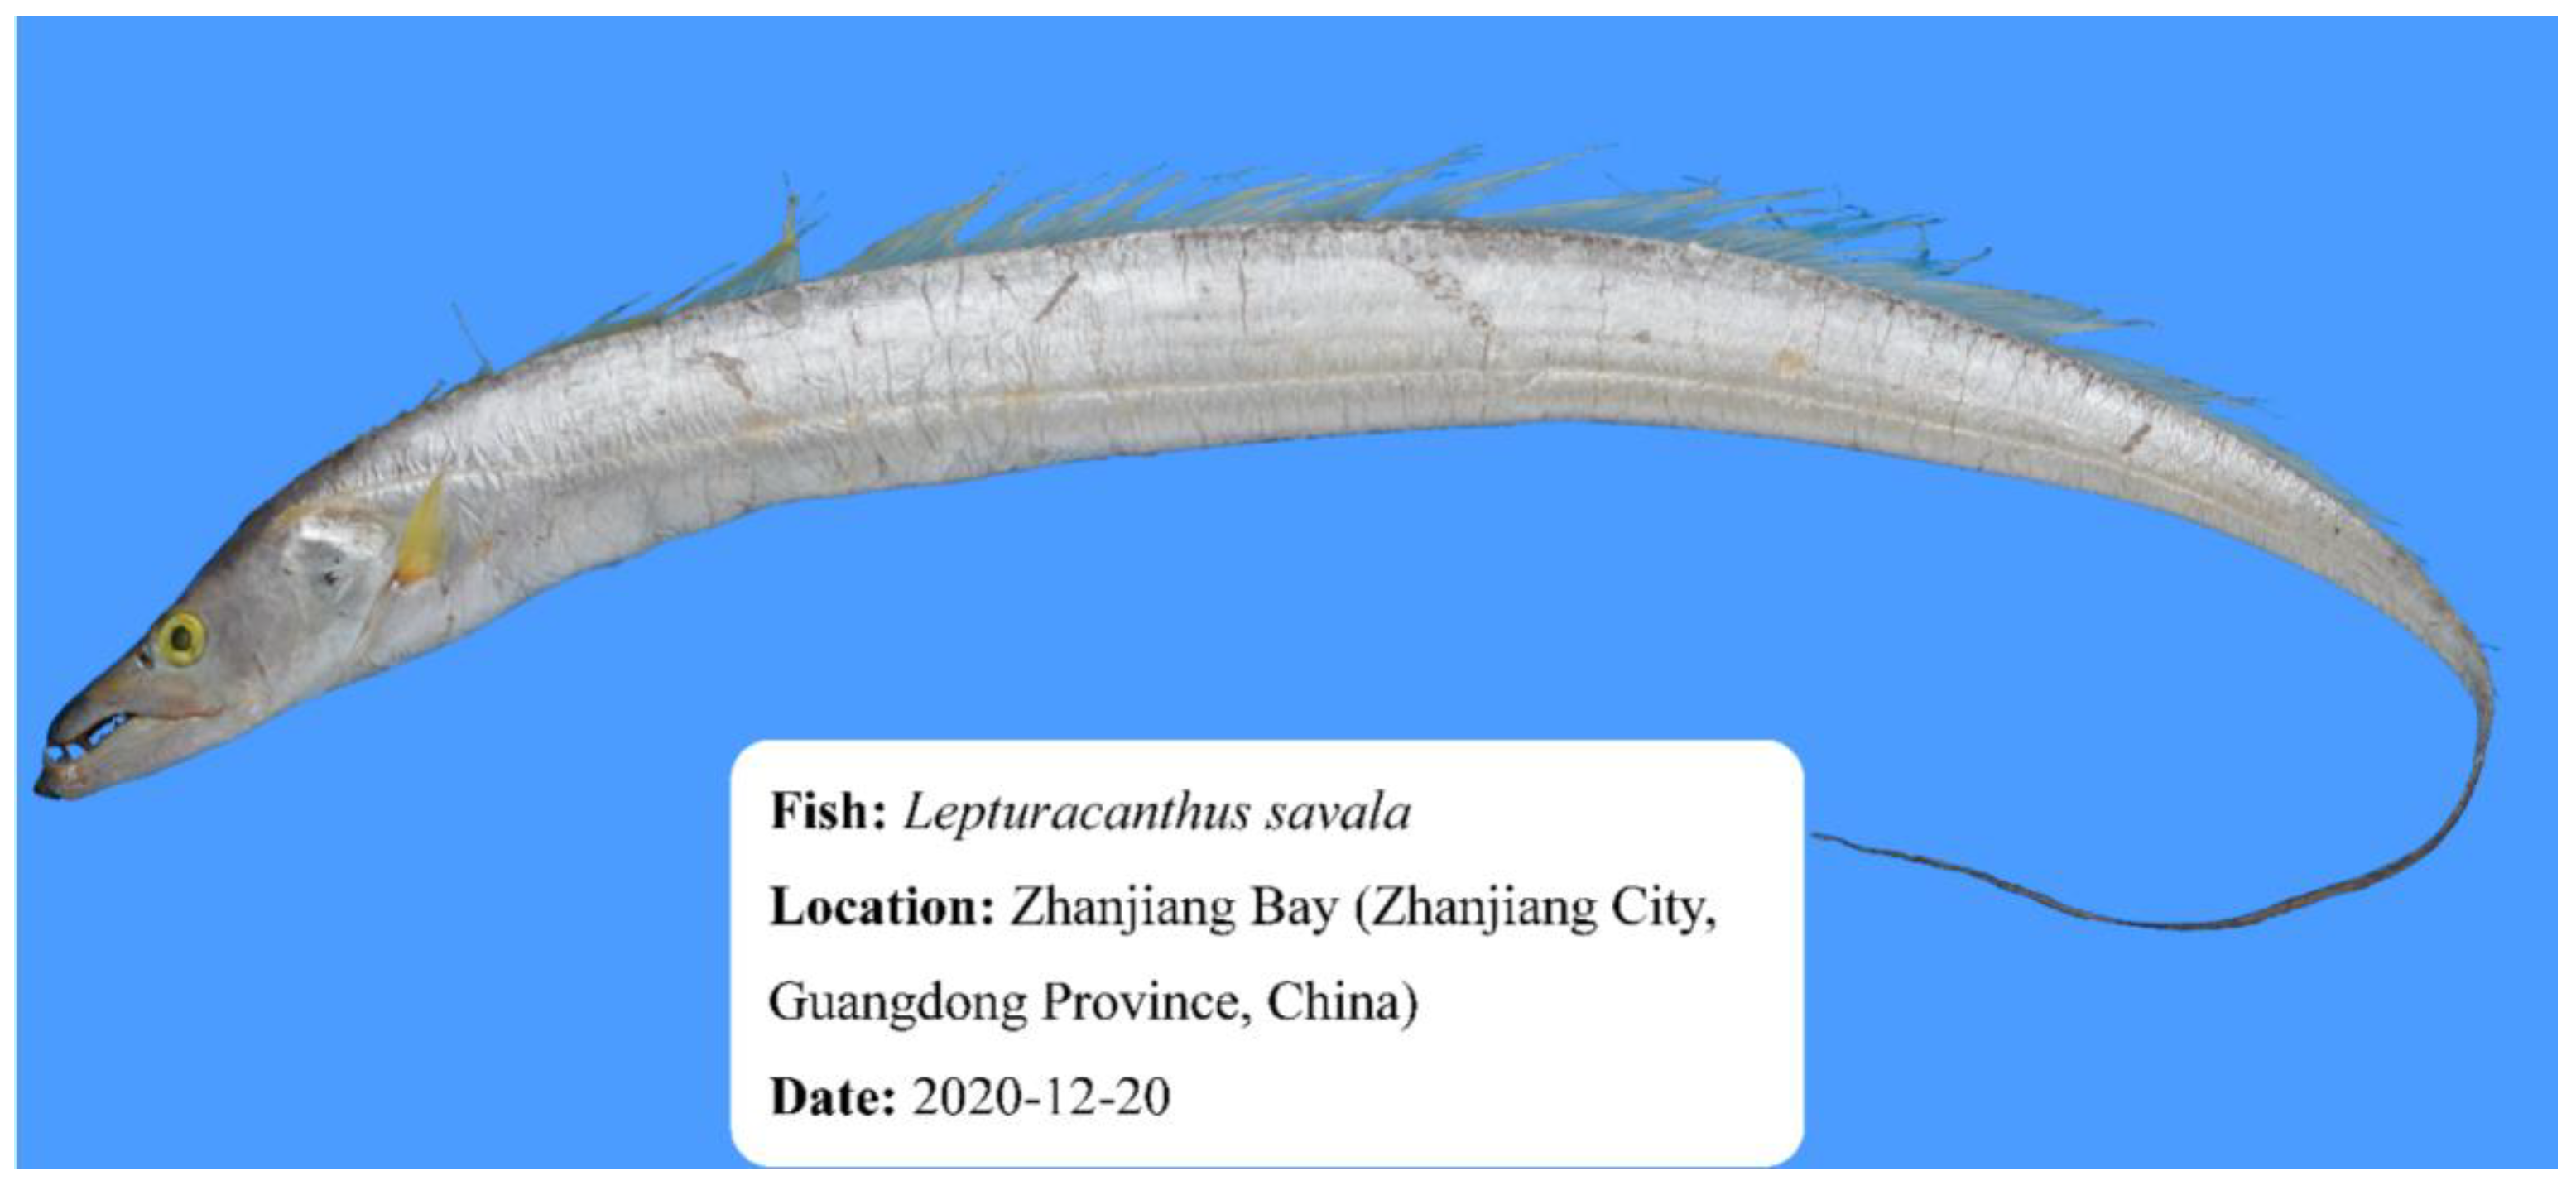
2.1. Sample Collection

During the fishery resource survey along the eastern coast of Leizhou Peninsula (Zhanjiang City, Guangdong Province, China) in December 2020, three male L. savala were captured through bottom trawls (Figure 1). Live fish were anaesthetized using MS-222 (ethyl 3-aminobenzoate methanesulfonate, Sigma-Aldrich, Shanghai, China) at a concentration of 200 mg/L. After the fish were deeply anaesthetized, the muscle, liver, and heart tissue samples were collected from each fish using three 1.5 mL sterile tubes. To avoid contamination, the sampled tissues were not mixed with other tissues (e.g., gills, intestines, and stomach) or environmental DNA. The samples were immediately placed in liquid nitrogen for rapid freezing, and then transferred to a −80 °C refrigerator in the laboratory for subsequent construction of sequencing libraries. The experimental animal protocols in this study were reviewed and approved by the Animal Experimental Ethics Committee of Guangdong Ocean University, China (approval number: 1201-2020).

2.2. DNA and RNA Extraction for Library Construction and Sequencing

The genomic DNA was extracted from muscle tissue using the standard phenol/chloroform extraction protocol [40]. The concentration of extracted DNA was detected by Nanodrop 2000 Spectrophotometer (Thermo Fisher Scientific, Waltham, MA, USA), and the purity and integrity were determined by agarose gel electrophoresis. According to the standard Illumina protocol, a paired-end library with an insert size of 150 bp was constructed for sequencing on the Illumina HiSeq 2500 platform (Illumina, San Diego, CA, USA). A SMRTbell library with a fragment size of 20 kb was constructed using the SMRTbell Express Template Prep Kit for sequencing on the PacBio Sequel II platform (Pacific Biosciences, Menlo Park, CA, USA). DNA samples were fragmented by Covaris M220 ultrasonic disruptor (Covaris, Shanghai, China), followed by enrichment and purification of large DNA fragments using magnetic beads.
Total RNA was extracted using TRIzol reagent (Invitrogen, Carlsbad, CA, USA) for Illumina library construction for each tissue type (the muscle, liver, and heart), while the PacBio library was constructed using mixed RNA from the three tissues. The RNA integrity number (RIN) and RNA concentration of each extracted total RNA were then detected by Agilent 2100 Bioanalyzer (Agilent Technologies, Palo Alto, CA, USA) and agarose gel electrophoresis, respectively. Total RNA of each tissue was reverse transcribed using the TUREscript First Stand cDNA Synthesis Kit (AidLab, Beijing, China), and a double-stranded cDNA library was synthesized, resulting in the construction of three Illumina paired-end sequencing libraries with insert sizes of about 150 bp. Full-length cDNA was synthesized using the SMARTer cDNA Synthesis Kit (Takara Bio, Beijing, China), and the cDNA concentration in the library was measured using Qubit 3.0 Fluorometer (Invitrogen, Carlsbad, CA, USA). Subsequently, the full-length cDNA fragments were end-repaired, and the SMRT dumbbell adapters were connected for constructing the PacBio sequence library. Finally, the libraries were sequenced using the Illumina HiSeq 2500 and PacBio Sequel II platforms, and the resulting data were used for genome annotations.

2.3. Evaluation of Genome Size, Heterozygosity, and Contamination

The raw reads obtained by Illumina sequencing of muscle DNA were filtered using Trimmomatic v0.39 [41] to obtain clean reads. Ten thousand randomly selected clean reads (5000 for Read1 and 5000 for Read2) were mapped to the NCBI nucleotide database by using NCBI blast++, and the top six mapped species were selected in descending order of mapping time. If all mapped results are homologous, the samples have not been subjected to exogenous contamination. Jellyfish v1.1.11 [42] was used to mathematically estimate the genome size based on the K-mer analysis method (base sequence containing K bases). The 17 bp K-mers (17mers) were extracted from the sequencing data, and the frequency of each 17mer was calculated. The K-mer depth was the expected value corresponding to the Poisson distribution. The calculated genome size (unit: Megabits) was defined as the number of K-mers/depth of K-mers. Total K-mers were assembled using SOAPdenovo v2.0.0 [43] with K-mer set at 41 bp. The heterozygosity rate of the corrected genome was obtained by calculating the proportion of heterozygous sites.

2.4. Genome Assembly and Integrity Assessment

The raw sequencing data contained two adaptors, which was the dumbbell-shaped structural sequence called polymerase reads. Subreads were obtained after the adaptor sequences were interrupted and filtered out, then the high-precision HiFi reads were generated using SMRT Link v10.2 [44]. Hifiasm v0.12 [45] was used to quickly assemble HiFi reads (parameters selected by default), and the contigs and scaffolds with more complete sequences were constructed in turn. After obtaining contigs, NextPolish v1.2.1 [46] was used to correct errors with Illumina clean reads obtained in the genome survey step, and finally obtain more accurate genome sequences.
Integrities of the assembled genome and the conserved genes in the assembled genome were judged using Benchmarking Universal Single-copy Orthologs method (BUSCO) [46] and Core Eukaryotic Genes Mapping Approach (CEGMA) [47], respectively, to evaluate the integrity of the assembled genome and the uniformity of Illumina and PacBio sequencing. Illumina clean reads were mapped to the assembled genome sequences using BWA v0.7.17 [48]. Further, the BWA mapping results (BAM format) were used to detect SNPs at the genome scale using samtools v1.15.1 [49]. The processing included sorting chromosome coordinates and removing duplicate reads, etc. The SNPs contain homology SNPs and heterozygosis SNPs, and the ratio of homology SNPs to total SNPs could reflect the correctness of the genome assembly.

2.5. Chromosome Assembly by Hi-C

Hi-C libraries of muscle tissue were built according to the high-throughput chromatin conformation capture (Hi-C) library construction technology standards, and then sequenced using the Illumina HiSeq 2500 platform. Only filtered reads that passed the HiCUP v0.8.0 [50] quality control pipeline were used for subsequent chromosome assembly. HiCUP subroutine hicup_truncater was used to identify the restriction sites on clean reads and cut off redundant chimeric sequences. Paired-end reads were mapped to the preliminarily assembled genome using the hicup_mapper subroutine, and the mapping results were combined. The resulting data were filtered using the hicup_filter subroutine to obtain valid pairs used as Di-Tags. Thereafter, PCR repeats were removed by the hicup_deduplicater subroutine. The data obtained after quality control contained effective genome-wide chromosome cross-linking information, which facilitated genome assembly to the chromosome level. Since the interaction frequency on the same chromosome decreases as the interaction distance increases, the contigs or scaffolds of the same chromosome can be sorted and oriented. Accordingly, ALLHiC program [51] was used to assemble the Hi-C data and to cluster the assembled contig/scaffold sequences to obtain a chromosome-level genome.

2.6. Genome Repetition, Structure, Function, and Noncoding RNA Annotation

Protein-coding genes were predicted by using three methods, ab initio prediction, homology-based identification, and an RNA-Seq data-assisted method. First, Augustus v3.4.0 [52], GlimmerHMM v3.01 [53], Geneid v1.4.4 [54], and Genscan v1.0.0 [55] were used for ab initio prediction by counting codon frequency, exon–intron distribution, and training dataset, etc. The RNA-Seq data from three tissues act as the input training sets of Augustus and SNAP programs. Second, genome-wide protein sequences of D. rerio, Homo sapiens, T. maccoyii, Thunnus albacares, Etheostoma spectabile, Sander lucioperca, Perca fluviatilis, Perca flavescens, T. rubripes, Gasterosteus aculeatus, and Oryzias latipes were downloaded from the NCBI database and used for homology mapping to the L. savala genome using tBlastn [56] and GeneWise v2.4.1 [57] in order to identify known genes with high similarity (E-value ≤ 1 × 10⁻⁵). Third, two methods were used to predict protein coding genes based on RNA-Seq data from three tissues. That is, the prediction gene after Tophat v2.1.1 [58] and Trinity v2.13.2 [59] assembly were performed using Cufflinks v2.2.1 [58] and PASA v2.5.2 (https://github.com/PASApipeline/PASApipeline, accessed on 21 March 2022), respectively. Gene sets predicted by the above three methods were integrated by EVidenceModeler v1.1.1 [60]. Alternative splicing transcripts were removed, and the longest transcripts were retained using PASA. Further, the predicted gene sequences were mapped to NR (nonredundant proteins), SwissProt (Swiss Protein Institute), KEGG (Kyoto Encyclopedia of Genes and Genomes) [61], and GO (gene ontology) [62] databases for the functional annotation of protein-coding genes. Conserved functional domain information and protein families were predicted using the Pfam (protein family) [63] and InterPro (Integrated Resource of Protein) databases.
Tandem repeats in the genome were searched using TRF program. Database mapping and ab initio prediction methods were used to identify interspersed repeats in the genome. Based on the homologous repeat database RepBase [64], RepeatMasker v4.1.2, and RepeatProteinMask v4.1.2 [65], programs were used to identify sequences with similar repeat sequences of known nucleic acids and amino acids, respectively. The ab initio prediction method firstly used LTR_Finder v1.0.7 [66], RepeatScout v1.0.5 [53], and RepeatModeler v2 [53] programs to build de novo repeated sequence database, and then RepeatMasker v4.1.2 was used to predict interspersed repeats. Annotations of noncoding RNA included tRNA, rRNA, miRNA, and snRNA. tRNAscan-SE [67] was used to predict tRNA. The rRNA sequences of closely related species were selected as reference sequences for searches by blast alignment. MiRNAs and snRNAs were predicted based on the Rfam family covariance model using INFERNAL.

2.7. Genome Evolution, Gene Family Dynamics, and Positive Selection Analyses

Protein-coding genes of less than 30 amino acids in the genomes of L. savala and 18 other fishes (Acanthopagrus schlegelii, C. semilaevis, D. rerio, Epinephelus akaara, G. aculeatus, H. comes, Ictalurus punctatus, L. crocea, Monopterus albus, P. flavescens, Seriola dumerili, Scleropages formosus, Scophthalmus maximus, Sebastes schlegelii, T. albacares, T. maccoyii, T. rubripes, and Cetorhinus maximus) were removed, and alternative splicing of the longest transcript was used for a gene family cluster analysis. Similarity relationships between the protein sequences of these 19 species were calculated by Blastp [56] (E-value = 1 × 10⁻⁷). Based on similarity, orthologous genes from 19 species were clustered using OrthoMCL v2.0.9 [68] (extension coefficient = 1.5) to obtain single-copy gene families and multi-copy gene families. Then, the expansion and contraction of gene families were evaluated using CAFE (http://sourceforge.net/projects/cafehahnlab/, accessed on 25 March 2022). Further, GO and KEGG pathway enrichment analyses of expanded and contracted gene families were carried out using BioSciTools (https://bioscitools.github.io, accessed on 25 March 2022) with p < 0.05 and FDR (false discovery rate) < 0.05 as thresholds for statistical significance. Gene families detected only in L. savala and not in other species were considered to be unique to L. savala.
A maximum likelihood phylogenetic tree was constructed using the RAxML program [64] based on alignment of all single-copy genes for the 19 species. Divergence times between species (95% confidence intervals) were estimated using McMcTree in the PAML v1.3.1 package [69]. Six calibration times for species divergence were obtained from the TimeTree database [70], including G. aculeatus and S. schlegelii (68–87 Mya), C. semilaevis and S. maximus (49–81 Mya), T. rubripes and G. aculeatus (99–127 Mya), T. rubripes and C. semilaevis (94–115 Mya), T. rubripes and H. comes (106–114 Mya), and T. rubripes and D. rerio (206–252 Mya). Finally, the convergence of bifurcation times for tree branches was verified by Tracer v1.7.1 [71].
Candidate genes associated with the special traits of L. savala were screened by setting up two groups of positive selection combinations, and gene function annotation and enrichment analyses were performed. Group 1 (L. savala) vs. a selection of fishes (A. schlegelii, L. crocea, and P. flavescens) was used to screen the genes associated with the ribbon-like shape, scaleless body surface, and absence of ventral fins of L. savala. Group 2 (L. savala, M. albus) vs. the same selection of fishes (A. schlegelii, L. crocea, and P. flavescens) was set to further screen for genes associated with the body shape of L. savala. Based on protein sequence alignment data for single-copy gene families of the above five species, the branch site model in PAML was used to detect whether each gene family was positively selected in the foreground branch. Finally, GO and KEGG enrichment analyses of positively selected genes were performed using BioSciTools, and p < 0.05 and FDR < 0.05 were used as thresholds for statistical significance.

3. Results

3.1. Genome Size Estimation and Initial Characterization of the Genome

In total, 291,902,400 raw paired-end reads were generated by genomic surveys on the Illumina platform, and 237,372,083 clean reads were obtained for subsequent analyses. The proportion of clean reads with base quality > Q30 was 90.66%, the sequencing error rate was 0.04%, and the GC content was 39.75%. Mapping results showed that the top six species were all Perciformes, namely, Dicentrarchus labrax (0.36%), Haplochromis burtoni (0.32%), Tetraodon nigroviridis (0.2%), T. rubripes (0.19%), O. latipes (0.11%), and Trichiurus lepturus (0.11%). This indicates that the sequencing data were reliable and free from genomic contamination by other species, especially microorganisms. Based on the expected value of the Poisson distribution given by the K-mer analysis (K-mer = 17), the K-mer depth was 78. Accordingly, the genome size of L. savala was estimated to be 815.49 Mbp, revised to 802.34 Mbp, and the genome heterozygosity rate was 0.53%.

3.2. Genome Assembly and Evaluation

A total of 1,591,638 high-quality HiFi reads were obtained by PacBio-SMRT sequencing, and 215 contigs were assembled (Supplementary Table S1). The assembled genome size was 790.02 Mbp, close to the estimate from the genome survey (802.34 Mbp), and the contig N50 length reached 19.01 Mbp.
Taking the database with 3640 orthologous single-copy genes constructed by BUSCO as a reference, the L. savala genome contained 3491 (95.9%) complete BUSCOs, of which 3459 (95.0%) were complete single-copy BUSCOs, and 32 (0.90%) were complete duplicated BUSCOs (Supplementary Figure S1). That is, the assembled genome contained more than 95.9% of orthologous genes, indicating a high rate of gene coverage. A CEGMA evaluation showed that the assembled genome completely matched 229 (92.34%) of 248 conserved genes in eukaryotic model organisms, and that the conserved genes were fully assembled, demonstrating the integrity of the L. savala genome. The read mapping rate was as high as 98.16%, the proportion of the genome covered by reads was 99.91%, and the average depth of coverage per base by reads was 86.79%. Furthermore, 2,498,432 (0.3918%) heterozygous SNPs and 641 (0.0001%) homologous SNPs were identified. The low ratio of homologous SNPs indicated a high single-base accuracy for the assembled genome. The GC content of the assembled genome sequences calculated with a 10 Kbp window was concentrated around 39.03%, and no significant GC separation was detected, indicating a lack of exogenous contamination in the L. savala genome.

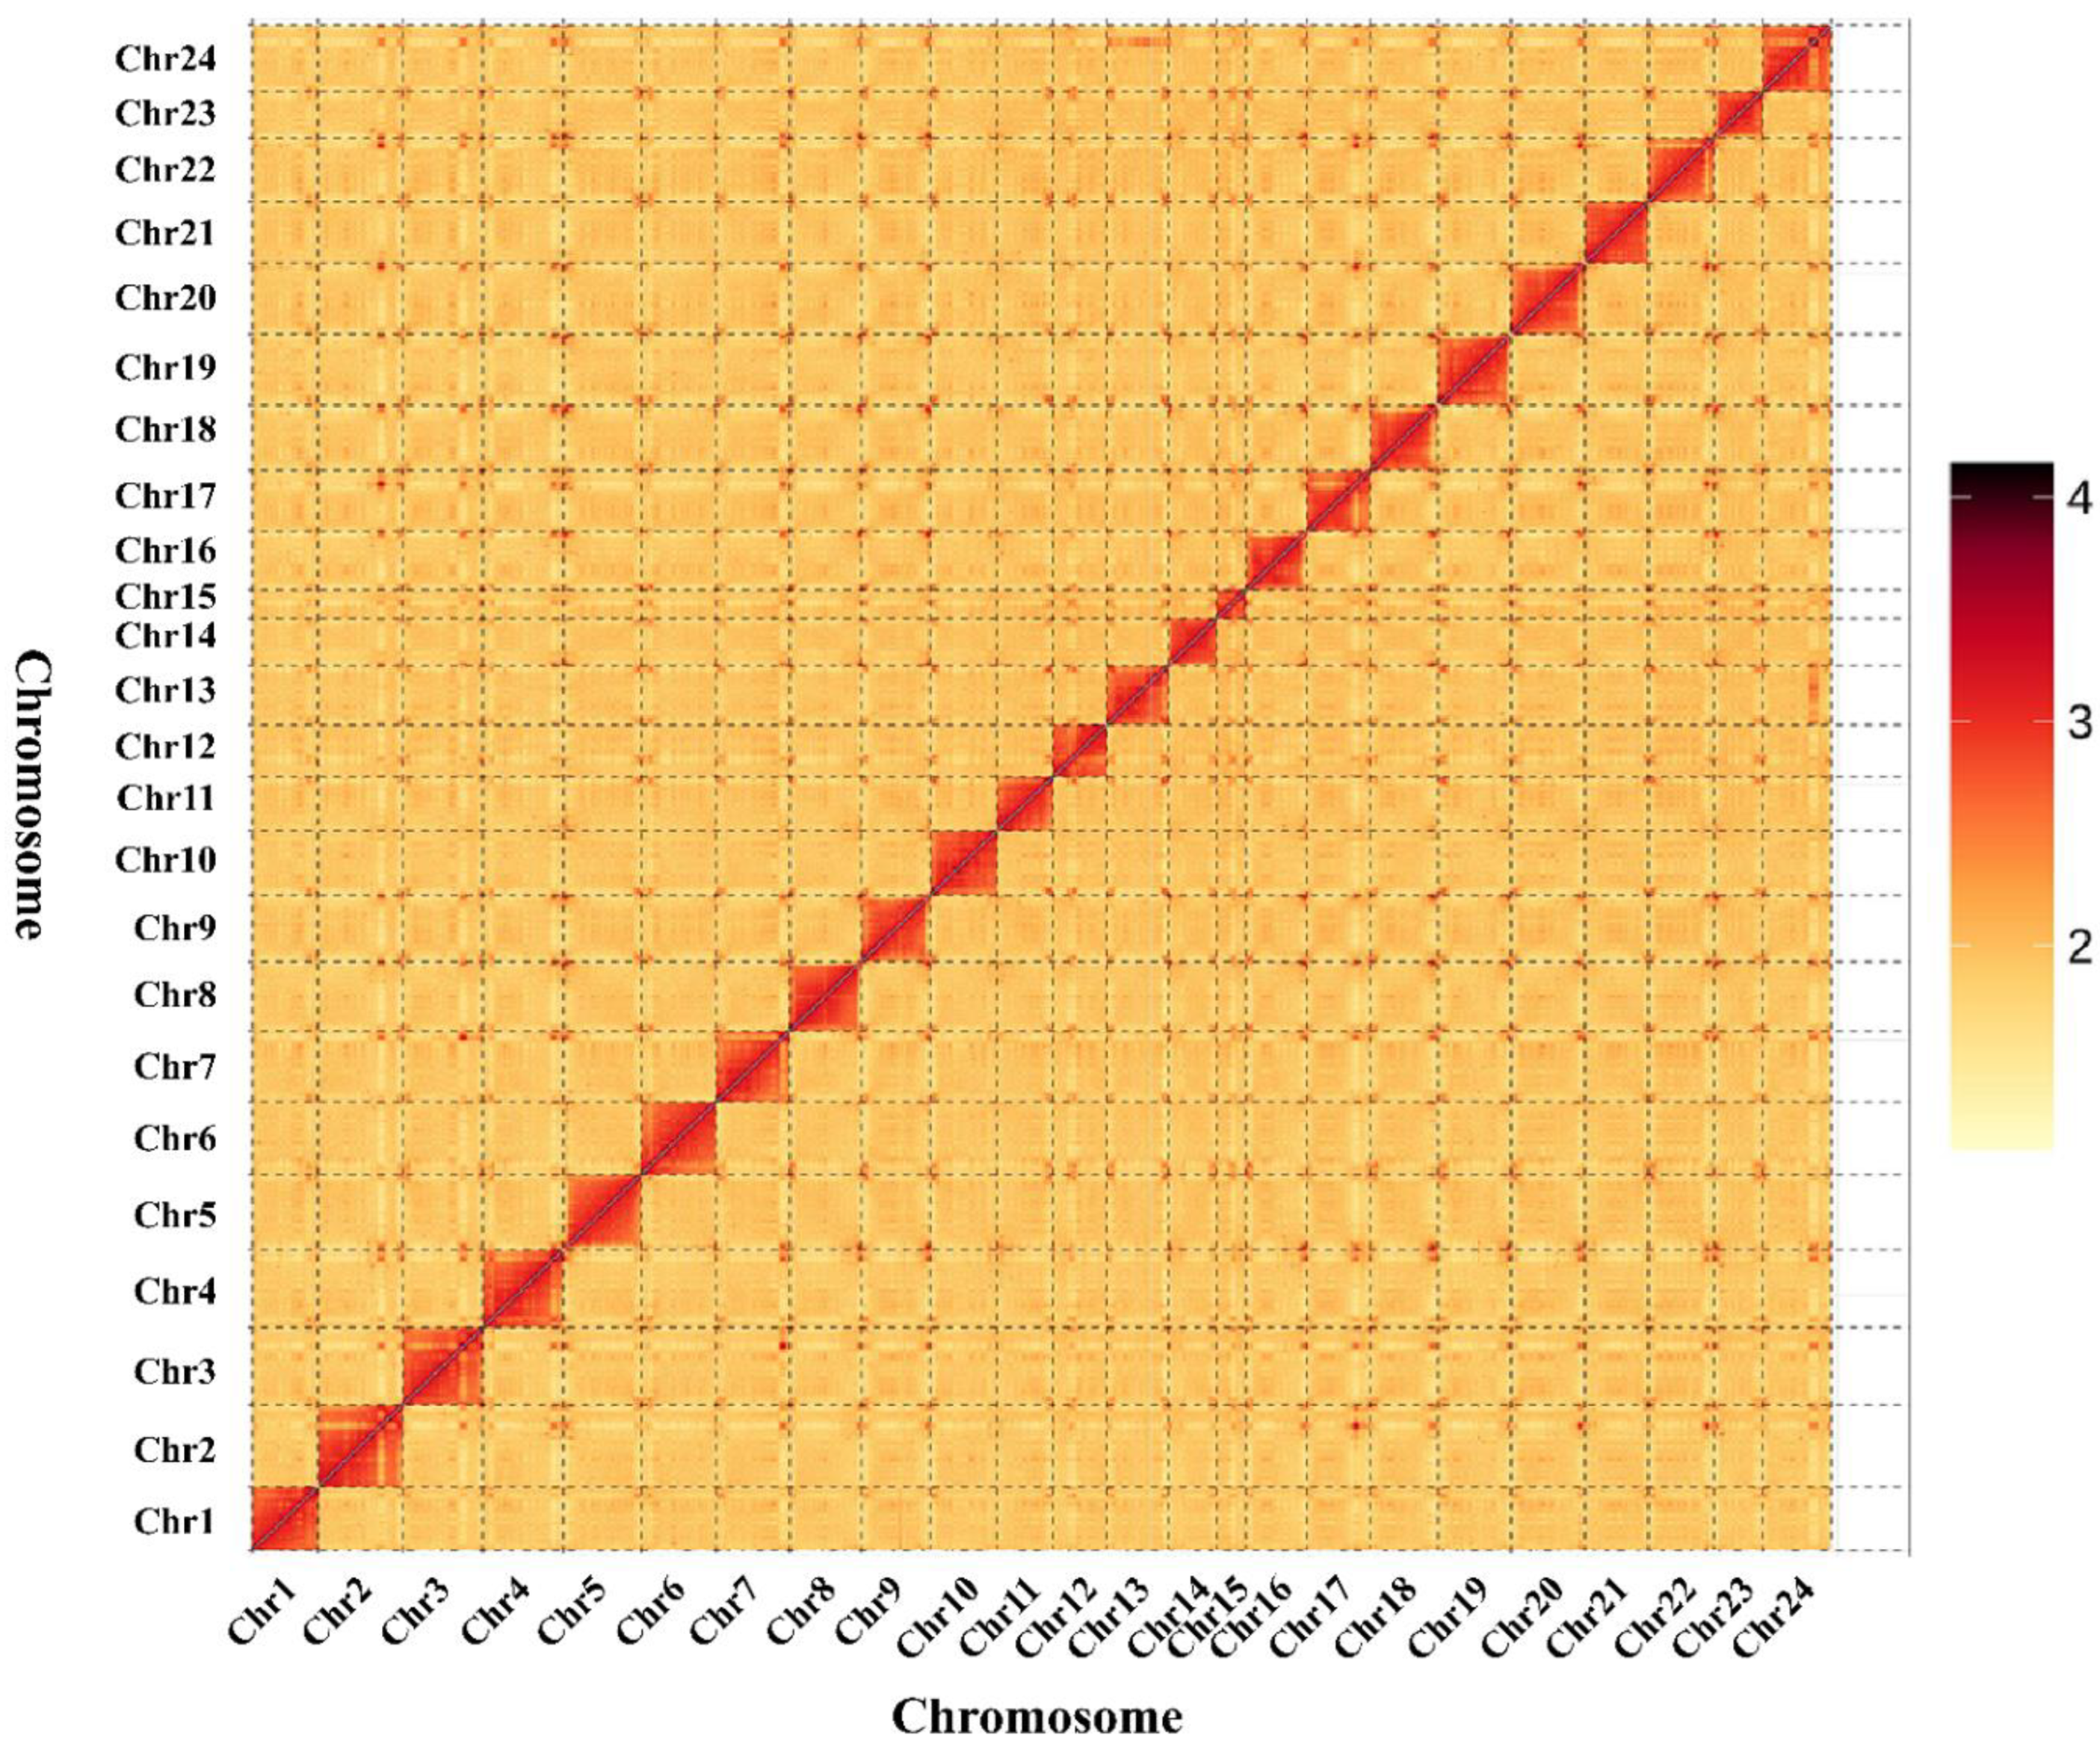
3.3. Chromosome Assembly by Hi-C Data

A total of 12,034,266 raw paired-end reads were generated by the Illumina sequencing of the Hi-C library, and 10,213,512 clean reads were obtained after quality control. A HiCUP analysis and mapping results showed 6,124,460 clean reads (59.96%) for read1 and 6,124,460 (59.96%) clean reads for read2. There were 5,365,963 valid Di-Tags and 758,497 invalid Di-tags (containing multiple types) obtained by hup_filter filtering (Supplementary Table S2). After removing PCR repeats, 5,117,719 unique Di-Tags were retained and 2,189,442 unique cis Di-Tags (560,836 cis-close Di-Tags and 1,628,606 cis-far Di-Tags) and 2,928,442 unique trans Di-Tags were identified. Thus, the effective utilization of Hi-C data, calculated as unique Di-Tags/total read pairs, was 50.11%. These Di-Tags record the frequency of interactions within and among chromosomes, and the assembled chromosome-level genome contained 219 contigs and 101 scaffolds. Chromosome clustering based on 11 scaffolds (790,034,746 bp) showed that 24 sequences (758,527,366 bp) were anchored and 77 sequences (31,507,380 bp) were not anchored to the chromosome, with a genome assembly rate of 96.01% (Figure 2).

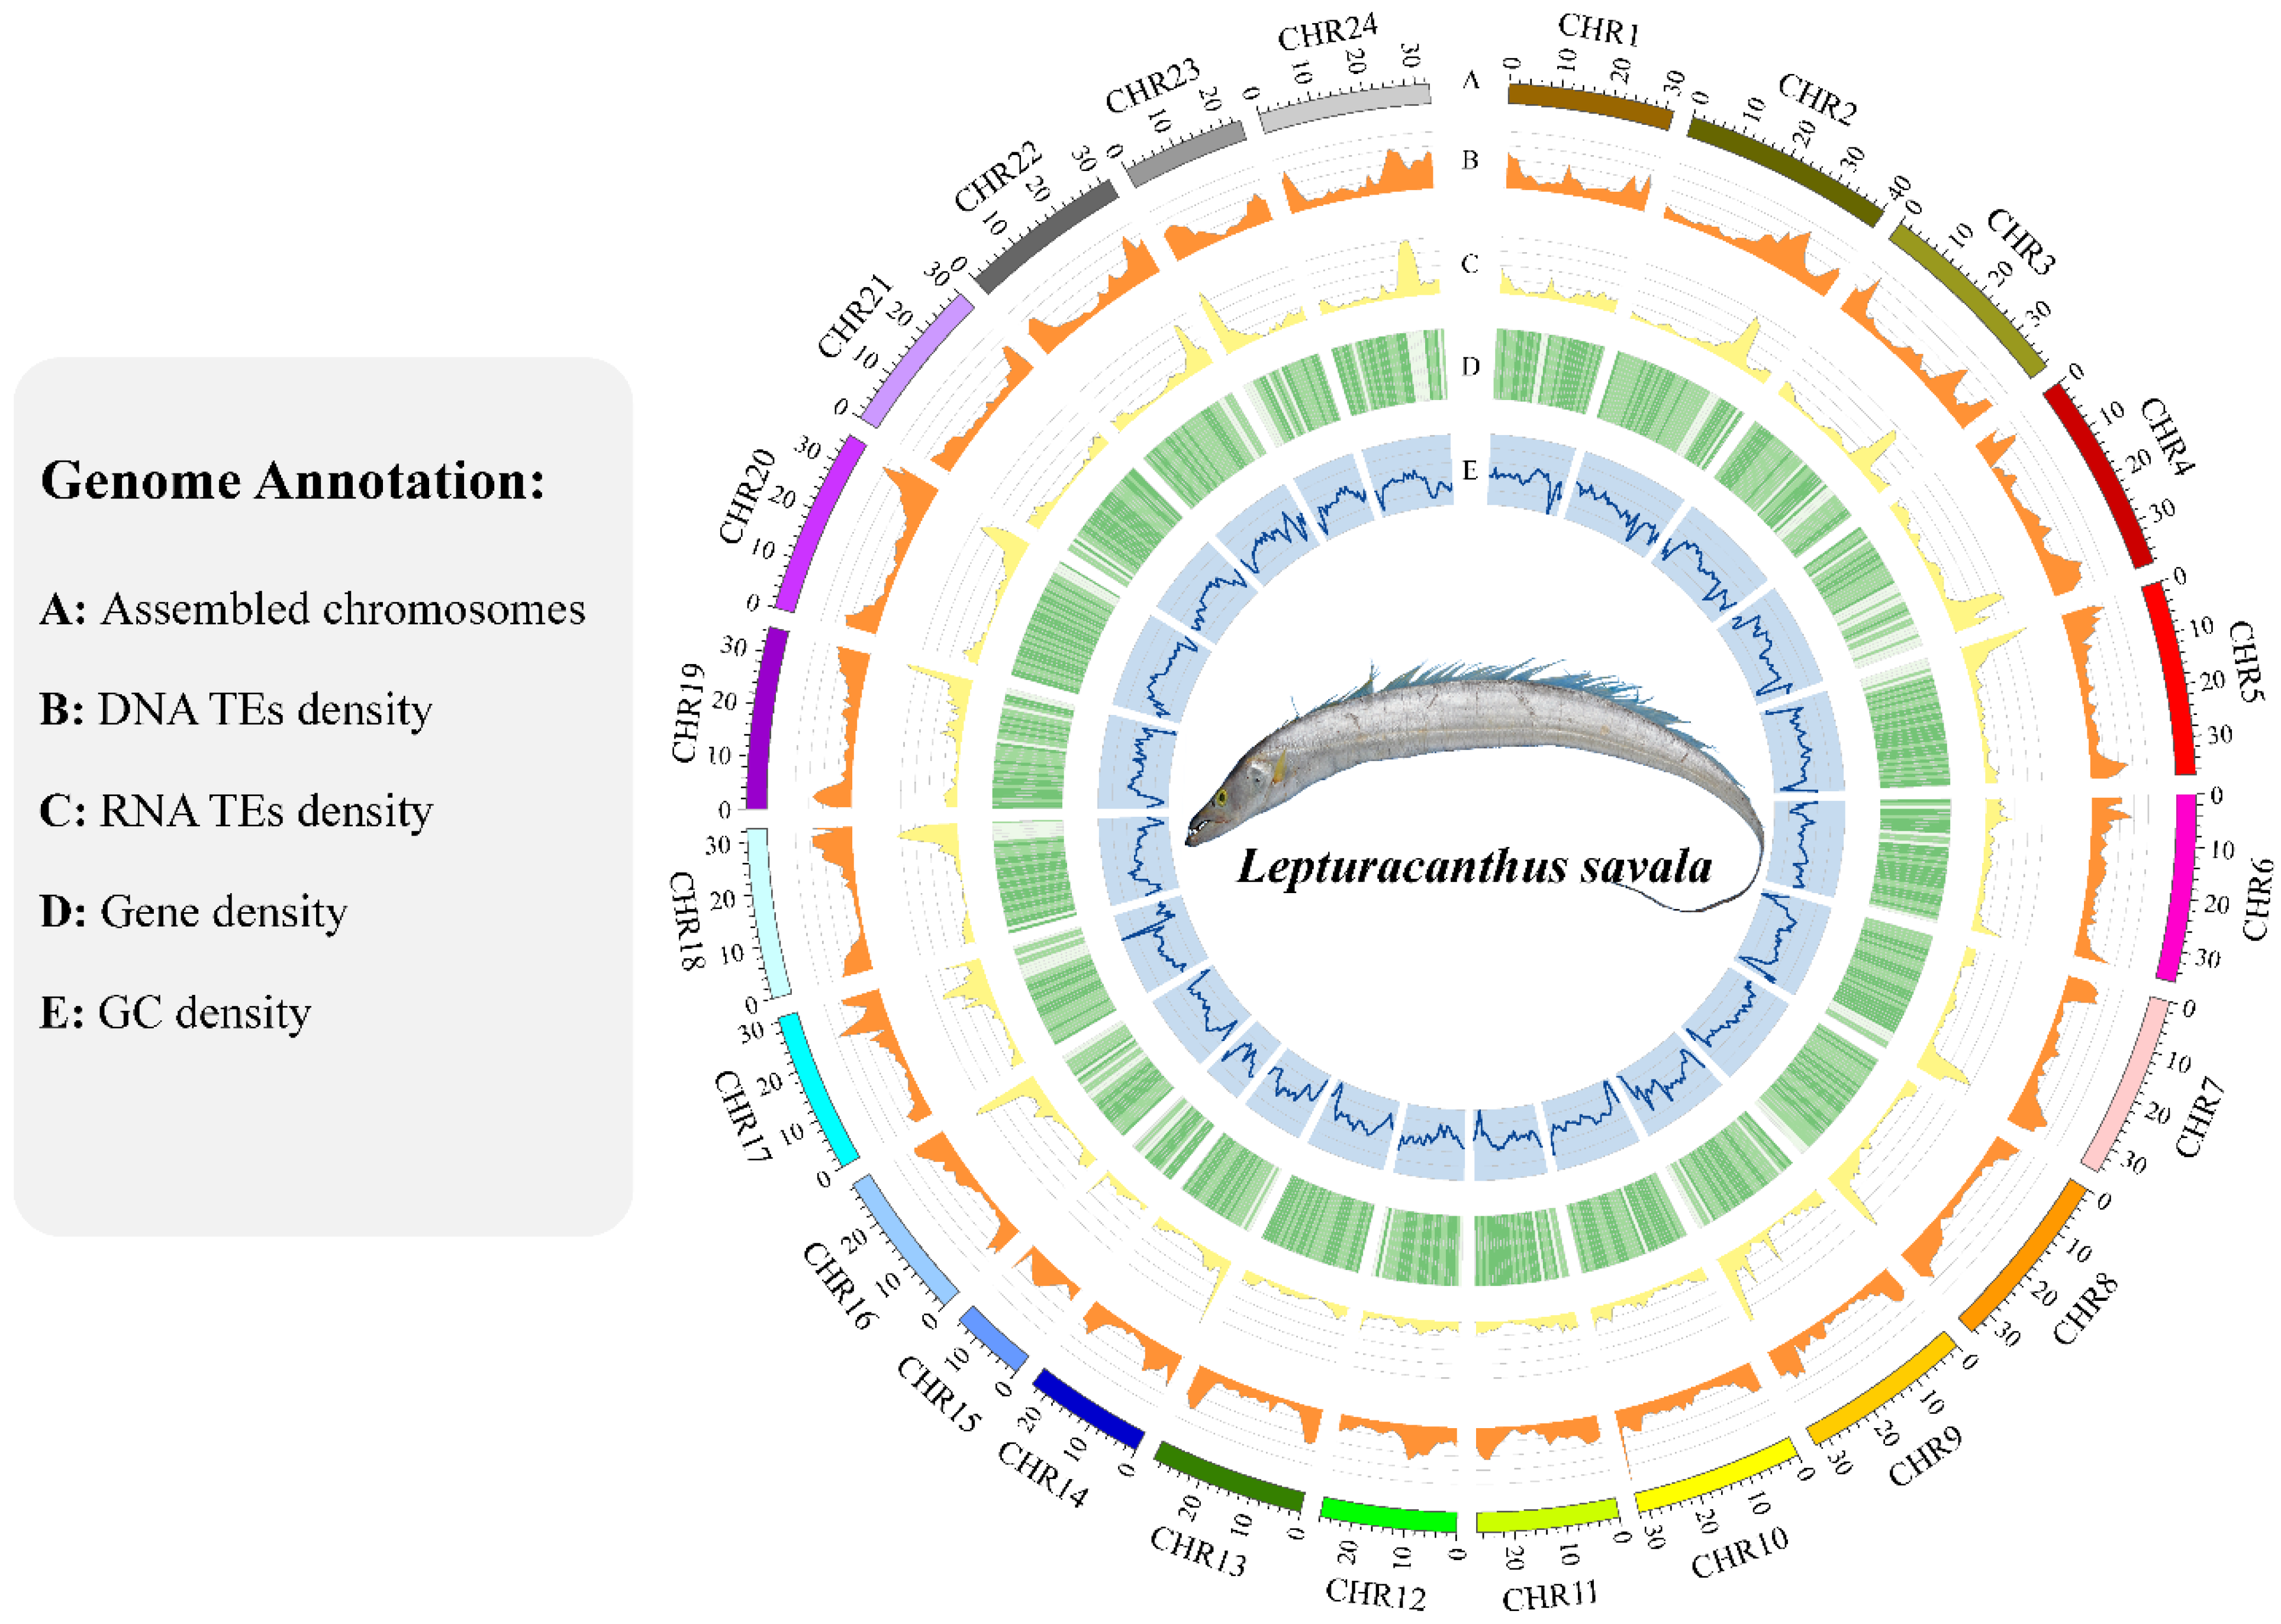
3.4. Genome Annotation

After quality control and filtering, Illumina sequencing of RNAs from muscle, liver, and heart tissues yielded 22,926,095, 18,722,468, and 20,707,056 clean reads, with Q30 values of 93.77%, 93.64%, and 93.38%, respectively, and GC contents ranging from 49.12% to 50.89% (Figure 3). The PacBio SMRT sequencing of mixed RNA from three tissues generated 529,509 polymerase reads (46.52 Gbp) with an average length of 87,857 bp and an N50 length of 159,345 bp, as well as 13,516,264 subreads (45.51 Gbp) with an average length of 3368 bp and an N50 length of 3721 bp. These transcriptomic data were used to assist in genome annotation.
A total of 31,876 genes were predicted by three methods (Table 1, Supplementary Figure S2A). The longest transcript was selected by filtering out alternative splicing variants to obtain 23,625 protein-coding genes in the L. savala genome (Table 1). Basic information for 22,670 and 20,571 genes was obtained from the NR and SwissProt databases, respectively. Biological processes and functions for 15,555 and 20,399 genes were derived from the GO and KEGG databases, respectively. Annotation information for functional domains and protein families for 18,926 and 20,429 genes were acquired from the Pfam and InterPro databases, respectively. Integrating these results, 22,679 (96.0%) genes were successfully annotated, of which 18,955 genes had complete annotation information in the above six databases (Supplementary Figure S2B).
In total, 96,078,789 bp of tandem repeats were predicted using TRF, accounting for approximately 12.16% of the genome. A total of 277,525,905 bp of interspersed repeats were identified by integrating the results of database mapping and ab initio prediction, accounting for approximately 35.13% of the genome (Supplementary Table S3). Annotation of nc-RNAs showed that the L. savala genome had 1434 miRNAs (143,870 bp; 0.0182%), 9086 tRNAs (685,943 bp; 0.0868%), and 10,263 rRNAs (2,100,089 bp; 0.27%) (Supplementary Table S4).

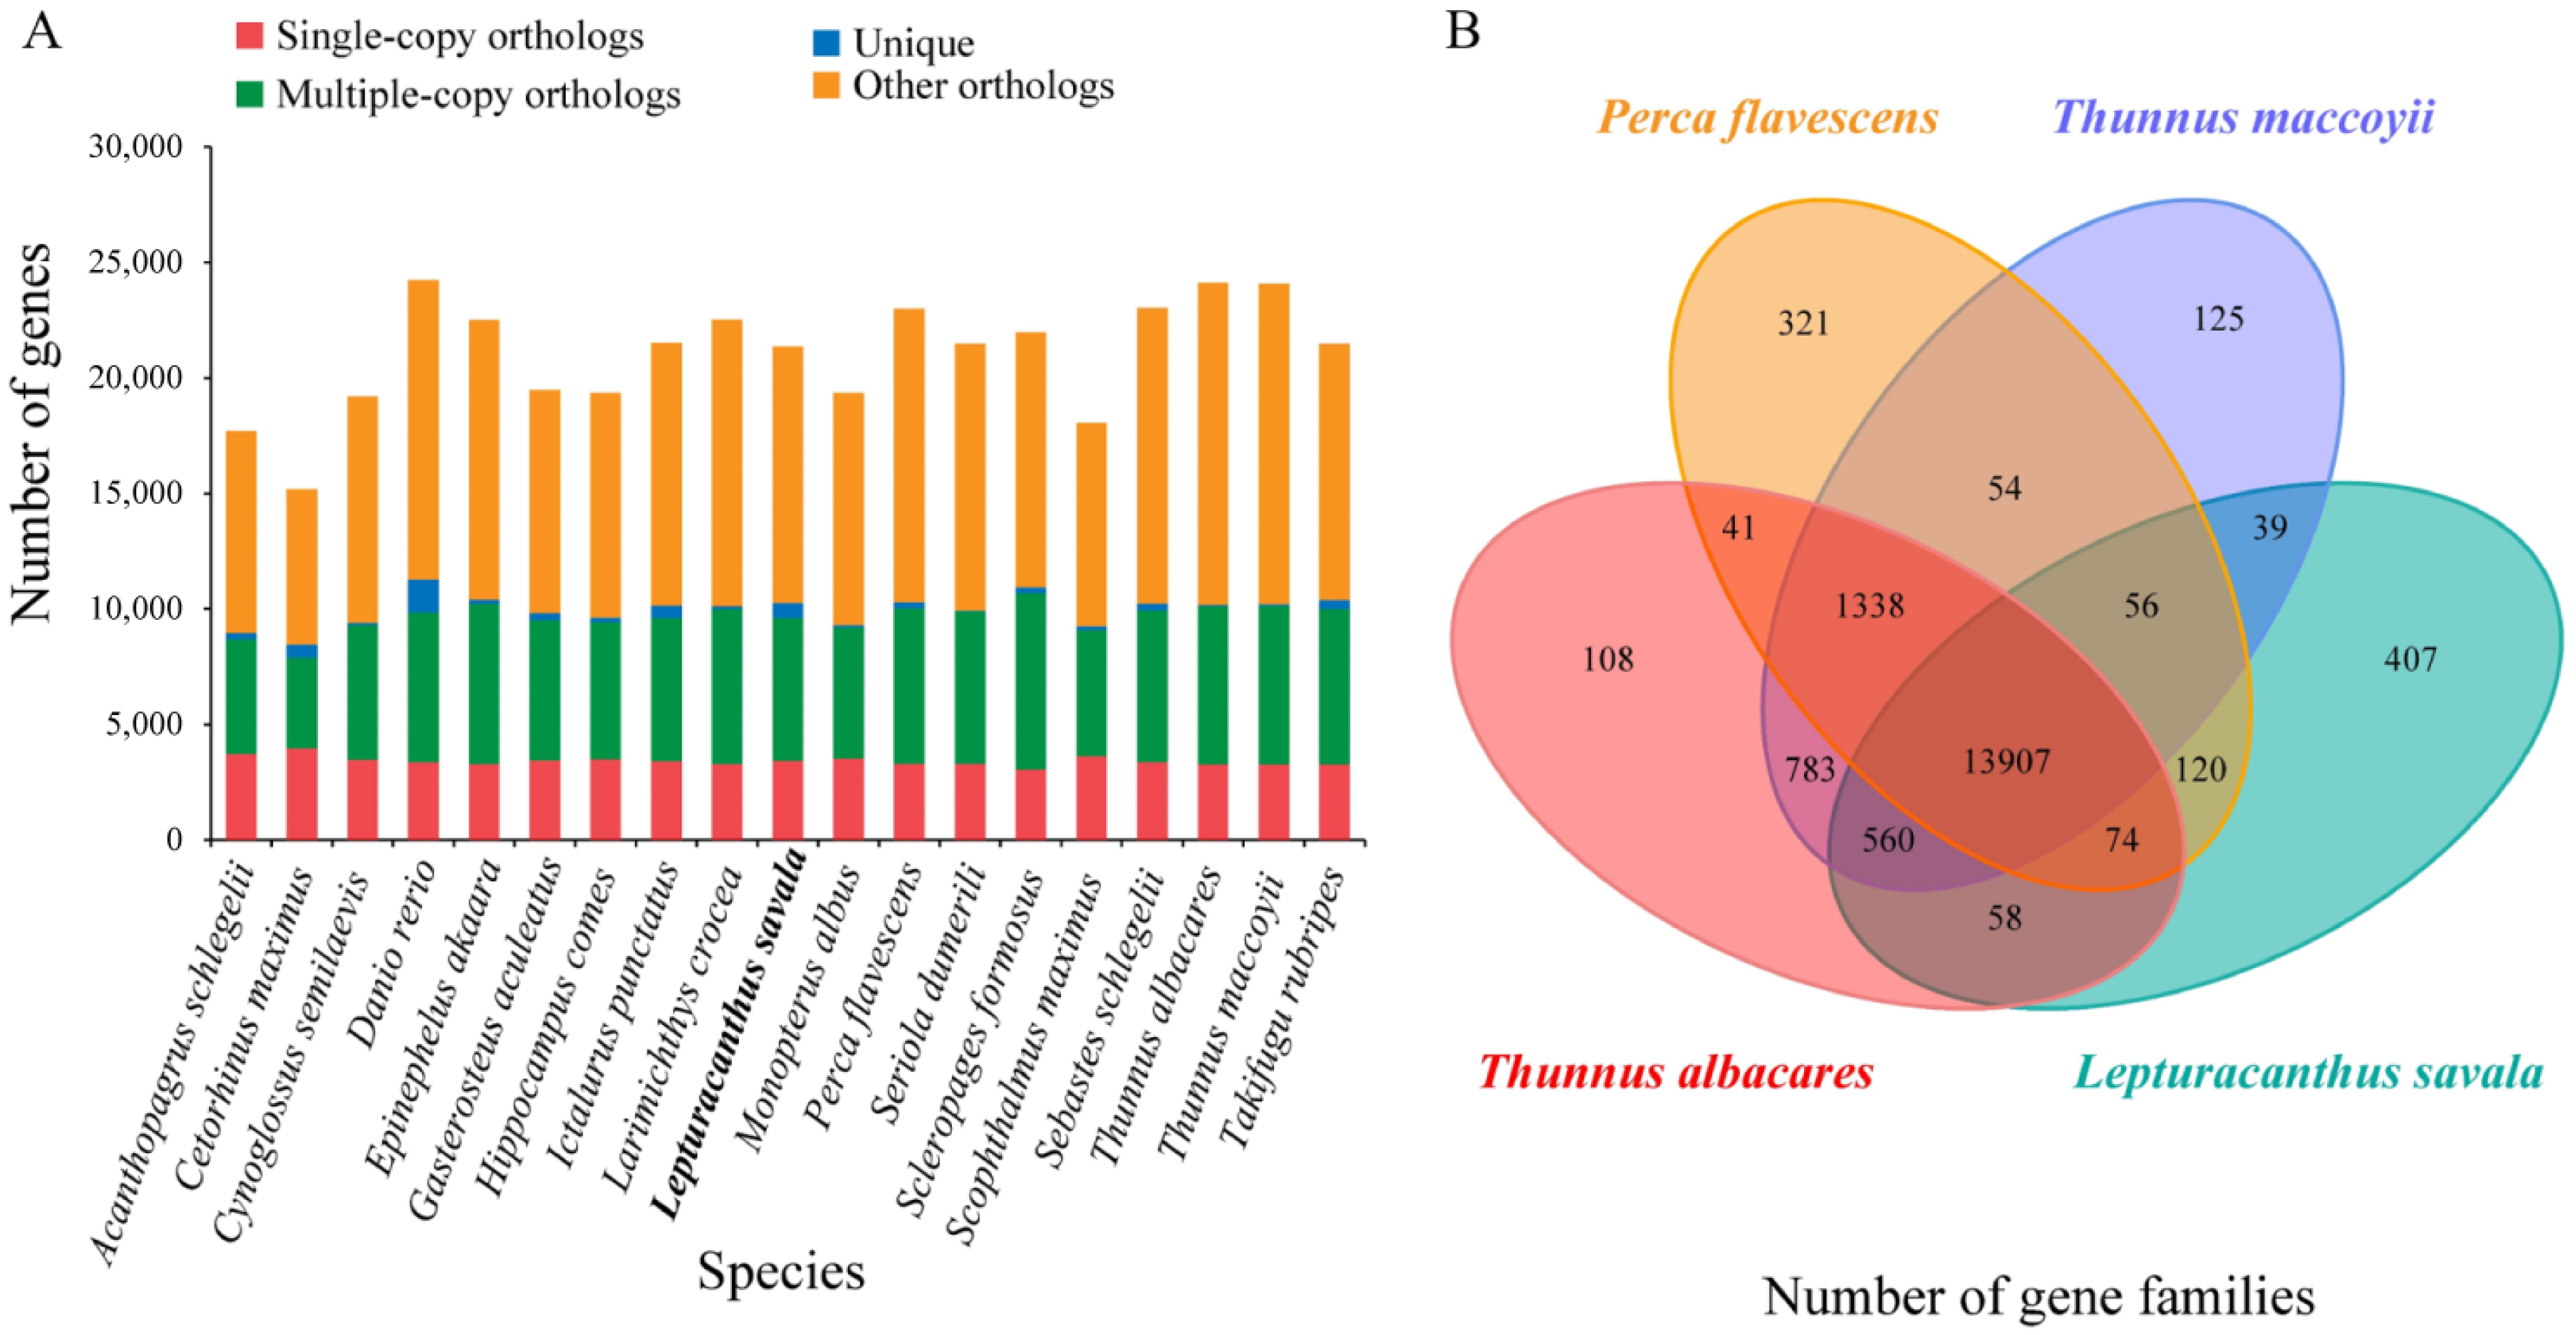
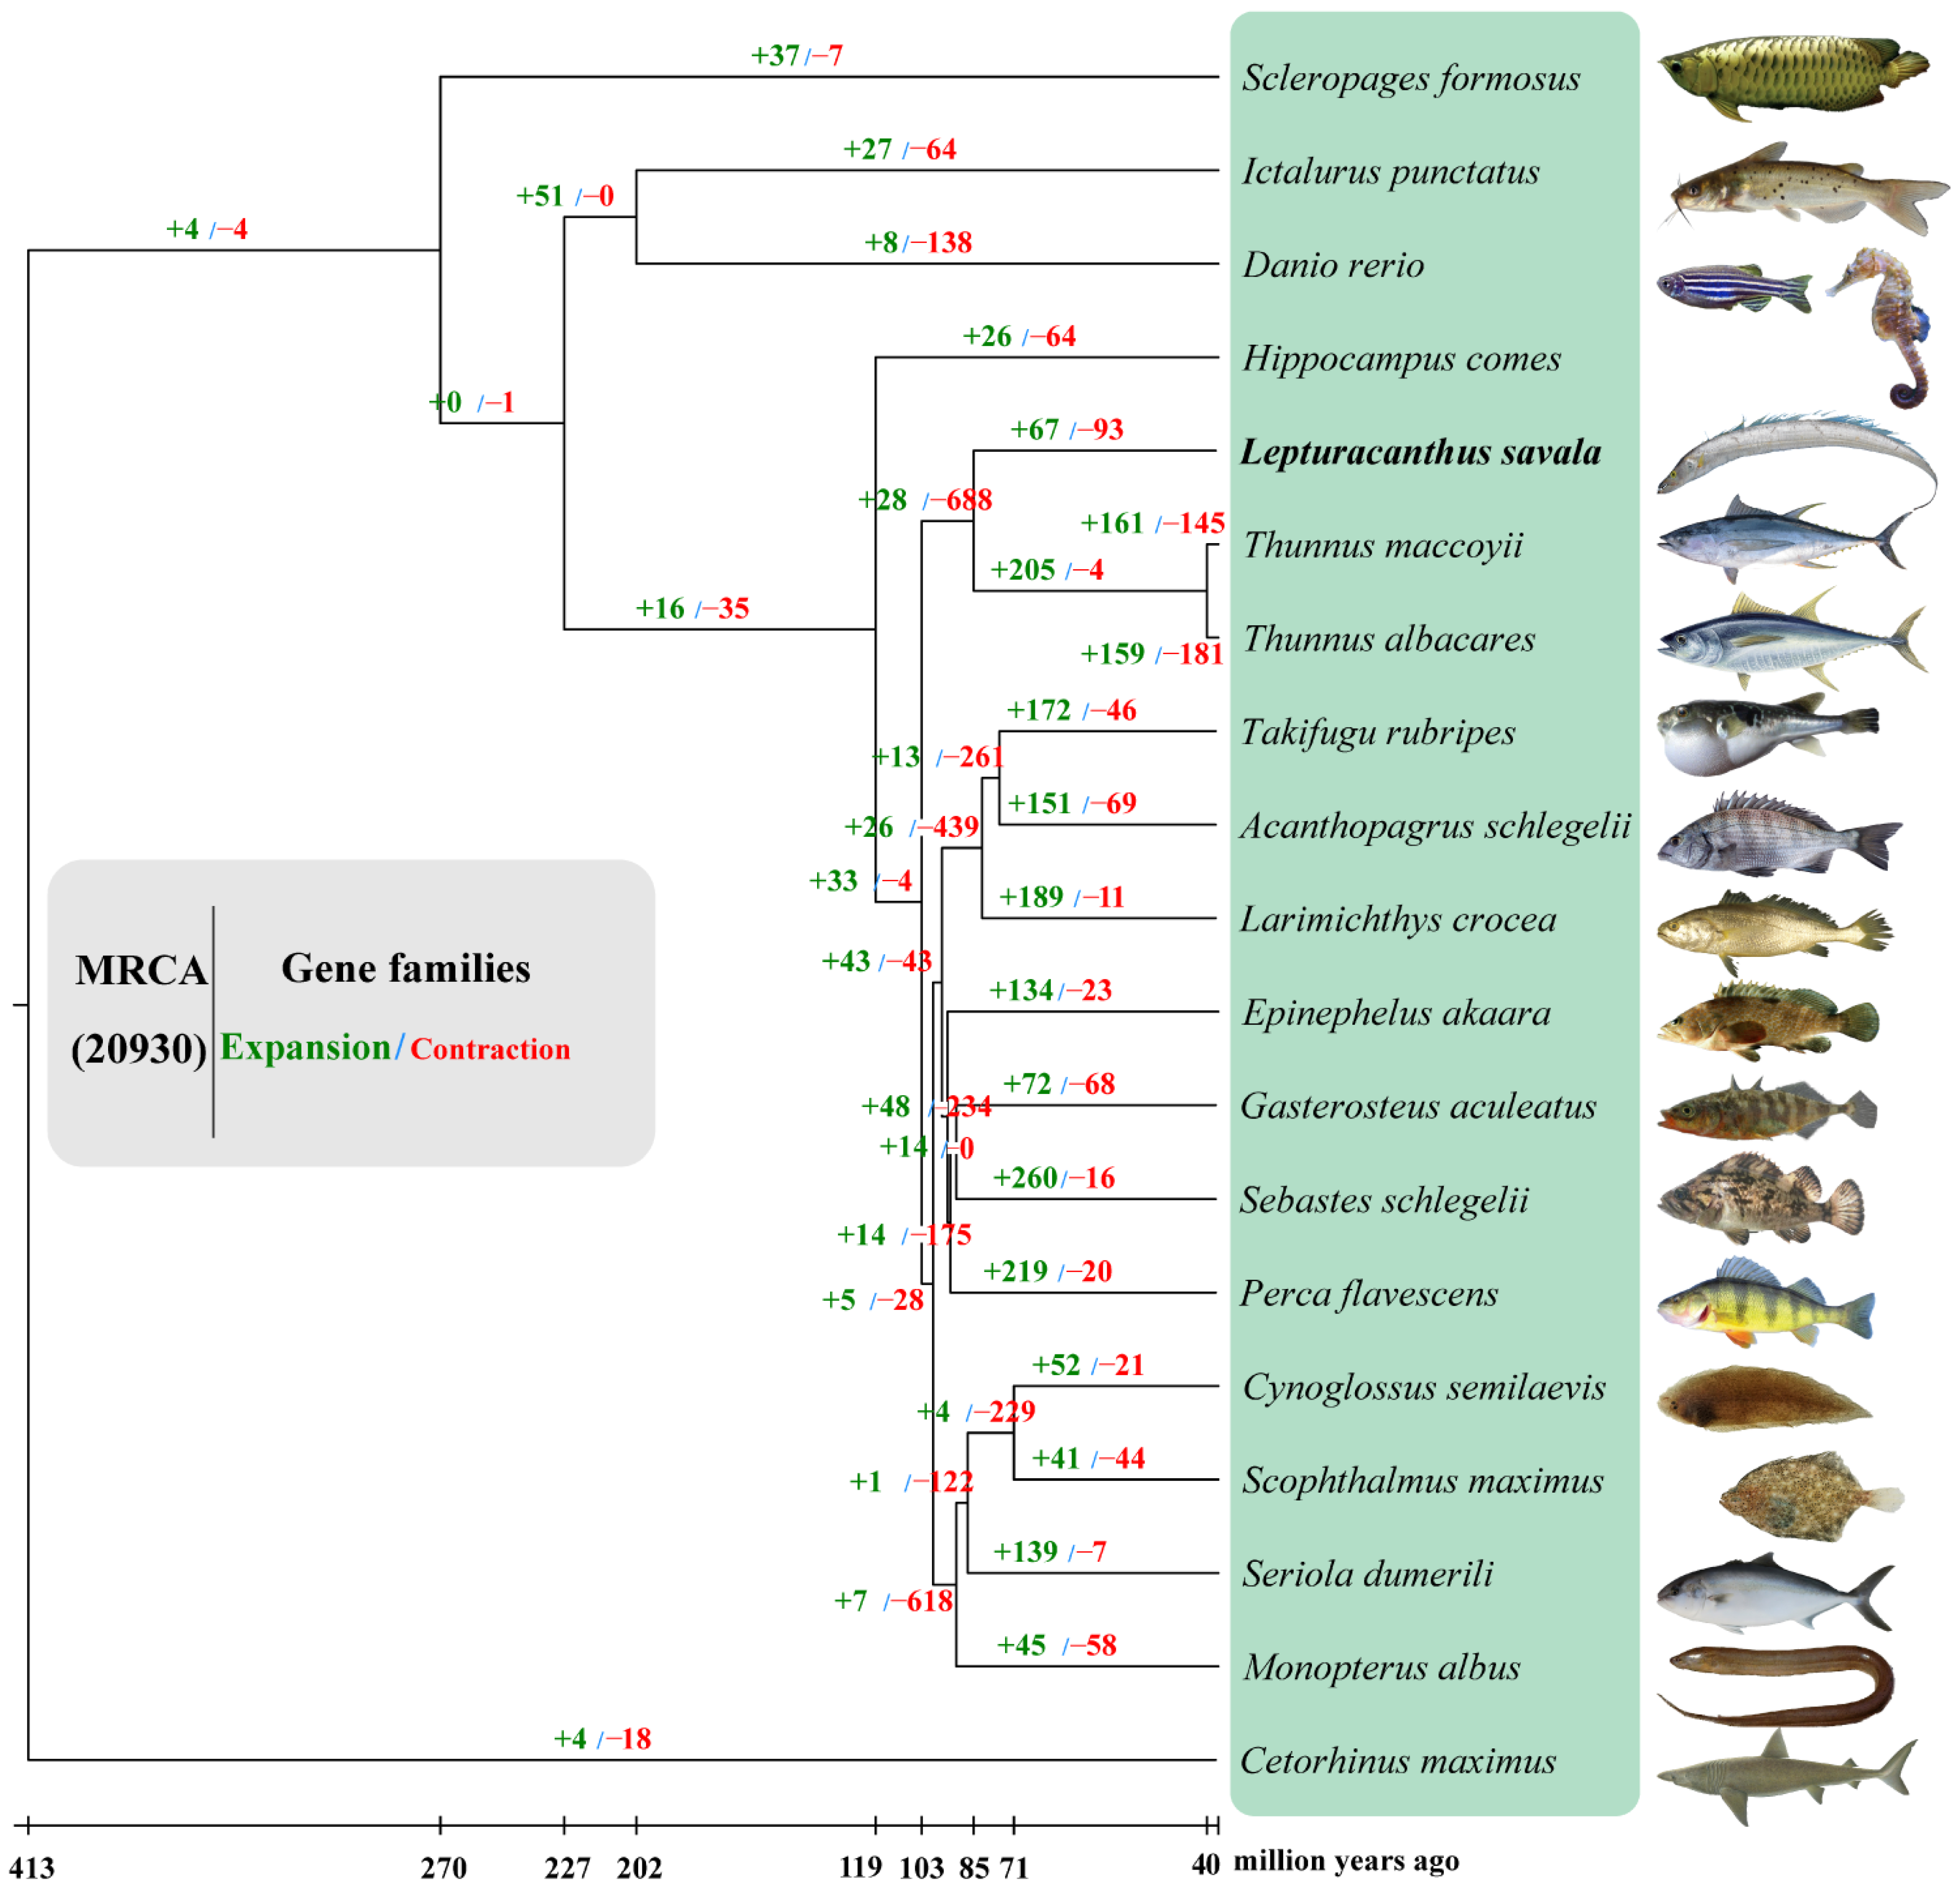
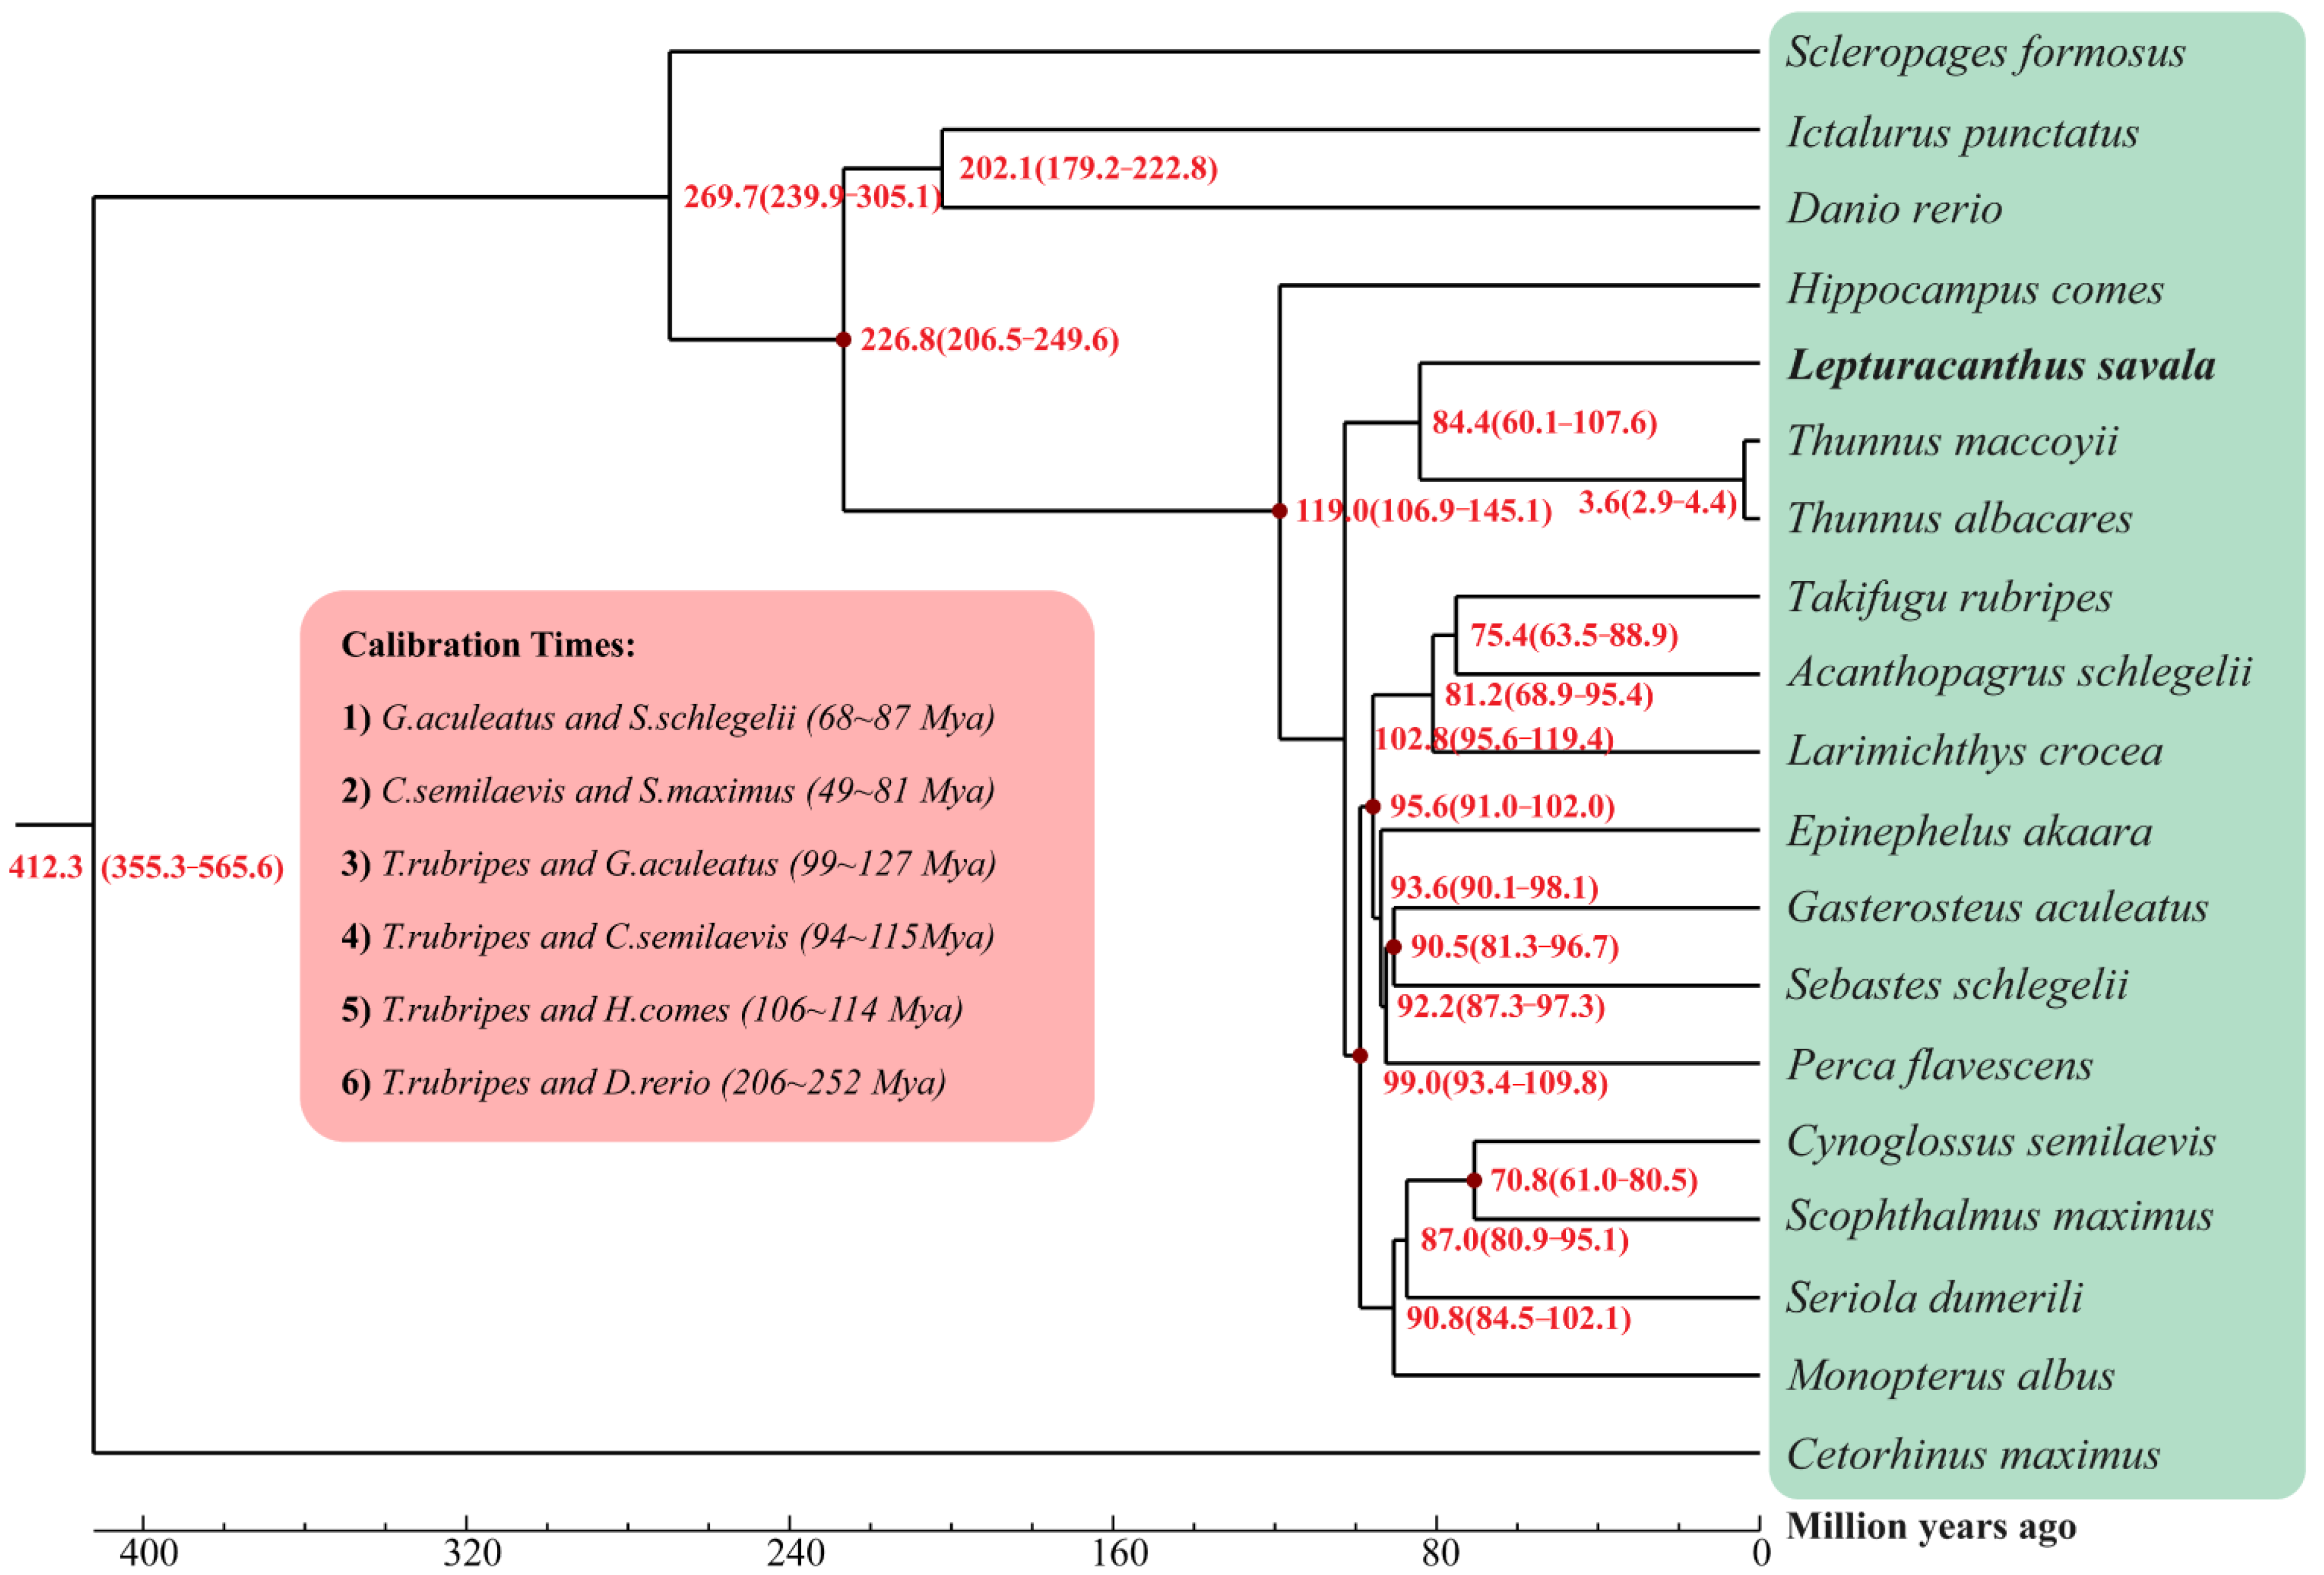
3.5. Gene Family Clustering, Expansion and Contraction, and Phylogenetic Analyses

The protein-coding genes screened from the genomes of L. savala and 18 other fishes were in the range of 18,785 (A. schlegelii) to 25,573 (D. rerio), and a cluster analysis generated 20,932 genes, of which 2,068 were single-copy gene families (Figure 4A). There were 13,907 gene families shared by L. savala and three closely species (T. albacares, T. maccoyii, and P. flavescens), and 407 gene families were unique to L. savala (Figure 4B). KEGG enrichment analysis showed that these unique gene families were mainly involved in the following pathways: protein digestion and absorption, PI3K-Akt signaling pathway, focal adhesion, ECM–receptor interaction, platelet activation, relaxation signaling pathway, lysine degradation, and amoebiasis.
Genome family expansion and contraction were further analyzed for 20,932 gene families in 19 species. Based on a comparison with the common ancestors of L. savala, T. albacares, and T. maccoyii, 67 gene families expanded and 93 gene families contracted during the evolution of L. savala (Figure 5). KEGG enrichment analysis (Table 2) revealed that the expanded gene families were involved in several important pathways, such as focal adhesion, ECM–receptor interaction, platelet activation, relaxation signaling pathway, protein digestion and absorption, PI3K-Akt signaling pathway, lysine degradation, cortisol synthesis and secretion, and PPAR signaling pathway. These pathways were highly consistent with the pathways associated with the unique gene families of L. savala. The main pathways related to the contracted gene families included synaptic vesicle cycle, GABAergic synapse, NOD-like receptor signaling pathway, protein digestion and absorption, mineral absorption, arachidonic acid metabolism, ECM–receptor interaction, and focal adhesion (Table 2).
As illustrated in the phylogenetic trees (Figure 5 and Figure 6), L. savala, T. albacares (BioProject: PRJEB47267), and T. maccoyii (BioProject: PRJEB46021) were first clustered into a monophyletic clade with 100% bootstrap support, and all nodes of other branches also showed 100% support. As shown in Figure 6, the divergence between L. savala with T. maccoyii and T. albacares occurred 84.4 (60.1–107.6) million years ago, while T. maccoyii and T. albacares diverged 3.6 (2.9–4.4) million years ago.

3.6. Positive Selection Analysis

A total of 903 genes were identified in the first positive selection analysis (Table 3). These genes were mainly enriched in the GO terms with DNA metabolic process, nuclear chromosome, and DNA repair, and in the KEGG pathways with JAK-STAT signaling pathway, novobiocin biosynthesis, Fanconi anemia pathway, cytokine–cytokine receptor interaction, homologous recombination, nonhomologous end-joining, and complement and coagulation cascades (Supplementary Figure S3). In the second positive selection analysis, 922 genes were identified (Table 3). The genes were mainly enriched in the GO terms with methyltransferase activity, amino methyltransferase activity, and nucleic acid binding, and in the KEGG pathways with cytokine–cytokine receptor interaction, JAK-STAT signaling pathway, RNA transport, autophagy-other, autophagy-yeast, Fanconi anemia pathway, and nonhomologous end-joining (Supplementary Figure S3).
We further evaluated the correlations between the functions of positively selected genes and gene families in L. savala and its biological characteristics, and finally confirmed that gene families TES, TRIO, DNAH, SLC6, and COL4, the genes MTOR, ATG3, ATG4C, ATG12, CFI, C1QA, VTN, STAT6, IL5RA, IL10, IL15RA, IL16, IL17RA, IL20RA, IL22RA2, POLM, PRKDC, BARD1, BRCA1, NBN, XRCC2, EME2, and FAAP100, and autophagy-other, complement and coagulation cascades, JAK-STAT signaling pathway, cytokine–cytokine receptor interaction, nonhomologous end-joining, homologous recombination, Fanconi anemia pathways play important roles in the evolutionary of unique traits in L. savala.

4. Discussion

4.1. Quality Evaluation of the L. savala Genome

We obtained the first high-quality genome assembly at the chromosome-level of L. savala by combining PacBio SMRT-Seq, Illumina HiSeq, and Hi-C technologies. The Q20 and Q30 scores of raw data were all greater than 90%, indicating that the sequencing data were of high quality and could be used for subsequent analyses. The genome size and GC content of L. savala were 790.02 Mbp and 39.03%, respectively, which were roughly equivalent to those of T. albacares (792.10 Mbp, 39.5%) and T. maccoyii (782.42 Mbp, 39.5%,). Based on a genome survey, Song et al. [72] reported that the genome sizes of Trichiurus japonicus, Trichiurus nanhaiensis, Trichiurus brevis, L. savala, and Eupleurogrammus muticus from the coastal waters of China were 913 Mb, 868 Mb, 871 Mb, 747 Mb, and 670 Mb, respectively, with average GC contents of 39.59% to 42.05% and repeat sequence contents of 33.21% to 45.87%. Our data were consistent with these previous estimates. As expected, the final number of chromosomes assembled was 24 for L. savala, as well as for T. albacares and T. maccoyii. A phylogenetic tree supported the relatively close relationships among these three species, consistent with morphological classification results.
Heterozygosity reflects the difficulty of whole-genome sequencing and assembly [73]. The genomic heterozygosity rate of 0.53% in our study was slightly lower than that (0.72%) reported by Song et al. [72]. This may be related to the different K-mer depths obtained by the two survey analyses (78 in our study and 45 in the previous study). According to the repeat sequence content (40.54%) and heterozygosity rate (0.53%) of L. savala, we believed that the L. savala genome was a typical diploid genome. Additionally, contig N50 and scaffold N50 values are important indexes for judging the quality of species genomes [74]. The contig N50 and scaffold N50 obtained for the assembly of the L. savala genome were 19,013,249 bp and 32,774,443 bp, respectively, which were similar to other fishes reported in recent years [75,76,77]. Such high-quality genomic data provide a reliable basis for studies of the special morphological and behavioural characteristics of L. savala at the genomic level.

4.2. Genes Associated with the Specific Morphology of L. savala

In this study, we detected a significant expansion of the TES gene family in L. savala. TES encodes a novel focal adhesion protein that contains three C-terminal LIM domains, and is involved in cell motility and adhesion [78]. This protein is widely expressed in normal tissues of animals, and may play key role in the reorganization of the actin cytoskeleton [79,80]. Dingwell and Smith [81] demonstrated that TES protein deficiency caused a sharp decrease in the number of posterior trunk and tail somites during embryonic development in the African clawed frog Xenopus laevis. This indicated that the TES gene plays a crucial role in regulating axial elongation in X. laevis in the late gastrula stage. The expansion of the TES gene family is likely to be essential for the formation of the elongated ribbon body axis in L. savala. In positive selection analysis (group 2), we screened several key genes that were significantly enriched in the autophagy pathway, such as MTOR, ATG3, ATG4C, and ATG12. MTOR encodes phosphatidylinositol kinase-related kinases, composed of two complexes (mTORC1 and mTORC2) [82,83]. mTORC1 controls protein synthesis, cell growth, and proliferation [84]. As a pivotal regulator of skeletal growth [85], mTORC1 plays an important role in the growth of long bones in mice by regulating the proliferation and differentiation of chondrocytes [86]. mTORC2 is a regulator of the actin cytoskeleton and promotes cell survival and cell cycle progression [87]. Chen et al. [88] reported that mTORC2 signaling mediated by Rictor (a core subunit of mTORC2) plays a crucial role in promoting chondrocyte hypertrophy and enhancing osteoblast activity in mice. Accordingly, we infer that the MTOR gene promotes the proliferation and differentiation of L. savala vertebrae, resulting in a significantly greater number of vertebrae than is found in most teleost fishes.
Moreover, the autophagy-related proteins encoded by the ATG gene family screened here are essential for autophagosome formation [89], and play pivotal roles in the autophagic process [90,91]. ATG3 encodes a ubiquitin-like-conjugating enzyme, which is a component of the autophagy-related ubiquitination-like systems, and is involved in autophagosome formation [92,93]. ATG4C encodes a cysteine protease that plays an essential role in autophagy by mediating both proteolytic activation and delipidation of ATG8 family proteins [94,95]. Autophagy is an important pathway in many developmental processes in higher eukaryotes [96]. It is involved in apoptosis and tissue remodeling during embryogenesis [97], and is responsible for the degradation of normal proteins during animal metamorphosis and development [96]. Autophagy is also induced by amino acid deficiencies in the animal starvation response [98,99]. Previous studies have demonstrated that the remodeling of larval organs in most lepidopterans during metamorphosis involved autophagy, which is considered essential in the process of organ degeneration in arthropods [100,101]. Franzetti et al. [102] observed that the expression levels of autophagy-related genes (ATG5, ATG6, and ATG8) in the midgut cells increase significantly during midgut remodeling of the larvae of the silkworm Bombyx mori. Autophagy is a prerequisite for the regeneration of the caudal fin in D. rerio, which promotes the survival and differentiation of blastema cells (a highly proliferative tissue) [103]. Therefore, we propose that the autophagy mechanism involving the ATG gene family plays an important role in the formation of the elongated whip-like tail of L. savala. Based on the above analyses, we suggest that the TES gene family, MTOR gene, and ATG gene family play key regulatory roles in the formation of the specific body type L. savala (i.e., the elongated ribbon body axis, substantial number of vertebrae, and whip-like tail).
We also found that the TRIO gene family expanded significantly in the L. savala genome. TRIO encodes a large protein that functions as a GDP to GTP exchange factor, with a role in cell migration and growth by facilitating the reorganization of the actin cytoskeleton [104]. Chen et al. [105] confirmed that mice were born with shorter teeth and thinner dentin layers following the inactivation of TRIO in dental papilla mesenchymal cells. Further, in vitro cell culture assays showed that TRIO silencing resulted in the loss of proliferation and migration ability, and a higher apoptosis rate of human stem cells of the apical papilla (SCAPs) [105]. These results reveal that the TRIO gene acts as a positive mediator during the root formation and odontogenic differentiation of human SCAPs via the p38 signaling pathway [106]. Therefore, we speculate that the expansion of the TRIO gene family may drive the formation of sharp teeth in L. savala.

4.3. Movement and Immunity in L. savala

In positive selection analyses, genes involved in the immune-related pathways (e.g., complement and coagulation cascades) were significantly enriched, including CFI, C1QA, and VTN. The serine proteinase encoded by CFI plays a crucial role in the regulation of complement cascade reactions and the induced-fit factor responsible for controlling the complement-mediated processes [106]. It also participates in the regulation of the immune response [107]. C1QA encodes the A-chain polypeptide of serum complement subcomponent C1q [108]. C1q is a versatile innate immune molecule that combines with the proteases C1r and C1s to yield C1 [109], thus forming the first component of the serum complement system [110]. Complement proteins act synergistically to clear pathogens and induce a series of inflammatory responses to protect against infection and maintain immune homeostasis [111,112]. The complement system involving CFI and C1QA is an essential component of the innate immune response, and the first line of defence against pathogenic infections [113,114]. Vitronectin encoded by VTN is a cell adhesion and spreading factor in the serum and tissues [115]. A potential role of VTN was discovered in regulating the innate immunity of Japanese flounder Paralichthys olivaceus [116]. The STAT6 gene and many interleukin-related genes (i.g., IL5RA, IL10, IL15RA, IL16, IL17RA, IL20RA, and IL22RA2) in the JAK-STAT signaling pathway and cytokine–cytokine receptor interaction pathway were screened in our positive selection analyses. STAT6 encodes a member of the STAT family of transcription factors, with dual functions in signal transduction and transcriptional activation [117]. STAT6 contributes to defence against viral infection by mediating immune signaling in the endoplasmic reticulum [118]. As an important cytokine, interleukins encoded by the IL gene family play crucial roles in the intercellular signal transmission, activation, and regulation of immune cells [119]. In one of these, the protein encoded by IL10 acts as an immunomodulatory cytokine, with pleiotropic effects in the immunoregulation and inflammatory response [120]. It could limit the excessive tissue disruption caused by inflammation [121].
Given that several genes under positive selection analyses were enriched in the immune-related pathways mentioned above, we can infer that L. savala has evolved a sophisticated immune system. This may be related to behavioural traits and motility in the species. L. savala is a predatory fish with better swimming ability and greater migratory behaviour than those of typical marine fishes [32,34,35]. Studies have demonstrated a strong correlation between immunity and exercise [122,123]. In juvenile Atlantic salmon Salmo salar, the inherent swimming performance and disease resistance have a positive correlation [124], and appropriate aerobic swimming exercises could promote growth and disease resistance [125]. Appropriate aerobic exercise improving antipredation and immunologic function was also revealed in the juvenile rock carp Procypris rabaudi [126]. In a study of water flow velocity focused on juvenile tinfoil barb Barbonymus schwanenfeldii, Zhu et al. [127] found that sustained aerobic swimming exercise improved the oxygen-carrying capacity and immune parameters. This indicated that swimming training could enhance the innate immune system of fishes [127]. Moreover, the domesticated and wild S. salar differ in swimming ability and immune responses, and the expression levels of immune-related genes (CD40, C3-3, IL1B, CD276, etc.) were significantly lower in the domesticated than in the wild S. salar with stronger swimming ability [125]. Therefore, we suggest that some immune-related genes undergo rapid evolution during the gain of aggressive predation and high-intensity swimming movements in L. savala, which may contribute to the sophisticated immune system.
In addition, we found that the DNAH gene family was significantly expanded in L. savala, and the enriched genes included DNAH1 to DNAH11, except for DNAH4. The DNAH gene family encodes axonemal heavy chains associated with cell movement, which is involved in sperm flagellum assembly and motility [128,129]. Mutations in these genes could cause human sperm malformations [130,131]. Hu et al. [132] determined that sperm motility in Cyprinidae fishes is associated with high levels of gene expression in the DNAH gene family. Thus, we suggest that the expansion of the DNAH gene family may enhance the sperm motility of L. savala. However, studies of sperm motility in this species are lacking. Therefore, the specific regulatory relationship between sperm motility and the DNAH gene family in L. savala should be investigated further.

4.4. Contribution of DNA Repair Mechanisms to the Maintenance of Genomic Stability in L. savala

In our positive selection analyses, several genes associated with DNA repair were screened in the L. savala genome, including POLM, PRKDC, BARD1, BRCA1, NBN, XRCC2, EME2, and FAAP100. These genes were mainly enriched in three pathways, i.e., nonhomologous end-joining, homologous recombination, and Fanconi anemia. DNA polymerase Mu encoded by POLM participates in DNA double-strand break repair via the nonhomologous end-joining pathway [133,134]. There were five genes (PRKDC, BARD1, BRCA1, NBN, and XRCC2) involved in the homologous recombination pathway. During the gastrulation and early organogenesis of mice, the protein encoded by PRKDC promoted the repair of DNA double-strand breaks by combining with ATM (ataxia-telangiectasia mutated) to maintain its genomic stability [135]. The proteins encoded by BARD1 and BRCA1 combine to form a heterodimeric complex [136], which acts as a functional unit in mammalian cells in homologous recombination and DNA repair [137,138]. This heterodimer plays a role in DNA damage repair and transcriptional regulation to maintain genomic stability [139,140]. As a component of the MRN complex (MRE11-RAD50-NBN), the protein encoded by NBN is involved in DNA double-strand break repair and initiation of the DNA damage response to maintain genomic stability [141,142]. XRCC2 encodes a member of the RecA/Rad51-related protein family, which participates in homologous recombination to maintain chromosome stability during cell division [143]. Based on cell cloning experiments of Chinese hamster Cricetulus barabensis, the chromosomal instability in cells with an XRCC2 deficiency may be caused by defective homologous recombination [144]. Another two genes (EME2 and FAAP100) were significantly enriched in the Fanconi anemia pathway. The protein encoded by EME2 forms a heterodimer with MUS81 and functions as an XPF-type flap/fork endonuclease in DNA repair [145]. The protein encoded by FAAP100 regulates FANCD2 monoubiquitination and the stability of the Fanconi anemia core complex, playing a role in the Fanconi anemia-associated DNA damage response [146]. In summary, the above-mentioned genes and pathways may play essential roles in the recombination of homologous chromosomes and maintenance of genomic stability in L. savala.
Additionally, we found that the SLC6 gene family (SLC6A1, SLC6A11, SLC6A13, and SLC6A19) and the COL4 gene family (COL4A1, COL4A2, and COL4A6) were significantly contracted in the L. savala genome. SLC6 is involved in the transport of neurotransmitters (e.g., dopamine, norepinephrine, serotonin, GABA, and glycine) [147,148]. This suggests that the contraction of the SLC6 gene family may be related to nervous system evolution in L. savala. Type IV collagen encoded by the COL4 gene family is the major component of the basement membrane in many tissues [149]. It plays a pivotal role in the remodeling of endometrial tissue in mammals by regulating the structure, viability, and differentiation of endometrial cells [150,151]. On this basis, we speculate that the COL4 gene family is related to the formation of the smooth body surface in L. savala. Owing to the lack of detailed information on the nervous system and body surface development in L. savala, it is difficult to clearly establish the effects of the contractions of these two gene families on these traits, and further studies are needed.

5. Conclusions

In this study, we obtained a high-quality chromosomal-level genome assembly of L. savala, providing the first genomic dataset for trichiurid fishes. Based on comparative genomic analyses, we found that MTOR gene, and the TES, ATG, and TRIO gene families may be key factors driving the formation of the unique body shape and sharp teeth in L. savala. Moreover, several immune-related genes (CFI, C1QA, VTN, STAT6 genes, and the IL gene family) underwent rapid evolution, likely contributing to the sophisticated immune system in L. savala. These changes may also be related to the evolution of aggressive predation and intense swimming movements in this species. In addition, DNA repair mechanisms may play crucial roles in maintaining the evolutionary stability of the L. savala genome. Our study preliminarily reveals the molecular mechanisms underlying the special morphological and behavioural characteristics of L. savala at the genomic level, and provides an invaluable reference for genomic and evolutionary studies of other trichiurid fishes.

Supplementary Materials

The following supporting information can be downloaded at: https://www.mdpi.com/article/10.3390/genes14061268/s1, Figure S1: BUSCO genome integrity assessment (A) and GC content distribution (B); Figure S2: Genes identified by genome-wide de novo prediction, homologous prediction, and RNA sequencing data-based genes prediction (A). Functional annotation of genes based on NR, SwissProt, KEGG, and InterPro databases (B); Figure S3: GO terms and KEGG pathways for genes screened in two groups of positive selection analyses; Table S1: Summary statistics for contigs and scaffolds at the sequence and chromosome levels; Table S2: Types and counts of various Di-Tags identified during filtering; Table S3: Overview of genome-wide repeat sequences; Table S4. Annotation and detailed summary statistics of noncoding RNA.

Author Contributions

Conceptualization, R.-X.W., B.-B.M. and F.-Y.H.; methodology, B.-B.M., R.-X.W. and F.-Y.H.; software, B.-B.M., F.-Y.H. and S.-F.N.; validation, R.-X.W., B.-B.M. and F.-Y.H.; formal analysis, B.-B.M., F.-Y.H. and R.-X.W.; investigation, Z.-B.L., Q.-H.W. and Y.-S.L.; resources, Z.-B.L., Q.-H.W. and R.-X.W.; data curation, R.-X.W., B.-B.M. and F.-Y.H.; writing—original draft preparation, R.-X.W., B.-B.M. and F.-Y.H.; writing—review and editing, R.-X.W., B.-B.M. and F.-Y.H.; visualization, B.-B.M., F.-Y.H. and S.-F.N.; supervision, R.-X.W. and S.-F.N.; project administration, R.-X.W.; funding acquisition, R.-X.W. All authors have read and agreed to the published version of the manuscript.

Funding

This research was funded by the National Natural Science Foundation of China (grant no. 31372532).

Institutional Review Board Statement

The experimental animal protocols in the present study were reviewed and approved by the Animal Experimental Ethics Committee of Guangdong Ocean University, China (approval number: 1201-2020). Experiment procedures were performed in accordance with the Provisions and Regulations for the National Experimental Animal Management Regulations (China, July 2013) and the Experimental Animal Policies and Regulations of Guangdong Province (China, October 2010).

Informed Consent Statement

Not applicable.

Data Availability Statement

The genome assembly data of Lepturacanthus savala was deposited at NCBI under BioProject number PRJNA953192 (Submitted), BioSample number SAMN34109439 (Submitted). The raw read sequence accession numbers: SRR24890858, SRR24890859, SRR24890860, SRR24890861, SRR24890862, SRR24890863, SRR24890864.

Conflicts of Interest

The authors declare no conflict of interest.

References

  1. Nelson, J.S.; Grande, T.C.; Wilson, M.V.H. Fishes of the World, 5th ed.; John Wiley & Sons: New York, NY, USA, 2016; pp. 1–12. [Google Scholar]
  2. Shao, K.T. The Fish Database of Taiwan. Available online: http://fishdb.sinica.edu.tw (accessed on 28 March 2023).
  3. Ravi, V.; Venkatesh, B. Rapidly evolving fish genomes and teleost diversity. Curr. Opin. Genet. Dev. 2008, 18, 544–550. [Google Scholar] [CrossRef] [PubMed]
  4. Choi, B.S.; Park, J.C.; Kim, M.S.; Han, J.; Kim, D.H.; Hagiwara, A.; Sakakura, Y.; Hwang, U.K.; Lee, B.Y.; Lee, J.S. The reference genome of the selfing fish Kryptolebias hermaphroditus: Identification of phases I and II detoxification genes. Comp. Biochem. Physiol. Part D Genom. Proteom. 2020, 35, 100684. [Google Scholar] [CrossRef]
  5. Leder, E.H.; Andre, C.; Le Moan, A.L.; Topel, M.; Blomberg, A.; Havenhand, J.N.; Lindstrom, K.; Volckaert, F.A.M.; Kvarnemo, C.; Johannesson, K.; et al. Post-glacial establishment of locally adapted fish populations over a steep salinity gradient. J. Evol. Biol. 2021, 34, 138–156. [Google Scholar] [CrossRef] [PubMed]
  6. Howe, K.; Clark, M.D.; Torroja, C.F.; Torrance, J.; Berthelot, C.; Muffato, M.; Collins, J.E.; Humphray, S.; McLaren, K.; Matthews, L.; et al. The zebrafish reference genome sequence and its relationship to the human genome. Nature 2013, 496, 498–503. [Google Scholar] [CrossRef] [Green Version]
  7. Aparicio, S.; Chapman, J.; Stupka, E.; Putnam, N.; Chia, J.M.; Dehal, P.; Christoffels, A.; Rash, S.; Hoon, S.; Smit, A.; et al. Whole-genome shotgun assembly and analysis of the genome of Fugu rubripes. Science 2002, 297, 1301–1310. [Google Scholar] [CrossRef] [PubMed] [Green Version]
  8. Lu, J.; Gao, D.; Sims, Y.; Fang, W.; Collins, J.; Torrance, J.; Lin, G.; Xie, J.; Liu, J.; Howe, K. Chromosome-level Genome Assembly of Acanthopagrus latus Provides Insights into Salinity Stress Adaptation of Sparidae. Mar. Biotechnol. 2022, 24, 655–660. [Google Scholar] [CrossRef] [PubMed]
  9. Zhou, Q.; Gao, H.; Zhang, Y.; Fan, G.; Xu, H.; Zhai, J.; Xu, W.; Chen, Z.; Zhang, H.; Liu, S.; et al. A chromosome-level genome assembly of the giant grouper (Epinephelus lanceolatus) provides insights into its innate immunity and rapid growth. Mol. Ecol. Resour. 2019, 19, 1322–1332. [Google Scholar] [CrossRef]
  10. Chen, H.Y.; Chen, Y.Y.; Li, R.; Xiao, H.; Chen, S.Y. Research advances in whole-genome sequencing of representative fish species. J. Biol. 2017, 34, 73–77. [Google Scholar]
  11. Ahmad, S.F.; Jehangir, M.; Srikulnath, K.; Martins, C. Fish genomics and its impact on fundamental and applied research of vertebrate biology. Rev. Fish Biol. Fish. 2022, 32, 357–385. [Google Scholar] [CrossRef]
  12. Cossins, A.R.; Crawford, D.L. Fish as models for environmental genomics. Nat. Rev. Genet. 2005, 6, 324–333. [Google Scholar] [CrossRef]
  13. Ahti, P.A.; Kuparinen, A.; Uusi-Heikkilä, S. Size does matter—the eco-evolutionary effects of changing body size in fish. Environ. Rev. 2020, 28, 311–324. [Google Scholar] [CrossRef]
  14. Giammona, F.F. Form and Function of the Caudal Fin Throughout the Phylogeny of Fishes. Integr. Comp. Biol. 2021, 61, 550–572. [Google Scholar] [CrossRef]
  15. Bradic, M.; Beerli, P.; García-de León, F.J.; Esquivel-Bobadilla, S.; Borowsky, R.L. Gene flow and population structure in the Mexican blind cavefish complex (Astyanax mexicanus). BMC Evol. Biol. 2012, 12, 9. [Google Scholar] [CrossRef] [Green Version]
  16. Protas, M.; Conrad, M.; Gross, J.B.; Tabin, C.; Borowsky, R. Regressive Evolution in the Mexican Cave Tetra, Astyanax mexicanus. Curr. Biol. 2007, 17, 452–454. [Google Scholar] [CrossRef] [PubMed] [Green Version]
  17. McGaugh, S.E.; Gross, J.B.; Aken, B.; Blin, M.; Borowsky, R.; Chalopin, D.; Hinaux, H.; Jeffery, W.R.; Keene, A.; Ma, L.; et al. The cavefish genome reveals candidate genes for eye loss. Nat. Commun. 2014, 5, 5307. [Google Scholar] [CrossRef] [PubMed] [Green Version]
  18. Venkatesh, B.; Lee, A.P.; Ravi, V.; Maurya, A.K.; Lian, M.M.; Swann, J.B.; Ohta, Y.; Flajnik, M.F.; Sutoh, Y.; Kasahara, M.; et al. Elephant shark genome provides unique insights into gnathostome evolution. Nature 2014, 505, 174–179. [Google Scholar] [CrossRef] [PubMed] [Green Version]
  19. Lin, Q.; Fan, S.; Zhang, Y.; Xu, M.; Zhang, H.; Yang, Y.; Lee, A.P.; Woltering, J.M.; Ravi, V.; Gunter, H.M.; et al. The seahorse genome and the evolution of its specialized morphology. Nature 2016, 540, 395–399. [Google Scholar] [CrossRef] [Green Version]
  20. Pan, H.; Yu, H.; Ravi, V.; Li, C.; Lee, A.P.; Lian, M.M.; Tay, B.H.; Brenner, S.; Wang, J.; Yang, H.; et al. The genome of the largest bony fish, ocean sunfish (Mola mola), provides insights into its fast growth rate. Gigascience 2016, 5, 36. [Google Scholar] [CrossRef] [Green Version]
  21. Fan, G.; Chan, J.; Ma, K.; Yang, B.; Zhang, H.; Yang, X.; Shi, C.; Law, H.C.H.; Ren, Z.; Xu, Q.; et al. Chromosome-level reference genome of the Siamese fighting fish Betta splendens, a model species for the study of aggression. Gigascience 2018, 7, 1–7. [Google Scholar] [CrossRef] [Green Version]
  22. Zhao, X.; Huang, Y.; Bian, C.; You, X.; Zhang, X.; Chen, J.; Wang, M.; Hu, C.; Xu, Y.; Xu, J.; et al. Whole genome sequencing of the fast-swimming Southern bluefin tuna (Thunnus maccoyii). Front. Genet. 2022, 13, 1020017. [Google Scholar] [CrossRef]
  23. Froese, R.; Pauly, D.; FishBase. World Wide Web Electronic Publication. Version (02/2023). Available online: http://www.fishbase.org (accessed on 28 March 2023).
  24. James, P. MBAI Memoir No. 1: The Ribbon-Fishes of the Family Trichiuridae of India; Western Printers & Printers, Bombay-13: Madras State, India, 1967; pp. 15–28. [Google Scholar]
  25. Nakamura, I.; Parin, N.V. An annotated and illustrated catalogue of the Snake Mackerels, Snoeks, Escolars, Gemfishes, Sackfishes, Domine, Oilfish, Cutlassfishes, Scabbardfishes, Hairtails and Frostfishes known to date. FAO Fish. Synopis 1993, 125, 100–101. [Google Scholar]
  26. Liu, J.; Wu, R.X.; Kang, B.; Ma, L. Fishes of Beibu Gulf; Science Press: Beijing, China, 2016; p. 340. [Google Scholar]
  27. Chakravarty, M.S.; Pavani, B.; Ganesh, P.R.C. Gonado-somatic index and fecundity studies in two species of ribbon fishes, Trichiurus lepturus (Linnaeus, 1758) and Lepturacanthus savala (Cuvier, 1829) off Visakhapatnam, east coast of India. Indian J. Fish. 2013, 60, 163–165. [Google Scholar]
  28. Memon, K.H.; Liu, Q.; Kalhoro, M.A.; Chang, M.S.; Baochao, L.; Memon, A.M.; Hyder, S.; Tabassum, S. Growth and mortality parameters of hairtail Lepturacanthus savala from Pakistan waters. Pak. J. Zool. 2016, 48, 829–837. [Google Scholar]
  29. Fischer, W.; Bianchi, G. FAO Species Identification Sheets for Fishery Purposes: Western Indian Ocean (Fishing Area 51); Food and Agriculture Organization of the United Nations: Rome, Italy, 1984; Volume IV, Trichiuridae Lept 2. [Google Scholar]
  30. Yi, M.R. Based on Skeletal Comparison and COI Sequence Analysis for 6 Species of Cutlassfishes Trichiuridae Systematic Classification in Chinese Costal Water. Master’s Thesis, Guangdong Ocean University, Zhanjiang, China, 2019. [Google Scholar]
  31. Wang, Y.M.; Tang, W.Q. A Comparative Study of the Number of Vertebrae in Chinese Teleost Fishes. In Proceedings of the 2012 Symposium of Ichthyology Branch of Chinese Marine Lake and Marsh Society and Ichthyology Branch of Chinese Zoological Society, Lanzhou City, China, 1 September 2012; Chinese Zoological Society Press: Beijing, China, 2012; p. 35. [Google Scholar]
  32. Pakhmode, P.K.; Mohite, S.A.; Mohite, A.S. Morphological characters and morphometric relationship of ribbonfish, Lepturacanthus savala (Cuvier, 1929) off Ratnagiri coast, Maharashtra. Species 2013, 5, 18–22. [Google Scholar]
  33. Zhang, B. Preliminary Studies on Marine Food Web and Trophodynamics in China Coastal Seas. PhD Thesis, Ocean University of China, Qingdao, China, 2005. [Google Scholar]
  34. Kudale, S.; Rathod, J. Sex Ratio of Ribbonfish, Lepturacanthus Savala (Cuvier, 1829) From Karwar Waters, Karnataka. IOSR J. Environ. Sci. Toxicol. Food Technol. 2014, 8, 07–10. [Google Scholar] [CrossRef]
  35. Pakhmode, P.K.; Mohite, S.A. Study of gonad development using ova diameter analysis in ribbonfish, Lepturacanthus savala (Cuvier, 1829). IQSR J. Agri. Vet. Sci. 2016, 9, 01–05. [Google Scholar]
  36. Ahmed, Q.; Benzer, S.; Ali, Q.M. Heavy Metal Concentration in Largehead Hairtail (Trichiurus lepturus Linneaus, 1758) and Savalai Hairtail (Lepturacanthus savala (Cuvier, 1829)) Obtained from Karachi Fish Harbour, Pakistan. Bull. Environ. Contam. Toxicol. 2018, 101, 467–472. [Google Scholar] [CrossRef]
  37. Pakhmode, P.K.; Mohite, S.A. Feeding biology of ribbonfish, Lepturacanthus savala (Cuvier, 1929) off Ratnagiri coast, Maharashtra. Int. J. Fish. Aquat. Stud. 2014, 1, 123–129. [Google Scholar]
  38. Cai, C.; Song, N.; Zhao, L.; Gao, T. The complete mitogenome of the Lepturacanthus savala (Perciformes: Trichiuridae) from the Yellow Sea. Mitochondrial DNA B Resour. 2020, 5, 2815–2816. [Google Scholar] [CrossRef]
  39. Zhang, H.R.; Liang, Z.B.; Wu, R.X.; Niu, S.F.; Liang, Y.; Wang, Q.; Wei, H.; Xiao, Y.; Sun, B. Microsatellite Loci Isolation in the Savalai hairtail (Lepturacanthus savala) Based on SLAF-seq Technology and Generality in the Related Species. Genom. Appl. Biol. 2018, 37, 3331–3338. [Google Scholar]
  40. Sambrook, J.; Russell, D.W. The Inoue Method for Preparation and Transformation of Competent E. Coli: “Ultra-Competent” Cells. Cold Spring Harb. Protoc. 2006, 1, pdb.prot3944. [Google Scholar] [CrossRef] [PubMed] [Green Version]
  41. Bolger, A.M.; Lohse, M.; Usadel, B. Trimmomatic: A flexible trimmer for Illumina sequence data. Bioinformatics 2014, 30, 2114–2120. [Google Scholar] [CrossRef] [PubMed] [Green Version]
  42. Marcais, G.; Kingsford, C. A fast, lock-free approach for efficient parallel counting of occurrences of k-mers. Bioinformatics 2011, 27, 764–770. [Google Scholar] [CrossRef] [PubMed] [Green Version]
  43. Luo, R.; Liu, B.; Xie, Y.; Li, Z.; Huang, W.; Yuan, J.; He, G.; Chen, Y.; Pan, Q.; Liu, Y.; et al. SOAPdenovo2: An empirically improved memory-efficient short-read de novo assembler. Gigascience 2012, 1, 18. [Google Scholar] [CrossRef]
  44. Gordon, S.P.; Tseng, E.; Salamov, A.; Zhang, J.; Meng, X.; Zhao, Z.; Kang, D.; Underwood, J.; Grigoriev, I.V.; Figueroa, M.; et al. Widespread Polycistronic Transcripts in Fungi Revealed by Single-Molecule mRNA Sequencing. PLoS ONE 2015, 10, e0132628. [Google Scholar] [CrossRef] [Green Version]
  45. Cheng, H.; Concepcion, G.T.; Feng, X.; Zhang, H.; Li, H. Haplotype-resolved de novo assembly using phased assembly graphs with hifiasm. Nat. Methods 2021, 18, 170–175. [Google Scholar] [CrossRef]
  46. Garrison, E.; Marth, G. Haplotype-based variant detection from short-read sequencing. Quant. Biol. 2012, arXiv:1207.3907. [Google Scholar]
  47. Parra, G.; Bradnam, K.; Korf, I. CEGMA: A pipeline to accurately annotate core genes in eukaryotic genomes. Bioinformatics 2007, 23, 1061–1067. [Google Scholar] [CrossRef] [Green Version]
  48. Li, H.; Durbin, R. Fast and accurate short read alignment with Burrows-Wheeler transform. Bioinformatics 2009, 25, 1754–1760. [Google Scholar] [CrossRef] [Green Version]
  49. Li, H.; Handsaker, B.; Wysoker, A.; Fennell, T.; Ruan, J.; Homer, N.; Marth, G.; Abecasis, G.; Durbin, R. The Sequence Alignment/Map format and SAMtools. Bioinformatics 2009, 25, 2078–2079. [Google Scholar] [CrossRef] [PubMed] [Green Version]
  50. Wingett, S.; Ewels, P.; Furlan-Magaril, M.; Nagano, T.; Schoenfelder, S.; Fraser, P.; Andrews, S. HiCUP: Pipeline for mapping and processing Hi-C data [version 1; referees: 2 approved, 1 approved with reservations]. F1000Res. 2015, 4, 1310. [Google Scholar] [CrossRef] [PubMed] [Green Version]
  51. Zhang, X.; Zhang, S.; Zhao, Q.; Ming, R.; Tang, H. Assembly of allele-aware, chromosomal-scale autopolyploid genomes based on Hi-C data. Nat. Plants 2019, 5, 833–845. [Google Scholar] [CrossRef] [PubMed]
  52. Hoff, K.J.; Stanke, M. Predicting Genes in Single Genomes with AUGUSTUS. Curr. Protoc. Bioinf. 2019, 65, e57. [Google Scholar] [CrossRef] [Green Version]
  53. Price, A.L.; Jones, N.C.; Pevzner, P.A. De novo identification of repeat families in large genomes. Bioinformatics 2005, 21, i351–i358. [Google Scholar] [CrossRef] [Green Version]
  54. Alioto, T.; Blanco, E.; Parra, G.; Guigó, R. Using geneid to Identify Genes. Curr. Protoc. Bioinf. 2018, 64, e56. [Google Scholar] [CrossRef]
  55. Burge, C.; Karlin, S. Prediction of complete gene structures in human genomic DNA. J. Mol. Biol. 1997, 268, 78–94. [Google Scholar] [CrossRef] [Green Version]
  56. Johnson, M.; Zaretskaya, I.; Raytselis, Y.; Merezhuk, Y.; McGinnis, S.; Madden, T.L. NCBI BLAST: A better web interface. Nucleic. Acids. Res. 2008, 36, W5–W9. [Google Scholar] [CrossRef]
  57. Birney, E.; Clamp, M.; Durbin, R. GeneWise and Genomewise. Genome Res. 2004, 14, 988–995. [Google Scholar] [CrossRef] [Green Version]
  58. Trapnell, C.; Roberts, A.; Goff, L.; Pertea, G.; Kim, D.; Kelley, D.R.; Pimentel, H.; Salzberg, S.L.; Rinn, J.L.; Pachter, L. Differential gene and transcript expression analysis of RNA-seq experiments with TopHat and Cufflinks. Nat. Protoc. 2012, 7, 562–578. [Google Scholar] [CrossRef] [Green Version]
  59. Grabherr, M.G.; Haas, B.J.; Yassour, M.; Levin, J.Z.; Thompson, D.A.; Amit, I.; Adiconis, X.; Fan, L.; Raychowdhury, R.; Zeng, Q.; et al. Full-length transcriptome assembly from RNA-Seq data without a reference genome. Nat. Biotechnol. 2011, 29, 644–652. [Google Scholar] [CrossRef] [PubMed] [Green Version]
  60. Haas, B.J.; Salzberg, S.L.; Zhu, W.; Pertea, M.; Allen, J.E.; Orvis, J.; White, O.; Buell, C.R.; Wortman, J.R. Automated eukaryotic gene structure annotation using EVidenceModeler and the Program to Assemble Spliced Alignments. Genome Biol. 2008, 9, R7. [Google Scholar] [CrossRef] [Green Version]
  61. Kanehisa, M.; Goto, S. KEGG: Kyoto Encyclopedia of Genes and Genomes. Nucleic. Acids. Res. 2000, 28, 27–30. [Google Scholar] [CrossRef]
  62. Gene Ontology Consortium. The Gene Ontology resource: Enriching a GOld mine. Nucleic Acids Res. 2021, 49, D325–D334. [Google Scholar] [CrossRef] [PubMed]
  63. Mistry, J.; Chuguransky, S.; Williams, L.; Qureshi, M.; Salazar, G.A.; Sonnhammer, E.L.L.; Tosatto, S.C.E.; Paladin, L.; Raj, S.; Richardson, L.J.; et al. Pfam: The protein families database in 2021. Nucleic. Acids. Res. 2021, 49, D412–D419. [Google Scholar] [CrossRef] [PubMed]
  64. Bao, W.; Kojima, K.K.; Kohany, O. Repbase Update, a database of repetitive elements in eukaryotic genomes. Mob. DNA 2015, 6, 11. [Google Scholar] [CrossRef] [PubMed] [Green Version]
  65. Tarailo-Graovac, M.; Chen, N. Using RepeatMasker to identify repetitive elements in genomic sequences. Curr. Protoc. Bioinforma. 2009, 25, 4.10.1–4.10.14. [Google Scholar] [CrossRef] [PubMed]
  66. Xu, Z.; Wang, H. LTR_FINDER: An efficient tool for the prediction of full-length LTR retrotransposons. Nucleic. Acids. Res. 2007, 35, W265–W268. [Google Scholar] [CrossRef] [Green Version]
  67. Chan, P.P.; Lin, B.Y.; Mak, A.J.; Lowe, T.M. tRNAscan-SE 2.0: Improved detection and functional classification of transfer RNA genes. Nucleic. Acids. Res. 2021, 49, 9077–9096. [Google Scholar] [CrossRef]
  68. Li, L.; Stoeckert, C.J., Jr.; Roos, D.S. OrthoMCL: Identification of ortholog groups for eukaryotic genomes. Genome Res. 2003, 13, 2178–2189. [Google Scholar] [CrossRef] [Green Version]
  69. Yang, Z. PAML: A program package for phylogenetic analysis by maximum likelihood. CABIOS, Comput. Appl. Biosci. 1997, 13, 555–556. [Google Scholar] [CrossRef]
  70. Kumar, S.; Stecher, G.; Suleski, M.; Hedges, S.B. TimeTree: A Resource for Timelines, Timetrees, and Divergence Times. Mol. Biol. Evol. 2017, 34, 1812–1819. [Google Scholar] [CrossRef]
  71. Rambaut, A.; Drummond, A.J.; Xie, D.; Baele, G.; Suchard, M.A. Posterior Summarization in Bayesian Phylogenetics Using Tracer 1.7. Syst. Biol. 2018, 67, 901–904. [Google Scholar] [CrossRef] [Green Version]
  72. Song, N.; Zhao, X.; Cai, C.; Gao, T. Profile of the genomic characteristics and comparative studies of five Trichiuridae species by genome survey sequencing. Front. Mar. Sci. 2022, 9, 962307. [Google Scholar] [CrossRef]
  73. Yang, Y.; Wang, T.; Chen, J.; Wu, L.; Wu, X.; Zhang, W.; Luo, J.; Xia, J.; Meng, Z.; Liu, X. Whole-genome sequencing of brown-marbled grouper (Epinephelus fuscoguttatus) provides insights into adaptive evolution and growth differences. Mol. Ecol. Resour. 2021, 22, 711–723. [Google Scholar] [CrossRef]
  74. Earl, D.; Bradnam, K.; John, J.S.; Darling, A.; Lin, D.; Fass, J.; Yu, H.O.K.; Buffalo, V.; Zerbino, D.R.; Diekhans, M.; et al. Assemblathon 1: A competitive assessment of de novo short read assembly methods. Genome Res. 2011, 21, 2224–2241. [Google Scholar] [CrossRef] [Green Version]
  75. Kang, S.; Kim, J.H.; Jo, E.; Lee, S.J.; Jung, J.; Kim, B.M.; Lee, J.H.; Oh, T.J.; Yum, S.; Rhee, J.S.; et al. 2020. Chromosomal-level assembly of Takifugu obscurus (Abe, 1949) genome using third-generation DNA sequencing and Hi-C analysis. Mol. Ecol. Resour. 2019, 20, 520–530. [Google Scholar] [CrossRef] [PubMed]
  76. Sun, C.; Li, J.; Dong, J.; Niu, Y.; Hu, J.; Lian, J.; Li, W.; Li, J.; Tian, Y.; Shi, Q.; et al. Chromosome-level genome assembly for the largemouth bass Micropterus salmoides provides insights into adaptation to fresh and brackish water. Mol. Ecol. Resour. 2021, 21, 301–315. [Google Scholar] [CrossRef] [PubMed]
  77. Xiao, Y.; Xiao, Z.; Ma, D.; Liu, J.; Li, J. Genome sequence of the barred knifejaw Oplegnathus fasciatus (Temminck & Schlegel, 1844): The first chromosome-level draft genome in the family Oplegnathidae. Gigascience 2019, 8, giz013. [Google Scholar] [PubMed] [Green Version]
  78. Coutts, A.S.; MacKenzie, E.; Griffith, E.; Black, D.M. TES is a novel focal adhesion protein with a role in cell spreading. J. Cell. Sci. 2003, 116, 897–906. [Google Scholar] [CrossRef] [Green Version]
  79. Garvalov, B.K.; Higgins, T.E.; Sutherland, J.D.; Zettl, M.; Scaplehorn, N.; Kocher, T.; Piddini, E.; Griffiths, G.; Way, M. The conformational state of Tes regulates its zyxin-dependent recruitment to focal adhesions. J. Cell. Biol. 2003, 161, 33–39. [Google Scholar] [CrossRef] [PubMed] [Green Version]
  80. Griffith, E.; Coutts, A.S.; Black, D.M. RNAi Knockdown of the Focal Adhesion Protein TES Reveals Its Role in Actin Stress Fibre Organisation. Cell Motil. Cytoskelet. 2005, 60, 140–152. [Google Scholar] [CrossRef] [PubMed]
  81. Dingwell, K.S.; Smith, J.C. Tes regulates neural crest migration and axial elongation in Xenopus. Dev. Biol. 2006, 293, 252–267. [Google Scholar] [CrossRef] [Green Version]
  82. Coleman, N.; Subbiah, V.; Pant, S.; Patel, K.; Roy-Chowdhuri, S.; Yedururi, S.; Johnson, A.; Yap, T.A.; Rodon, J.; Shaw, K.; et al. Emergence of mTOR mutation as an acquired resistance mechanism to AKT inhibition, and subsequent response to mTORC1/2 inhibition. NPJ. Precis. Oncol. 2021, 5, 99. [Google Scholar] [CrossRef]
  83. Wullschleger, S.; Loewith, R.; Hall, M.N. TOR Signaling in Growth and Metabolism. Cell 2006, 124, 471–484. [Google Scholar] [CrossRef] [Green Version]
  84. Villa, E.; Sahu, U.; O’Hara, B.P.; Ali, E.S.; Helmin, K.A.; Asara, J.M.; Gao, P.; Singer, B.D.; Ben-Sahra, I. mTORC1 stimulates cell growth through SAM synthesis and m6A mRNA-dependent control of protein synthesis. Mol. Cell 2021, 81, 2076–2093.e9. [Google Scholar] [CrossRef]
  85. Chen, J.; Long, F. mTORC1 signaling controls mammalian skeletal growth through stimulation of protein synthesis. Development 2014, 141, 2848–2854. [Google Scholar] [CrossRef] [PubMed] [Green Version]
  86. Fitter, S.; Matthews, M.P.; Martin, S.K.; Xie, J.; Ooi, S.S.; Walkley, C.R.; Codrington, J.D.; Ruegg, M.A.; Hall, M.N.; Proud, C.G.; et al. mTORC1 Plays an Important Role in Skeletal Development by Controlling Preosteoblast Differentiation. Mol. Cell. Biol. 2017, 37, e00668-16. [Google Scholar] [CrossRef] [PubMed] [Green Version]
  87. Lopez, E.; Berna-Erro, A.; Lopez, J.J.; Granados, M.P.; Bermejo, N.; Brull, J.M.; Salido, G.M.; Rosado, J.A.; Redondo, P.C. Role of mTOR1 and mTOR2 complexes in MEG-01 cell physiology. Thromb. Haemost. 2015, 114, 969–981. [Google Scholar] [CrossRef] [Green Version]
  88. Chen, J.; Holguin, N.; Shi, Y.; Silva, M.J.; Long, F. mTORC2 Signaling Promotes Skeletal Growth and Bone Formation in Mice. J. Bone. Miner. Res. 2015, 30, 369–378. [Google Scholar] [CrossRef] [Green Version]
  89. Matoba, K.; Noda, N.N. Structural catalog of core Atg proteins opens new era of autophagy research. J. Biochem. 2021, 169, 517–525. [Google Scholar] [CrossRef]
  90. Fang, D.; Xie, H.; Hu, T.; Shan, H.; Li, M. Binding Features and Functions of ATG3. Front. Cell. Dev. Biol. 2021, 9, 685625. [Google Scholar] [CrossRef]
  91. Youle, R.J.; Narendra, D.P. Mechanisms of mitophagy. Nat. Rev. Mol. Cell. Biol. 2011, 12, 9–14. [Google Scholar] [CrossRef]
  92. Mizushima, N.; Yoshimori, T.; Ohsumi, Y. The Role of Atg Proteins in Autophagosome Formation. Annu. Rev. Cell Dev. Biol. 2011, 27, 107–132. [Google Scholar] [CrossRef]
  93. Oral, O.; Oz-Arslan, D.; Itah, Z.; Naghavi, A.; Deveci, R.; Karacali, S.; Gozuacik, D. Cleavage of Atg3 protein by caspase-8 regulates autophagy during receptor-activated cell death. Apoptosis 2012, 17, 810–820. [Google Scholar] [CrossRef]
  94. Li, M.; Hou, Y.; Wang, J.; Chen, X.; Shao, Z.; Yin, X. Kinetics Comparisons of Mammalian Atg4 Homologues Indicate Selective Preferences toward Diverse Atg8 Substrates. J. Biol. Chem. 2011, 286, 7327–7338. [Google Scholar] [CrossRef] [PubMed] [Green Version]
  95. Nguyen, T.N.; Padman, B.S.; Zellner, S.; Khuu, G.; Uoselis, L.; Lam, W.K.; Skulsuppaisarn, M.; Lindblom, R.S.J.; Watts, E.M.; Behrends, C.; et al. ATG4 family proteins drive phagophore growth independently of the LC3/GABARAP lipidation system. Mol. Cell 2021, 81, 2013–2030. [Google Scholar]
  96. Bartolomeo, S.D.; Nazio, F.; Cecconi, F. The role of autophagy during development in higher eukaryotes. Traffic 2010, 11, 1280–1289. [Google Scholar] [CrossRef] [PubMed]
  97. Cecconi, F.; Levine, B. The role of autophagy in mammalian development: Cell makeover rather than cell death. Dev. Cell. 2008, 15, 344–357. [Google Scholar] [CrossRef] [PubMed] [Green Version]
  98. Luciani, M.F.; Giusti, C.; Harms, B.; Oshima, Y.; Kikuchi, H.; Kubohara, Y.; Golstein, P. Atg1 allows second-signaled autophagic cell death in Dictyostelium. Autophagy 2011, 7, 501–508. [Google Scholar] [CrossRef] [Green Version]
  99. Wu, W.; Wei, W.; Ablimit, M.; Ma, Y.; Fu, T.; Liu, K.; Peng, J.; Li, Y.; Hong, H. Responses of two insect cell lines to starvation: Autophagy prevents them from undergoing apoptosis and necrosis, respectively. J. Insect. Physiol. 2011, 57, 723–734. [Google Scholar] [CrossRef]
  100. Malagoli, D.; Abdalla, F.C.; Cao, Y.; Feng, Q.; Fujisaki, K.; Gregorc, A.; Matsuo, T.; Nezis, I.P.; Papassideri, I.S.; Sass, M.; et al. Autophagy and its physiological relevance in arthropods: Current knowledge and perspectives. Autophagy 2010, 6, 575–588. [Google Scholar] [CrossRef] [PubMed] [Green Version]
  101. Romanelli, D.; Casati, B.; Franzetti, E.; Tettamanti, G. A Molecular View of Autophagy in Lepidoptera. Biomed. Res. Int. 2014, 2014, 902315. [Google Scholar] [CrossRef] [PubMed] [Green Version]
  102. Franzetti, E.; Huang, Z.J.; Shi, Y.X.; Xie, K.; Deng, X.J.; Li, J.P.; Li, Q.R.; Yang, W.Y.; Zeng, W.N.; Casartelli, M.; et al. Autophagy precedes apoptosis during the remodeling of silkworm larval midgut. Apoptosis 2012, 17, 305–324. [Google Scholar] [CrossRef] [PubMed]
  103. Varga, M.; Sass, M.; Papp, D.; Takacs-Vellai, K.; Kobolak, J.; Dinnyes, A.; Klionsky, D.J.; Vellai, T. Autophagy is required for zebrafish caudal fin regeneration. Cell Death Differ. 2014, 21, 547–556. [Google Scholar] [CrossRef] [PubMed] [Green Version]
  104. Bircher, J.E.; Koleske, A.J. Trio family proteins as regulators of cell migration and morphogenesis in development and disease-mechanisms and cellular contexts. J. Cell. Sci. 2021, 134, jcs248393. [Google Scholar] [CrossRef]
  105. Chen, H.; Guo, S.; Xia, Y.; Yuan, L.; Lu, M.; Zhou, M.; Fang, M.; Meng, L.; Xiao, Z.; Ma, J. The role of Rho-GEF Trio in regulating tooth root development through the p38 MAPK pathway. Exp. Cell. Res. 2018, 372, 158–167. [Google Scholar] [CrossRef]
  106. Lv, W.; Ma, A.; Chi, X.; Li, Q.; Pang, Y.; Su, P. A novel complement factor I involving in the complement system immune response from Lampetra morii. Fish Shellfish. Immunol. 2020, 98, 988–994. [Google Scholar] [CrossRef]
  107. Noris, M.; Remuzzi, G. Overview of Complement Activation and Regulation. Semin. Nephrol. 2013, 33, 479–492. [Google Scholar] [CrossRef] [Green Version]
  108. Ebrahimiyan, H.; Mostafaei, S.; Aslani, S.; Faezi, S.T.; Farhadi, E.; Jamshidi, A.; Mahmoudi, M. Association between complement gene polymorphisms and systemic lupus erythematosus: A systematic review and meta-analysis. Clin. Exp. Med. 2022, 22, 427–438. [Google Scholar] [CrossRef]
  109. Nayak, A.; Pednekar, L.; Reid, K.B.; Kishore, U. Complement and non-complement activating functions of C1q: A prototypical innate immune molecule. Innate Immun. 2012, 18, 350–363. [Google Scholar] [CrossRef]
  110. Eggleton, P.; Tenner, A.J.; Reid, K.B. C1q receptors. Clin. Exp. Immunol. 2020, 120, 406–412. [Google Scholar] [CrossRef]
  111. Oikonomopoulou, K.; Ricklin, D.; Ward, P.A.; Lambris, J.D. Interactions between coagulation and complement—Their role in inflammation. Semin. Immunopathol. 2012, 34, 151–165. [Google Scholar] [CrossRef] [PubMed] [Green Version]
  112. Ricklin, D.; Hajishengallis, G.; Yang, K.; Lambris, J.D. Complement: A key system for immune surveillance and homeostasis. Nat. Immunol. 2010, 11, 785–797. [Google Scholar] [CrossRef] [PubMed] [Green Version]
  113. Bajic, G.; Degn, S.E.; Thiel, S.; Andersen, G.R. Complement activation, regulation, and molecular basis for complement-related diseases. EMBO J. 2015, 34, 2735–2757. [Google Scholar] [CrossRef] [PubMed] [Green Version]
  114. Bavia, L.; Santiesteban-Lores, L.E.; Carneiro, M.C.; Prodocimo, M.M. Advances in the complement system of a teleost fish, Oreochromisniloticus. Fish Shellfish. Immunol. 2022, 123, 61–74. [Google Scholar] [CrossRef] [PubMed]
  115. Singh, B.; Su, Y.C.; Riesbeck, K. Vitronectin in bacterial pathogenesis: A host protein used in complement escape and cellular invasion. Mol. Microbiol. 2010, 78, 545–560. [Google Scholar] [CrossRef]
  116. Li, S.; Hao, G.; Peng, W.; Geng, X.; Sun, J. Expression and functional characterization of vitronectin gene from Japanese flounder (Paralichthys olivaceus). Fish Shellfish. Immunol. 2017, 65, 9–16. [Google Scholar] [CrossRef]
  117. Hebenstreit, D.; Wirnsberger, G.; Horejs-Hoeck, J.; Duschl, A. Signaling mechanisms, interaction partners, and target genes of STAT6. Cytokine Growth Factor Rev. 2006, 17, 173–188. [Google Scholar] [CrossRef]
  118. Chen, H.; Sun, H.; You, F.; Sun, W.; Zhou, X.; Chen, L.; Yang, J.; Wang, Y.; Tang, H.; Guan, Y.; et al. Activation of STAT6 by STING Is Critical for Antiviral Innate Immunity. Cell 2011, 147, 436–446. [Google Scholar] [CrossRef] [Green Version]
  119. Secombes, C.J.; Wang, T.; Bird, S. The interleukins of fish. Dev. Comp. Immunol. 2011, 35, 1336–1345. [Google Scholar] [CrossRef]
  120. El Kasmi, K.C.; Smith, A.M.; Williams, L.; Neale, G.; Panopoulos, A.D.; Watowich, S.S.; Hacker, H.; Foxwell, B.M.; Murray, P.J. Cutting Edge: A Transcriptional Repressor and Corepressor Induced by the STAT3-Regulated Anti-Inflammatory Signaling Pathway. J. Immunol. 2007, 179, 7215–7219. [Google Scholar] [CrossRef] [Green Version]
  121. Yoon, S.I.; Logsdon, N.J.; Sheikh, F.; Donnelly, R.P.; Walter, M.R. Conformational Changes Mediate Interleukin-10 Receptor 2 (IL-10R2) Binding to IL-10 and Assembly of the Signaling Complex. J. Biol. Chem. 2006, 281, 35088–35096. [Google Scholar] [CrossRef] [Green Version]
  122. Campbell, J.P.; Turner, J.E. Debunking the Myth of Exercise-Induced Immune Suppression: Redefining the Impact of Exercise on Immunological Health Across the Lifespan. Front. Immunol. 2018, 9, 648. [Google Scholar] [CrossRef] [Green Version]
  123. Van Dijk, J.G.; Matson, K.D. Ecological Immunology through the Lens of Exercise Immunology: New Perspective on the Links between Physical Activity and Immune Function and Disease Susceptibility in Wild Animals. Integr. Comp. Biol. 2016, 56, 290–303. [Google Scholar] [CrossRef] [PubMed] [Green Version]
  124. Castro, V.; Grisdale-Helland, B.; Jørgensen, S.M.; Helgerud, J.; Claireaux, G.; Farrell, A.P.; Krasnov, A.; Helland, S.J.; Takle, H. Disease resistance is related to inherent swimming performance in Atlantic salmon. BMC Physiol. 2013, 13, 1. [Google Scholar] [CrossRef] [PubMed] [Green Version]
  125. Robinson, N.A.; Timmerhaus, G.; Baranski, M.; Andersen, O.; Takle, H.; Krasnov, A. Training the salmon’s genes: Influence of aerobic exercise, swimming performance and selection on gene expression in Atlantic salmon. BMC Genom. 2017, 18, 971. [Google Scholar] [CrossRef] [PubMed] [Green Version]
  126. Hou, Q.; Fu, S.; Huang, T.; Li, X.; Shi, X. Effects of Aerobic Exercise Training on the Growth, Swimming Performance, Antipredation Ability and Immune Parameters of Juvenile Rock Carp (Procypris rabaudi). Animals 2022, 12, 257. [Google Scholar] [CrossRef] [PubMed]
  127. Zhu, Z.; Song, B.; Lin, X.; Xu, Z. Effects of water-current speed on hematological, biochemical and immune parameters in juvenile tinfoil barb, Barbonymus schwanenfeldii (Bleeker, 1854). Chin. J. Oceanol. Limnol. 2015, 34, 118–124. [Google Scholar] [CrossRef]
  128. Areal, L.B.; Pereira, L.P.; Ribeiro, F.M.; Olmo, I.G.; Muniz, M.R.; Rodrigues, M.D.C.; Costa, P.F.; Martins-Silva, C.; Ferguson, S.S.G.; Guimarães, D.A.M.; et al. Role of Dynein Axonemal Heavy Chain 6 Gene Expression as a Possible Biomarker for Huntington’s Disease: A Translational Study. J. Mol. Neurosci. 2017, 63, 342–348. [Google Scholar] [CrossRef]
  129. Whitfield, M.; Thomas, L.; Bequignon, E.; Schmitt, A.; Stouvenel, L.; Montantin, G.; Tissier, S.; Duquesnoy, P.; Copin, B.; Chantot, S.; et al. Mutations in DNAH17, Encoding a Sperm-Specific Axonemal Outer Dynein Arm Heavy Chain, Cause Isolated Male Infertility Due to Asthenozoospermia. Am. J. Hum. Genet. 2019, 105, 198–212. [Google Scholar] [CrossRef] [Green Version]
  130. Li, Y.; Yagi, H.; Onuoha, E.O.; Damerla, R.R.; Francis, R.; Furutani, Y.; Tariq, M.; King, S.M.; Hendricks, G.; Cui, C.; et al. DNAH6 and Its Interactions with PCD Genes in Heterotaxy and Primary Ciliary Dyskinesia. PLoS Genet. 2016, 12, e1005821. [Google Scholar] [CrossRef] [PubMed] [Green Version]
  131. Liu, C.; Miyata, H.; Gao, Y.; Sha, Y.; Tang, S.; Xu, Z.; Whitfield, M.; Patrat, C.; Wu, H.; Dulioust, E.; et al. Bi-allelic DNAH8 Variants Lead to Multiple Morphological Abnormalities of the Sperm Flagella and Primary Male Infertility. Am. J. Hum. Genet. 2020, 107, 330–341. [Google Scholar] [CrossRef] [PubMed]
  132. Hu, F.; Xu, K.; Zhou, Y.; Wu, C.; Wang, S.; Xiao, J.; Wen, M.; Zhao, R.; Luo, K.; Tao, M.; et al. Different expression patterns of sperm motility-related genes in testis of diploid and tetraploid cyprinid fish. Biol. Reprod. 2017, 96, 907–920. [Google Scholar] [CrossRef] [PubMed] [Green Version]
  133. Burgers, P.M.; Koonin, E.V.; Bruford, E.; Blanco, L.; Burtis, K.C.; Christman, M.F.; Copeland, W.C.; Friedberg, E.C.; Hanaoka, F.; Hinkle, D.C.; et al. Eukaryotic DNA polymerases: Proposal for a revised nomenclature. J. Biol. Chem. 2001, 276, 43487–43490. [Google Scholar] [CrossRef] [Green Version]
  134. Nick McElhinny, S.A.; Ramsden, D.A. Polymerase Mu Is a DNA-Directed DNA/RNA Polymerase. Mol. Cell Biol. 2003, 23, 2309–2315. [Google Scholar] [CrossRef] [PubMed] [Green Version]
  135. Gladdy, R.A.; Nutter, L.M.; Kunath, T.; Danska, J.S.; Guidos, C.J. p53-Independent Apoptosis Disrupts Early Organogenesis in Embryos Lacking Both Ataxia-Telangiectasia Mutated and Prkdc. Mol. Cancer Res. 2006, 4, 311–318. [Google Scholar] [CrossRef] [Green Version]
  136. Wu, L.C.; Wang, Z.W.; Tsan, J.T.; Spillman, M.A.; Phung, A.; Xu, X.L.; Yang, M.-C.W.; Hwang, L.-Y.; Bowcock, A.M.; Baer, R. Identification of a RING protein that can interact in vivo with the BRCA1 gene product. Nat. Genet. 1996, 14, 430–440. [Google Scholar] [CrossRef]
  137. Laufer, M.; Nandula, S.V.; Modi, A.P.; Wang, S.; Jasin, M.; Murty, V.V.; Ludwig, T.; Baer, R. Structural Requirements for the BARD1 Tumor Suppressor in Chromosomal Stability and Homology-directed DNA Repair. J. Biol. Chem. 2007, 282, 34325–34333. [Google Scholar] [CrossRef] [Green Version]
  138. Westermark, U.K.; Reyngold, M.; Olshen, A.B.; Baer, R.; Jasin, M.; Moynahan, M.E. BARD1 Participates with BRCA1 in Homology-Directed Repair of Chromosome Breaks. Mol. Cell. Biol. 2003, 23, 7926–7936. [Google Scholar] [CrossRef] [Green Version]
  139. Morris, J.R.; Solomon, E. BRCA1: BARD1 induces the formation of conjugated ubiquitin structures, dependent on K6 of ubiquitin, in cells during DNA replication and repair. Hum. Mol. Genet. 2004, 13, 807–817. [Google Scholar] [CrossRef] [Green Version]
  140. Wu-Baer, F.; Ludwig, T.; Baer, R. The UBXN1 Protein Associates with Autoubiquitinated Forms of the BRCA1 Tumor Suppressor and Inhibits Its Enzymatic Function. Mol. Cell. Biol. 2010, 30, 2787–2798. [Google Scholar] [CrossRef] [Green Version]
  141. Stracker, T.H. Chaperoning the DNA damage response. FEBS J. 2017, 284, 2375–2377. [Google Scholar] [CrossRef] [PubMed] [Green Version]
  142. Zuhlke, K.A.; Johnson, A.M.; Okoth, L.A.; Stoffel, E.M.; Robbins, C.M.; Tembe, W.A.; Salinas, C.A.; Zheng, S.L.; Xu, J.F.; Carpten, J.D.; et al. Identification of a novel NBN truncating mutation in a family with hereditary prostate cancer. Fam. Cancer 2012, 11, 595–600. [Google Scholar] [CrossRef] [PubMed] [Green Version]
  143. Liu, N.; Lamerdin, J.E.; Tebbs, R.S.; Schild, D.; Tucker, J.D.; Shen, M.R.; Brookman, K.W.; Siciliano, M.J.; Walter, C.A.; Fan, W.F.; et al. XRCC2 and XRCC3, New Human Rad51-Family Members, Promote Chromosome Stability and Protect against DNA Cross-Links and Other Damages. Mol. Cell 1998, 1, 783–793. [Google Scholar] [CrossRef]
  144. Cui, X.; Brenneman, M.; Meyne, J.; Oshimura, M.; Goodwin, E.H.; Chen, D.J. The XRCC2 and XRCC3 repair genes are required for chromosome stability in mammalian cells. Mutat. Res. DNA Repair. 1999, 434, 75–88. [Google Scholar] [CrossRef] [Green Version]
  145. Ciccia, A.; Ling, C.; Coulthard, R.; Yan, Z.; Xue, Y.; Meetei, A.R.; Laghmani, E.H.; Joenje, H.; McDonald, N.; de Winter, J.P.; et al. Identification of FAAP24, a Fanconi Anemia Core Complex Protein that Interacts with FANCM. Mol. Cell. 2007, 25, 331–343. [Google Scholar] [CrossRef] [PubMed]
  146. Ling, C.; Ishiai, M.; Ali, A.M.; Medhurst, A.L.; Neveling, K.; Kalb, R.; Yan, Z.; Xue, Y.; Oostra, A.B.; Auerbach, A.D.; et al. FAAP100 is essential for activation of the Fanconi anemia-associated DNA damage response pathway. EMBO J. 2007, 26, 2104–2114. [Google Scholar] [CrossRef]
  147. Kristensen, A.S.; Andersen, J.; Jorgensen, T.N.; Sorensen, L.; Eriksen, J.; Loland, C.J.; Stromgaard, K.; Gether, U. SLC6 Neurotransmitter Transporters: Structure, Function, and Regulation. Pharmacol. Rev. 2011, 63, 585–640. [Google Scholar] [CrossRef] [PubMed]
  148. Jayaraman, K.; Das, A.K.; Luethi, D.; Szöllősi, D.; Schütz, G.J.; Reith, M.E.A.; Sitte, H.H.; Stockner, T. SLC6 transporter oligomerization. J. Neurochem. 2020, 157, 919–929. [Google Scholar] [CrossRef]
  149. Meuwissen, M.E.; Halley, D.J.; Smit, L.S.; Lequin, M.H.; Cobben, J.M.; de Coo, R.; van Harssel, J.; Sallevelt, S.; Woldringh, G.; van der Knaap, M.S.; et al. The expanding phenotype of COL4A1 and COL4A2 mutations: Clinical data on 13 newly identified families and a review of the literature. Genet. Med. 2015, 17, 843–853. [Google Scholar] [CrossRef] [Green Version]
  150. Billhaq, D.H.; Lee, S.H.; Lee, S. The potential function of endometrial-secreted factors for endometrium remodeling during the estrous cycle. Anim. Sci. J. 2020, 91, e13333. [Google Scholar] [CrossRef] [PubMed]
  151. Tanaka, T.; Wang, C.; Umesaki, N. Autocrine/paracrine regulation of human endometrial stromal remodeling by laminin and type IV collagen. Int. J. Mol. Med. 2008, 22, 581–587. [Google Scholar] [CrossRef] [PubMed]
Figure 1. High-definition image, sampling location, and sampling date of L. savala used for genome sequencing.
Genes 14 01268 g001
Figure 2. Statistics of the Hi-C assembly of the L. savala genome. The colour reflects the intensity of each contact, with deeper colours representing higher intensity.
Genes 14 01268 g002
Figure 3. Genome coordinates and annotation information of the L. savala genome.
Genes 14 01268 g003
Figure 4. Types and numbers of gene families in 19 species (A) and quantitative analysis of gene families in L. savala, T. albacares, T. maccoyii, and P. flavescens (B).
Genes 14 01268 g004
Figure 5. Gene family expansions and contractions for 19 species.
Genes 14 01268 g005
Figure 6. Evolutionary divergence times of 19 species.
Genes 14 01268 g006
Table 1. Structure and parameters of genes predicted by three different methods.
MethodsGene SetNumberAverage
Transcript
Length (bp)
Average
CDS
Length (bp)
Average
Exons
per Gene
Average
Exon
Length (bp)
Average
Intron
Length (bp)
De novoAugustus33,4868827.521201.396.87174.851298.98
GlimmerHMM76,3838606.22686.714.6149.372201.43
SNAP64,95611,484.45799.655.76138.712242.37
Geneid34,35014,311.261231.616.09202.22569.11
GenScan33,08416,121.641490.158.22181.342027.19
HomologDanio rerio23,25610,252.691494.807.53198.531341.28
Etheostoma spectabile22,97311,643.931604.778.3193.261374.52
Gasterosteus aculeatus27,1658780.311235.596.74183.241313.76
Homo sapiens18,14811,303.801465.647.95184.381415.76
Oryzias latipes23,44611,206.101630.438.19199.161332.48
Perca flavescens26,55410,560.301481.677.73191.651348.74
Perca fluviatilis25,66110,889.741529.667.87194.371362.46
Sander lucioperca25,31311,255.571578.828.21192.271341.86
Thunnus albacares25,36111,411.781589.758.25192.621354.14
Thunnus maccoyii24,44611,716.771631.438.48192.51349.21
Takifugu rubripes22,03811,995.551634.468.63189.421358.19
RNA-SeqPASA43,44511,533.681469.519.05162.381250.24
Cufflinks37,91613,980.132755.818.75315.051448.83
EVM (EVidenceModeler)31,87610,753.391307.477.49174.541455.28
PASA-update *31,43411,153.721339.727.67174.731471.95
Final set **23,62513,717.341620.829.38172.741442.96
*: Contains UTR region. **: This final set contains UTR region.
Table 2. KEGG enrichment analysis of expanded and contracted gene families.
1. Contraction (93 Gene Families, 13 KEGG Pathways)
KEGG pathwaysp-valueGenes
Synaptic vesicle cycle1.61 × 10−6SLC6A13, SLC6A1, SLC6A11
GABAergic synapse5.39 × 10−6SLC6A13, SLC6A1, SLC6A11
Choline metabolism in cancer7.27 × 10−5SLC22A5, SLC5A7
NOD-like receptor signaling pathway0.0028841NLRC3, GVIN1, URGCP
Small cell lung cancer0.0040207COL4A1, COL4A2, COL4A6
Protein digestion and absorption0.0044306COL4A1, COL4A2, COL6A3, SLC6A19, COL4A6, SLC6A19
Pathogenic Escherichia coli infection0.0060438TUBB1, COL6A3
Necroptosis0.0111952NLRC3, COL6A3, CAPN2, ALOX5
Mineral absorption0.0208705SLC6A19
Gap junction0.0305233TUBB1, COL6A3
Arachidonic acid metabolism0.0311748ALOX5
ECM–receptor interaction0.0359224COL4A1, COL4A2, COL6A3, COL6A6
Focal adhesion0.0466035COL4A1, COL4A2, COL6A3, COL6A6
2. Expansion (67 gene families, 18 KEGG pathways)
KEGG pathwaysp-valueGenes
Focal adhesion0.00TRIO, TES
ECM–receptor interaction0.00TRIO, TES
Platelet activation0.00TRIO, TES
Relaxin signaling pathway0.00TRIO, TES
AGE-RAGE signaling pathway in diabetic complications0.00TRIO, TES
Protein digestion and absorption0.00TRIO, TES
Amoebiasis0.00TRIO, IGHM, GPR119, TES
Human papillomavirus infection1.36 × 10−262TRIO, F5, EIF3A, TES
PI3K-Akt signaling pathway6.51 × 10−251TRIO, IGHM, TES
Olfactory transduction4.99 × 10−40NONE
Lysine degradation2.09 × 10−6KMT5AA, KMT5A, SET-1
Huntington disease4.89 × 10−5DNAH7, DNAH11, DNAH9, NES, DNAH3, DNAH5, DNAH8, DNAH2, DHC10, KLF18, SGS4, DNAH1, DNAH6, QRICH2, DNAH10
Staphylococcus aureus infection0.0079023IGLV1-51, IGHM, SFTPD, MBL, MBL2, IFITM3
Cortisol synthesis and secretion0.0119558CACNA1G, CACNA1H, CACNA1I, CACNA1H
PPAR signaling pathway0.0169356SAMD3
Bacterial secretion system0.017091SECA3, SECA
Allograft rejection0.0267611IGLV1-51, IGHM, PRF1
Glycosphingolipid biosynthesis0.0462553ST3GAL1
Table 3. Genome characteristics comparison based on two groups of positive selection analyses.
Group 1 (Genes: 903; GO Terms: 62; KEGG Pathways: 17)
A: L. savala; B. A. schlegelii, L. crocea, P. flavescens
GO termsKEGG PathwaysGenes screened
DNA metabolic processJAK-STAT signaling pathwayHIRA, IL15RA, PRLR, etc.
Nuclear chromosomeNovobiocin biosynthesisTAT
DNA repairFanconi anemia pathwayEME2, FAAP100, BRCA1, etc.
Nucleic acid bindingCytokine–cytokine receptor interactionINHBA, HIRA, TNFRSF26, etc.
Helicase activitySulfur relay systemSYNPR, MOCS2, NFS1
Nuclease activityEther lipid metabolismTPT1, SH3BGRL3, PLA2G3, etc.
Checkpoint clamp complexArginine biosynthesisNOS1, ASL, NAGS, GLS2
SpindleRNA transportRANBP2, EIF2B3, RPP30, etc.
Hyaluronic acid bindingHomologous recombinationBARD1, EME2, BRCA1, etc.
Chromatin bindingPhenylalanine, tyrosine, and tryptophan biosynthesisTAT
Ino80 complexTropane, piperidine, and pyridine alkaloid biosynthesisTAT
Protein homodimerization activityAlanine, aspartate, and glutamate metabolismASNS, ASL, ABAT, etc.
7S RNA bindingUbiquinone and other terpenoid-quinone biosynthesisTAT, COQ6
Signal recognition particleThiamine metabolismAK5, CFAP61, NFS1
ATPase activityRibosome biogenesis in eukaryotesUTP14A, RIOK1, HEATR1, etc.
Isomerase activityNonhomologous end-joiningPRKDC, POLM
DNA damage checkpointComplement and coagulation cascadesF5, PLAU, CPB2, etc.
Group 2 (Genes: 922; GO terms: 70; KEGG Pathways: 18)
A. L. savala, M. albus; B. A. schlegelii, L. crocea, P. flavescens
GO termsKEGG PathwaysGenes screened
Methyltransferase activityCytokine–cytokine receptor interactionTNFRSF13B, OSMR, PRLR, etc.
Aminomethyltransferase activityJAK-STAT signaling pathwayOSMR, PRLR, IL15RA, etc.
Nucleic acid bindingRNA transportUPF3A, EIF3F, EIF3C, etc.
Neurotransmitter metabolic processThyroid cancerANKDD1A, RET, CCDC6, etc.
Catabolic processRibosome biogenesis in eukaryotesHEATR1, REXO1, VSTM2A, etc.
Organic substance catabolic processAutophagy—otherATG3, TRIM14, MTOR, etc.
Glycine catabolic processPancreatic cancerE2F3, ANKDD1A, VEGFAA, etc.
RNA cap binding complexIntestinal immune network for IgA productionTNFRSF13B, IL15RA, CD28, etc.
RNA bindingAutophagy—yeastATG3, TRIM14, MTOR, etc.
Organonitrogen compound catabolic processChronic myeloid leukemiaE2F3, ANKDD1A, GRAP, etc.
LUBAC complexEGFR tyrosine kinase inhibitor resistanceVEGFAA, MTOR, GRAP, etc.
N-methyltransferase activityFanconi anemia pathwayBRCA1, ANKDD1A, RMI1, etc.
Phospholipase A2 activityPhenazine biosynthesisPBLD
Drug catabolic processUbiquinone and other terpenoid-quinone biosynthesisCOQ2, TAT, COQ6
Threonine-type endopeptidase activityGlycine, serine, and threonine metabolismAMT, CHDH, DMGDH, etc.
Proteasome core complexNonhomologous end-joiningXRCC6, DCLRE1C, DNTT
KinetochoreProstate cancerE2F3, MTOR, GRAP, BAD, etc.
Protein homodimerization activityAcute myeloid leukemiaMTOR, GRAP, BAD, etc.
Disclaimer/Publisher’s Note: The statements, opinions and data contained in all publications are solely those of the individual author(s) and contributor(s) and not of MDPI and/or the editor(s). MDPI and/or the editor(s) disclaim responsibility for any injury to people or property resulting from any ideas, methods, instructions or products referred to in the content.

