Article

Transcriptomic Characterization of Genes Regulating the Stemness in Porcine Atrial Cardiomyocytes during Primary In Vitro Culture

1
Section of Regenerative Medicine and Cancer Research, Natural Sciences Club, Faculty of Biology, Adam Mickiewicz University, Poznań, 61-614 Poznan, Poland
2
Department of Anatomy, Poznan University of Medical Sciences, 60-781 Poznan, Poland
3
Department of Histology and Embryology, Poznan University of Medical Sciences, 60-781 Poznan, Poland
4
Department of Cancer Immunology, Chair of Medical Biotechnology, Poznan University of Medical Sciences, 61-866 Poznan, Poland
5
Gene Therapy Laboratory, Department of Cancer Diagnostics and Immunology, Greater Poland Cancer Centre, 61-866 Poznan, Poland
6
Department of Diagnostics and Clinical Sciences, Institute of Veterinary Medicine, Nicolaus Copernicus University in Torun, 87-100 Torun, Poland
7
Department of Veterinary Surgery, Institute of Veterinary Medicine, Nicolaus Copernicus University in Torun, 87-100 Torun, Poland
8
Prestage Department of Poultry Science, North Carolina State University, Raleigh, NC 27695, USA
9
Physiology Graduate Faculty, North Carolina State University, Raleigh, NC 27695, USA
10
Department of Human Morphology and Embryology, Division of Histology and Embryology, Wroclaw Medical University, 50-368 Wroclaw, Poland
11
Division of Anatomy and Histology, University of Zielona Góra, 65-046 Zielona Góra, Poland
12
Department of Human Morphology and Embryology, Division of Anatomy, Wroclaw Medical University, 50-367 Wroclaw, Poland
13
Department of Obstetrics and Gynaecology, University Hospital and Masaryk University, 62500 Brno, Czech Republic
*
Author to whom correspondence should be addressed.
Genes 2023, 14(6), 1223; https://doi.org/10.3390/genes14061223
Submission received: 12 May 2023 / Revised: 1 June 2023 / Accepted: 2 June 2023 / Published: 4 June 2023
(This article belongs to the Special Issue Trends and Prospects in Pig Genomics and Genetics)

Abstract

:
Heart failure remains a major cause of death worldwide. There is a need to establish new management options as current treatment is frequently suboptimal. Clinical approaches based on autologous stem cell transplant is potentially a good alternative. The heart was long considered an organ unable to regenerate and renew. However, several reports imply that it may possess modest intrinsic regenerative potential. To allow for detailed characterization of cell cultures, whole transcriptome profiling was performed after 0, 7, 15, and 30 days of in vitro cell cultures (IVC) from the right atrial appendage and right atrial wall utilizing microarray technology. In total, 4239 differentially expressed genes (DEGs) with ratio > abs |2| and adjusted p-value ≤ 0.05 for the right atrial wall and 4662 DEGs for the right atrial appendage were identified. It was shown that a subset of DEGs, which have demonstrated some regulation of expression levels with the duration of the cell culture, were enriched in the following GO BP (Gene Ontology Biological Process) terms: “stem cell population maintenance” and “stem cell proliferation”. The results were validated by RT-qPCR. The establishment and detailed characterization of in vitro culture of myocardial cells may be important for future applications of these cells in heart regeneration processes.

1. Introduction

The past three decades have brought progress in cardiovascular medicine leading to a significant decrease in mortality due to acute cardiovascular syndromes in developed countries [1]. Still, in many cases, myocardial injury leads to the development of heart failure, “a complex clinical syndrome that results from any structural or functional impairment of ventricular filling or ejection of blood” [2]. Heart failure (HF) has an annual prevalence of approximately 37.7 million people [3]. Survival of HF patients varies from 3 to 5 years, on average, making their prognosis poorer than for most cancers [4].
There is a need to develop more optimal methods for the treatment of heart failure. The heart was considered an organ unable to regenerate and renew. However, there is now evidence suggesting that the heart may have some ability for self-repair, especially in response to exploitation/physiological stress [5,6,7,8,9,10]. Therapies based on cells driving heart regeneration may become a promising new strategy for current disease management.
Cardiac progenitor cells (CPCs) are potentially a heterogenous group of cells which activate in response to an injury and contribute to cardiomyocytes’ replenishment. They are localized in different heart regions (atria, ventricles, epicardium, or pericardium) [11]. Many studies in the past two decades have focused on the identification and isolation of this cell population in adult mammalian hearts. Their characteristic properties include clonogenicity, self-renewal, differentiation into several cell types of cardiac lineage, expression of specific transcription factors—Isl-1, Nkx2.5, MEF2C, and GATA-4—and stemness markers such as Oct3/4, Bmi-1, and Nanog. Intramyocardial transplantation of such cells leads to a reduction of scar size and the preservation of left ventricular function in preclinical myocardial infarction models [11,12,13]. These subpopulations include c-kitpos CPCs [14,15,16], cardiosphere-derived cells (CDCs) [17,18,19,20], cardiac side population cells (SP) [21,22,23], Sca-1pos CPCs (stem cell antigen-1) [24,25], epicardium-derived progenitor cells (EPDCs) [26,27], cardiac colony-forming unit fibroblasts (cCFU-Fs) [28,29], and Islet-1pos cells [30,31,32].
Two types of adult cardiac progenitor cells have reached clinical testing [33,34]. It is noteworthy that results of CADUCEUS, a clinical study of cardiosphere-derived cells, showed a reduction of infarct size, increased viable heart mass, and regional contractility in the group administered with autologous CDCs compared to the group that received standard treatment. Nevertheless, there was no significant difference in left ventricular (LV) ejection fraction between the groups [34].
A significant challenge to employ cardiac stem cells is the small pool of these cells. Furthermore, the precise role of the majority of CPCs in the adult heart is unknown [11]. As a consequence, molecular characterization of these cell populations and the elucidation of genetic and epigenetic mechanisms which dictate the cells’ phenotype and fate is crucial for further progress.
The aim of this work was to establish a methodology for the identification of presumed cardiac stem cells, as well as for primary in vitro cultures’ conditions of cardiomyocytes isolated from two different fragments of porcine (Sus scrofa f. domestica) heart, namely, the right atrial appendage and right atrial wall. It is suggested that there may reside a specific cell population with regenerative potential within porcine cardiac muscle. The establishment and detailed characterization of in vitro culture of cardiac muscle cells may be important for future applications of these cells in heart regeneration processes.

2. Materials and Methods

2.1. Animals

For this study, a total of 25 pubertal crossbred Landrace gilts bred on a commercial local farm were used. The gilts had a mean age of 155 days (range 140–170 days), and the mean weight was 100 kg (95–120 kg). All of the animals were housed under identical conditions and fed the same forage (depending on age and reproductive status).
This research related to animal use has complied with all the relevant national regulations and institutional policies for the care and use of animals. As the research material is usually disposed of after slaughter, being a remnant by-product, no Ethical Committee approval was needed for this study.

2.2. Cell Isolation

After slaughter, porcine hearts were transported to the laboratory on ice within 40 min of harvest. Next, two heart fragments were excised from the right atrial appendage and right atrial wall. The excised tissue was washed in 10% povidone–iodine solution (Betadine; EGIS, Warsaw, Poland) at room temperature, twice in 0.9% sodium chloride solution (NATRIUM CHLORATUM 0,9% FRESENIUS, Fresenius Kabi, Warsaw, Poland) at room temperature, and eventually in cold (kept at 4 °C) Dulbecco’s Phosphate Buffered Saline (D-PBS; SIGMA-ALDRICH, St Louis, MO, USA, Merck KGaA, Darmstadt, Germany) (137 mM NaCl, 27 mM KCl, 10 mM Na2HPO4, 2 mM KH2PO4, pH 7.4) supplemented with 2% antibiotics/antimycotics (100 U/mL penicillin G sodium, 100 μg/mL streptomycin sulfate, and 0.25 μg/mL amphotericin B) (Antibiotic Antimycotic Solution (100×); SIGMA-ALDRICH, St. Louis, MO, USA, Merck KGaA, Darmstadt, Germany). Next, tissue was subjected to two-step mincing in Petri dishes using sterile tools. Firstly, the heart fragments were placed in a droplet of cold Dulbecco’s Modified Eagle Medium (DMEM; SIGMA-ALDRICH, St. Louis, MO, USA, Merck KGaA, Darmstadt, Germany), cut into cubes with sides of ~5 mm, and transferred to 50 mL conical tubes for intensive washing with cold D-PBS. Washed fragments were then minced into ~1 mm3 fragments, also in a droplet of cold DMEM. Each tissue fragment was incubated in 10 mL of collagenase type II solution (collagenase type II; SIGMA-ALDRICH, St. Louis, MO, USA, Merck KGaA, Darmstadt, Germany) in DMEM (c = 1 mg/mL) with shaking (100 rpm) for 40 min at 37 °C (Orbital Shaker with a Heating Module and Incubator Hood, Incubator 1000/Polymax 1040 model; Heidolph Instruments GmbH & Co. KG, Schwabach, Germany). After digestion, the solution was filtered through an autoclavable stainless steel cell sieve with steel mesh and subsequently through 70 μm nylon cell strainers. The filtrate was transferred to 15 mL conical tubes and centrifuged (5 min, 200× g, room temperature) (Centrifuge 5810R, Eppendorf AG, Hamburg, Germany). After centrifugation, the supernatant was discarded and the pellet was resuspended in 5 mL of cold D-PBS. The centrifugation was repeated and the pellet resuspended in 1 mL of DMEM/F12 supplemented (cardiomyocytes culture medium) at 37 °C consisting of DMEM/Nutrient Mixture F-12 Ham (DMEM/F12; SIGMA-ALDRICH, St. Louis, MO, USA, Merck KGaA, Darmstadt, Germany), 20% Fetal Bovine Serum (FBS; SIGMA-ALDRICH, St. Louis, MO, USA, Merck KGaA, Darmstadt, Germany), 10% Horse Serum (HS; SIGMA-ALDRICH, St. Louis, MO, USA, Merck KGaA, Darmstadt, Germany) and 1% antibiotics/antimycotics (100 U/mL penicillin G sodium, 100 μg/mL streptomycin sulfate, and 0.25 μg/mL amphotericin B) (Antibiotic Antimycotic Solution (100×); SIGMA-ALDRICH, St. Louis, MO, USA, Merck KGaA, Darmstadt, Germany). Cells were then seeded in 25 mL bottles (at a final volume of 4 mL of medium).

2.3. Long-Term Primary Cell Culture

Cells were cultured at 37 °C in a humidified atmosphere of 5% CO2 in 25 mL bottles for a maximum of 30 days.
Once the cultures reached 70–80% confluency, they were passaged by washing with 3 mL of D-PBS, digested with 3 mL of 0.025% trypsin/EDTA (Trypsin-EDTA solution (0.25%), SIGMA-ALDRICH, St. Louis, MO, USA, Merck KGaA, Darmstadt, Germany) at 37 °C for 3–5 min, neutralized by the addition of 6 mL of DMEM supplemented with 10% FBS, 4 mM L-glutamine solution (L-glutamine solution (200 mM), SIGMA-ALDRICH, St. Louis, MO, USA, Merck KGaA, Darmstadt, Germany) and 1% antibiotics/antimycotics (100 U/mL penicillin G sodium, 100 μg/mL streptomycin sulfate and 0.25 μg/mL amphotericin B) (Antibiotic Antimycotic Solution (100×); SIGMA-ALDRICH, St. Louis, MO, USA, Merck KGaA, Darmstadt, Germany), centrifuged (5 min, 200× g, room temperature), and resuspended in DMEM/F12 supplemented (cardiomyocytes culture medium).
The medium was changed every 3 days and the culture was observed under an inverted microscope employing relief contrast (IX73, Olympus, Tokyo, Japan) every day. Before the harvesting of cells for further experiments, photos of the culture at three time points, 7 days, 15 days, and 30 days, were also taken to observe possible morphological changes.

2.4. Detection of Chosen Markers Using Flow Cytometry (FC)

After reaching a proper degree of confluence, the cells were digested from the culture plate, using 0.025% trypsin/EDTA solution, and subjected to FC analysis through staining. To identify characteristic markers, the following antibodies were used: Anti-CD44 FITC (Abcam, Cambridge, UK), Anti-CD90 APC, and Anti-CD105 PE (R&D systems). For the staining of cytoplasmic proteins, firstly, cells were permeabilized and fixed in BD Perm/Wash™ buffer on ice. Next, 300 μL of BD Perm/Wash™ buffer was added to 100 μL of cells in solution. The samples were subsequently centrifuged (250× g, 5 min), supernatant was discarded, and cells were incubated with antibodies for 30 min on ice. Following incubation, a wash with BD Perm/Wash™ buffer was performed. Such prepared cells were analyzed with a BD FACSAria™ cytometer and FACSDiva™ software (Becton Dickinson, Franklin Lanes, NJ, USA). Cell surface markers (CD44, CD105, and CD90) were identified, then 5 μL of antibodies were added to 100 μL of cell suspension. The mix was washed twice in PBS and centrifuged (250× g, 5 min). The pellet, remaining after supernatant removal, was resuspended in 100 μL of PBS and subjected to acquisition in a flow cytometer.

2.5. RNA Extraction and Isolation

Total RNA was extracted after 7, 15, and 30 days of the cell culture, respectively. The cells were treated as if they were passaged (see Long-term primary cell culture for details) but the pellet was resuspended in 500 µL of TRI Reagent Solution (TRI Reagent®, SIGMA-ALDRICH, St. Louis, MO, USA, Merck KGaA, Darmstadt, Germany). The aliquots were stored in −80 °C until RNA isolation.
Total RNA was isolated according to the Chomczyński and Sacchi method [35,36]. Firstly, 100 µL of chloroform (SIGMA-ALDRICH, St. Louis, MO, USA, Merck KGaA, Darmstadt, Germany) was added, the samples were mixed by inversion and shaken for 15 sec, and then incubated for 10 min at room temperature. Subsequently, the biphasic emulsion was separated by centrifugation at 12,000× g for 15 min at 4 °C. The upper, aqueous phase which contained RNA was transferred to new Eppendorf tubes. Next, 250 µL of isopropanol (SIGMA-ALDRICH, St. Louis, MO, USA, Merck KGaA, Darmstadt, Germany) was added, the samples were mixed by inversion, shaken for 15 s, and incubated for 15 min at room temperature. The samples were centrifuged at 12,000× g for 10 min at 4 °C. Then, 1 ml of 75% ethanol solution (SIGMA-ALDRICH, St. Louis, MO, USA, Merck KGaA, Darmstadt, Germany) was added to the precipitate, the samples were vortexed for 20 s, and centrifuged at 7500× g for 15 min at 4 °C. The supernatant was discarded and the samples were air-dried and dissolved in 20–50 µL (depending on pellet size) of DEPC-treated water.
The spectrophotometric analysis at λ = 260 nm (NanoDrop spectrophotometer; Thermo Fisher Scientific, Waltham, MA, USA) was performed in order to assess the concentration of the samples.

2.6. Microarray-Based Transcriptomic Profiling

Total RNA (100 ng) from each pooled sample was subjected to two rounds of sense cDNA amplification (Ambion® WT Expression Kit, Life Technologies, Carlsbad, CA, USA). The obtained cDNA was used for biotin labeling and fragmentation by Affymetrix GeneChip® WT Terminal Labeling and Hybridization (Affymetrix, Santa Clara, CA, USA). Biotin-labeled fragments of cDNA (5.5 μg) were hybridized to the Affymetrix® Porcine Gene 1.1 ST Array Strip (48 °C/20 h). Microarrays were then washed and stained according to the technical protocol using the Affymetrix GeneAtlas Fluidics Station. The array strips were scanned employing Imaging Station of the GeneAtlas System. Preliminary analysis of the scanned chips was performed using Affymetrix GeneAtlasTM Operating Software. The quality of gene expression data was confirmed according to the quality control criteria provided by the software. The obtained CEL files were imported into downstream data analysis software.

2.7. Reverse Transcription-Quantitative Polymerase Chain Reaction (RT-qPCR)

An amount of 1 µg of isolated RNA diluted in PCR-grade water (up to a final volume of 8 µL) from each sample was reverse transcribed by RT2 First Strand Kit (Qiagen®, Hilden, Germany) according to the protocol. With the exception of incubation, samples were kept on ice. First, to eliminate the genomic DNA, 2 µL of GE (5x ×gDNA Elimination Buffer) was added to 1 µg of isolated RNA. Samples were incubated at 42 °C for 5 min. Next, the reaction mix, which included 4 µL BC3 (5× RT Buffer 3), 1 µL P2 (Primer and External Control Mix), 2 µL RE3 (RT Enzyme Mix 3), and PCR-grade water up to the final volume of 10 µL, was prepared and 2 incubations were performed: at 42 °C for 15 min, and at 95 °C for 5 min. Next, samples were cooled on ice and 91 µL of H2O was added to each reaction.
The validation of microarray data was/will be performed on LightCycler® 96 Instrument (Roche Diagnostics GmbH, Mannheim, Germany). cDNA synthesized in reverse transcription served as a template. Primers were designed in Primer3Plus software (version 0.4.0; Whitehead Institute for Biomedical Research, Massachusetts Institute of Technology, Cambridge, MA, USA) [37,38,39] using sequences of chosen transcript variants of the genes available in the Ensembl database [40] (Table 1). The components of the reaction mix were as follows: QUANTUM EvaGreen® PCR Kit (5×) (Syngen Biotech, Wroclaw, Poland) which was used as the master mix, 10 µM of oligodeoxynucleotides (SIGMA-ALDRICH, St Louis, MO, USA, Merck KGaA, Darmstadt, Germany), and PCR-grade water. Next, 9 µL of the reaction mix and 1 µL of the template were added to each respective well on a 96-well plate. The plate was sealed with a sealing foil, centrifuged at 1500 rpm 400 × g for 1 min, and placed in the thermocycler. The thermal profile of the reaction is presented in Table 2.
The 2−ΔΔCT method for relative gene expression analysis was applied [41,42]. cDNA synthesized from RNA isolated after 0 days of cell culture served as a control. The relative expression of the studied genes was normalized against the expression of 2 reference genes—GAPDH and ACTB.

2.8. Bioinformatic Data Analysis and Visualization

All of the presented analyses were performed and prepared using the R programming language with the Bioconductor package [43,44]. Each CEL file was merged with a description file. In order to correct the background, normalize, and summarize results, the Robust Multiarray Averaging (RMA) algorithm was used. To determine the statistical significance of the analyzed genes, moderated t-statistics from the empirical Bayes method were computed. The obtained p-value was corrected for multiple comparisons using Benjamini and Hochberg’s procedure. The selection of differentially expressed genes (DEGs) was based on adjusted p-value ≤ 0.05 and ratio > abs(1). The DEGs list was uploaded to DAVID (Database for Annotation, Visualization, and Integrated Discovery) [45,46,47]. DAVID was used to retrieve Gene Ontology Biological Process (GO BP) terms enriched in the list of identified genes [48,49]. Significantly changed GO BP terms were defined as those enriched in at least 5 genes and for which the adjusted p-value ≤ 0.05. Plots were generated using the GOplot package [50].
RT-qPCR analyses and graphs were performed and prepared using Microsoft Excel (Microsoft Corporation). The results are presented as mean values ± standard deviation (SD) of two technical replicates of each reaction.

3. Results

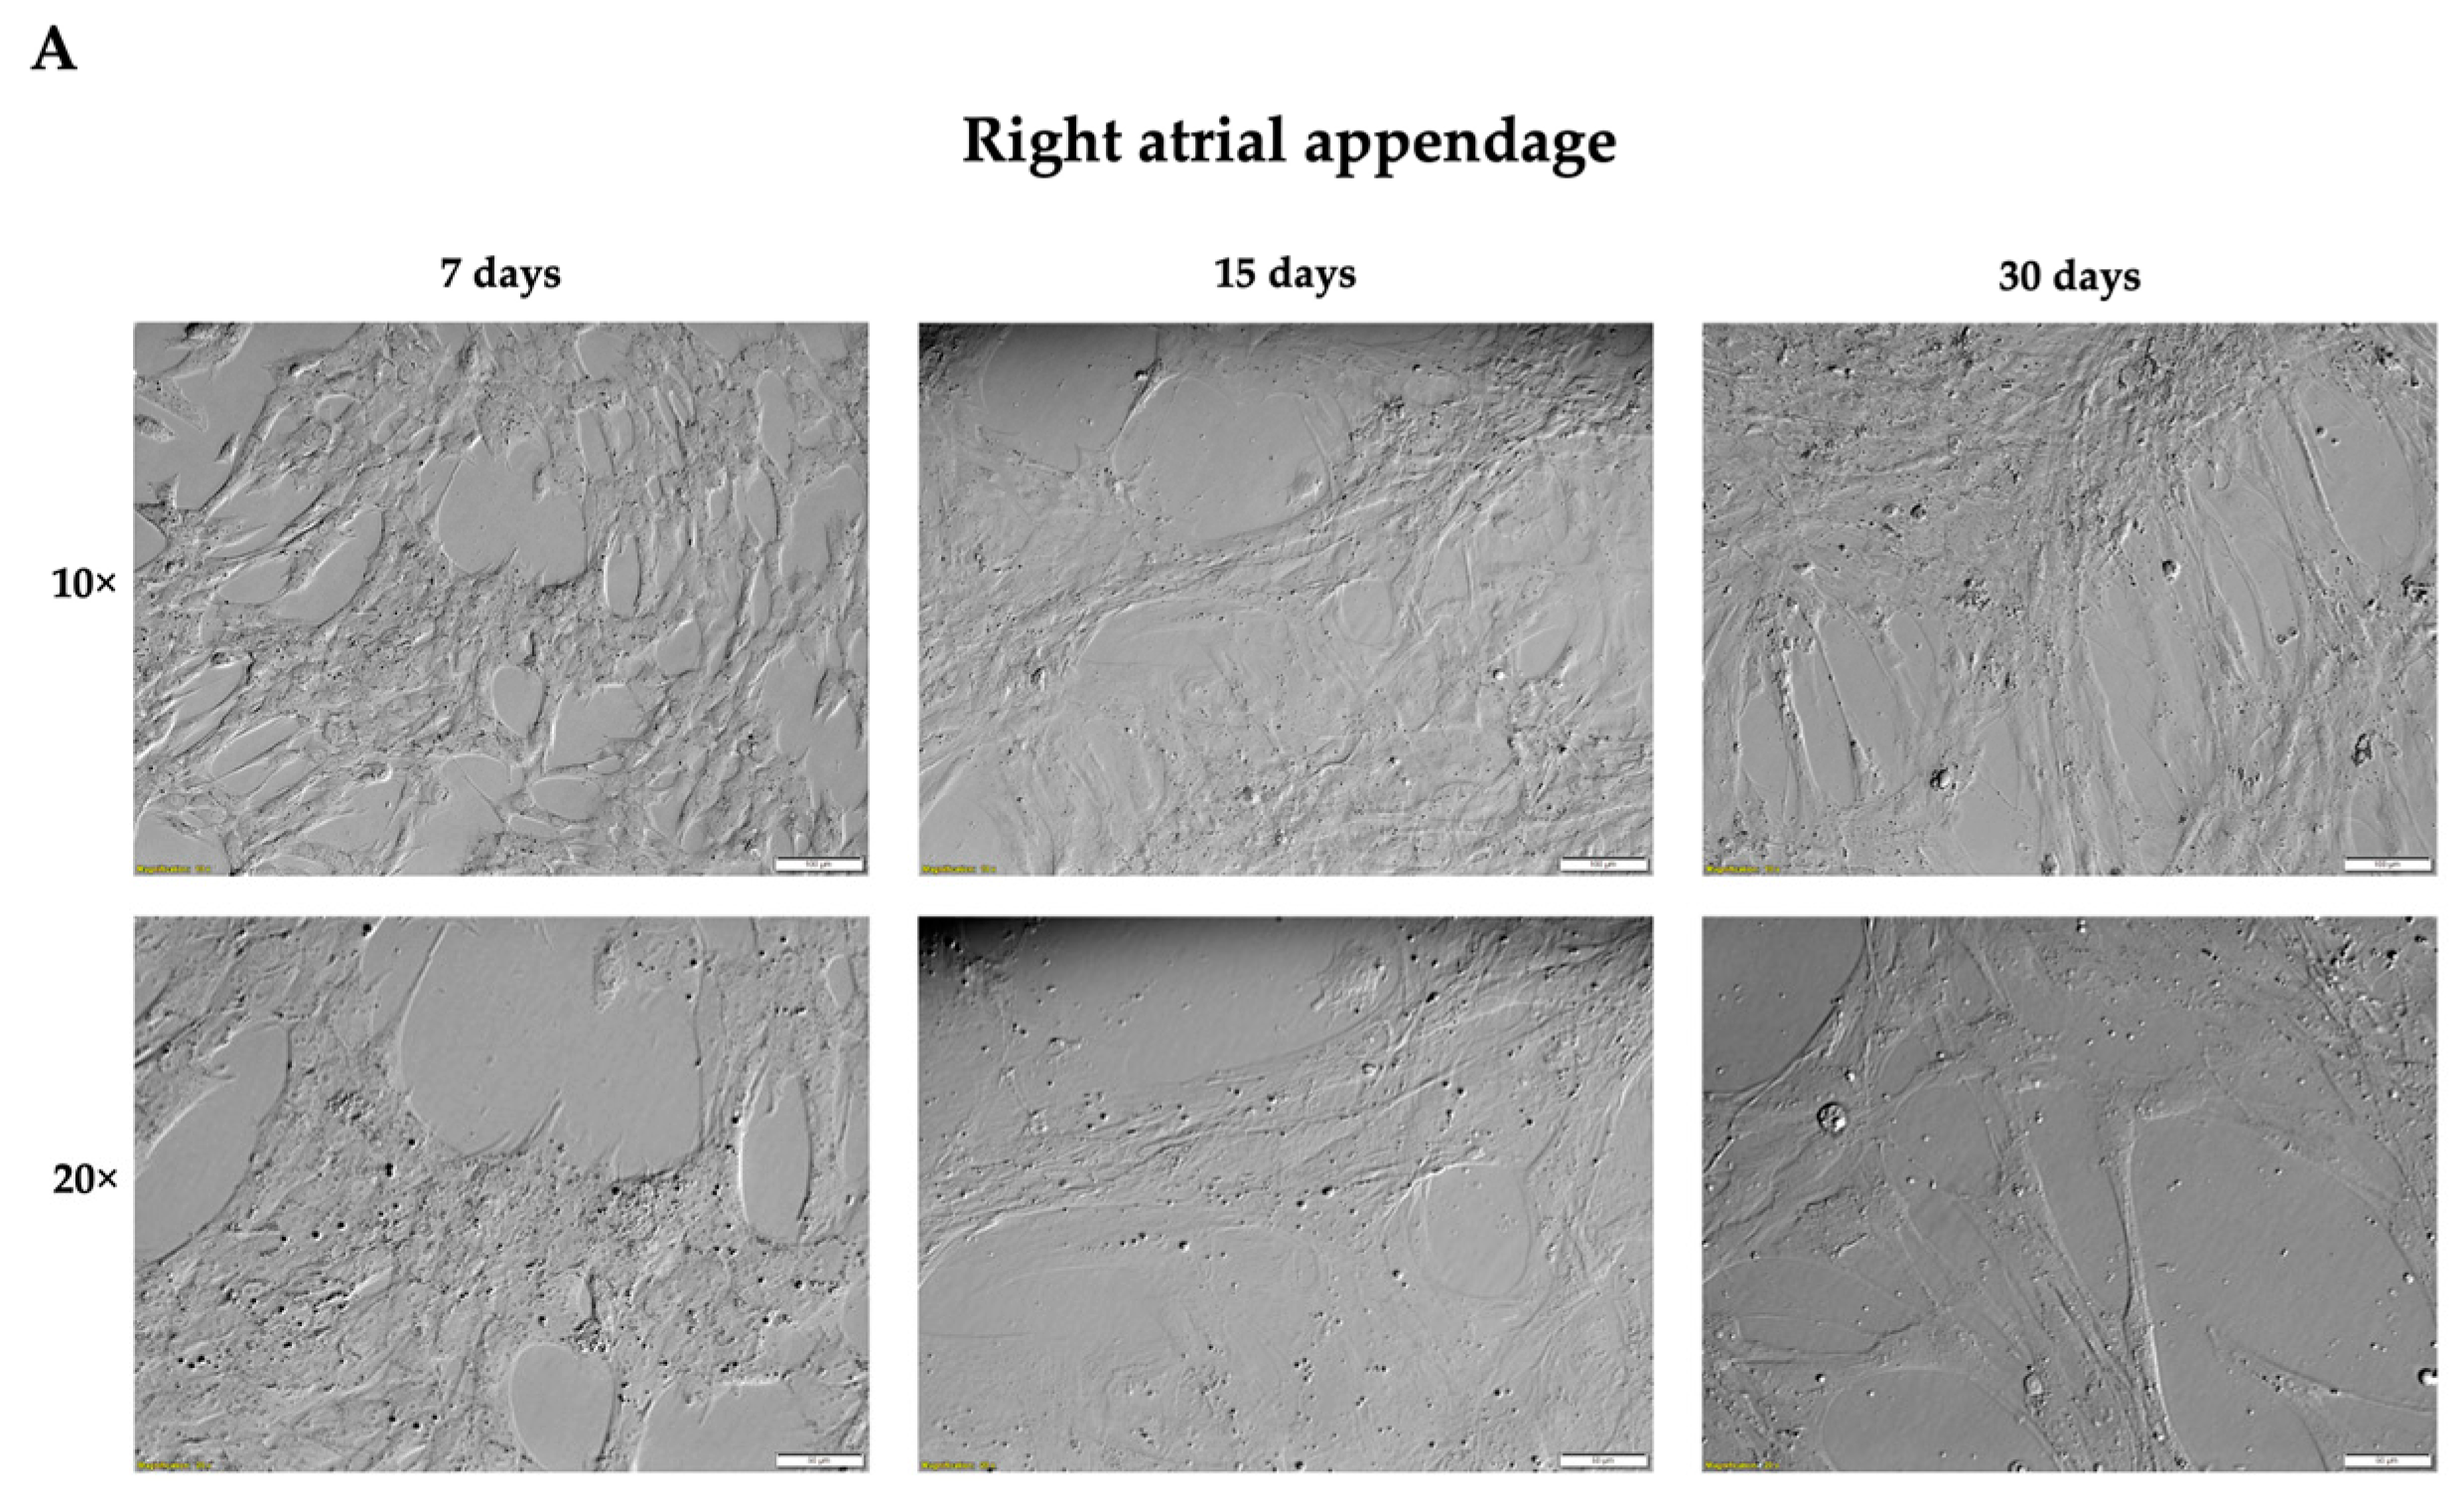
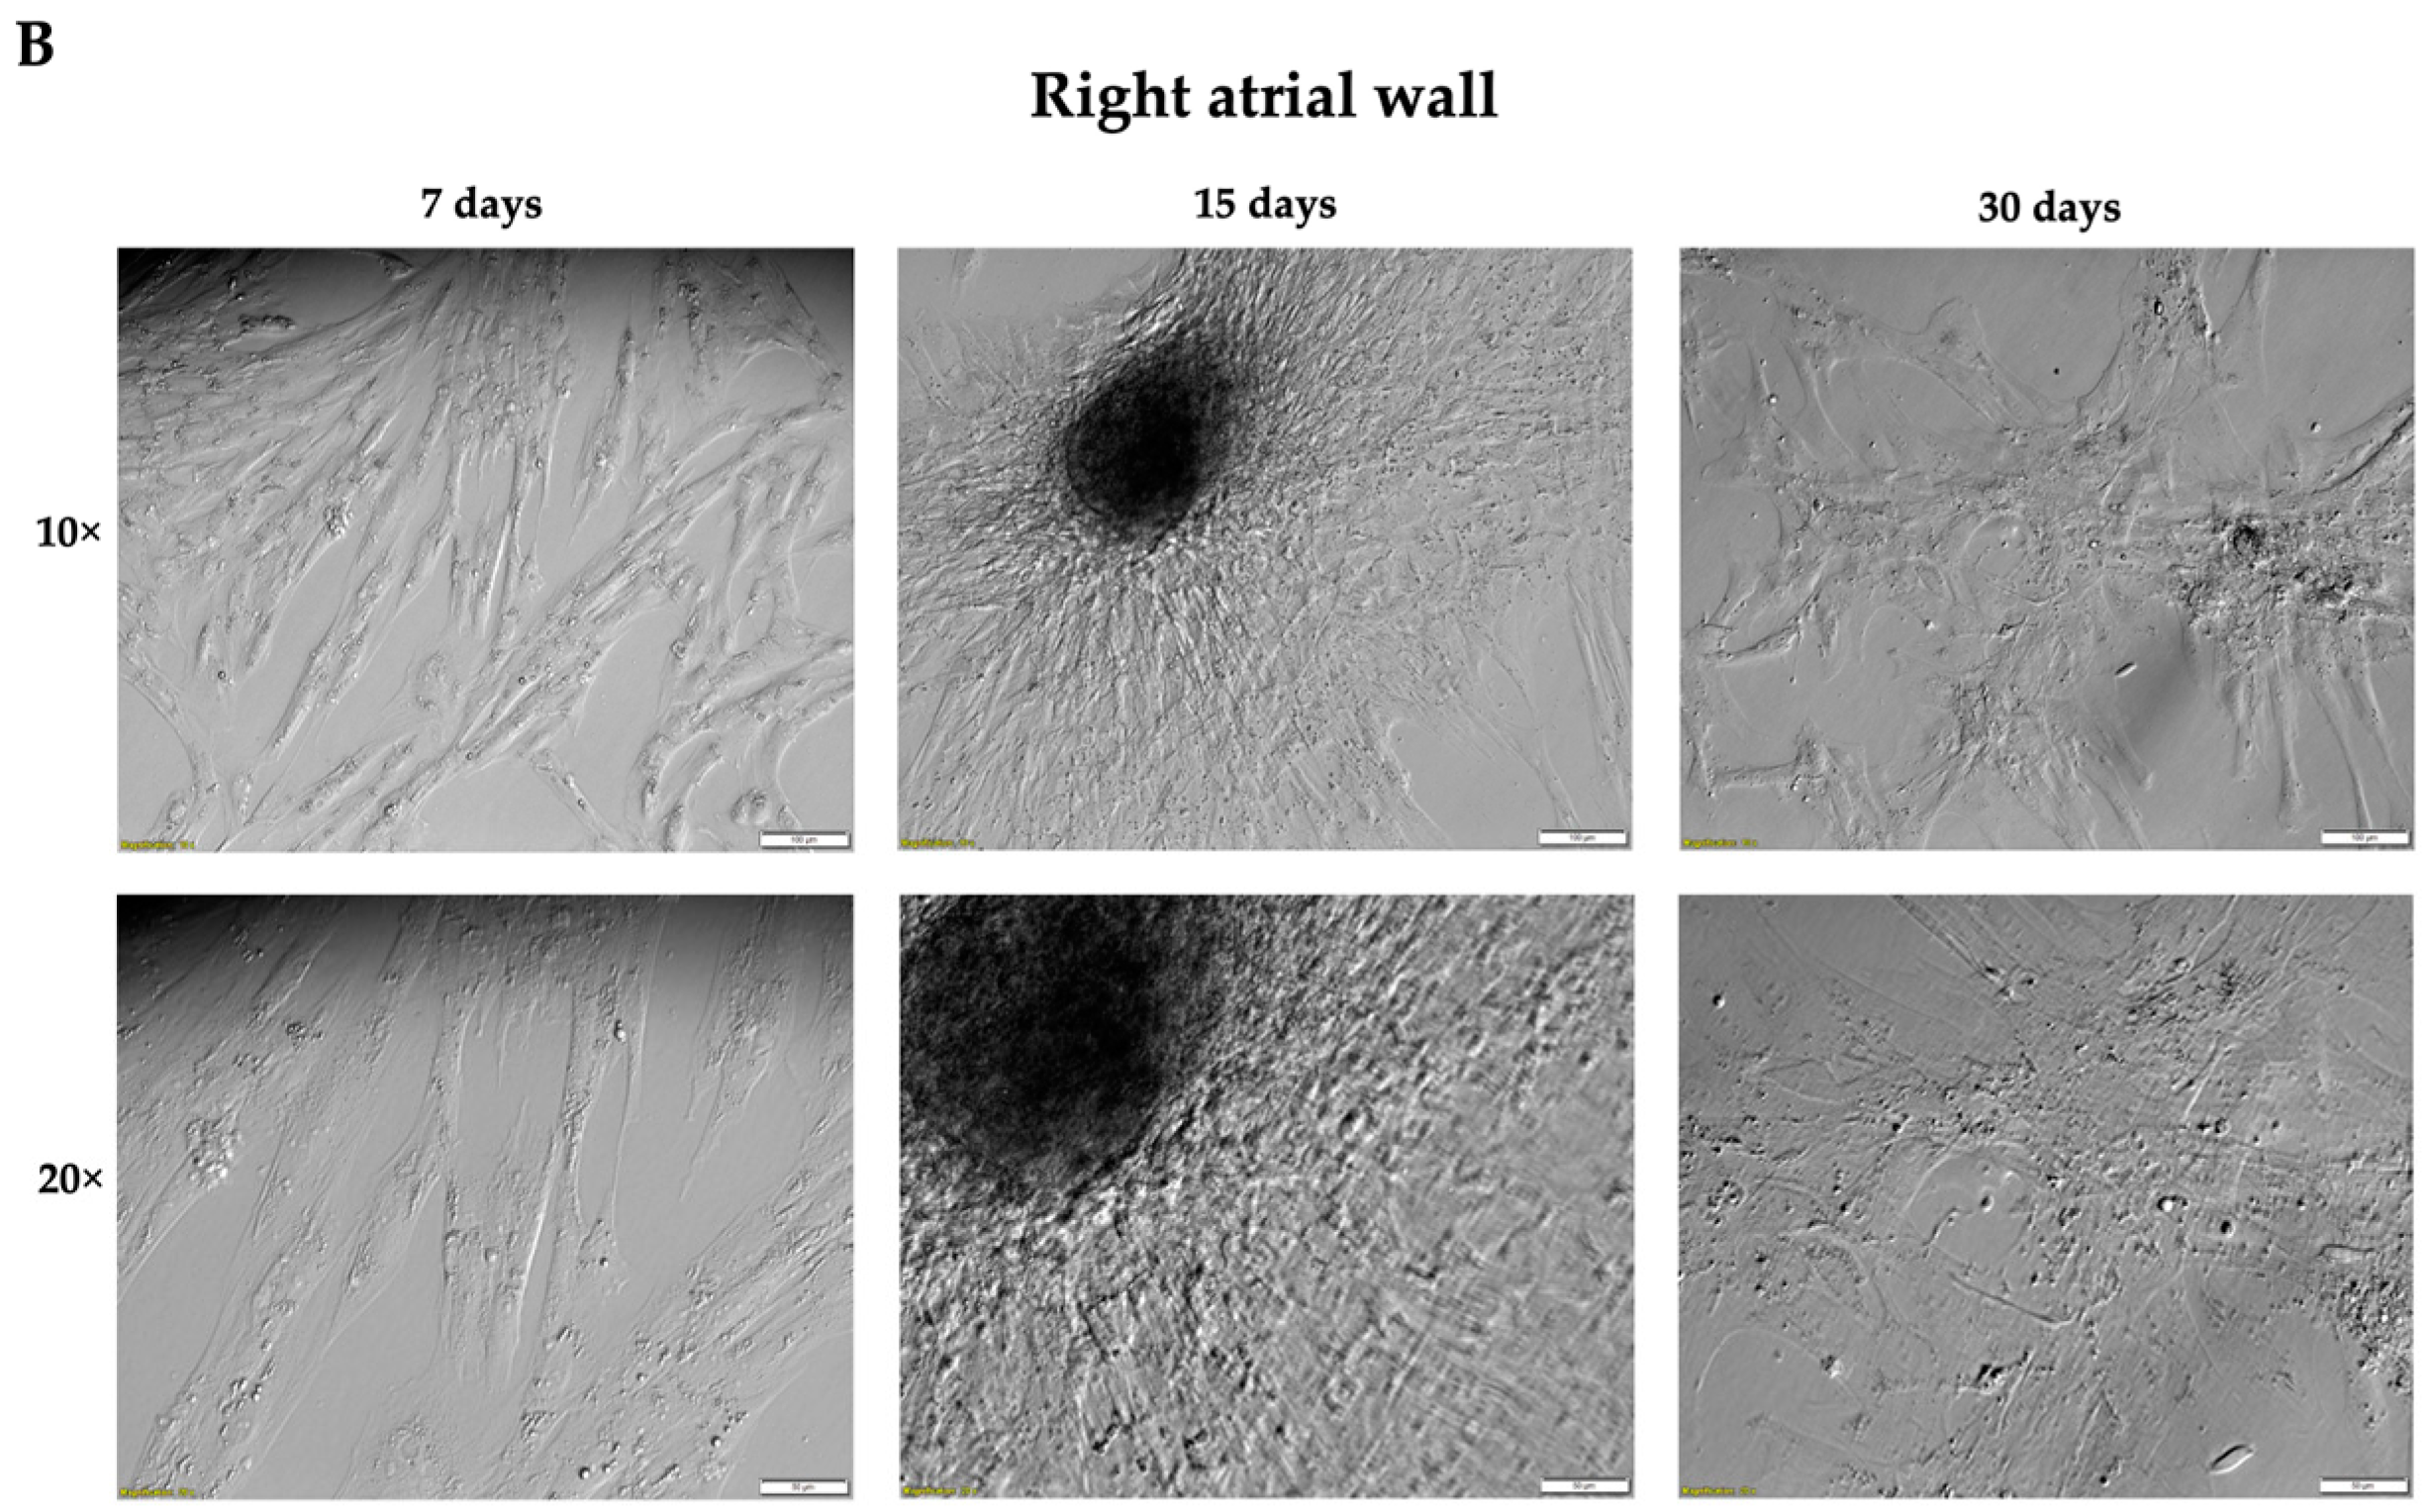
3.1. Isolation of Cells from Two Fragments of Porcine Cardiac Muscle and Long-Term In Vitro Primary Culture

Cell isolation, establishment, and maintenance of the cell culture from two fragments, namely, the right atrial appendage and right atrial wall, was successful. The cultures were observed every 3 days up to the 30th day (Figure 1). Cell morphology was similar in all cultures. Initially, cells had rather irregular shapes and gained a spindle-like appearance with the duration of the culture. Interestingly, we observed the formation of 3D clusters as captured for the culture of cells from the right atrial wall. The choice of those fragments was based on the fact that they can be easily collected during open heart surgery for coronary artery bypass grafting and, therefore, performed experiments could be later translated into humans. Two fragments—the right atrial appendage and right atrial wall—were selected for further characterization due to the ease of collection.

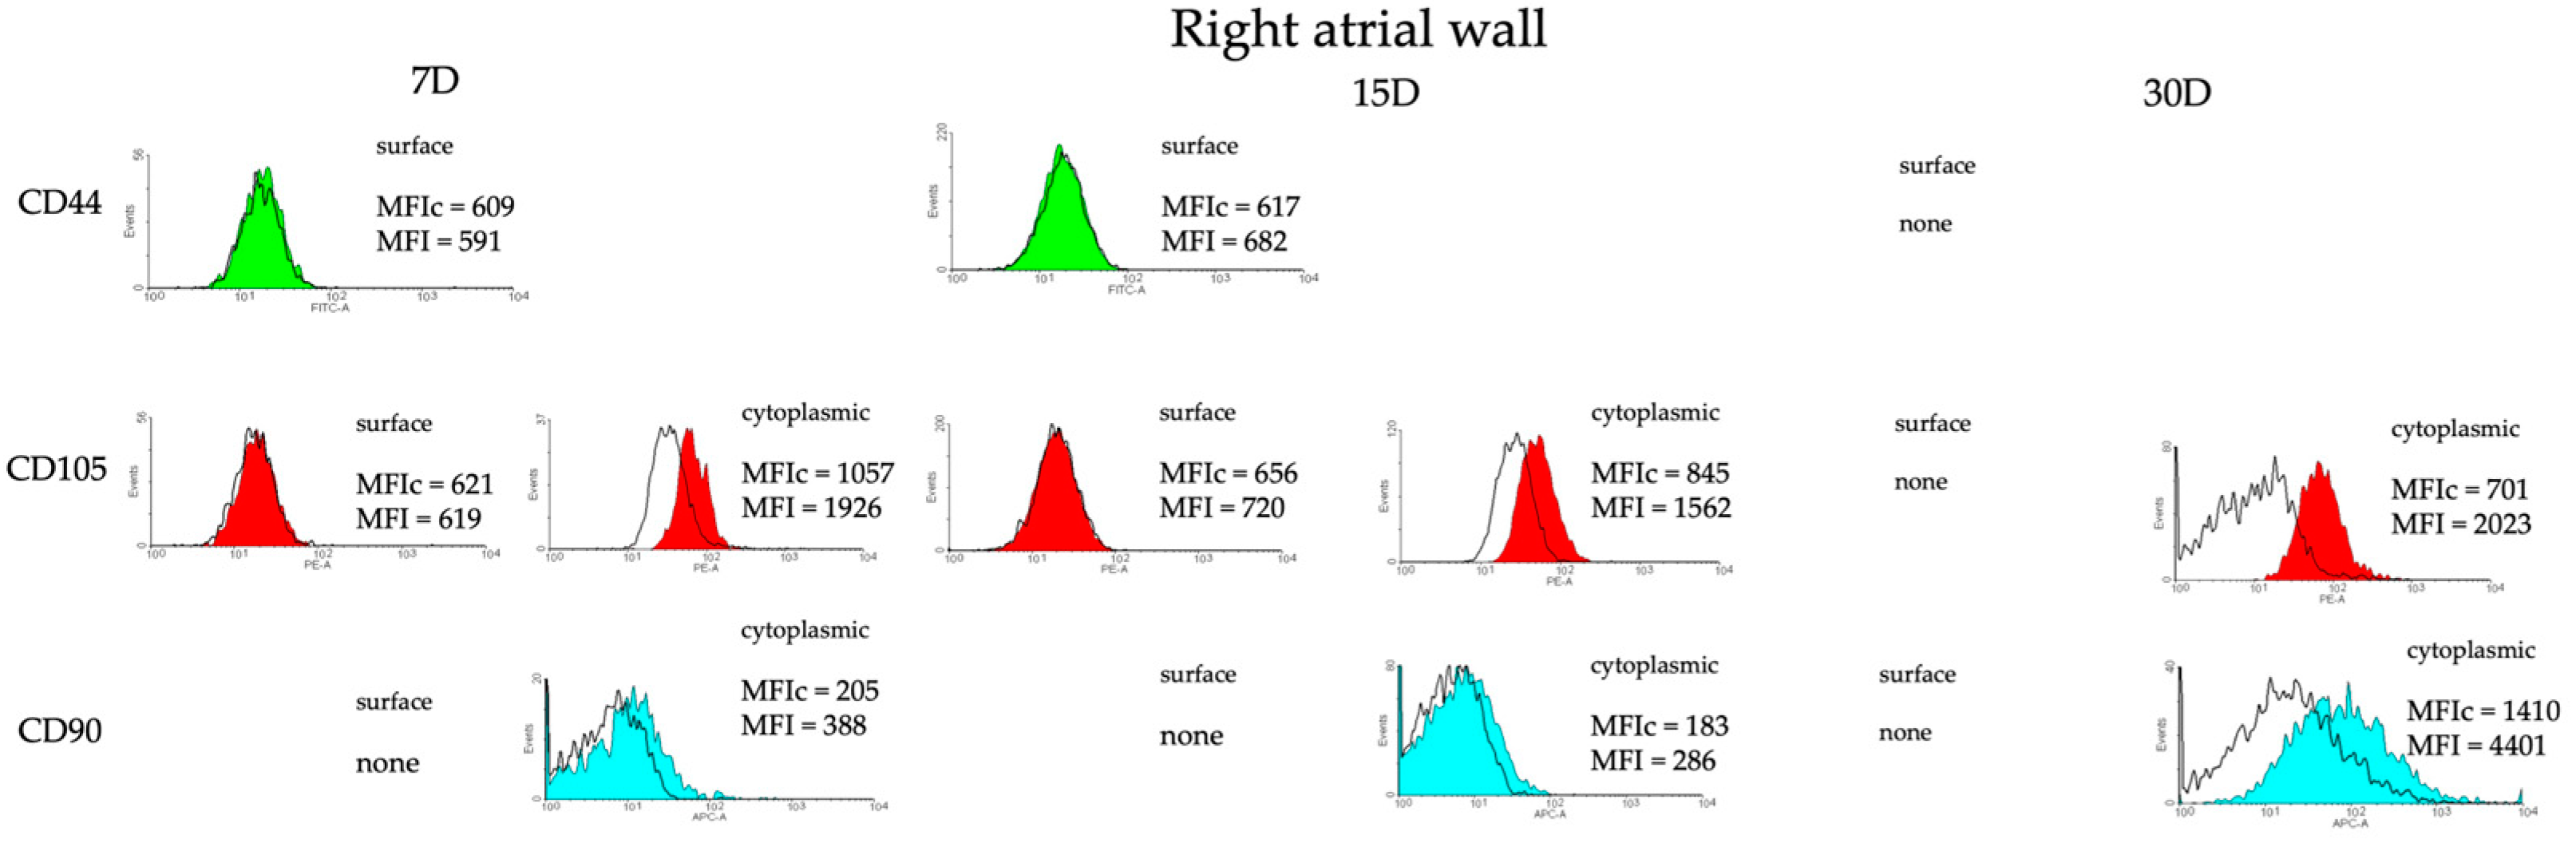
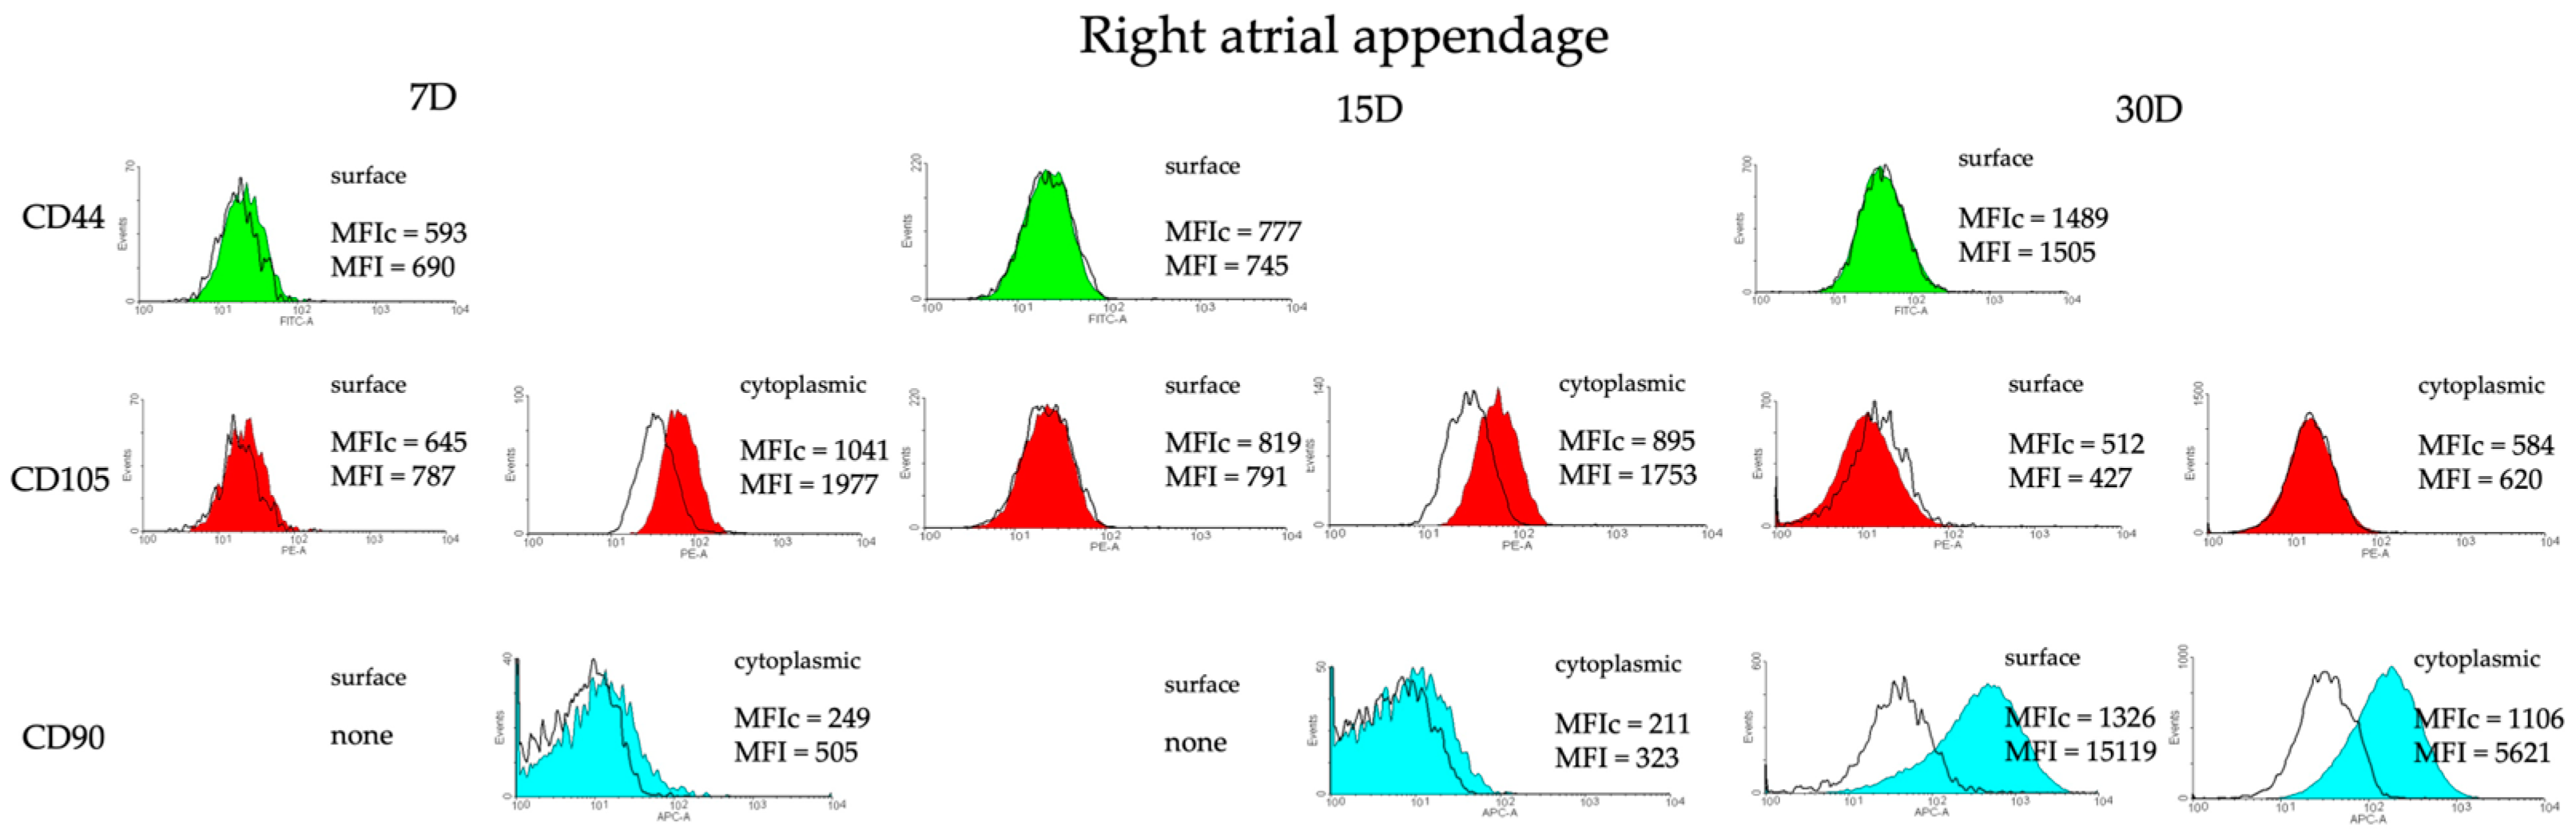
3.2. Identification of Possible Stemness Phenotype of the Cells Isolated from the Heart Tissue

In order to enable a comparison of specific regions of the heart as potential locations of concentration of cells with presumed stem cell characteristics, CD44, CD90, and CD105 were chosen and the cells were analyzed for their presence with flow cytometry in the 7th, 15th, and 30th days of primary cultures. Results from the 7th day of cell culture derived from the right atrium show some expression of cytoplasmic CD105 (MFI fold change of 1.82). A similar situation was observed for the 15th day of cell culture (MFI fold change of 1.84), while for the 30th day, expression of cytoplasmic CD105 and CD90 was detected (MFI fold change of 2.88 and 3.12, respectively) (Figure 2). As for the right atrial appendage, cytoplasmic CD105 and CD90 was expressed in cells derived from the 7th-day culture (MFI fold change 1.89 and 2.03, respectively), while cytoplasmic CD105 was also expressed in the 15th day of culture (MFI fold change 1.95) and CD90 on the surface and in the cytoplasm were detected in the cells from the 30th-day culture (MFI fold change 11.4 and 5.08, respectively) (Figure 3). It should be noted however that the number of events—i.e., the number of cells—is relatively low (frequently below 100), except for the sample derived from the right atrial appendage in the 30th day of culture.

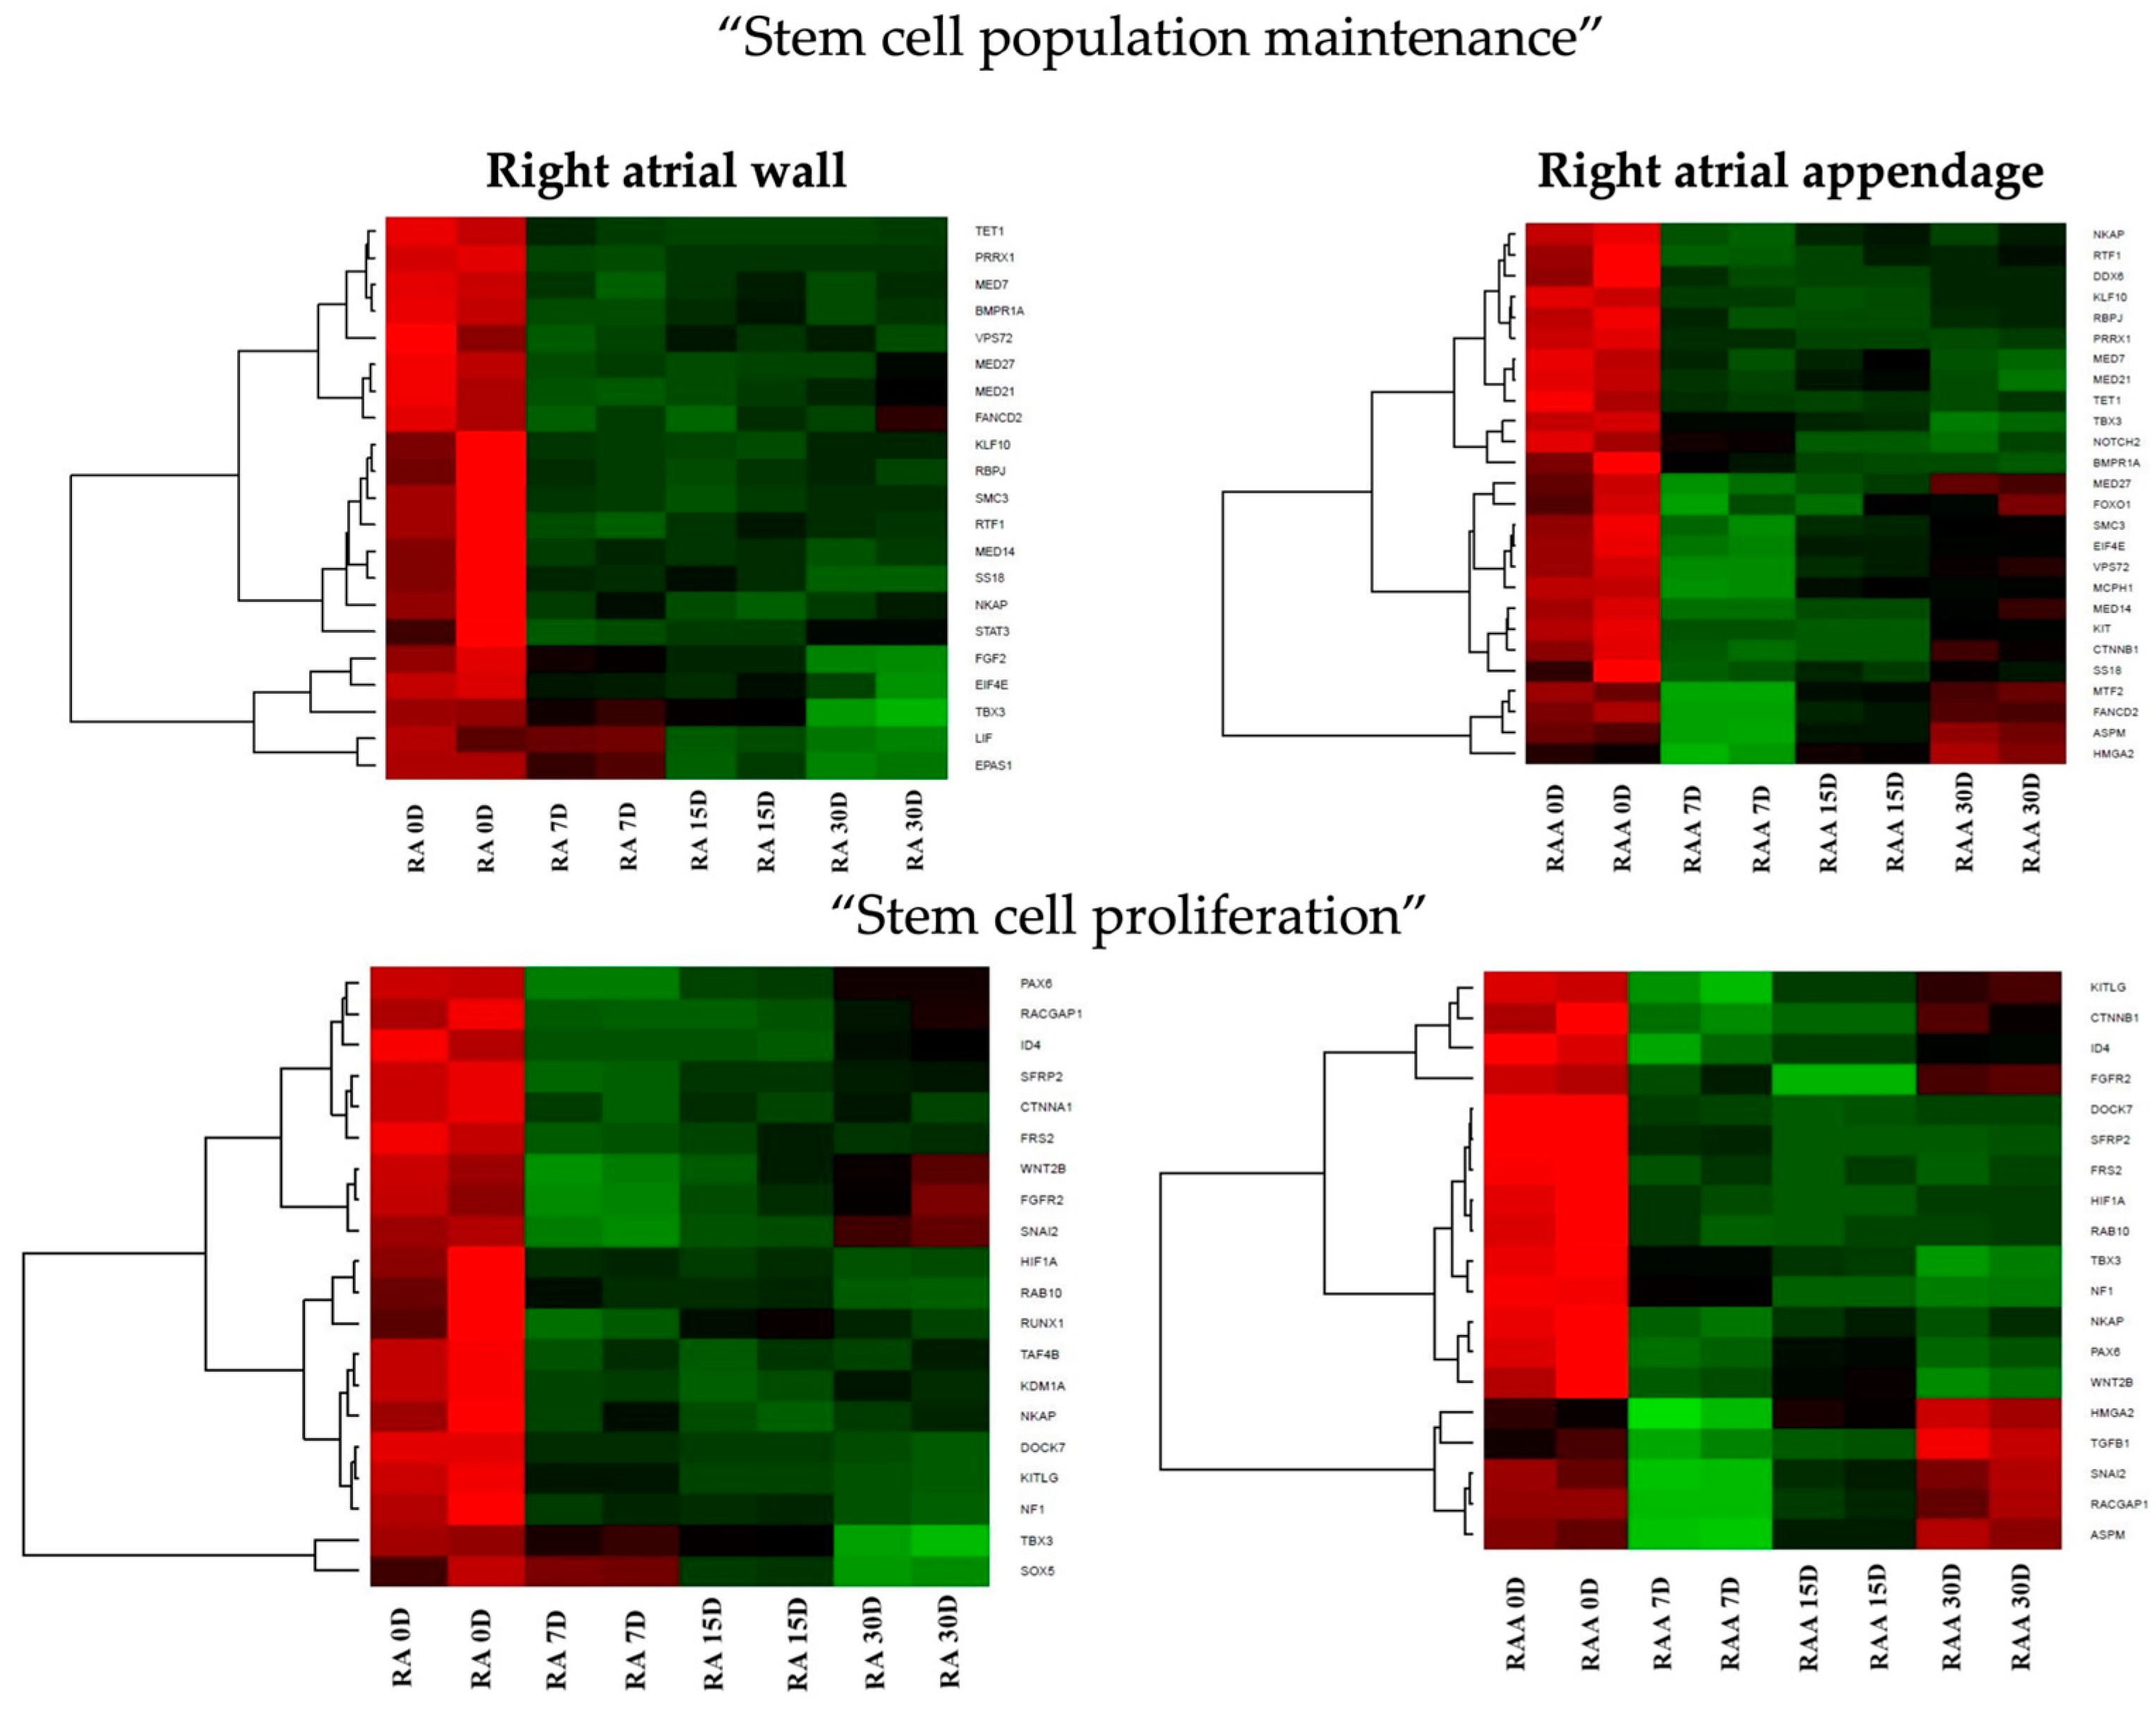
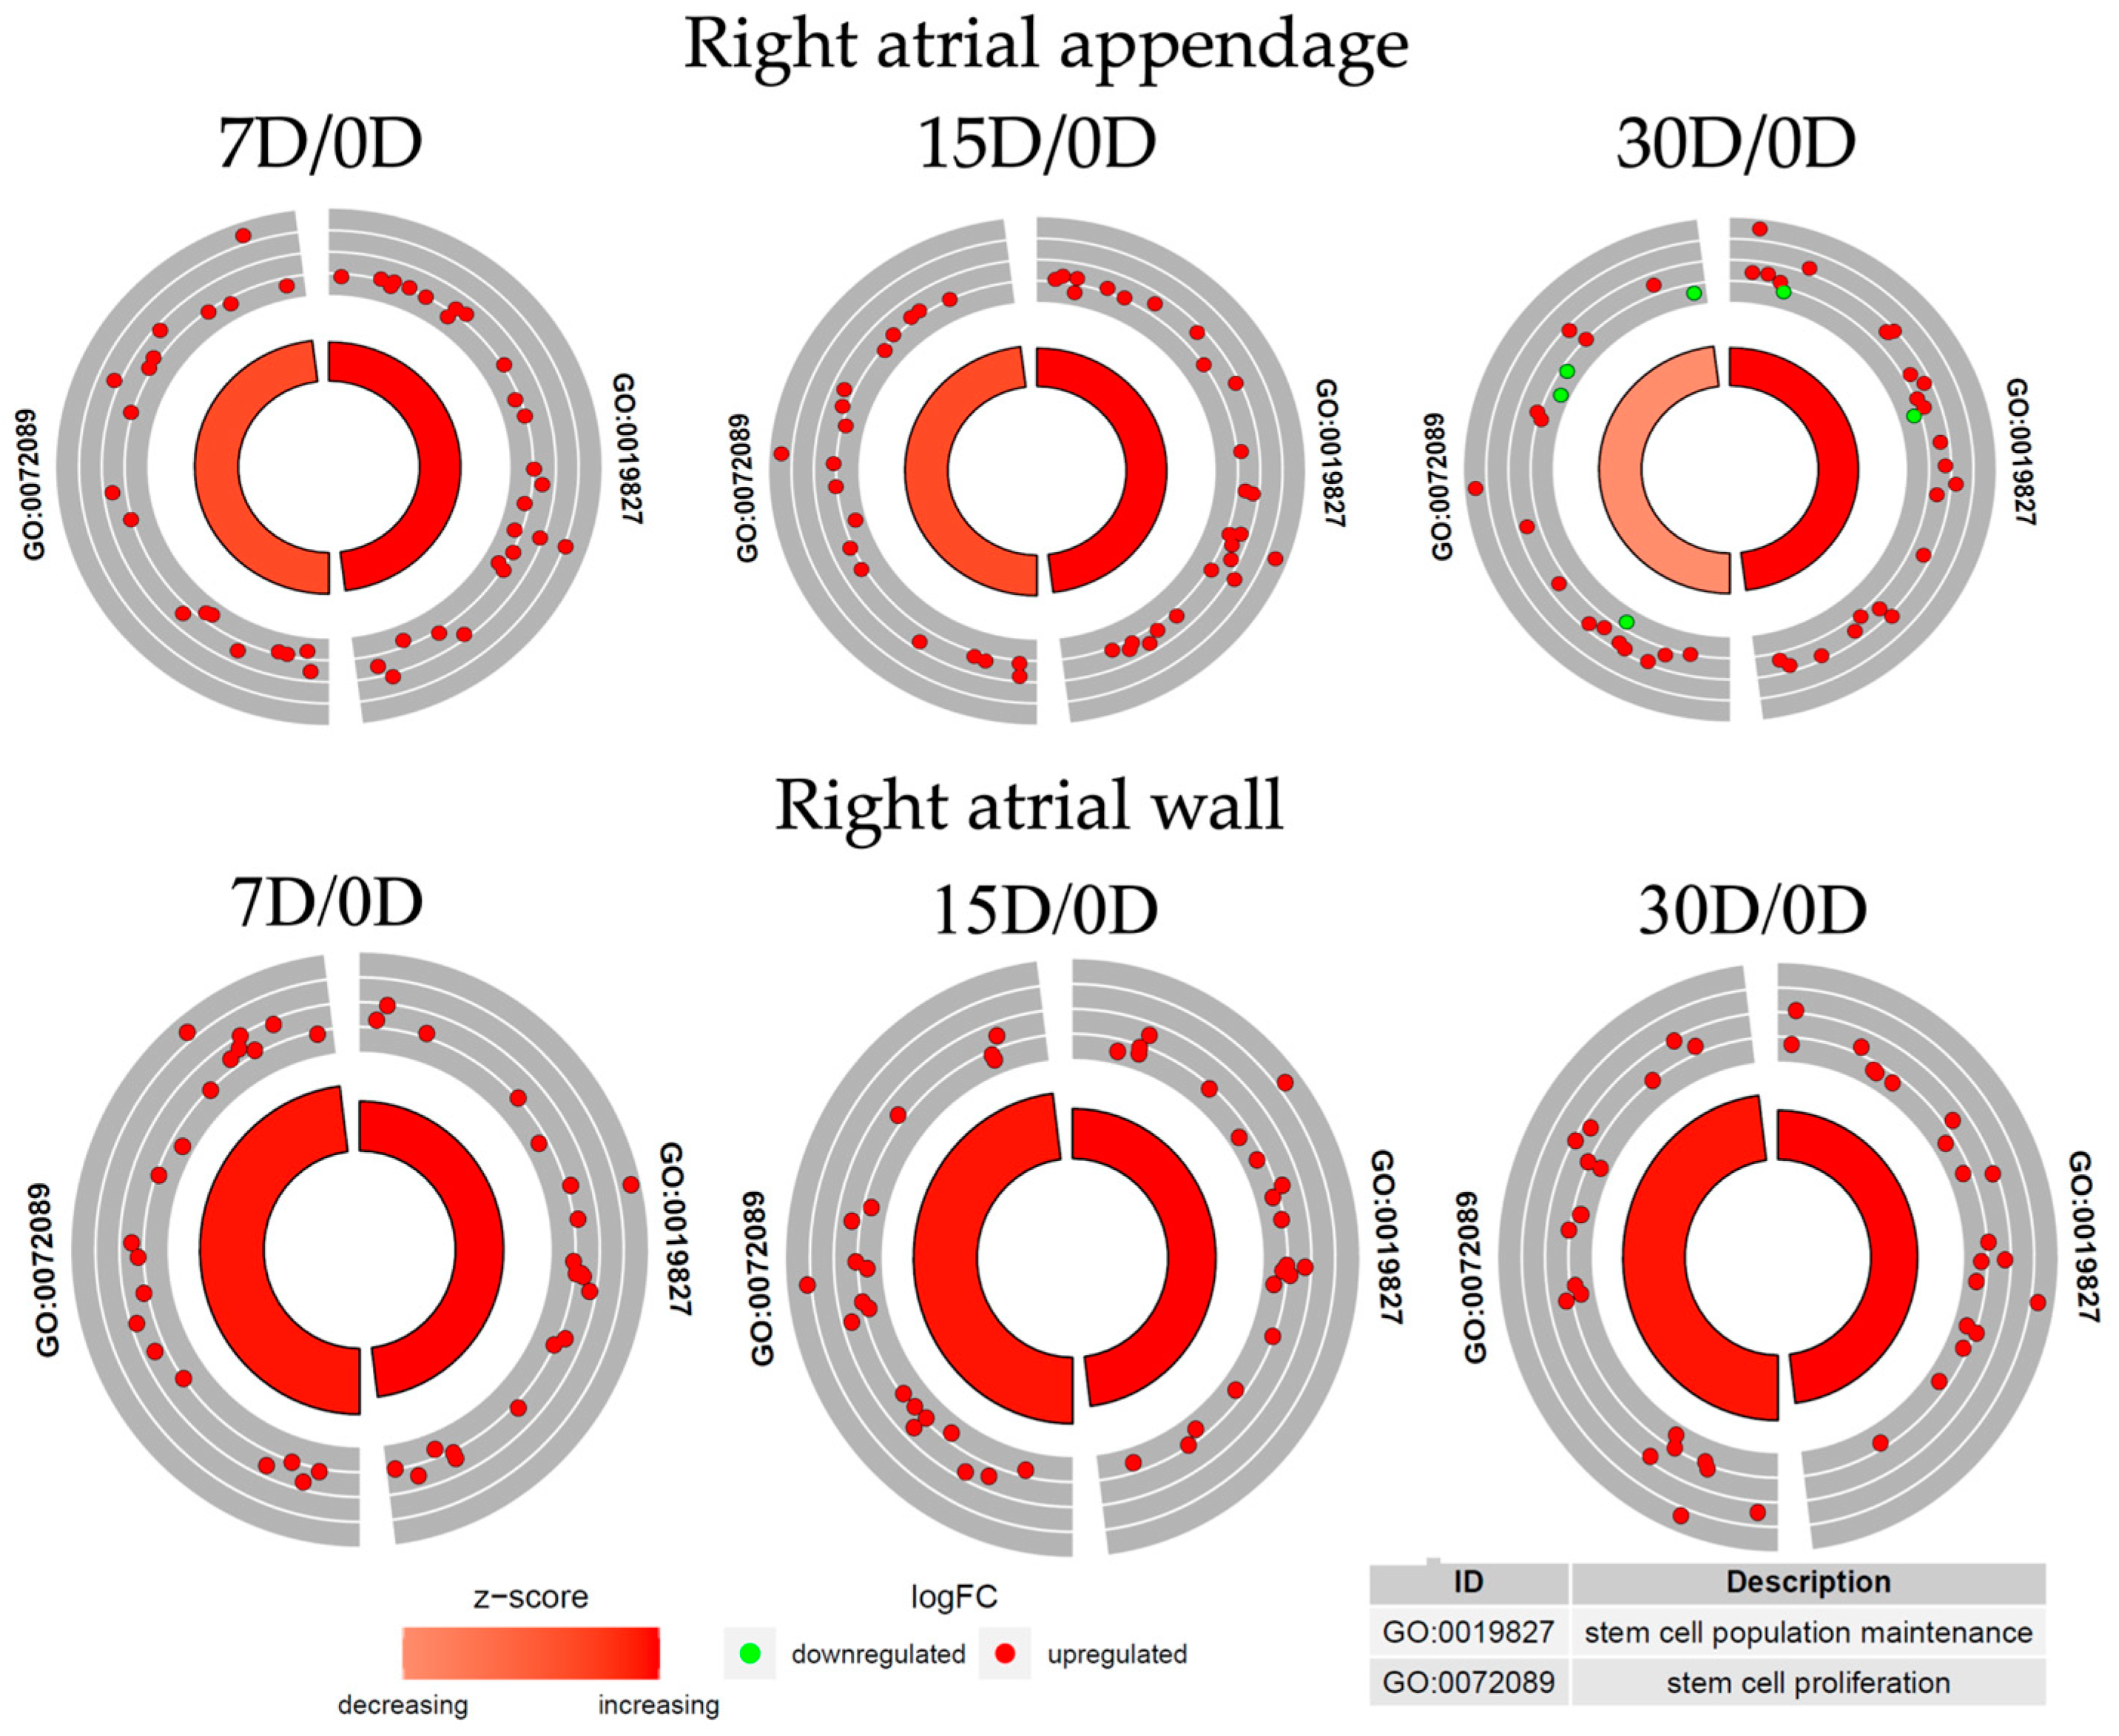
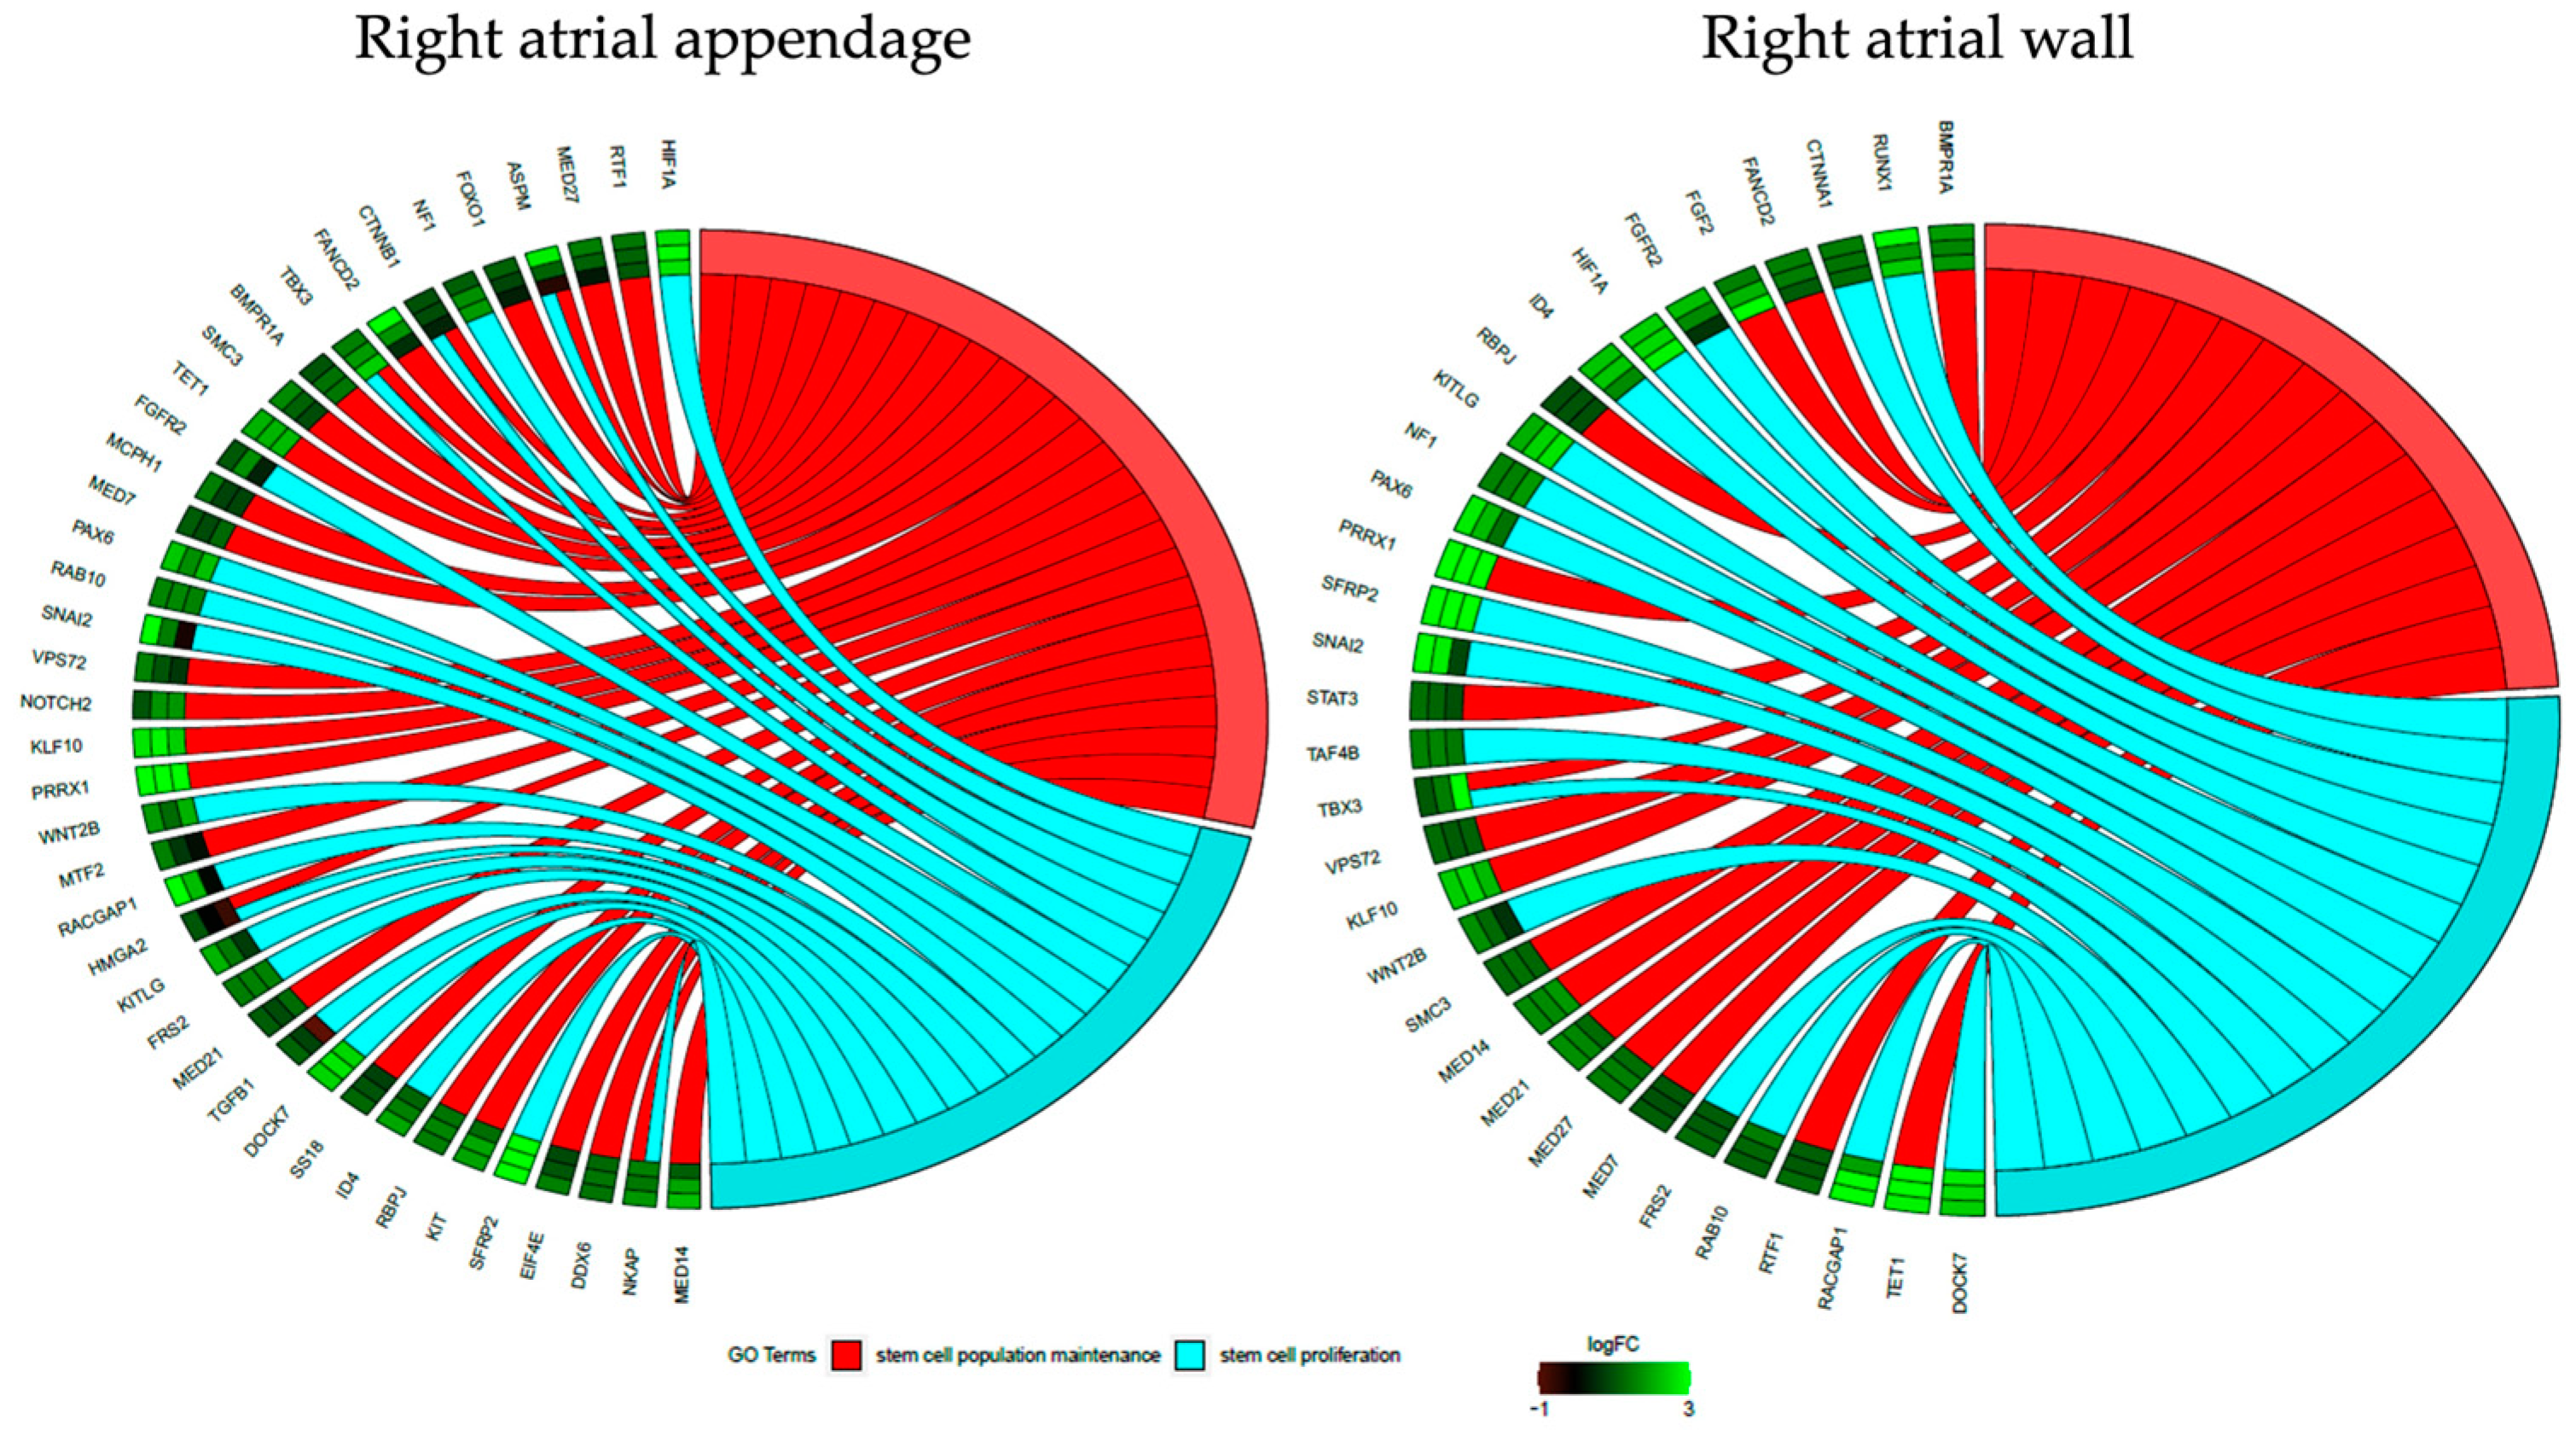
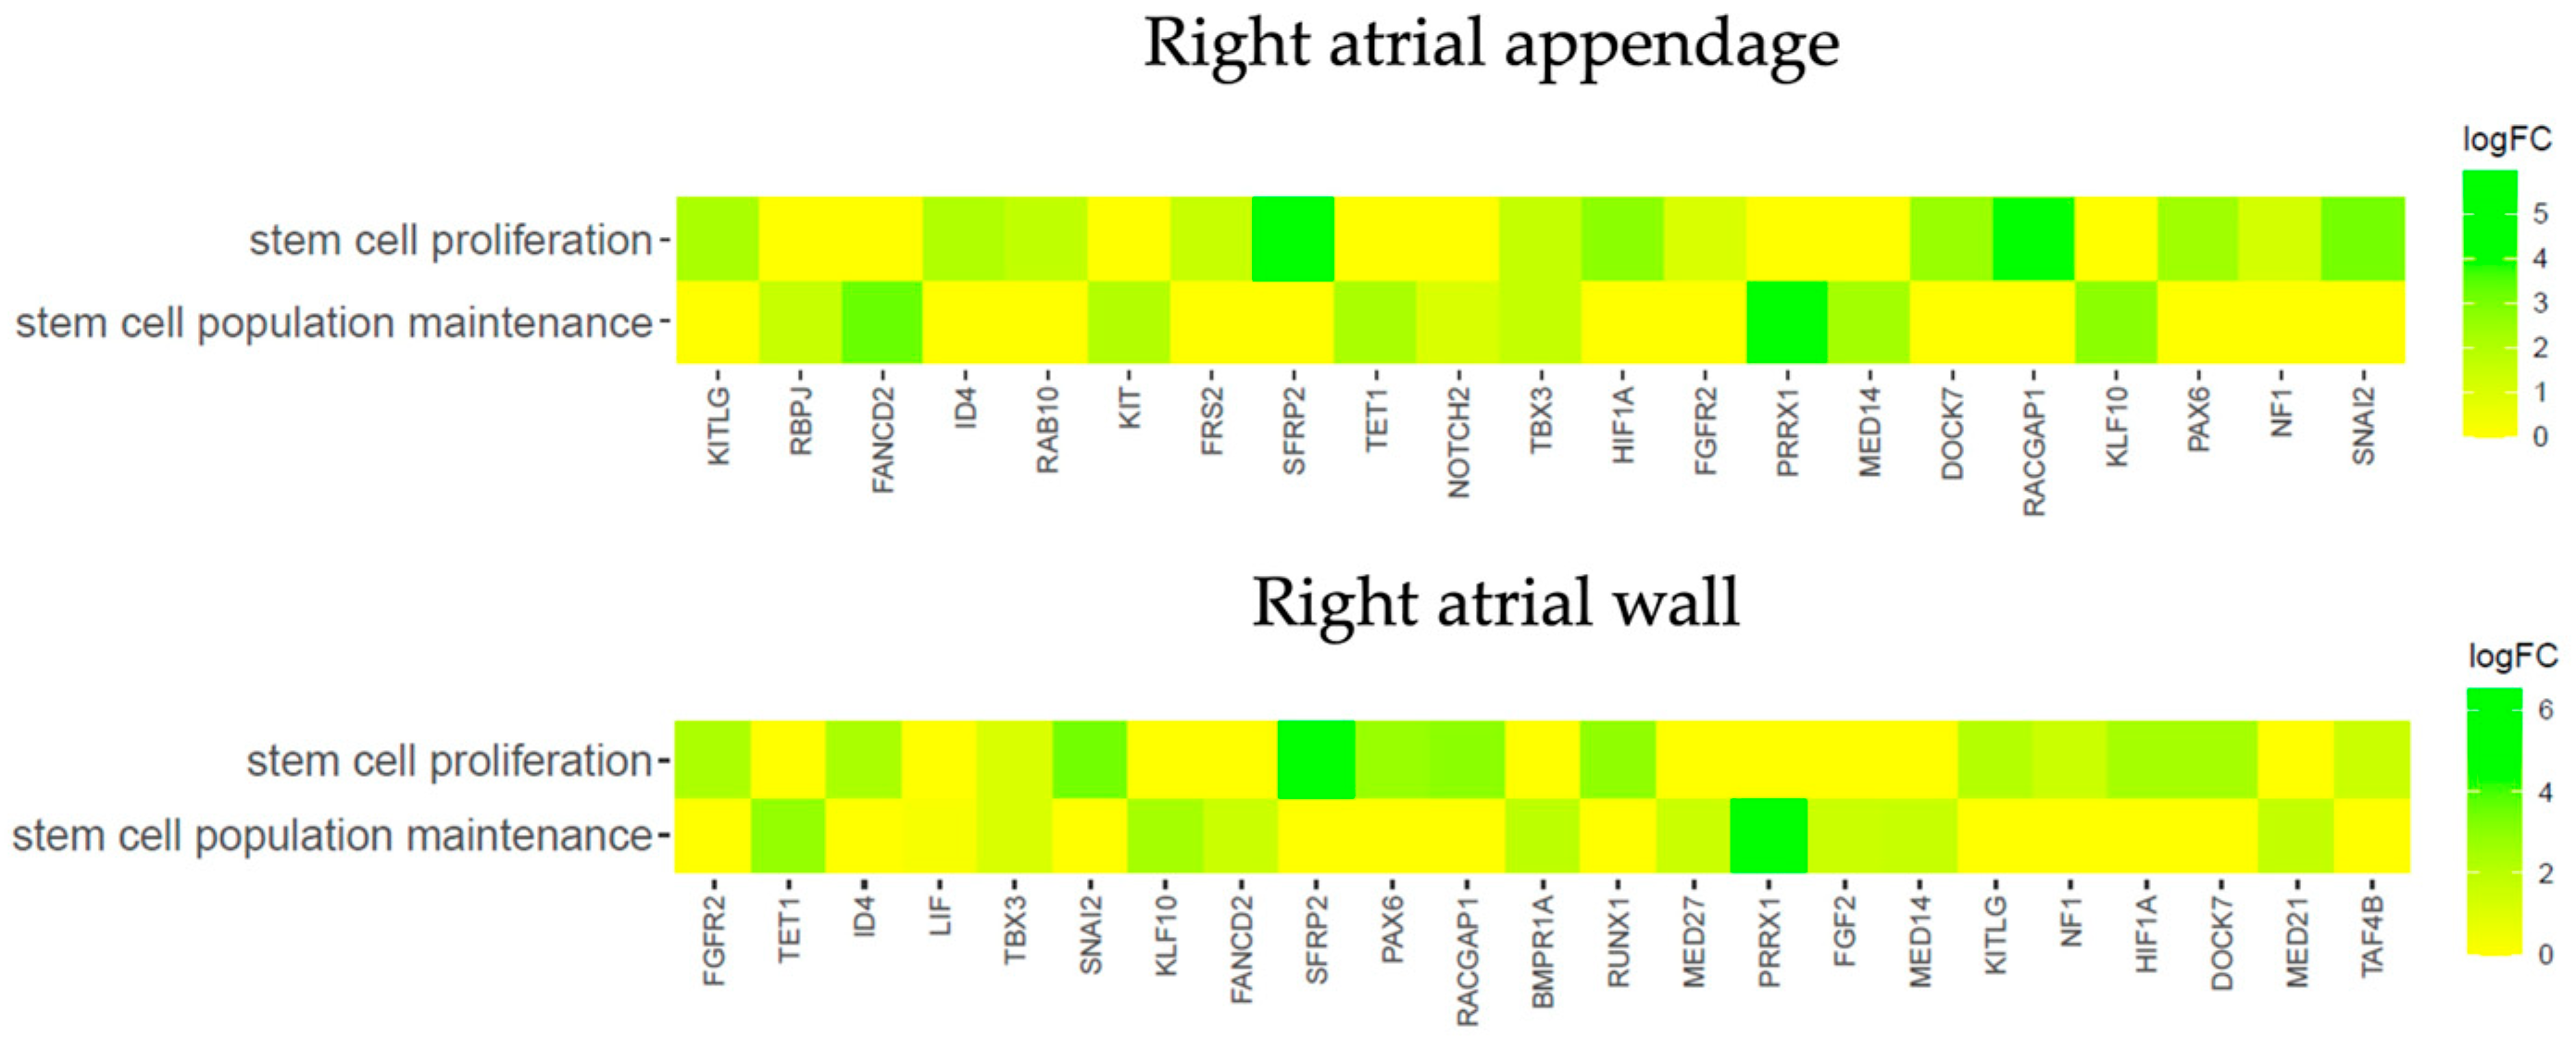
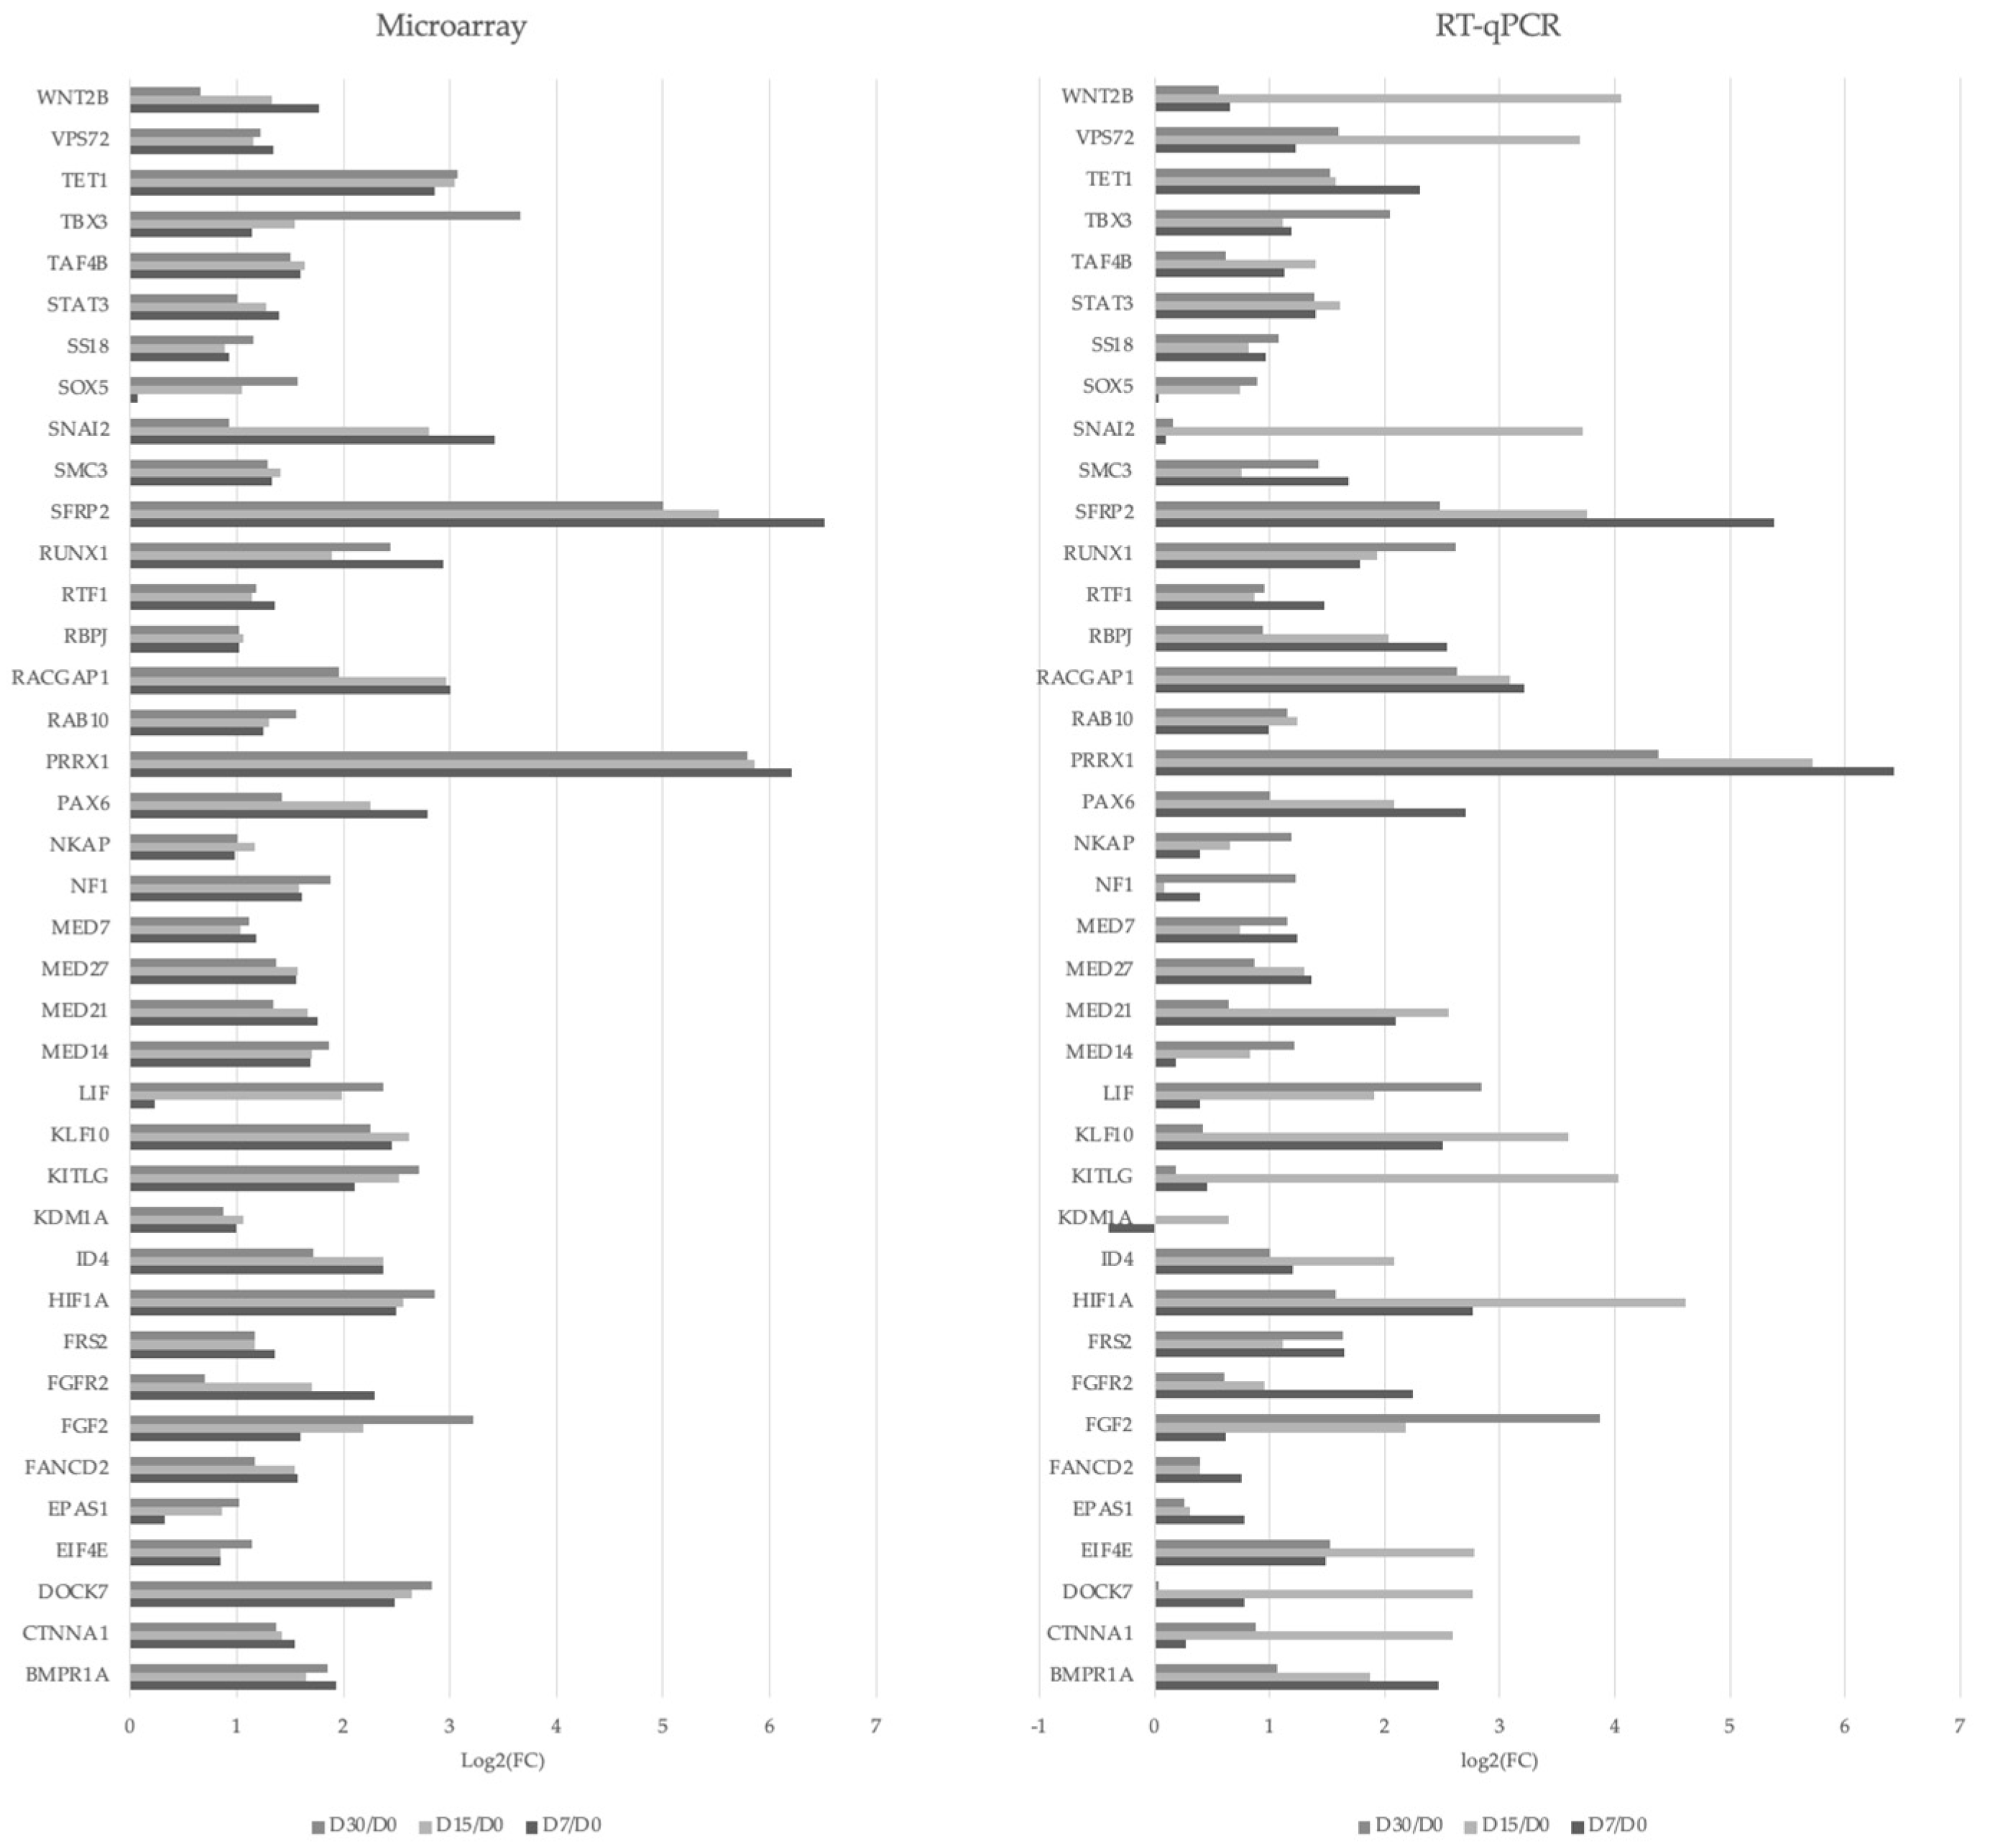
3.3. Transcriptomic Characterization of the Cardiomyocytes during Long-Term In Vitro Culture

To further understand molecular changes occurring in CMs under the influence of in vitro culture conditions, whole transcriptome profiling by Affymetrix microarray was performed. Gene expression changes between 0 and 7, 15, and 30 days of cardiomyocytes culture were studied. A total of 12,257 transcripts were examined by Affymetrix® Porcine Gene 1.1 ST Array Strip. Genes were considered as differentially expressed (differentially expressed genes, DEGs) based on 2 parameters: ratio > abs |2| and adjusted p-value ≤ 0.05.
Followingly, biologically relevant processes in which the DEGs could be implicated were explored. For this purpose, DAVID (Database for Annotation, Visualization, and Integrated Discovery) software was utilized and enabled the extraction of gene ontology biological process terms (GO BP), which contain DEGs. DAVID searching was performed for up- and downregulated gene sets separately, and only gene sets in which the adjusted p-value ≤ 0.05 were selected. Two gene ontology biological process terms (GO BP) were chosen in this work: “stem cell population maintenance” and “stem cell proliferation”. The chosen sets were then subjected to a hierarchical clusterization procedure and presented as heatmaps (Figure 4). The symbols, fold changes in expression, and adjusted p-values for the 10 most deregulated genes at each time point in culture are shown in Tables S1 and S2. The majority of genes which belong to the GO term “stem cell maintenance” in samples derived from right atrial wall tissue are upregulated in comparison to day 0, and this tendency remains until day 30. FGF2, EIF4E, TBX3, LIF, and EPAS1 showed a gradual increase in expression levels with the duration of culture, with the highest expression in day 30 among all the genes in this GO term. There are, however, several genes in which expression in comparison to day 0 seems unchanged or was downregulated. Similar tendencies can be observed for genes in the group “stem cell proliferation”. In this case, TBX3 and SOX5 were the most upregulated, while downregulation was noted for PAX6, WNT2B, FGFR2, and SNAI2 (Figure 4). In the samples from the right atrial appendage, approximately half of the genes enriched in the “stem cell maintenance” GO term showed a slight increase in expression in relation to day 0, while the other half experienced initial upregulation, especially in day 7, slight in day 15, and subsequent downregulation in day 30. Similar observations can be made when analyzing the genes for the “stem cell proliferation” GO term in the same samples (Figure 4).
To check if the genes belong to more than one ontological group and to characterize these groups in a more detailed manner, the results of gene annotation enrichment analysis were visualized with the circle plot (GOCircle) (Figure 5), the relationships between genes and terms were plotted with the GOChord plotting function (Figure 6), and a heatmap of genes and terms was generated with the GOHeat function (Figure 7).
The circle plot reveals that the genes in the samples from the right atrial appendage show a general tendency of expression level upregulation. There are more genes enriched for the “stem cell proliferation” GO term than for “stem cell population maintenance”. As for the samples from the right atrial appendage, although the tendency of gene expression upregulation can also be observed, some genes in the sample from the 30th day of cell culture show decreased expression levels. Furthermore, the “stem cell proliferation” GO BP term is slightly decreased (based on the z-score).
Moving to Figure 6, for samples from the right atrial wall, only 1 of the displayed genes was present in both GO terms, and all of the genes showed greater or lesser upregulation in day 7 compared to day 0. In the samples derived from the right atrial appendage, 5 of the presented genes were enriched in both GO terms, and only 2 of the displayed genes showed a tendency to decrease.
The heatmap presented in Figure 7 shows common differentially expressed genes for both GO terms in the 7th vs. 0 day of the culture. Genes SFRP2 and PRRX1 are the most highly expressed for both the right atrial wall and right atrial appendage.
The RT-qPCR (reverse transcription-quantitative polymerase chain reaction) technique was also utilized to validate the chosen results of high-throughput transcriptome profiling. The results are demonstrated as a bar chart (Figure 8).

4. Discussion

Despite recent progress in cardiology having caused a significant decrease in CVD (cardiovascular disease)-related deaths, the number of heart failure cases has increased [1]. There has been an increasing interest in regenerative medicine that would allow finding a cellular replacement for the cardiomyocytes lost during the disease [13].
In recent years, the dogma stating that the adult heart lacks any regenerative potential has been questioned by the evidence that cardiac muscle cells possess some small self-renewal capacity over the mammalian lifetime. Heart precursor cells have been described in adult hearts of several mammalian species. However, there is no unified methodology for the isolation of cardiac stem cells [14,28,51,52,53].
Primary cultures of cells from two of the porcine heart tissue fragments have been successfully established and, as evident by results from a previous study of the group, namely, the presence of α-MHC and α-actinin as well as GATA-4 in the cells analyzed by flow cytometry, CM from the right atrial wall and right atrial appendage have been isolated [14,54]. In the last two decades, there has been a significant increase in the number of types of cardiac progenitor cells reported. These cells have been identified and isolated based on the expression of a whole variety of markers on their surface which overlap to some extent and are highly mixed. Here, CD90, CD44, CD105, and GATA-4 have been proposed as putative stemness markers [54] and a small population of cardiac muscle-derived cells expressing these markers has been identified.
CD90 (THY1) has been described as a marker of a variety of stem cells, including mesenchymal stem cells [55,56,57]. As for other cells, CD90 was described as characteristic for endothelial cells, smooth muscle cells, or fibroblasts, among others [58,59,60]. According to some reports, CD90 can be present on cardiac progenitors [28,61,62,63,64], while others have shown that only CD90neg CSCs can have any therapeutic role and that they generally outperform unsorted cells [65]. The flow cytometry results have revealed the presence of this marker in the cytoplasm of cells derived from the right atrial wall in the 30th day of the IVC and derived from the right atrial appendage in the 7th day of the IVC. Cells derived from the right atrial appendage in the 30th day seem to point out the presence of this marker on their cell surface. As the populations of cardiac progenitor cells are usually small, this may suggest the presence of other cell types typical for the heart. It should be noted however that the number of events in case of these samples is relatively small and thus the interpretation cannot be held fully reliable—additional experiments involving more viable cells would be required.
CD44 is a surface glycoprotein which participates in the transduction of signals important for cell migration, cell adhesion, and cell–cell interaction, and it plays a role in sensing cues from the microenvironment [66]. It interacts with several components of the extracellular matrix, including hyaluronan [67]. Similarly, to CD90, it is a canonical marker of mesenchymal stem cells [55]. There were several reports of cardiac progenitor cells which are CD44pos, including epicardium-derived progenitor cells and cardiac colony-forming unit fibroblasts [28,68]. According to FC, very few cells have shown CD44 expression. Conversely, it is widely known that cardiac stem cells constitute a small population of cells in the adult mammalian heart [13].
Endoglin, or CD105, is a type I transmembrane protein which serves as a BMP9/10 co-receptor and TGF-β signaling auxiliary receptor that is expressed primarily on vascular endothelial cells [69,70]. It is important for maintaining the proper structure of vasculature and is indispensable for heart development [71]. Furthermore, together with CD90 and CD44, CD105 is a marker of mesenchymal stem cells [55]. There are numerous reports of CD105 presence on cardiac progenitor cells, especially for cardiosphere-derived cells, Sca-1pos CPC, and EDPCs [25,28,61,63,64]. According to our FC analysis, there is a small population of cells expressing this marker.
GATA-4 is a transcription factor which regulates early cardiac development and specification [72,73,74]. Together with ISL1, MEF2C, and NKX2-5, it is often used for the identification of cardiac phenotype in heart precursor cells [11]. GATA-4 is expressed in CPCs including Sca1pos cells, Isl-1pos cells, and cardiac fibroblasts [31,51,52,75]. Apart from its role in cardiac morphogenesis at the embryonic stage, GATA-4 is crucial for cardiac hypertrophy by regulating transcriptional activation of cardiac-specific genes [74,76]. BRD4-GATA4 have also been recently revealed to regulate adult cardiac metabolism [77].
FC analysis has revealed that GATA-4 was expressed in all samples except the 30D right atrial appendage (MFI fold change in the range 2–4 compared to the control) [54]. It is therefore suggested that GATA-4 could regulate the functioning of adult cardiomyocytes in culture, including their growth.
Despite several phenotypic variations of cardiac progenitor cells having been identified, the precise role and molecular identity of CPCs in the adult heart remains enigmatic. A small pool of precursor cells is also a significant challenge and underlines the importance of the research that would allow molecular profiling of CPCs. There are studies which report characterization of the mammalian cardiac progenitor cells’ transcriptome but the majority utilize different techniques than ours and aim at studying changes occurring at the embryonic stage [78,79,80]. Nevertheless, molecular changes at the transcriptomic and epigenomic level in putative adult murine heart-derived CPCs have been described [81,82]. Interestingly, in 2013, Dey et al. reported microarray-based transcriptional profiling of five cardiac (ckit+, Sca1+, and side population) and bone marrow-derived (ckit+ and mesenchymal stem cell) progenitors from adult mice and found out that cardiac ckit+ cells are the most distinct and seem to be the most primitive cell population [83]. However, the hypothesis that cells present in the bone marrow transdifferentiate to cardiomyocytes was disproven and the studies of Anversa et al., who first identified c-kit+ cells, are now not held reliable [84,85]. Additionally, genetic lineage tracing studies have revealed that Sca1+ cells give rise rather to endothelial cells and not myocytes [86]. The porcine cardiac transcriptome has been recently reported as updated [87] and there are several studies in which transcriptomic profiling of porcine hearts was utilized to address different questions [88,89,90]. It appears that the current study is the first analysis that aims at transcriptome profiling of porcine cardiomyocytes during long-term in vitro culture.
SFRP2 was one of the most highly upregulated genes in cells derived from both heart fragments through the duration of the culture. For the right atrial wall, a certain decrease in expression levels with IVC time was observed; nevertheless, it remained as the 1st- or 2nd-most highly upregulated gene, while for the right atrial appendage, the expression increased in the 15th day compared to the 7th day and remained high until the end.
SFRP2, a secreted frizzled-related protein 2, is a member of the sFRP family which regulates both canonical and noncanonical Wnt signaling, influencing many fundamental processes such as proliferation, apoptosis, and differentiation [91]. β-catenin-dependent and β-catenin-independent Wnt signaling pathways are indispensable for heart development [92]. As for cardiomyocytes differentiation, research has shown that after the initial activation of β-catenin, required for mesoderm specification to cardiac progenitors, it is the inhibition of this molecule which allows for differentiation of these progenitors to cardiomyocytes [93]. It has also shown to be important in cardiac fibrosis as well as angiogenesis, thereby contributing to the restoration of the cardiac function after injury [94,95]. Studies on adult murine cardiac progenitor cells (Sca1+) have shown that Sfrp2 may promote the differentiation of such cells into CMs after injury [96]. It has also been shown that myocardial injury may induce c-kit+ cells to exhibit cardiomyocyte-specific gene expression and Sfrp2 enhances this effect [97], and, lastly, the same group has claimed that Sfrp2 induces cardiomyocyte differentiation in c-kit+ cells in vivo in health and MI, as revealed by genetic lineage tracing and functional assessment of the developed CMs [98].
Although, at the early stages of cardiomyogenesis, SFRP2 prevents the generation of cardiac progenitors from mesoderm cells and promotes the maintenance of cells in the undifferentiated state [99], as mentioned above, there is evidence in adult cardiac progenitors that it facilitates differentiation to cardiomyocytes and, furthermore, it promotes cardiac fibrosis. As the cells in this study were isolated from adult porcine hearts, it is suspected that upregulation of this molecule had rather a negative effect on maintaining the stemness phenotype/undifferentiated state.
PRRX1 (Paired Related Homeobox 1) was also one of the two most highly upregulated genes in samples from both heart fragments. For the right atrial wall, a situation was similar to SFRP2—compared to the 7th day, a certain decrease in PRRX1 levels in the 15th and 30th days of the culture was observed, and the ratios were generally similar to SFRP2. For the right atrial appendage, the expression increased in the 15th day compared to the 7th day, but only slightly, and, overall, the expression levels were 2–3 times lower than for SFRP2.
PRRX1 belongs to the paired family of homeobox-containing transcription factor proteins and has nuclear localization.
There are several studies characterizing the expression of PRRX1 in the developing hearts of vertebrates, mainly in mesenchymal tissues, including in the heart and arteries [100,101,102].
Prrx1 is involved in scar-free heart regeneration. A 2021 study by de Bakker et al. demonstrated that loss of Prrx1b in cryo-injured zebrafish hearts led to excessive fibrosis and a reduction of cardiomyocyte proliferation at the injury border zone. Single cell sequencing and lineage tracing have shown that Prrx1 is expressed mostly in epicardial and epicardial-derived cells and that there is an excess of fibroblasts producing TGF-β ligand and ECM in injured prrx1b−/− hearts. Mechanistically, Prrx1 promotes Ngr1 and, consequently, cardiomyocytes’ proliferation not only in in vivo zebrafish model but, noticeably, in human fetal epicardial-derived cells [103].
As a transcription factor, PRRX1 can physically interact and regulate expression of genes crucial for proper cardiac function. In a study investigating AF pathogenesis, Guo et al. showed that SHOX2 and ISL1,2 were genes that played roles in cardiac pacing and conducting systems that undergo such regulation [104].
In another 2021 study, it was revealed that deletion of a noncoding variant genomic region at 1q24 associated with downregulation of Prrx1 leads to a gain of more myogenic phenotype in atrial cardiomyocytes. This suggests that Prrx1 is a negative regulator of cardiac muscle lineage-specific gene expression. They also described a negative feedback regulatory loop between Prrx1 and Mef2, an important regulator of cardiomyocytes’ development and differentiation, which may indicate that this relationship is important in the maintenance of cardiomyocyte homeostasis [105].
It is difficult to unequivocally assess the potential influence of PRRX1 on the long-term culture. Many of the previous studies have described the role of PRRX1 in embryonic development, while here, the cells were collected from adult pigs. It seems that studies on AF seem to be the closest to the current system, as they were mostly conducted on mammalian–human or murine cells, although not porcine. PRRX1 could potentially promote cardiomyocytes’ proliferation and control expression of genes involved in the proper functioning of cells, as well as regulate the myogenic phenotype. The culture consists of cells which express markers characteristic for cardiomyocytes based upon flow cytometry data. At the same time, the authors do not have broader transcriptomic data which would possibly reveal a profile of expression of other genes important for the determination of such a phenotype. Furthermore, it is interesting that contradictory trends in the expression of this gene have been observed with the duration of culture between samples from the right atrial appendage and right atrial wall.
The other two most deregulated genes in the presented data are RACGAP1 and SNAI2. RACGAP1, Rac GTPase Activating Protein 1, here enriched in the “stem cell proliferation” GO BP term, is crucial for cytokinesis, namely, for the myosin contractile ring formation as well as proper attachment of the midbody to the cell membrane [106,107]. Many reports describe its role in the development and progression of different cancers, where it may serve as a proliferation and poor prognosis marker [108,109,110]. It has also been shown that RACGAP1 promotes hematopoietic stem cells’ differentiation and inhibits cell growth [111].
It has been shown that brk1, nckap1, and wasf2, which belong to WAVE2 complex and the regulators of small GTPase signaling, namely, cul3a and racgap1, are critical to cardiac development. A CRISPR KO of racgap1 in zebrafish heart demonstrates atrial dilation and pericardial edema [112].
It therefore seems that RACGAP1 could promote the proliferation of cultured cells. In samples from the right atrial wall, it can be clearly observed that the expression drops in the 30th day of culture, while for samples from the right atrial appendage, this tendency is even more significant; in the 15th day of culture, there is already 3-fold downregulation, which would suggest that, with time, possibly the cell proliferation decreases and further implies that further culture optimization is needed.
SNAI2, Snail Family Transcriptional Repressor 2, is an EMT-related transcription factor, promoting a migratory and invasive phenotype. Possibly the best-known target gene of this transcriptional repressor is CDH1, encoding E-cadherin, an epithelial cell adhesion molecule [113]. It is therefore not surprising that SNAI2 plays a crucial role in developmental processes such as mesoderm formation, or neural crest migration, but also in cancer [114,115]. As for the heart development, Slug is a key for epicardial EndMT, in which a group of epicardial cells migrate to the heart and differentiate into smooth muscle cells and fibroblasts, as well as for endocardial EndMT, which is indispensable for valve development [116,117].
Apart from functions in embryonic development, SNAI2 regulates adult stem/progenitor cell function—self-renewal, lineage commitment, and apoptosis in hematopoietic, mammary, epidermal, or mesenchymal tissues [118].
It is difficult to assess the role of SNAI2 in the system presented here as it should consist mainly of adult porcine cardiomyocytes, not endothelial cells, or cells at the embryonic stage. In cultures derived from both heart fragments, the tendencies are relatively similar—gradual downregulation with the culture duration. If it therefore comes to any pro-angiogenic influence, it is downregulated with the culture time.

5. Conclusions

Primary in vitro long-term cultures of porcine cardiomyocytes isolated from two different fragments, the right atrial appendage and right atrial wall, were established and documented. The expression of potential stemness markers (GATA-4, CD44, CD90, and CD105) and CMs’ markers (α-MHC and α-actinin) in cultures was characterized using flow cytometry [54]. GATA-4, α-MHC, and α-actinin were expressed in all cultures, at all time points, while CD90 was majorly expressed at later time points [54]. It can therefore be concluded that the isolation and culture of mature cardiomyocytes was successful. CD90 and GATA-4 expression may indicate not only putative stemness, because these proteins can serve as markers of some cardiac cell types or may play roles in the functioning of mature cardiomyocytes. The influence of cell culture conditions on potential stemness properties was also characterized by transcriptomic profiling. In total, 49 genes associated with such properties demonstrated differential expression, with the 4 most deregulated genes being SFRP2, PRRX1, RCAGP1, and SNAI2.
It would be interesting to perform all the experiments after fluorescence-activated or magnetic cell sorting with properly chosen markers characteristic for the cells which have been claimed to possess self-renewal and differentiation capacities and compare them to mature cardiomyocytes and previously characterized putative cardiac progenitor cells [119,120]. Conclusions based on the presence or absence of certain stem cell markers alone cannot be treated as a proof of potency [121]. It would be crucial to establish functional assays which would enable the assessment of such features [11,12,13,120].
Lastly, the low number of cells analyzed by flow cytometry as well as the results of transcriptomic profiling, which seem to point out the presence of sources of variation in the data other than the conditions itself, clearly show that more optimization of the culture conditions is needed.

Supplementary Materials

The following supporting information can be downloaded at https://www.mdpi.com/article/10.3390/genes14061223/s1, Table S1: Symbols, changes in expression, and adjusted p-values of the 10 most deregulated genes in the 7th, 15th, and 30th days of cell culture derived from the fragment of the right arial wall.; Table S2: Symbols, changes in expression, and adjusted p-values of the 10 most deregulated genes in the 7th, 15th, and 30th days of cell culture derived from the fragment of the right arial appendage.

Author Contributions

Conceptualization, R.B., M.J.N., D.B. and B.K.; methodology, M.J.N., M.K., M.Z. and B.K.; software, K.J. and M.K.; validation, M.J.N., P.M. and M.Z.; formal analysis, P.A. and P.D.; investigation, R.B., K.J. and M.K.; resources, D.B. and P.A.; data curation, D.B. and B.K.; writing—original draft preparation, R.B.; writing—review and editing, M.J.N., P.M. and B.K.; visualization, K.J. and M.K.; supervision, P.D. and B.K.; project administration, B.K.; funding acquisition, P.M. All authors have read and agreed to the published version of the manuscript.

Funding

This research was funded in part by USDA/NIFA multistate project NC 1184.

Institutional Review Board Statement

Not applicable.

Informed Consent Statement

Not applicable.

Data Availability Statement

Not applicable.

Conflicts of Interest

The authors declare no conflict of interest.

References

  1. Braunwald, E. The War against Heart Failure: The Lancet Lecture. Lancet 2015, 385, 812–824. [Google Scholar] [CrossRef]
  2. Yancy, C.W.; Jessup, M.; Bozkurt, B.; Butler, J.; Casey, D.E.; Colvin, M.M.; Drazner, M.H.; Filippatos, G.S.; Fonarow, G.C.; Givertz, M.M.; et al. 2017 ACC/AHA/HFSA Focused Update of the 2013 ACCF/AHA Guideline for the Management of Heart Failure: A Report of the American College of Cardiology/American Heart Association Task Force on Clinical Practice Guidelines and the Heart Failure Society of America. J. Am. Coll. Cardiol. 2017, 70, e137–e161. [Google Scholar]
  3. Ziaeian, B.; Fonarow, G.C. Epidemiology and Aetiology of Heart Failure. Nat. Rev. Cardiol. 2016, 13, 368–378. [Google Scholar] [CrossRef] [PubMed] [Green Version]
  4. Yancy, C.W.; Jessup, M.; Bozkurt, B.; Butler, J.; Casey, D.E.; Drazner, M.H.; Fonarow, G.C.; Geraci, S.A.; Horwich, T.; Januzzi, J.L.; et al. 2013 ACCF/AHA Guideline for the Management of Heart Failure: A Report of the American College of Cardiology Foundation/American Heart Association Task Force on Practice Guidelines. Circulation 2013, 128, e147–e239. [Google Scholar] [CrossRef] [PubMed] [Green Version]
  5. Bergmann, O.; Bhardwaj, R.D.; Bernard, S.; Zdunek, S.; Barnabé-Heide, F.; Walsh, S.; Zupicich, J.; Alkass, K.; Buchholz, B.A.; Druid, H.; et al. Evidence for Cardiomyocyte Renewal in Humans. Science 2009, 324, 98–102. [Google Scholar] [CrossRef] [Green Version]
  6. Bergmann, O.; Zdunek, S.; Felker, A.; Salehpour, M.; Alkass, K.; Bernard, S.; Sjostrom, S.L.; Szewczykowska, M.; Jackowska, T.; Dos Remedios, C.; et al. Dynamics of Cell Generation and Turnover in the Human Heart. Cell 2015, 161, 433–436. [Google Scholar] [CrossRef] [Green Version]
  7. Hsieh, P.C.H.; Segers, V.F.M.; Davis, M.E.; MacGillivray, C.; Gannon, J.; Molkentin, J.D.; Robbins, J.; Lee, R.T. Evidence from a Genetic Fate-Mapping Study That Stem Cells Refresh Adult Mammalian Cardiomyocytes after Injury. Nat. Med. 2007, 13, 970–974. [Google Scholar] [CrossRef]
  8. Hsueh, Y.C.; Wu, J.M.F.; Yu, C.K.; Wu, K.K.; Hsieh, P.C.H. Prostaglandin E2 Promotes Post-Infarction Cardiomyocyte Replenishment by Endogenous Stem Cells. EMBO Mol. Med. 2014, 6, 496–503. [Google Scholar] [CrossRef]
  9. Walsh, S.; Pontén, A.; Fleischmann, B.K.; Jovinge, S. Cardiomyocyte Cell Cycle Control and Growth Estimation in Vivo-An Analysis Based on Cardiomyocyte Nuclei. Cardiovasc. Res. 2010, 86, 365–373. [Google Scholar] [CrossRef]
  10. Malliaras, K.; Zhang, Y.; Seinfeld, J.; Galang, G.; Tseliou, E.; Cheng, K.; Sun, B.; Aminzadeh, M.; Marbán, E. Cardiomyocyte Proliferation and Progenitor Cell Recruitment Underlie Therapeutic Regeneration after Myocardial Infarction in the Adult Mouse Heart. EMBO Mol. Med. 2013, 5, 191–209. [Google Scholar] [CrossRef]
  11. Le, T.; Chong, J. Cardiac Progenitor Cells for Heart Repair. Cell Death Discov. 2016, 2, 16052. [Google Scholar] [CrossRef] [PubMed] [Green Version]
  12. Ge, Z.; Lal, S.; Le, T.Y.L.; dos Remedios, C.; Chong, J.J.H. Cardiac Stem Cells: Translation to Human Studies. Biophys. Rev. 2015, 7, 127–139. [Google Scholar] [CrossRef] [PubMed] [Green Version]
  13. Scalise, M.; Marino, F.; Cianflone, E.; Mancuso, T.; Marotta, P.; Aquila, I.; Torella, M.; Nadal-Ginard, B.; Torella, D. Heterogeneity of Adult Cardiac Stem Cells. Adv. Exp. Med. Biol. 2019, 1169, 141–178. [Google Scholar] [PubMed]
  14. Ellison, G.M.; Vicinanza, C.; Smith, A.J.; Aquila, I.; Leone, A.; Waring, C.D.; Henning, B.J.; Stirparo, G.G.; Papait, R.; Scarfò, M.; et al. Adult C-Kitpos Cardiac Stem Cells Are Necessary and Sufficient for Functional Cardiac Regeneration and Repair. Cell 2013, 154, 827–842. [Google Scholar] [CrossRef] [PubMed] [Green Version]
  15. Ellison, G.M.; Torella, D.; Dellegrottaglie, S.; Perez-Martinez, C.; Perez De Prado, A.; Vicinanza, C.; Purushothaman, S.; Galuppo, V.; Iaconetti, C.; Waring, C.D.; et al. Endogenous Cardiac Stem Cell Activation by Insulin-like Growth Factor-1/Hepatocyte Growth Factor Intracoronary Injection Fosters Survival and Regeneration of the Infarcted Pig Heart. J. Am. Coll. Cardiol. 2011, 58, 977–986. [Google Scholar] [CrossRef] [Green Version]
  16. Fransioli, J.; Bailey, B.; Gude, N.A.; Cottage, C.T.; Muraski, J.A.; Emmanuel, G.; Wu, W.; Alvarez, R.; Rubio, M.; Ottolenghi, S.; et al. Evolution of the C-kit-Positive Cell Response to Pathological Challenge in the Myocardium. Stem Cells 2008, 26, 1315–1324. [Google Scholar] [CrossRef] [Green Version]
  17. Hensley, M.T.; de Andrade, J.; Keene, B.; Meurs, K.; Tang, J.; Wang, Z.; Caranasos, T.G.; Piedrahita, J.; Li, T.S.; Cheng, K. Cardiac Regenerative Potential of Cardiosphere-Derived Cells from Adult Dog Hearts. J. Cell Mol. Med. 2015, 19, 1805–1813. [Google Scholar] [CrossRef] [PubMed] [Green Version]
  18. Lee, S.T.; White, A.J.; Matsushita, S.; Malliaras, K.; Steenbergen, C.; Zhang, Y.; Li, T.S.; Terrovitis, J.; Yee, K.; Simsir, S.; et al. Intramyocardial Injection of Autologous Cardiospheres or Cardiosphere-Derived Cells Preserves Function and Minimizes Adverse Ventricular Remodeling in Pigs with Heart Failure Post-Myocardial Infarction. J. Am. Coll. Cardiol. 2011, 57, 455–465. [Google Scholar] [CrossRef] [Green Version]
  19. Malliaras, K.; Li, T.S.; Luthringer, D.; Terrovitis, J.; Cheng, K.; Chakravarty, T.; Galang, G.; Zhang, Y.; Schoenhoff, F.; Van Eyk, J.; et al. Safety and Efficacy of Allogeneic Cell Therapy in Infarcted Rats Transplanted with Mismatched Cardiosphere-Derived Cells. Circulation 2012, 125, 100–112. [Google Scholar] [CrossRef] [Green Version]
  20. Messina, E.; De Angelis, L.; Frati, G.; Morrone, S.; Chimenti, S.; Fiordaliso, F.; Salio, M.; Battaglia, M.; Latronico, M.V.G.; Coletta, M.; et al. Isolation and Expansion of Adult Cardiac Stem Cells from Human and Murine Heart. Circ. Res. 2004, 95, 911–921. [Google Scholar] [CrossRef] [Green Version]
  21. Hierlihy, A.M.; Seale, P.; Lobe, C.G.; Rudnicki, M.A.; Megeney, L.A. The Post-Natal Heart Contains a Myocardial Stem Cell Population. FEBS Lett. 2002, 530, 239–243. [Google Scholar] [CrossRef] [PubMed]
  22. Pfister, O.; Mouquet, F.; Jain, M.; Summer, R.; Helmes, M.; Fine, A.; Colucci, W.S.; Liao, R. CD31- but Not CD31+ Cardiac Side Population Cells Exhibit Functional Cardiomyogenic Differentiation. Circ. Res. 2005, 97, 52–61. [Google Scholar] [CrossRef] [PubMed] [Green Version]
  23. Yamahara, K.; Fukushima, S.; Coppen, S.R.; Felkin, L.E.; Varela-Carver, A.; Barton, P.J.R.; Yacoub, M.H.; Suzuki, K. Heterogeneic Nature of Adult Cardiac Side Population Cells. Biochem. Biophys. Res. Commun. 2008, 371, 615–620. [Google Scholar] [CrossRef] [PubMed]
  24. Matsuura, K.; Nagai, T.; Nishigaki, N.; Oyama, T.; Nishi, J.; Wada, H.; Sano, M.; Toko, H.; Akazawa, H.; Sato, T.; et al. Adult Cardiac Sca-1-Positive Cells Differentiate into Beating Cardiomyocytes. J. Biol. Chem. 2004, 279, 11384–11391. [Google Scholar] [CrossRef] [PubMed] [Green Version]
  25. Van Vliet, P.; Roccio, M.; Smits, A.M.; Van Oorschot, A.A.M.; Metz, C.H.G.; Van Veen, T.A.B.; Sluijter, J.P.G.; Doevendans, P.A.; Goumans, M.J. Progenitor Cells Isolated from the Human Heart: A Potential Cell Source for Regenerative Therapy. Neth. Heart J. 2008, 16, 163–169. [Google Scholar] [CrossRef]
  26. Winter, E.M.; Grauss, R.W.; Hogers, B.; Van Tuyn, J.; Van Der Geest, R.; Lie-Venema, H.; Steijn, R.V.; Maas, S.; Deruiter, M.C.; Devries, A.A.F.; et al. Preservation of Left Ventricular Function and Attenuation of Remodeling after Transplantation of Human Epicardium-Derived Cells into the Infarcted Mouse Heart. Circulation 2007, 116, 917–927. [Google Scholar] [CrossRef] [Green Version]
  27. Zhou, Q.; Brown, J.; Kanarek, A.; Rajagopal, J.; Melton, D.A. In Vivo Reprogramming of Adult Pancreatic Exocrine Cells to β-Cells. Nature 2008, 455, 627–632. [Google Scholar] [CrossRef]
  28. Chong, J.J.H.; Chandrakanthan, V.; Xaymardan, M.; Asli, N.S.; Li, J.; Ahmed, I.; Heffernan, C.; Menon, M.K.; Scarlett, C.J.; Rashidianfar, A.; et al. Adult Cardiac-Resident MSC-like Stem Cells with a Proepicardial Origin. Cell Stem Cell 2011, 9, 527–540. [Google Scholar] [CrossRef] [Green Version]
  29. Chong, J.J.H.; Reinecke, H.; Iwata, M.; Torok-Storb, B.; Stempien-Otero, A.; Murry, C.E. Progenitor Cells Identified by PDGFR-α Expression in the Developing and Diseased Human Heart. Stem Cells Dev. 2013, 22, 1932–1943. [Google Scholar] [CrossRef] [Green Version]
  30. Engleka, K.A.; Manderfield, L.J.; Brust, R.D.; Li, L.; Cohen, A.; Dymecki, S.M.; Epstein, J.A. Islet1 Derivatives in the Heart Are of Both Neural Crest and Second Heart Field Origin. Circ. Res. 2012, 110, 922–926. [Google Scholar] [CrossRef] [PubMed] [Green Version]
  31. Laugwitz, K.L.; Moretti, A.; Lam, J.; Gruber, P.; Chen, Y.; Woodard, S.; Lin, L.Z.; Cai, C.L.; Lu, M.M.; Reth, M.; et al. Postnatal Isl1+ Cardioblasts Enter Fully Differentiated Cardiomyocyte Lineages. Nature 2005, 433, 647–653. [Google Scholar] [CrossRef] [Green Version]
  32. Moretti, A.; Caron, L.; Nakano, A.; Lam, J.T.; Bernshausen, A.; Chen, Y.; Qyang, Y.; Bu, L.; Sasaki, M.; Martin-Puig, S.; et al. Multipotent Embryonic Isl1+ Progenitor Cells Lead to Cardiac, Smooth Muscle, and Endothelial Cell Diversification. Cell 2006, 127, 1151–1165. [Google Scholar] [CrossRef] [PubMed] [Green Version]
  33. Bolli, R.; Chugh, A.R.; D’Amario, D.; Loughran, J.H.; Stoddard, M.F.; Ikram, S.; Beache, G.M.; Wagner, S.G.; Leri, A.; Hosoda, T.; et al. Cardiac Stem Cells in Patients with Ischaemic Cardiomyopathy (SCIPIO): Initial Results of a Randomised Phase 1 Trial. Lancet 2011, 378, 1847–1857. [Google Scholar] [CrossRef] [PubMed] [Green Version]
  34. Makkar, R.R.; Smith, R.R.; Cheng, K.; Malliaras, K.; Thomson, L.E.J.; Berman, D.; Czer, L.S.C.; Marbán, L.; Mendizabal, A.; Johnston, P.V.; et al. Intracoronary Cardiosphere-Derived Cells for Heart Regeneration after Myocardial Infarction (CADUCEUS): A Prospective, Randomised Phase 1 Trial. Lancet 2012, 379, 895–904. [Google Scholar] [CrossRef] [PubMed] [Green Version]
  35. Chomczynski, P.; Sacchi, N. Single-Step Method of RNA Isolation by Acid Guanidinium Thiocyanate-Phenol-Chloroform Extraction. Anal. Biochem. 1987, 162, 156–159. [Google Scholar] [CrossRef] [PubMed]
  36. Chomczynski, P.; Sacchi, N. The Single-Step Method of RNA Isolation by Acid Guanidinium Thiocyanate-Phenol-Chloroform Extraction: Twenty-Something Years On. Nat. Protoc. 2006, 1, 581–585. [Google Scholar] [CrossRef]
  37. Untergasser, A.; Cutcutache, I.; Koressaar, T.; Ye, J.; Faircloth, B.C.; Remm, M.; Rozen, S.G. Primer3-New Capabilities and Interfaces. Nucleic Acids Res. 2012, 40, e115. [Google Scholar] [CrossRef] [Green Version]
  38. Koressaar, T.; Remm, M. Enhancements and Modifications of Primer Design Program Primer3. Bioinformatics 2007, 23, 1289–1291. [Google Scholar] [CrossRef] [Green Version]
  39. Kõressaar, T.; Lepamets, M.; Kaplinski, L.; Raime, K.; Andreson, R.; Remm, M. Primer3-Masker: Integrating Masking of Template Sequence with Primer Design Software. Bioinformatics 2018, 34, 1937–1938. [Google Scholar] [CrossRef] [Green Version]
  40. Yates, A.D.; Achuthan, P.; Akanni, W.; Allen, J.; Allen, J.; Alvarez-Jarreta, J.; Amode, M.R.; Armean, I.M.; Azov, A.G.; Bennett, R.; et al. Ensembl 2020. Nucleic Acids Res. 2020, 48, D682–D688. [Google Scholar] [CrossRef]
  41. Livak, K.J.; Schmittgen, T.D. Analysis of Relative Gene Expression Data Using Real-Time Quantitative PCR and the 2-ΔΔCT Method. Methods 2001, 25, 402–408. [Google Scholar] [CrossRef] [PubMed]
  42. Schmittgen, D.T.; Livak, K.J. Analyzing Real-Time PCR Data by the Comparative CT Method. Nat. Protoc. 2008, 3, 1101–1108. [Google Scholar] [CrossRef] [PubMed]
  43. R Core Team. R: A Language and Environment for Statistical Computing; R Foundation for Statistical Computing: Vienna, Austria, 2020. [Google Scholar]
  44. Huber, W.; Carey, V.J.; Gentleman, R.; Anders, S.; Carlson, M.; Carvalho, B.S.; Bravo, H.C.; Davis, S.; Gatto, L.; Girke, T.; et al. Orchestrating High-Throughput Genomic Analysis with Bioconductor. Nat. Methods 2015, 12, 115–121. [Google Scholar] [CrossRef] [Green Version]
  45. Huang, D.W.; Sherman, B.T.; Lempicki, R.A. Systematic and Integrative Analysis of Large Gene Lists Using DAVID Bioinformatics Resources. Nat. Protoc. 2009, 4, 44–57. [Google Scholar] [CrossRef]
  46. Huang, D.W.; Sherman, B.T.; Lempicki, R.A. Bioinformatics Enrichment Tools: Paths toward the Comprehensive Functional Analysis of Large Gene Lists. Nucleic Acids Res. 2009, 37, 1–13. [Google Scholar] [CrossRef] [PubMed] [Green Version]
  47. Sherman, B.T.; Hao, M.; Qiu, J.; Jiao, X.; Baseler, M.W.; Lane, H.C.; Imamichi, T.; Chang, W. DAVID: A Web Server for Functional Enrichment Analysis and Functional Annotation of Gene Lists (2021 Update). Nucleic Acids Res. 2022, 50, W216–W221. [Google Scholar] [CrossRef]
  48. Ashburner, M.; Ball, C.A.; Blake, J.A.; Botstein, D.; Butler, H.; Cherry, J.M.; Davis, A.P.; Dolinski, K.; Dwight, S.S.; Eppig, J.T.; et al. Gene Ontology: Tool for the Unification of Biology. Nat. Genet. 2000, 25, 25–29. [Google Scholar] [CrossRef] [Green Version]
  49. The Gene Ontology Consortium; Acencio, M.; Lægreid, A.; Kuiper, M. The Gene Ontology Resource: 20 Years and Still GOing Strong. Nucleic Acids Res. 2019, 47, D330–D338. [Google Scholar]
  50. Walter, W.; Sánchez-Cabo, F.; Ricote, M. GOplot: An R Package for Visually Combining Expression Data with Functional Analysis. Bioinformatics 2015, 31, 2912–2914. [Google Scholar] [CrossRef] [Green Version]
  51. Beltrami, A.P.; Barlucchi, L.; Torella, D.; Baker, M.; Limana, F.; Chimenti, S.; Kasahara, H.; Rota, M.; Musso, E.; Urbanek, K.; et al. Adult Cardiac Stem Cells Are Multipotent and Support Myocardial Regeneration. Cell 2003, 114, 763–776. [Google Scholar] [CrossRef] [Green Version]
  52. Oh, H.; Bradfute, S.B.; Gallardo, T.D.; Nakamura, T.; Gaussin, V.; Mishina, Y.; Pocius, J.; Michael, L.H.; Behringer, R.R.; Garry, D.J.; et al. Cardiac Progenitor Cells from Adult Myocardium: Homing, Differentiation, and Fusion after Infarction. Proc. Natl. Acad. Sci. USA 2003, 100, 12313–12318. [Google Scholar] [CrossRef] [PubMed] [Green Version]
  53. Smith, R.R.; Barile, L.; Cho, H.C.; Leppo, M.K.; Hare, J.M.; Messina, E.; Giacomello, A.; Abraham, M.R.; Marbán, E. Regenerative Potential of Cardiosphere-Derived Cells Expanded from Percutaneous Endomyocardial Biopsy Specimens. Circulation 2007, 115, 896–908. [Google Scholar] [CrossRef] [Green Version]
  54. Nawrocki, M.J.; Jopek, K.; Kaczmarek, M.; Zdun, M.; Mozdziak, P.; Jemielity, M.; Perek, B.; Bukowska, D.; Kempisty, B. Transcriptomic Profile of Genes Regulating the Structural Organization of Porcine Atrial Cardiomyocytes during Primary In Vitro Culture. Genes 2022, 13, 1205. [Google Scholar] [CrossRef] [PubMed]
  55. Dominici, M.; Le Blanc, K.; Mueller, I.; Slaper-Cortenbach, I.; Marini, F.C.; Krause, D.S.; Deans, R.J.; Keating, A.; Prockop, D.J.; Horwitz, E.M. Minimal Criteria for Defining Multipotent Mesenchymal Stromal Cells. The International Society for Cellular Therapy Position Statement. Cytotherapy 2006, 8, 315–317. [Google Scholar] [CrossRef]
  56. Weiss, T.S.; Dayoub, R. Thy-1 (CD90)-Positive Hepatic Progenitor Cells, Hepatoctyes, and Non-Parenchymal Liver Cells Isolated from Human Livers. Methods Mol. Biol. 2017, 1506, 75–89. [Google Scholar]
  57. Nakamura, Y.; Muguruma, Y.; Yahata, T.; Miyatake, H.; Sakai, D.; Mochida, J.; Hotta, T.; Ando, K. Expression of CD90 on Keratinocyte Stem/Progenitor Cells. Br. J. Dermatl. 2006, 154, 1062–1070. [Google Scholar] [CrossRef] [PubMed]
  58. Yang, J.; Zhan, X.Z.; Malola, J.; Li, Z.Y.; Pawar, J.S.; Zhang, H.T.; Zha, Z.G. The Multiple Roles of Thy-1 in Cell Differentiation and Regeneration. Differentiation 2020, 113, 38–48. [Google Scholar] [CrossRef]
  59. Pinto, A.R.; Ilinykh, A.; Ivey, M.J.; Kuwabara, J.T.; D’antoni, M.L.; Debuque, R.; Chandran, A.; Wang, L.; Arora, K.; Rosenthal, N.A.; et al. Revisiting Cardiac Cellular Composition. Circ. Res. 2016, 118, 400–409. [Google Scholar] [CrossRef] [Green Version]
  60. Hudon-David, F.; Bouzeghrane, F.; Couture, P.; Thibault, G. Thy-1 Expression by Cardiac Fibroblasts: Lack of Association with Myofibroblast Contractile Markers. J. Mol. Cell Cardiol. 2007, 42, 991–1000. [Google Scholar] [CrossRef]
  61. Gambini, E.; Pompilio, G.; Biondi, A.; Alamanni, F.; Capogrossi, M.C.; Agrifoglio, M.; Pesce, M. C-Kit+ Cardiac Progenitors Exhibit Mesenchymal Markers and Preferential Cardiovascular Commitment. Cardiovasc. Res. 2011, 89, 362–373. [Google Scholar] [CrossRef] [PubMed] [Green Version]
  62. Davis, D.R.; Zhang, Y.; Smith, R.R.; Cheng, K.; Terrovitis, J.; Malliaras, K.; Li, T.S.; White, A.; Makkar, R.; Marbán, E. Validation of the Cardiosphere Method to Culture Cardiac Progenitor Cells from Myocardial Tissue. PLoS ONE 2009, 4, e7195. [Google Scholar] [CrossRef] [PubMed] [Green Version]
  63. Chan, H.H.L.; Meher Homji, Z.; Gomes, R.S.M.; Sweeney, D.; Thomas, G.N.; Tan, J.J.; Zhang, H.; Perbellini, F.; Stuckey, D.J.; Watt, S.M.; et al. Human Cardiosphere-Derived Cells from Patients with Chronic Ischaemic Heart Disease Can Be Routinely Expanded from Atrial but Not Epicardial Ventricular Biopsies. J. Cardiovasc. Transl. Res. 2012, 5, 678–687. [Google Scholar] [CrossRef] [PubMed] [Green Version]
  64. van Tuyn, J.; Atsma, D.E.; Winter, E.M.; van der Velde-van Dijke, I.; Pijnappels, D.A.; Bax, N.A.M.; Knaän-Shanzer, S.; Gittenberger-de Groot, A.C.; Poelmann, R.E.; van der Laarse, A.; et al. Epicardial Cells of Human Adults Can Undergo an Epithelial-to-Mesenchymal Transition and Obtain Characteristics of Smooth Muscle Cells In Vitro. Stem Cells 2007, 25, 271–278. [Google Scholar] [CrossRef] [PubMed]
  65. Cheng, K.; Ibrahim, A.; Hensley, M.T.; Shen, D.; Sun, B.; Middleton, R.; Liu, W.; Smith, R.R.; Marbán, E. Relative Roles of CD90 and C-Kit to the Regenerative Efficacy of Cardiosphere-Derived Cells in Humans and in a Mouse Model of Myocardial Infarction. J. Am. Heart Assoc. 2014, 3, e001260. [Google Scholar] [CrossRef] [Green Version]
  66. Senbanjo, L.T.; Chellaiah, M.A. CD44: A Multifunctional Cell Surface Adhesion Receptor Is a Regulator of Progression and Metastasis of Cancer Cells. Front. Cell Dev. Biol. 2017, 5, 18. [Google Scholar] [CrossRef] [Green Version]
  67. Thorne, R.F.; Wang, Y.; Zhang, Y.; Jing, X.; Zhang, X.D.; de Bock, C.E.; Oliveira, C.S. Evaluating Nuclear Translocation of Surface Receptors: Recommendations Arising from Analysis of CD44. Histochem. Cell Biol. 2020, 153, 77–87. [Google Scholar] [CrossRef]
  68. Bollini, S.; Vieira, J.M.N.; Howard, S.; Dubè, K.N.; Balmer, G.M.; Smart, N.; Riley, P.R. Re-Activated Adult Epicardial Progenitor Cells Are a Heterogeneous Population Molecularly Distinct from Their Embryonic Counterparts. Stem Cells Dev. 2014, 23, 1719–1730. [Google Scholar] [CrossRef]
  69. Lebrin, F.; Goumans, M.J.; Jonker, L.; Carvalho, R.L.C.; Valdimarsdottir, G.; Thorikay, M.; Mummery, C.; Arthur, H.M.; Ten Dijke, P. Endoglin Promotes Endothelial Cell Proliferation and TGF-β/ALK1 Signal Transduction. EMBO J. 2004, 23, 4018–4028. [Google Scholar] [CrossRef] [Green Version]
  70. Singh, E.; Phillips, H.M.; Arthur, H.M. Dynamic Changes in Endoglin Expression in the Developing Mouse Heart. Gene Expr. Patterns 2021, 39, 119165. [Google Scholar] [CrossRef]
  71. Arthur, H.M.; Ure, J.; Smith, A.J.H.; Renforth, G.; Wilson, D.I.; Torsney, E.; Charlton, R.; Parums, D.V.; Jowett, T.; Marchuk, D.A.; et al. Endoglin, an Ancillary TGFβ Receptor, Is Required for Extraembryonic Angiogenesis and Plays a Key Role in Heart Development. Dev. Biol. 2000, 217, 42–53. [Google Scholar] [CrossRef] [Green Version]
  72. Sunagawa, Y.; Morimoto, T.; Takaya, T.; Kaichi, S.; Wada, H.; Kawamura, T.; Fujita, M.; Shimatsu, A.; Kita, T.; Hasegawa, K. Cyclin-Dependent Kinase-9 Is a Component of the P300/GATA4 Complex Required for Phenylephrine-Induced Hypertrophy in Cardiomyocytes. J. Biol. Chem. 2010, 285, 9556–9568. [Google Scholar] [CrossRef] [Green Version]
  73. Bisping, E.; Ikeda, S.; Kong, S.W.; Tarnavski, O.; Bodyak, N.; McMullen, J.R.; Rajagopal, S.; Son, J.K.; Ma, Q.; Springer, Z.; et al. Gata4 Is Required for Maintenance of Postnatal Cardiac Function and Protection from Pressure Overload-Induced Heart Failure. Proc. Natl. Acad. Sci. USA 2006, 103, 14471–14476. [Google Scholar] [CrossRef] [PubMed] [Green Version]
  74. Yamamura, S.; Izumiya, Y.; Araki, S.; Nakamura, T.; Kimura, Y.; Hanatani, S.; Yamada, T.; Ishida, T.; Yamamoto, M.; Onoue, Y.; et al. Cardiomyocyte Sirt (Sirtuin) 7 Ameliorates Stress-Induced Cardiac Hypertrophy by Interacting with and Deacetylating GATA4. Hypertension 2020, 75, 98–108. [Google Scholar] [CrossRef] [PubMed]
  75. Furtado, M.B.; Costa, M.W.; Pranoto, E.A.; Salimova, E.; Pinto, A.R.; Lam, N.T.; Park, A.; Snider, P.; Chandran, A.; Harvey, R.P.; et al. Cardiogenic Genes Expressed in Cardiac Fibroblasts Contribute to Heart Development and Repair. Circ. Res. 2014, 114, 1422–1434. [Google Scholar] [CrossRef] [PubMed]
  76. Akazawa, H.; Komuro, I. Roles of Cardiac Transcription Factors in Cardiac Hypertrophy. Circ. Res. 2003, 92, 1079–1088. [Google Scholar] [CrossRef] [PubMed] [Green Version]
  77. Padmanabhan, A.; Alexanian, M.; Linares-Saldana, R.; González-Terán, B.; Andreoletti, G.; Huang, Y.; Connolly, A.J.; Kim, W.; Hsu, A.; Duan, Q.; et al. BRD4 (Bromodomain-Containing Protein 4) Interacts with GATA4 (GATA Binding Protein 4) to Govern Mitochondrial Homeostasis in Adult Cardiomyocytes. Circulation 2020, 142, 2338–2355. [Google Scholar] [CrossRef]
  78. Jia, G.; Preussner, J.; Chen, X.; Guenther, S.; Yuan, X.; Yekelchyk, M.; Kuenne, C.; Looso, M.; Zhou, Y.; Teichmann, S.; et al. Single Cell RNA-Seq and ATAC-Seq Analysis of Cardiac Progenitor Cell Transition States and Lineage Settlement. Nat. Commun. 2018, 9, 4877. [Google Scholar] [CrossRef] [Green Version]
  79. Masino, A.M.; Gallardo, T.D.; Wilcox, C.A.; Olson, E.N.; Williams, R.S.; Garry, D.J. Transcriptional Regulation of Cardiac Progenitor Cell Populations. Circ. Res. 2004, 95, 389–397. [Google Scholar] [CrossRef] [Green Version]
  80. de Soysa, T.Y.; Ranade, S.S.; Okawa, S.; Ravichandran, S.; Huang, Y.; Salunga, H.T.; Schricker, A.; del Sol, A.; Gifford, C.A.; Srivastava, D. Single-Cell Analysis of Cardiogenesis Reveals Basis for Organ-Level Developmental Defects. Nature 2019, 572, 120–124. [Google Scholar] [CrossRef]
  81. Zhang, Y.; Zhong, J.F.; Qiu, H.; MacLellan, W.R.; Marbán, E.; Wang, C. Epigenomic Reprogramming of Adult Cardiomyocyte-Derived Cardiac Progenitor Cells. Sci. Rep. 2015, 5, 17686. [Google Scholar] [CrossRef] [Green Version]
  82. Zhang, Y.; Li, T.S.; Lee, S.T.; Wawrowsky, K.A.; Cheng, K.; Galang, G.; Malliaras, K.; Abraham, M.R.; Wang, C.; Marbán, E. Dedifferentiation and Proliferation of Mammalian Cardiomyocytes. PLoS ONE 2010, 5, e12559. [Google Scholar] [CrossRef] [PubMed] [Green Version]
  83. Dey, D.; Han, L.; Bauer, M.; Sanada, F.; Oikonomopoulos, A.; Hosoda, T.; Unno, K.; De Almeida, P.; Leri, A.; Wu, J.C. Dissecting the Molecular Relationship among Various Cardiogenic Progenitor Cells. Circ. Res. 2013, 112, 1253–1262. [Google Scholar] [CrossRef] [PubMed]
  84. Chien, K.R.; Frisén, J.; Fritsche-Danielson, R.; Melton, D.A.; Murry, C.E.; Weissman, I.L. Regenerating the Field of Cardiovascular Cell Therapy. Nat. Biotechnol. 2019, 37, 232–237. [Google Scholar] [CrossRef]
  85. Orlic, D.; Kajstura, J.; Chimenti, S.; Bodine, D.M.; Leri, A.; Anversa, P. Bone Marrow Stem Cells Regenerate Infarcted Myocardium. Proc. Pediatr. Transplant. 2003, 7, 86–88. [Google Scholar] [CrossRef]
  86. Vagnozzi, R.J.; Sargent, M.A.; Lin, S.C.J.; Palpant, N.J.; Murry, C.E.; Molkentin, J.D. Genetic Lineage Tracing of Sca-1+ Cells Reveals Endothelial but Not Myogenic Contribution to the Murine Heart. Circulation 2018, 138, 2931–2939. [Google Scholar] [CrossRef]
  87. Müller, T.; Boileau, E.; Talyan, S.; Kehr, D.; Varadi, K.; Busch, M.; Most, P.; Krijgsveld, J.; Dieterich, C. Updated and Enhanced Pig Cardiac Transcriptome Based on Long-Read RNA Sequencing and Proteomics. J. Mol. Cell Cardiol. 2021, 150, 23–31. [Google Scholar] [CrossRef]
  88. Ou, Q.; Jacobson, Z.; Abouleisa, R.R.E.; Tang, X.L.; Hindi, S.M.; Kumar, A.; Ivey, K.N.; Giridharan, G.; El-Baz, A.; Brittian, K.; et al. Physiological Biomimetic Culture System for Pig and Human Heart Slices. Circ. Res. 2019, 125, 628–642. [Google Scholar] [CrossRef] [PubMed] [Green Version]
  89. Mathiyalagan, P.; Adamiak, M.; Mayourian, J.; Sassi, Y.; Liang, Y.; Agarwal, N.; Jha, D.; Zhang, S.; Kohlbrenner, E.; Chepurko, E.; et al. FTO-Dependent N6-Methyladenosine Regulates Cardiac Function during Remodeling and Repair. Circulation 2019, 139, 518–532. [Google Scholar] [CrossRef]
  90. Tu, L.N.; Timms, A.E.; Kibiryeva, N.; Bittel, D.; Pastuszko, A.; Nigam, V.; Pastuszko, P. Transcriptome Profiling Reveals Activation of Inflammation and Apoptosis in the Neonatal Striatum after Deep Hypothermic Circulatory Arrest. J. Thorac. Cardiovasc. Surg. 2019, 158, 882–890.e4. [Google Scholar] [CrossRef]
  91. Wu, Y.; Liu, X.; Zheng, H.; Zhu, H.; Mai, W.; Huang, X.; Huang, Y. Multiple Roles of SFRP2 in Cardiac Development and Cardiovascular Disease. Int. J. Biol. Sci. 2020, 16, 730–738. [Google Scholar] [CrossRef] [Green Version]
  92. Tian, Y.; Cohen, E.D.; Morrisey, E.E. The Importance of Wnt Signaling in Cardiovascular Development. Pediatr. Cardiol. 2010, 31, 342–348. [Google Scholar] [CrossRef] [Green Version]
  93. Hsueh, Y.C.; Hodgkinson, C.P.; Gomez, J.A. The Role of Sfrp and DKK Proteins in Cardiomyocyte Development. Physiol. Rep. 2021, 9, e14678. [Google Scholar] [CrossRef]
  94. He, W.; Zhang, L.; Ni, A.; Zhang, Z.; Mirotsou, M.; Mao, L.; Pratt, R.E.; Dzau, V.J. Exogenously Administered Secreted Frizzled Related Protein 2 (Sfrp2) Reduces Fibrosis and Improves Cardiac Function in a Rat Model of Myocardial Infarction. Proc. Natl. Acad. Sci. USA 2010, 107, 21110–21115. [Google Scholar] [CrossRef] [PubMed] [Green Version]
  95. Courtwright, A.; Siamakpour-Reihani, S.; Arbiser, J.L.; Banet, N.; Hilliard, E.; Fried, L.; Livasy, C.; Ketelsen, D.; Nepal, D.B.; Perou, C.M.; et al. Secreted Frizzle-Related Protein 2 Stimulates Angiogenesis via a Calcineurin/NFAT Signaling Pathway. Cancer Res. 2009, 69, 4621–4628. [Google Scholar] [CrossRef] [PubMed] [Green Version]
  96. Schmeckpeper, J.; Verma, A.; Yin, L.; Beigi, F.; Zhang, L.; Payne, A.; Zhang, Z.; Pratt, R.E.; Dzau, V.J.; Mirotsou, M. Inhibition of Wnt6 by Sfrp2 Regulates Adult Cardiac Progenitor Cell Differentiation by Differential Modulation of Wnt Pathways. J. Mol. Cell Cardiol. 2015, 85, 215–225. [Google Scholar] [CrossRef] [PubMed] [Green Version]
  97. Hodgkinson, C.P.; Gomez, J.A.; Baksh, S.S.; Payne, A.; Schmeckpeper, J.; Pratt, R.E.; Dzau, V.J. Insights from Molecular Signature of in Vivo Cardiac C-Kit(+) Cells Following Cardiac Injury and β-Catenin Inhibition. J. Mol. Cell Cardiol. 2018, 123, 64–74. [Google Scholar] [CrossRef]
  98. Gomez, J.A.; Payne, A.; Pratt, R.E.; Hodgkinson, C.P.; Dzau, V.J. A Role for Sfrp2 in Cardiomyogenesis in Vivo. Proc. Natl. Acad. Sci. USA 2021, 118, e2103676118. [Google Scholar] [CrossRef]
  99. Deb, A.; Davis, B.H.; Guo, J.; Ni, A.; Huang, J.; Zhang, Z.; Mu, H.; Dzau, V.J. SFRP2 Regulates Cardiomyogenic Differentiation by Inhibiting a Positive Transcriptional Autofeedback Loop of Wnt3a. Stem Cells 2008, 26, 35–44. [Google Scholar] [CrossRef] [Green Version]
  100. Higuchi, M.; Yoshida, S.; Ueharu, H.; Chen, M.; Kato, T.; Kato, Y. PRRX1 and PRRX2 Distinctively Participate in Pituitary Organogenesis and a Cell-Supply System. Cell Tissue Res. 2014, 357, 323–335. [Google Scholar] [CrossRef]
  101. Leussink, B.; Brouwer, A.; El Khattabi, M.; Poelmann, R.E.; Gittenberger-de Groot, A.C.; Meijlink, F. Expression Patterns of the Paired-Related Homeobox Genes MHox/Prx1 and S8/Prx2 Suggest Roles in Development of the Heart and the Forebrain. Mech. Dev. 1995, 52, 51–64. [Google Scholar] [CrossRef]
  102. Bergwerff, M.; Gittenberger-De Groot, A.C.; Deruiter, M.C.; Van Iperen, L.; Meijlink, F.; Poelmann, R.E. Patterns of Paired-Related Homeobox Genes PRX1 and PRX2 Suggest Involvement in Matrix Modulation in the Developing Chick Vascular System. Dev. Dyn. 1998, 213, 59–70. [Google Scholar] [CrossRef]
  103. de Bakker, D.E.M.; Bouwman, M.; Dronkers, E.; Simões, F.C.; Riley, P.R.; Goumans, M.J.; Smits, A.M.; Bakkers, J. Prrx1b Restricts Fibrosis and Promotes Nrg1-Dependent Cardiomyocyte Proliferation during Zebrafish Heart Regeneration. Development 2021, 148, dev198937. [Google Scholar] [CrossRef] [PubMed]
  104. Guo, X.J.; Qiu, X.B.; Wang, J.; Guo, Y.H.; Yang, C.X.; Li, L.; Gao, R.F.; Ke, Z.P.; Di, R.M.; Sun, Y.M.; et al. Prrx1 Loss-of-Function Mutations Underlying Familial Atrial Fibrillation. J. Am. Heart Assoc. 2021, 10, e023517. [Google Scholar] [CrossRef] [PubMed]
  105. Bosada, F.M.; Rivaud, M.R.; Uhm, J.S.; Verheule, S.; Van Duijvenboden, K.; Verkerk, A.O.; Christoffels, V.M.; Boukens, B.J. A Variant Noncoding Region Regulates Prrx1 and Predisposes to Atrial Arrhythmias. Circ. Res. 2021, 129, 420–434. [Google Scholar] [CrossRef]
  106. Hirose, K.; Kawashima, T.; Iwamoto, I.; Nosaka, T.; Kitamura, T. MgcRacGAP Is Involved in Cytokinesis through Associating with Mitotic Spindle and Midbody. J. Biol. Chem. 2001, 276, 5821–5828. [Google Scholar] [CrossRef] [Green Version]
  107. Zhao, W.M.; Fang, G. MgcRacGAP Controls the Assembly of the Contractile Ring and the Initiation of Cytokinesis. Proc. Natl. Acad. Sci. USA 2005, 102, 13158–13163. [Google Scholar] [CrossRef] [Green Version]
  108. Yang, X.M.; Cao, X.Y.; He, P.; Li, J.; Feng, M.X.; Zhang, Y.L.; Zhang, X.L.; Wang, Y.H.; Yang, Q.; Zhu, L.; et al. Overexpression of Rac GTPase Activating Protein 1 Contributes to Proliferation of Cancer Cells by Reducing Hippo Signaling to Promote Cytokinesis. Gastroenterology 2018, 155, 1233–1249.e22. [Google Scholar] [CrossRef]
  109. Milde-Langosch, K.; Karn, T.; Müller, V.; Witzel, I.; Rody, A.; Schmidt, M.; Wirtz, R.M. Validity of the Proliferation Markers Ki67, TOP2A, and RacGAP1 in Molecular Subgroups of Breast Cancer. Breast Cancer Res. Treat 2013, 137, 57–67. [Google Scholar] [CrossRef]
  110. Imaoka, H.; Toiyama, Y.; Saigusa, S.; Kawamura, M.; Kawamoto, A.; Okugawa, Y.; Hiro, J.; Tanaka, K.; Inoue, Y.; Mohri, Y.; et al. RacGAP1 Expression, Increasing Tumor Malignant Potential, as a Predictive Biomarker for Lymph Node Metastasis and Poor Prognosis in Colorectal Cancer. Carcinogenesis 2015, 36, 346–354. [Google Scholar] [CrossRef] [Green Version]
  111. Kawashima, T.; Hirose, K.; Satoh, T.; Kaneko, A.; Ikeda, Y.; Kaziro, Y.; Nosaka, T.; Kitamura, T. MgcRacGAP Is Involved in the Control of Growth and Differentiation of Hematopoietic Cells. Blood 2000, 96, 2116–2124. [Google Scholar] [CrossRef]
  112. Edwards, J.J.; Rouillard, A.D.; Fernandez, N.F.; Wang, Z.; Lachmann, A.; Shankaran, S.S.; Bisgrove, B.W.; Demarest, B.; Turan, N.; Srivastava, D.; et al. Systems Analysis Implicates WAVE2 Complex in the Pathogenesis of Developmental Left-Sided Obstructive Heart Defects. JACC Basic Transl. Sci. 2020, 5, 376–386. [Google Scholar] [CrossRef]
  113. Hajra, K.M.; Chen, D.Y.S.; Fearon, E.R. The SLUG Zinc-Finger Protein Represses E-Cadherin in Breast Cancer. Cancer Res. 2002, 62, 1613–1618. [Google Scholar]
  114. Nieto, M.A.; Sargent, M.G.; Wilkinson, D.G.; Cooke, J. Control of Cell Behavior during Vertebrate Development by Slug, a Zinc Finger Gene. Science 1994, 264, 835–839. [Google Scholar] [CrossRef]
  115. Nieto, M.A. The Snail Superfamily of Zinc-Finger Transcription Factors. Nat. Rev Mol. Cell Biol. 2002, 3, 155–166. [Google Scholar] [CrossRef] [PubMed]
  116. Takeichi, M.; Nimura, K.; Mori, M.; Nakagami, H.; Kaneda, Y. The Transcription Factors Tbx18 and Wt1 Control the Epicardial Epithelial-Mesenchymal Transition through Bi-Directional Regulation of Slug in Murine Primary Epicardial Cells. PLoS ONE 2013, 8, e57829. [Google Scholar] [CrossRef] [PubMed] [Green Version]
  117. Liang, X.; Wu, S.; Geng, Z.; Liu, L.; Zhang, S.; Wang, S.; Zhang, Y.; Huang, Y.; Zhang, B. LARP7 Suppresses Endothelial-to-Mesenchymal Transition by Coupling with TRIM28. Circ. Res. 2021, 129, 843–856. [Google Scholar] [CrossRef]
  118. Zhou, W.; Gross, K.M.; Kuperwasser, C. Molecular Regulation of Snai2 in Development and Disease. J. Cell Sci. 2019, 132, jcs235127. [Google Scholar] [CrossRef]
  119. Collantes, M.; Pelacho, B.; García-Velloso, M.J.; Gavira, J.J.; Abizanda, G.; Palacios, I.; Rodriguez-Borlado, L.; Álvarez, V.; Prieto, E.; Ecay, M.; et al. Non-Invasive in Vivo Imaging of Cardiac Stem/Progenitor Cell Biodistribution and Retention after Intracoronary and Intramyocardial Delivery in a Swine Model of Chronic Ischemia Reperfusion Injury. J. Transl. Med. 2017, 15, 56. [Google Scholar] [CrossRef] [PubMed] [Green Version]
  120. Smith, A.J.; Lewis, F.C.; Aquila, I.; Waring, C.D.; Nocera, A.; Agosti, V.; Nadal-Ginard, B.; Torella, D.; Ellison, G.M. Isolation and Characterization of Resident Endogenous C-Kit+ Cardiac Stem Cells from the Adult Mouse and Rat Heart. Nat. Protoc. 2014, 9, 1662–1681. [Google Scholar] [CrossRef]
  121. Dulak, J.; Szade, K.; Szade, A.; Nowak, W.; Józkowicz, A. Adult Stem Cells: Hopes and Hypes of Regenerative Medicine. Acta Biochim. Pol. 2015, 62, 329–337. [Google Scholar] [CrossRef] [Green Version]
Figure 1. Representative images of long-term in vitro cell cultures established from 2 different heart muscle fragments—right atrial appendage (A) and right atrial wall (B). Nomarski phase/contrast images. Scale bars’ length for magnification: 10×: 100 µm, 20×: 50 µm.
Genes 14 01223 g001aGenes 14 01223 g001b
Figure 2. Phenotype of porcine CMs isolated from the right atrial wall in the 7th, 15th, and 30th day of culture analyzed by flow cytometry. CD44, CD105, and CD90 state for mesenchymal cell markers. MFIc—mean fluorescence intensity for control samples; MFI—mean fluorescence intensity for research samples.
Genes 14 01223 g002
Figure 3. Phenotype of porcine CMs isolated from right atrial appendage in the 7th, 15th, and 30th day of culture analyzed by flow cytometry. CD44, CD105, and CD90 state for mesenchymal cell markers. MFIc—mean fluorescence intensity for control samples; MFI—mean fluorescence intensity for research samples.
Genes 14 01223 g003
Figure 4. Heatmap representation of differentially expressed genes belonging to the chosen GO BP terms. The arbitrary signal intensity acquired from microarray analysis is represented by colors (green—higher expression; red—lower expression). D—day of the primary culture; RA—right atrial wall; RAA—right atrial appendage.
Genes 14 01223 g004
Figure 5. The circle plot shows the differentially expressed genes and z-score of the chosen GO BP terms “stem cell population maintenance” and “stem cell proliferation”. The outer circle shows a scatter plot for each term of the logFC of the assigned genes. Red circles display upregulation and green circles downregulation. The inner circle shows the z-score of each GO BP term. The width of each bar corresponds to the number of genes within the GO BP term and the color corresponds to the z-score. The z-score refers to the difference between the number of upregulated genes and the number of downregulated genes divided by the square root of the count, where the count is the number of genes assigned to a term.
Genes 14 01223 g005
Figure 6. GOChord plot representing the relationship between differentially expressed genes and chosen GO BP terms: “stem cell population maintenance” and “stem cell proliferation”. The ribbons indicate which gene belongs to which categories. The color of each block closest to the gene name corresponds to the logFC of each gene (7D/0D) (green—upregulated, red—downregulated).
Genes 14 01223 g006
Figure 7. Heatmap presenting the relationship between differentially expressed genes and chosen GO BP terms: “stem cell population maintenance” and “stem cell proliferation”. The color corresponds to the logFC of a particular gene (7D/0D).
Genes 14 01223 g007
Figure 8. The results of the validation of the expression level of the analyzed genes by RT-qPCR presented as a bar chart. The values are presented as the log2FC of the tested culture duration vs. 0 days’ culture duration.
Genes 14 01223 g008
Table 1. Oligodeoxynucleotides designed to detect the expression levels of the studied genes.
Gene Symbol5′→3′ Sequence of the Forward Primer5′→3′ Sequence of the Reverse PrimerProduct Length (bp)
ASPMAACAGATTACGTCGTGCTGCCTGTCTCTAGGCCGATTCGT205
BMPR1AATTTGGGAAATGGCTCGTCGCCCAGCATTCCGACATTAGC205
CTNNA1CTTCTTGGCGGTCTCAGAGAACCCCTGGCTCATAGTTGTC171
CTNNB1CCTCTCATCAAGGCTACCGTAGGGCTCCAGTACAACCTTC218
DDX6ACACTGCCTCAACACACTTTGATTTCGATGTTCCTGCCTCA220
DOCK7TGCTTACTCCACCTGCATCAATAGTCCTTCCGCATCAGGG198
EIF4EGCAAACCTTCGGCTGATCTCATTAGCCATCGTCCTCCTCG173
EPAS1TGGGCTGGAGAGTTGAGAAGAATAGTCTCCAGGGCTGCTG151
FANCD2CAGTGTATGCCGCTCCTAGAGAGATTGCCCAGCCAGAAAG246
FGF2GCAGAAGAGAGAGGGGTTGTCGTTCGTTTCAGTGCCACAT195
FGFR2ATCGAGATTTAGCCGCCAGATCCCACATTAACACCCCGAA214
FOXO1ATCACCAAGGCCATCGAGAGAGTTCCTTCATTCTGCACGC189
FRS2TGCCTTTAAGTGTGCTCGTGTGGGTAAGTTCTGAGCAGCA182
HIF1ACTCAGTCGTCACAGTCTGGACCACCTCTTTTGGCAAGCAT212
HMGA2ACCTCCCAATCTCCCGAAAGGTTGTCCCTGGGCTGAAGT161
ID4ACTACATCCTGGACCTGCAGCCTCCCTCTCTAGTGCTCCT250
KDM1AGTCCAGTTTGTGCCACCTCTTGCCTACATGCCCGAACAAA139
KITATTGTGAATCTTCTCGGCGCACTCCGGGTTTCATGTCCAT227
KITLGTGGCCAGTTCTATCCATGCATGGTCAGGGGTAAAGGCAAA175
KLF10TGAGCTGCAGTTGGAAGTCTTGTGAGGCTTGGCAGTATCT246
LIFGAACCTCTGAAAACTGCCGGACAGGAGTGATGGAAAGGGG151
MCPH1CAGCCGACCATGTTCATCAGAGTTCTCAGAGGCACAGACC217
MED14CCACCATCCTCACTCACAGTTCACTCCGGGTTCATTGGAA198
MED21GTCCTCCTGCCTCTTTCAGTCCTCCAGACATGTAGCAGCT228
MED27ACTTGCATTCAGTCAACCGGTTGTTCGACCACTTGTACGC172
MED7ACTAGTAGAAGGCACGCGAAACTGCCCTTCACGGTGATTA150
MTF2AAACTGCTGAGCCACCTTTGTGCCTGGAAATGCTAGACGA172
NF1GAATCCCCACCACAGTACCAAAGGAGATGTGGGTGTCAGG226
NKAPGAGTCCCAGGAAGAGTTGCTCATAGCTGCACCTTCACCAG162
NOTCH2TTATGTCTCACCCCTGCCAGACTGTCCTGGAACGTCACAT246
PAX6TTGCCCGAGAAAGACTAGCAGTGGGTTGTGGGATTGGTTG196
PRRX1GGACACACTACCCAGATGCTTTTGAGGAGGGAAGCGTTCT155
RAB10ATGGCGAAGAAGACGTACGAAGGAGGTTGTGATCGTGTGA232
RACGAP1ACCGCTGGAATACTGGAGTCTGACAGGGAGCTGGATGAAG184
RBPJATGGGCAGTGGATGGAAGAATGTTTTGGCCGTGCAATAGT156
RTF1CCAGGCGACAGTGTAAACCTTCGCTGGCTGACTTGGAATT175
RUNX1GTCCCAACTTCCTCTGCTCTCTTCCACTCCGACCGACAAA226
SFRP2GCTCCAAAGGTATGTGAAGCCGGTCTTGCTCTTGGTCTCCA159
SMC3TGGAGGACACTGAGGCAAATTCCTGTTGCCGCTCTAAGAA248
SNAI2GCCGAGAAGTTTCAGTGCAAGGGTCCGAATGTGCATCTTC169
SOX5CAGCAGCAAGAACAGATCGCAGCCAGTGTCCGTTGATCAG147
SS18CGGATATGACCAGGGACAGTCTTGCTGCGTTTCACCTGAT175
STAT3AGCAGCAAAGAAGGAGGAGTACACGAGGATGTTGGTAGCA166
TAF4BGCCAGTCAGTTTCCTCAAGCACGAGTGTGCCAACCAATTC227
TBX3AGGGTGTTCGATGACAGACAGACGTGGTGGTGGAGATCTT233
TET1TCTGGCAAGAAGAGAGCAGCATGGATGGGGTCGGTGAGTA248
TGFB1ACCATGCCAATTTCTGCCTGGAACGCACGATCATGTTGGA208
VPS72TCCTTCGAGTACAAGAGCGGGCACTTGCGCTTCTTATGGA188
WNT2BCAACGTGGGGACTTTGACTGTGGCACTTACACTCCAGCTT185
ACTBCCCTGGAGAAGAGCTACGAGCGTCGCACTTCATGATGGAG156
GAPDHCCAGAACATCATCCCTGCCTCCTGCTTCACCACCTTCTTG185
Table 2. Thermal profile of RT-qPCRs.
StepTemperature (°C)Time (s)Number of Cycles
Preincubation956001
AmplificationDenaturation951540
Annealing5815
Elongation7215
Melting95601
4060
701
951
Cooling37301
Disclaimer/Publisher’s Note: The statements, opinions and data contained in all publications are solely those of the individual author(s) and contributor(s) and not of MDPI and/or the editor(s). MDPI and/or the editor(s) disclaim responsibility for any injury to people or property resulting from any ideas, methods, instructions or products referred to in the content.

