Article

Analysis of the Origin of Emiratis as Inferred from a Family Study Based on HLA-A, -C, -B, -DRB1, and -DQB1 Genes

1
Sheikh Khalifa Medical City-Union71-Purehealth, Abu Dhabi P.O. Box 51900, United Arab Emirates
2
United Arab Emirates University, Al Ain P.O. Box 51900, United Arab Emirates
3
Department of Immunogenetics, National Blood Transfusion Center, Tunis P.O. Box 1006, Tunisia
4
College of Medicine, King Saud Bin Abdulaziz University for Health Sciences, Riyadh P.O. Box 22490, Saudi Arabia
5
Higher College of Technology, Abu Dhabi P.O. Box 25026, United Arab Emirates
6
SEHA Kidney Care, SEHA, Abu Dhabi P.O. Box 92900, United Arab Emirates
7
Department of Pediatrics, University of California, San Francisco, Oakland, CA 94609, USA
8
Qatar University, Doha P.O. Box 2713, Qatar
9
School of Health Sciences, Universiti Sains Malaysia, Health Campus, Kubang Kerian 16150, Kelantan, Malaysia
10
Faculty of Sciences, El-Manar University, Tunis P.O. Box 94, Tunisia
*
Author to whom correspondence should be addressed.
These authors contributed equally to this work.
Genes 2023, 14(6), 1159; https://doi.org/10.3390/genes14061159
Submission received: 1 May 2023 / Revised: 23 May 2023 / Accepted: 24 May 2023 / Published: 26 May 2023
(This article belongs to the Special Issue Genetic Analyses of Immune Genes in Human and Animals)

Abstract

:
In this study, we investigated HLA class I and class II allele and haplotype frequencies in Emiratis and compared them to those of Asian, Mediterranean, and Sub-Saharan African populations. Methods: Two-hundred unrelated Emirati parents of patients selected for bone marrow transplantation were genotyped for HLA class I (A, B, C) and class II (DRB1, DQB1) genes using reverse sequence specific oligonucleotide bead-based multiplexing. HLA haplotypes were assigned with certainty by segregation (pedigree) analysis, and haplotype frequencies were obtained by direct counting. HLA class I and class II frequencies in Emiratis were compared to data from other populations using standard genetic distances (SGD), Neighbor-Joining (NJ) phylogenetic dendrograms, and correspondence analysis. Results: The studied HLA loci were in Hardy–Weinberg Equilibrium. We identified 17 HLA-A, 28 HLA-B, 14 HLA-C, 13 HLA-DRB1, and 5 HLA-DQB1 alleles, of which HLA-A*02 (22.2%), -B*51 (19.5%), -C*07 (20.0%), -DRB1*03 (22.2%), and -DQB1*02 (32.8%) were the most frequent allele lineages. DRB1*03~DQB1*02 (21.2%), DRB1*16~DQB1*05 (17.3%), B*35~C*04 (11.7%), B*08~DRB1*03 (9.7%), A*02~B*51 (7.5%), and A*26~C*07~B*08~DRB1*03~DQB1*02 (4.2%) were the most frequent two- and five-locus HLA haplotypes. Correspondence analysis and dendrograms showed that Emiratis were clustered with the Arabian Peninsula populations (Saudis, Omanis and Kuwaitis), West Mediterranean populations (North Africans, Iberians) and Pakistanis, but were distant from East Mediterranean (Turks, Albanians, Greek), Levantine (Syrians, Palestinians, Lebanese), Iranian, Iraqi Kurdish, and Sub-Saharan populations. Conclusions: Emiratis were closely related to Arabian Peninsula populations, West Mediterranean populations and Pakistanis. However, the contribution of East Mediterranean, Levantine Arab, Iranian, and Sub-Saharan populations to the Emiratis’ gene pool appears to be minor.

1. Introduction

The human leukocyte antigen (HLA) complex is a group of over 200 closely linked genes, located on the short arm of human chromosome 6, spanning 3.6 Mb [1]. HLA genes are extremely polymorphic, with over thirty-six thousand alleles at multiple loci described [1]. HLA genes encode for the cell-surface HLA molecules involved in recognizing processed peptide antigens presented to T lymphocytes [2]. There is a strong linkage disequilibrium (LD) between alleles at different HLA loci, under which specific alleles are inherited together more frequently than expected. HLA allele and haplotype frequencies vary greatly among different populations and ethnic groups [3,4], which makes comparison of HLA frequencies between populations valuable for anthropological studies and understanding the history of human migrations.
The United Arab Emirates (UAE) is situated at the South-East corner of the Arabian Peninsula, west of the Strait of Hormuz, bordering Saudi Arabia to the west and south, and Oman to the east (Figure 1). The UAE spreads over 83,600 km2 area, includes 200 islands, and consists of 7 Emirates which entered into federation in 1971. The current UAE population is about 9.60 million (2018) [5], 11.48% of whom are indigenous Emiratis [6]. Arabic is the official language of the country and is spoken by the indigenous population.
Artifacts discovered at Jebel Faya in the Emirate of Sharjah show that the territory has been inhabited for the past 125,000 years. Neolithic village settlement and Late Stone Age artefacts were also discovered in the Marawah and Baynunah Islands [7]. Historically, the UAE is a central link for connecting Africa with Asia, and the first human migration out of Africa to Asia passed across the UAE [8,9]. More recent migrations into the Arab Peninsula from the Middle East and Asia took place across the Straits of Hormuz, a major trade channel linking the Indian subcontinent and the Gulf States. This migration out of Africa may have had a bearing on the genetic makeup of the present-day Emirati population. The Arab migration in 7th and 11th centuries contributed slightly to the homogenization of the Arabian Peninsula (Saudis, Kuwaitis, Emiratis) and African populations [10]. The notion of the pre-Islamic relatedness between North Africans and Peninsular Arabs is favored by the documented relatedness of Emiratis with Berbers and Basques who remained isolated and did not undergo external genetic exchanges during the 7th and 11th centuries’ Arab migration [10]. It may also be attributed to the fact that Peninsular Arabs are distant from the Arab Levantines, although the Arab migration were earlier, massive, frequent and effective in the Levant [10].
This paper aims to investigate the genetic relatedness between Emiratis and other populations. This is the largest study that examines the origin of present-day Emiratis using HLA family data. We hypothesize that Emiratis are more closely related to Arabian Peninsula, West Mediterranean and Indian subcontinent populations than to East Mediterranean, Levantine Arab, Iranian, and Sub-Saharan populations.

2. Material and Methods

2.1. Study Subjects

Study subjects included 200 unrelated healthy parents from 100 indigenous UAE families, with the average number of siblings in families ranging from 2 to 7. Only families with four haplotypes well-defined by segregation were included in this study. All grandparents of the study subjects lived in the UAE. For comparative purposes, populations from Arabian Peninsula, Asia, Africa and Europe were included, and are detailed in the Supplementary Table S1. The study received an ethical approval from the Institutional Review Board (IRB) at Sheikh Khalifa Medical City in Abu Dhabi.

2.2. DNA Genotyping

Total genomic DNA was prepared from anti-coagulated peripheral venous blood using the QIAmp Blood Mini kit (Qiagen, Hilden, Germany) or the MagNa Pure 96 DNA and Viral NA small volume kit (Roche Diagnostics, Mannheim, Germany) according to the manufacturers’ protocol. DNA samples were stored below −20 °C until analysis. The DNA concentration was quantified using a NanoDrop 2000 C spectrophotometer (ThermoFisher Scientific, Wilmington, DE, USA). HLA class I (A, C and B) and class II (DRB1 and DQB1) genotyping was performed at low-to-intermediate resolution using Luminex LabType Sequence Specific Probe Hybridization (SSO) typing kits (OneLambda Inc., Thermo Fisher, Canoga Park, CA, USA) on a Luminex 200 or Luminex Flexmap 3D instrument, following the manufacturer’s instruction. Briefly, the target DNA was PCR-amplified by the reverse single specific oligonucleotide using group-specific biotinylated primers specifically designed for exons 2 and 3 of HLA class I (HLA-A, -C and -B) and exon 2 for HLA class II (HLA-DRB1 and -DQB1) genes. Biotinylated PCR product was denatured, hybridized to probes in beads and detected by R-Phycoerythrin-conjugated Streptavidin (SAPE) in the Luminex flow analyzer. The instrument has a red laser for beads identification and a green one for phycoerythrin detection. Positive and negative controls were included in each set of beads in order to subtract non-specific background signals and normalize the raw data for possible sample variability and reaction efficiency.
To ensure accuracy of the results, quality control measurements comprised of re-typing 10% of samples with the most common haplotypes using the One Lambda NXType HLA sequencing assay and TypeStream Virtual NGS analysis software v3.0 (One Lambda, Inc., Canoga Park, CA, USA) on Ion Torrent Sequencing System (Thermo Fisher Scientific, Waltham, MA, USA). Our HLA laboratory is accredited by the College of American Pathologists (CAP), American Society of Hostocompatibility and Immunogenetics (ASHI) and ISO15189.

2.3. Statistical Analysis

HLA haplotypes were assigned with certainty by segregation (pedigree) and haplotypes frequencies were obtained by direct counting. The D′ [11], Wn [12], Wa/b and Wb/a [13] measurements of the linkage disequilibrium (LD) were calculated for one-field (allele lineage level) haplotypes using the Phased Or Unphased Linkage Disequilibrium (POULD) R package (v1.0.1) (https://cran.r-project.org/web/packages/pould/pould.pdf), (accessed on 23 November 2022) [14,15]. The conditional asymmetric LD (ALD) measurements, Wa/b and Wb/a, are extensions of the Wn measurement for highly polymorphic loci. Where a Wn value may over-estimate the LD between such loci, the ALD approach allows the investigation of LD for pairs of polymorphic loci in which alleles at one locus may display complete LD with alleles at a second locus, while alleles at the second locus are in a less-than-complete LD with alleles at the first locus. The Wa/b measurement reflects a variation on alleles at the a locus on any of the haplotypes conditioned on b locus alleles, while the Wb/a measurement reflects variation on alleles at the b locus on any of the haplotypes conditions on a locus alleles. HLA allele frequency counts and Hardy–Weinberg Equilibrium (HWE) testing were done using PyPop (Python for Population) genomics, version 0.7.0 (http://www.pypop.org), (accessed on 21 June 2021) [16,17]. For Ewens–Watterson homozygosity (EWH), PyPop was also used in calculating observed (Fobs) and expected (Fexp) homozygosity, and the normalized deviate of the homozygosity (Fnd) for each locus [18,19,20,21]. DISPAN software was used to construct phylogenetic trees (dendrograms) [22] using the neighbor-joining (NJ) method [23,24,25] from matrices of standard genetic distances (SGDs) [25]. Three-dimensional correspondence analysis and bi-dimensional representation based on SGDs were performed using the VISTA version 7.2.8 software [26].

3. Results

3.1. HLA Allele Lineage Frequencies

The studied HLA-A, -C, -B, -DRB1 and -DQB1 frequencies were in Hardy–Weinberg Equilibrium (HWE) in the UAE population (Supplementary Table S2). Frequencies of the allelic lineages of the HLA-A, -C, -B, -DRB1 and -DQB1 are shown in Table 1. Seventeen HLA-A, 28 HLA-B, 14 HLA-C, 13 HLA-DRB1 and 5 HLA-DQB1 allelic lineages were identified in the Emirati population. HLA-A*02 (22.2%), B*51 (19.5%) and C*07 (22.0%) were the most frequent HLA class I allelic lineages in the Emirati families. For the HLA class II, DRB1*03 (22.2%), DQB1*02 (32.7%) and DQB1*05 (29.7%) were the most frequent allelic lineages in the Emirati families.

3.2. Two- and Five-Locus HLA Haplotypes

Linkage Disequilibrium (LD) estimates for two-locus phased haplotypes are shown in Table 2. While D′ and Wn values are often comparable (c.f., values for A~DQB1 and C~DQB1 haplotypes), the ALD values illustrate asymmetry in the LD for specific locus pairs. The ALD measurements (WDRB1/DQB1 and WDQB1/DRB) dissect the variation on each locus conditioned on the other. The highest ALD values are observed between DRB1 and DQB1 and between HLA-B and HLA-C; WDRB1~DQB1 is 0.9, while WDQB1~DRB1 is 0.58, and WB~C is 0.78, while WC~B is 0.64. The lowest LD values are observed between HLA-C and DQB1 and between HLA-A and DQB1; WC~DQB1 is 0.31, while WDQB1~C is 0.19, and WA~DQB1 is 0.22, while WDQB1~A is 0.13. In most cases, where there are large differences in the number of alleles at two loci, the less polymorphic locus displays a lower ALD when conditioned on the more polymorphic locus. Overall, the LD and ALD values are higher between more proximal loci (c.f., B~C vs. A~C, and A~DQB1 vs. DRB1~DQB1), reflecting higher recombination rates over longer physical distances [10].
In the Emirati families, DRB1*03~DQB1*02 (21.3%), DRB1*16~DQB1*05 (17.3%), B*35~C*04 (11.7%), B*08~DRB1*03 (9.7%) and A*02~B*51 (7.5%) were the most frequent two locus haplotypes. Those with significant linkage disequilibrium and frequencies exceeding 1% are shown in Table 3 and the complete list of HLA-class I and -class II two-locus haplotypes are shown in the Supplementary Table S3.
HLA- A*26~C*07~B*08~DRB1*03~DQB1*02 was the most frequent 5-locus HLA haplotype (4.25%) in the studied Emirati sample (Table 4).
To verify the HLA typing done, eighteen samples containing the most common extended haplotypes were re-typed by next generation sequencing (NGS); the haplotypes are listed below:
A*26:01:01~B*08:01:01~C*07:02:01~DRB1*03:01:01~DQB1*02:01:01,
A*02:05:01~B*50:01:01~C*06:02:01~DRB1*07:01:01~DQB1*02:02:01,
A*03:01:01~B*52:01:01~C*12:02:02~DRB1*15:02:01~DQB1*06:01:01,
A*24:02:01~B*08:01:01~C*07:02:01~DRB1*03:01:01~DQB1*02:01:01,
A*02:01:01~B*51:01:01~C*15:13:01~DRB1*04:02:01~DQB1*03:02:01,
A*11:01:01~B*40:06:01~C*15:02:01~DRB1*16:02:01~DQB1*05:02:01
A*33:01:01~B*14:02:01~C*08:01:01~DRB1*01:01:01~DQB1*05:01:01.
High resolution typing by NGS confirmed the accuracy of the low-to-intermediate resolution Luminex-based HLA typing.

3.3. Ewens–Watterson Homozygosity Test of Neutrality

Ewens–Watterson homozygosity (EWH) test results for Emiratis revealed negative Fnd values for the five loci tested, and lower than expected homozygosity under selective neutrality (Supplementary Table S4). Except for the HLA-B locus (p = 0.15), significant deviations were observed for A (p = 0.006), C (p = 0.003), DRB1 (p = 0.005), and DQB1 (p = 0.006). The Ewens–Watterson homozygosity test of neutrality findings suggest that the HLA allele frequency distributions were shaped by balancing selection, conforming with previous works carried out on a worldwide sample of populations [27].

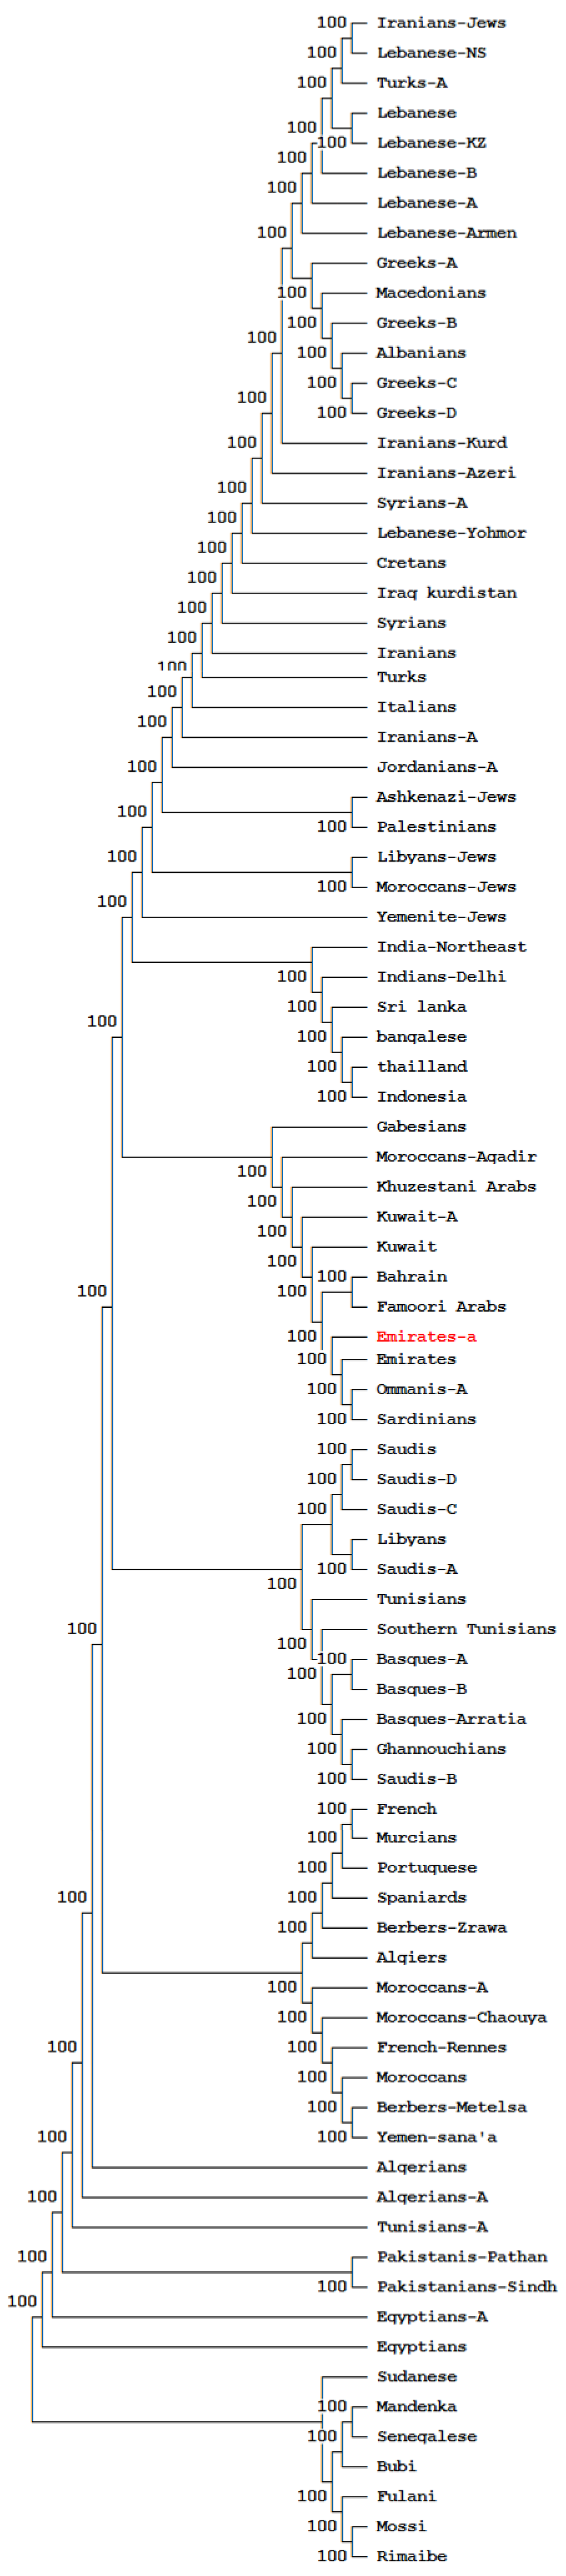
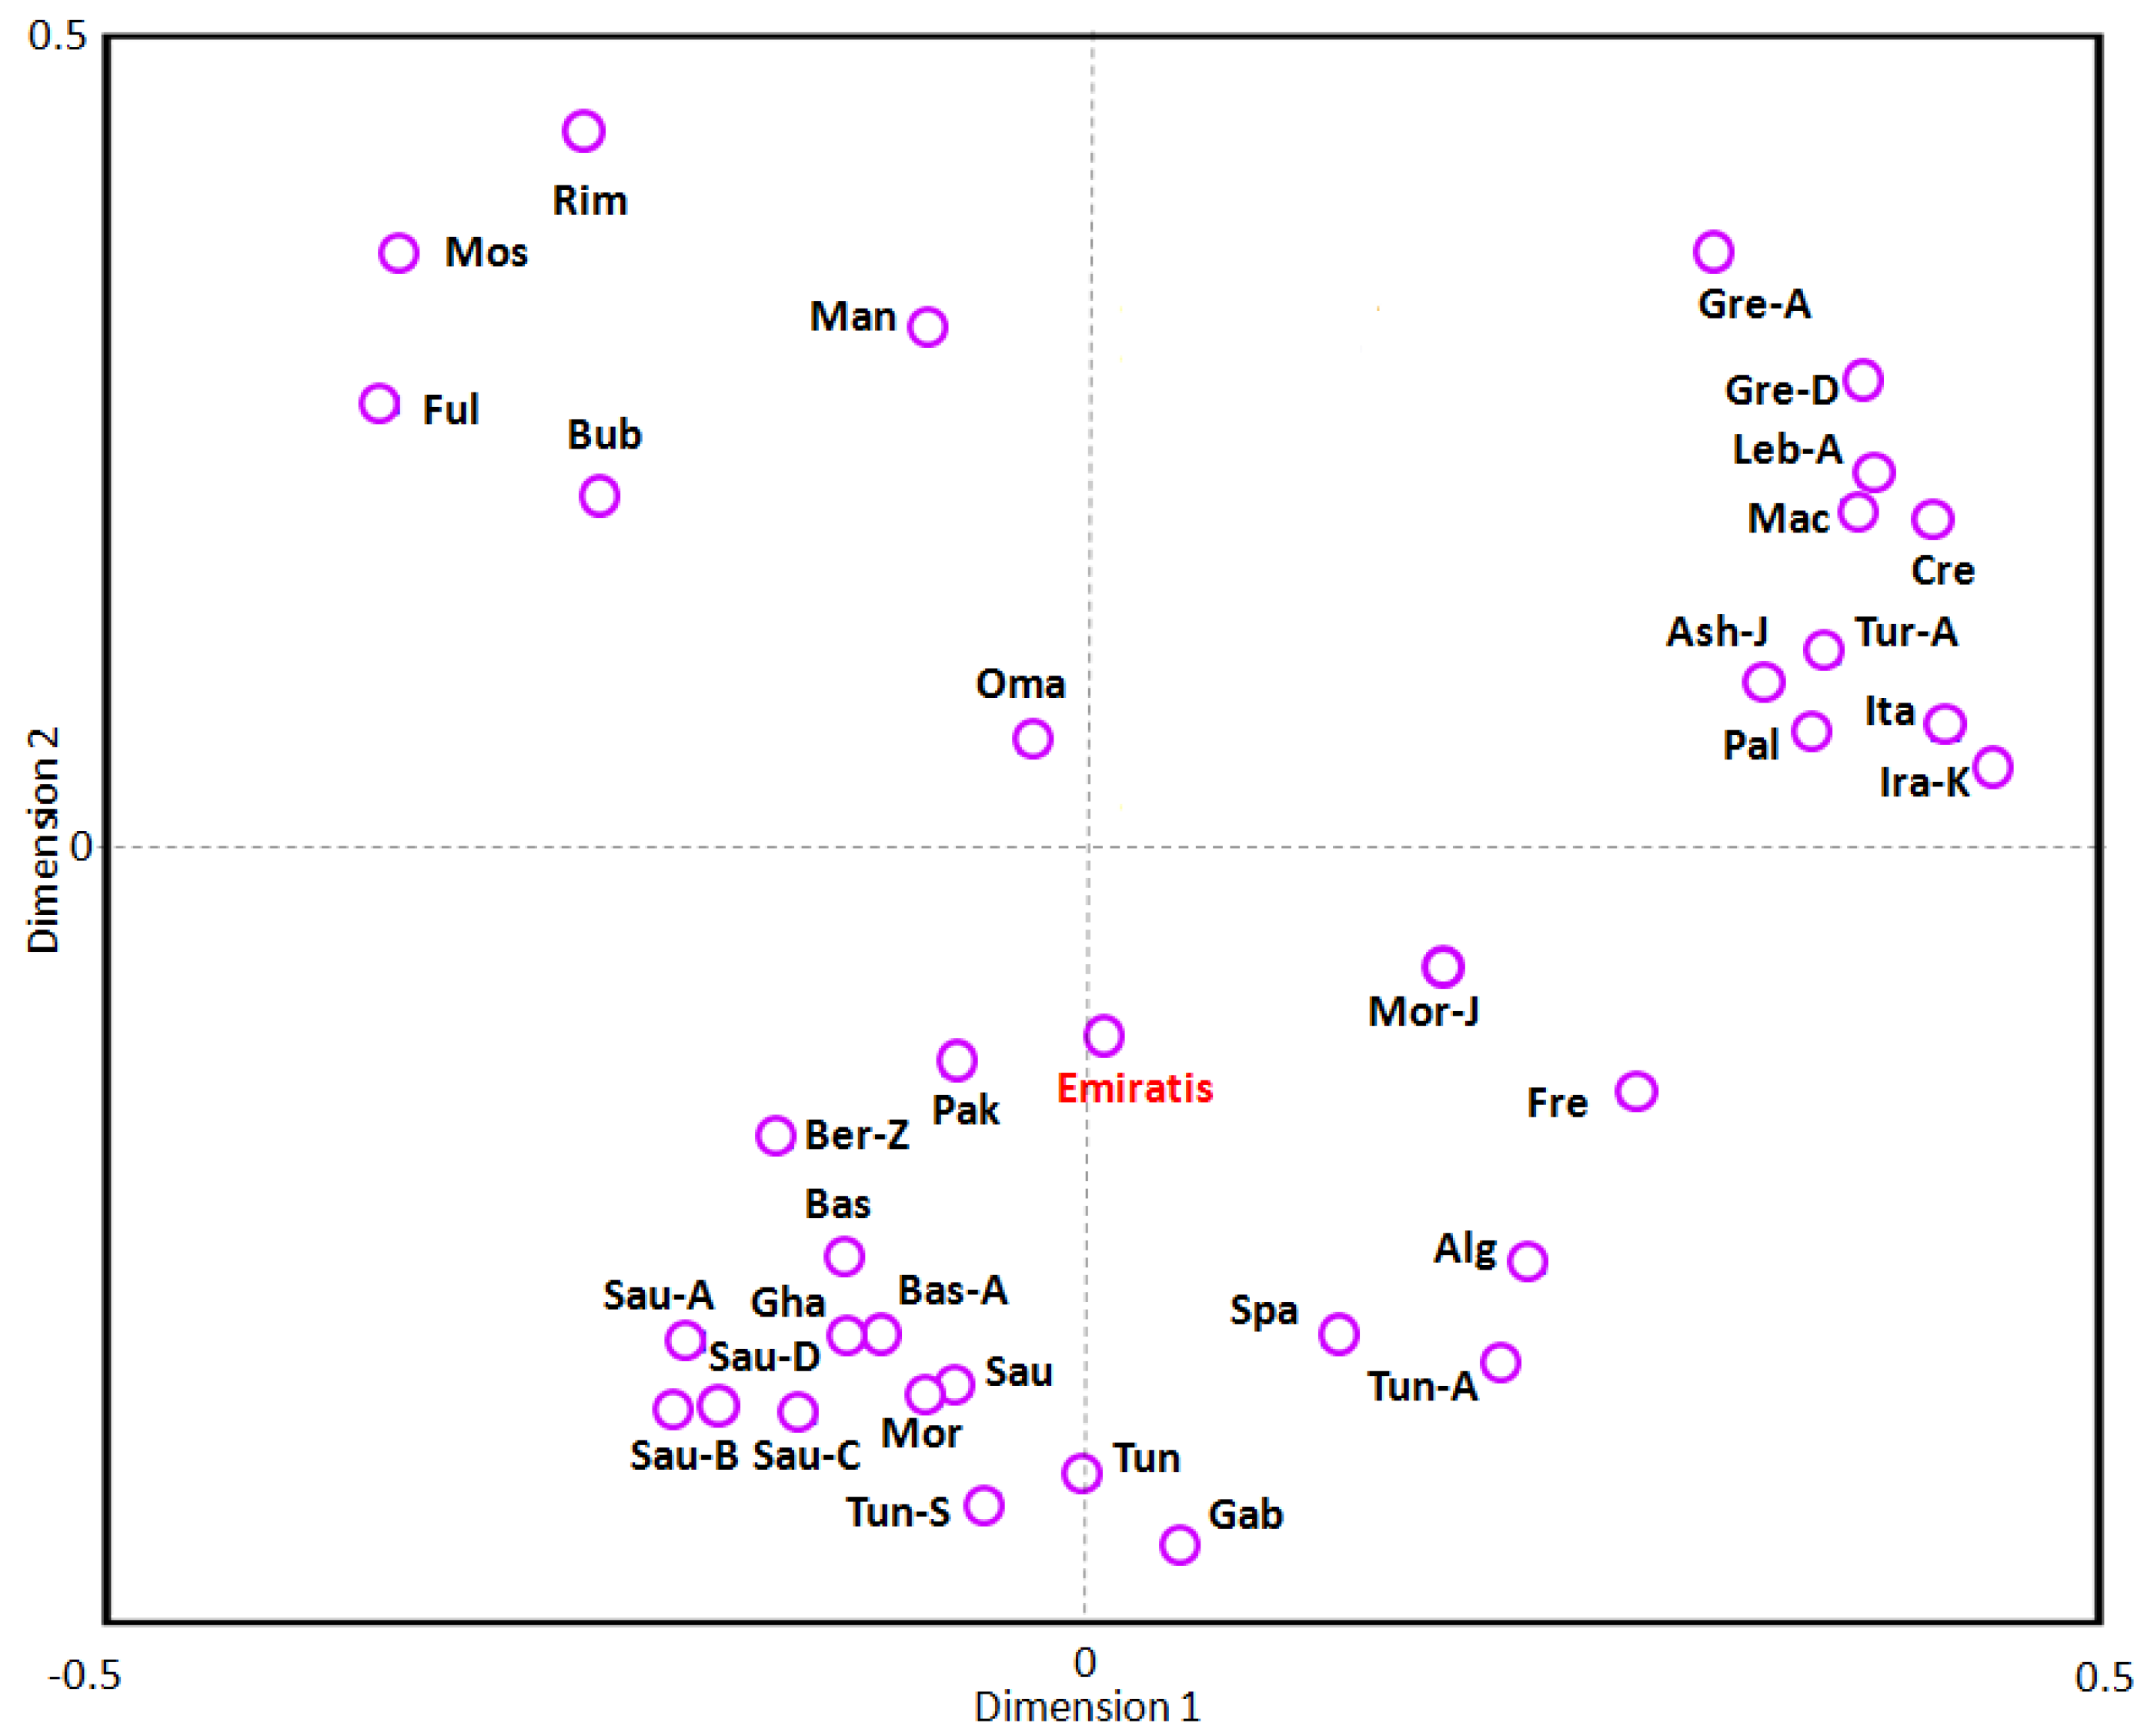
3.4. Phylogenetic and Correspondence Analysis

To construct Neighbor-Joining (NJ) dendrograms and correspondence plots, standard genetic distance (SGD) values are used. SGD values between Emiratis and other populations are shown in Table 5. Omani (0.0276), Saudi (0.0886), North African [as Tunisian (0.1108) and Algerian (0.1127)] and Iberian populations had the closest genetic distance from the investigated Emirati population, while East Mediterranean and Sub-Saharan populations had the highest genetic distance.
NJ dendrograms, based on SGD using HLA-DRB1 allele frequency data from 85 population datasets (Table 5), demonstrated relatedness between Emiratis and other populations (Figure 2). The NJ tree shows clustering of the Emirati population with the Arabian Peninsula (Omanis, and Kuwaitis) and West Mediterranean (North Africans) populations. However, they appear distant from Turkish, Macedonian, Greek, Levantine (Syrians, Palestinians, and Lebanese), Iranian, Iraqi Kurdish, and African Sub-Saharan populations.
Correspondence analysis based on SGD, presenting the relationship between Emiratis and several populations from the Arabian Peninsula, Asia, Africa and Europe according to HLA-A, -B, -DRB1, and -DQB1 allele frequency data is shown in Figure 3. Similar trends were demonstrated, with clustering of the 35 populations into 3 distinct groups. Emiratis cluster with the Arabian Peninsula, Pakistani, North African and Iberian populations.

4. Discussion

This work constitutes an anthropological genetic study on Emiratis and is unique in that it involves HLA family data, a large sample size relative to the total indigenous population, and genotypes for five HLA loci. This was in contrast to earlier studies of the UAE population, which often had small sample sizes, and some even relied on serological HLA data [28,29,30,31]. HLA allelic frequencies of the present study were compared with approximately 90 populations from the three continents.
HLA-A*02 (22.2%) was the most frequent HLA-A allelic lineage in Emiratis. A*02 was also frequent in other Arab populations—Saudis (30.4%), Tunisian Berbers (29.3%), Moroccans (26.2%), Sudanese (25.9%), Iraqi Arabs (14.77), Jordanians (21.3%), and Omanis (21.6%) [32]. This lineage was also observed at comparable frequencies in Mediterranean populations, including Spanish (23.0%), French (Rennes region; 27.0%), and Italians (25.4%) [32]. HLA- B*51 (19.5%) was the most frequent HLA-B allelic lineage in Emiratis and was observed at comparable frequencies in Saudis (19.3%), Iraqi Kurds (15.6%), Turks (15.8%), Sudanese (21.8%), Tunisian (12.2%), Albanian (17.2%), and Greek (15.4%) populations [32]. It is worth mentioning that HLA-B51 is strongly and consistently associated with an increased risk for Behçet’s Disease [33].
In addition, HLA-C*07 was the most common HLA-C allelic lineage in Emiratis (22.0%), and in Saudi (24.9%), Iranian (19.6%), Iraqi Kurd (18.9%), French (25.8%), Italian (24.12%), and Spanish (Murcia region; 25.8%) populations [32]. For class II alleles, DRB1*03 (22.2%) was the most frequent DRB1 allelic lineage in Emiratis. DRB1*03 was previously reported with similar frequencies in Saudi (15.8%), Moroccan (17.1%), Sardinian (27.2%), Iraqi Arab (14.43%), and Turkish (13.0%) populations [28]. Furthermore, HLA-DQB1*02 (32.7%) and -DQB1*05 (29.7%) were the most frequent DQB1 allelic lineage in Emiratis. DQB1*02 was also observed in Iraqi Arab (30.9%), Saudi (35.2%), Moroccan (29.7%), French (26.9%), Spanish (30.8%), and Romanian (27.6%) populations [32].
The most frequent two-locus haplotypes in Emiratis were also seen in Arab and North African populations. HLA-A*02~B*51 (7.5% in Emiratis) was also detected in Pakistani (6.2%), Moroccan (1.14%), Iranian (3.9%), and Macedonian (5.42%) populations [28]. In addition, B*35~C*04 (11.7%), a common haplotype in Emiratis, was also frequent in Pakistani (13.3%) and Macedonian (14.0%) populations [32]. Similarly, B*08-DRB1*03 (9.7% in Emiratis) was also reported for Moroccan (2.1%), Italian (2.9%), and Macedonian (5.4%) populations, and DRB1*03~DQB1*02—a frequent two-locus HLA haplotype (21.2%)—was also seen in Moroccan (9.0%) and Pakistani (21%) populations [32]. The HLA-DRB1*03-DQB1*02 haplotype was shown to confer susceptibility to type 1 Diabetes [34].
HLA-A*26~C*07~B*08~DRB1*03~DQB1*02 was the most frequent 5-locus HLA haplotype (4.25%) in the studied Emirati sample and was also detected in Iraqi Kurdish (2.4%), Iranian (7.8%), and Indian (5.9%) populations [32]. It was the second most common five- locus haplotype in the Kuwaiti population, while A*02~C*06~B*50~DRB1*07~DQB1*02 was the most common haplotype [35,36]. These haplotype results are concordant with those obtained by allele frequency analysis. It is noteworthy that 18 samples containing the most common extended haplotypes were re-typed by high-resolution and included the HLA-A*26:01:01~C*07:02:01~B*08:01:01~DRB1*03:01:01~DQB1*02:01:01 haplotype. A recent small-sized study was concordant with our current findings [31]. This haplotype ranked third and fourth in the U.S., South Asian Indian, and South East Asian populations, respectively (National Marrow Donor Program [NMDP] [37]. It is also the second most common five-locus haplotype in the Kuwaiti population [35]. It has been previously suggested that the HLA-A1 allele in the A1∼C7∼B8∼ DR17∼DQ2 (most frequent in Europeans) was replaced by A26 in the Emirati population [38].
The distribution of HLA-A, -C, -B, -DRB1, and -DQB1 genotypes in Emiratis was compared with those of other Arab, Mediterranean, and Sub-Saharan African populations using genetic distances, NJ dendrograms, and correspondence analysis (Figure 2 and Figure 3). Our results showed that Emiratis appear to be related to West Mediterranean (North African, Iberian, and French) and Arabian Peninsula (Saudi, Kuwaiti, Omani) populations, and relatively distinct from Levantines, Mediterranean East Europeans, Iranian, and Sub-Saharan communities. This suggests a low genetic contribution of Levantine Arabs, Iranians, and Sub-Saharans to the Emirati gene pool.
The relatedness of Emiratis to neighboring Peninsular Arab communities is explained by the fact that Arab Peninsula countries share, with slight differences, similar historical background and the same territory. On the other hand, the relatedness of Emiratis to North African and Iberian populations is likely the result of the mass eastern migration which took place 10,000 years earlier, after the settlement of hyper-arid conditions in the African Sahara [39].

5. Conclusions

Our study, based on genetic distance, NJ dendrograms, and correspondence analysis, showed that Emiratis are related to the Arabian Peninsula, Pakistani, and West Mediterranean populations, but distinct from Levantine, Iranian, and Sub-Saharan communities. An important part of the Emirati genome came from the West.

Supplementary Materials

The following supporting information can be downloaded at: https://www.mdpi.com/article/10.3390/genes14061159/s1, Table S1: Reference populations used in the present work; Table S2: Hardy-Weinberg equilibrium for HLA loci; Table S3: Complete list of HLA Class I and Class II two-Locus haplotypes in Emiratis; Table S4: Ewens–Watterson homozygosity test of neutrality.

Author Contributions

Z.A.Y., M.A. (Marion Alvares), A.A.O., G.E., M.A.S. and M.A. (Marion Alvares) drafted the idea of the research and the research proposal. M.A. (Marion Alvares) retrieved the HLA data from the laboratory information system. A.H. and S.J.M. did data cleaning. S.J.M. and A.H. conducted the data analysis, prepared the tables and contributed to the writing of the statistical components of the study. M.A. (Marion Alvares), Z.A.Y., A.H. and A.A.M. wrote the first draft of the manuscript, which was revised extensively by G.E., W.Y.A., H.A.E., S.J.M., M.A. (Marion Alvares), R.M., A.A.O., M.A. (Medhat Askar), A.N., W.Y.A., A.N. and R.M. prepared the final version of the manuscript for publication. All authors have read and agreed to the published version of the manuscript.

Funding

This research did not receive any specific grant from funding agencies in the public, commercial, or not-for-profit sectors in the UAE. This work was supported by the National Institutes of Health (NIH) and National Institute of Allergy and Infectious Disease (NIAID), grant R01AI128775 (SJM). The content is solely the responsibility of the authors and does not necessarily reflect the official views of the NIAID, NIH, and United States government.

Institutional Review Board Statement

The study protocol was approved by the Institutional Review Boards at SKMC (REC-25-10- 2016 324 RS-445).

Informed Consent Statement

The study received an ethical approval from the Institutional Review Board (IRB) at Sheikh Khalifa Medical City in Abu Dhabi. The research used the existing data from the hospital medical records, and therefore, the informed consent was waived.

Data Availability Statement

The data presented in this study can be found in the article/Supplementary Material; further inquiries can be directed to the corresponding author.

Acknowledgments

The authors are most grateful to the technical staff for data entry and support.

Conflicts of Interest

The authors declare no conflict of interest.

References

  1. HLA Database. 2019. Available online: http://hla.alleles.org (accessed on 20 March 2020).
  2. Marrack, P.; Kappler, J. The antigen-specific, major histocompatibility complex-restricted receptor on T cells. Adv. Immunol. 1986, 38, 1–30. [Google Scholar] [CrossRef] [PubMed]
  3. Nei, M. Phylogenetic analysis in molecular evolutionary genetics. Annu. Rev. Genet. 1996, 30, 371–403. [Google Scholar] [CrossRef]
  4. Gourraud, P.A.; Barnetche, T.; Vidan-Jeras, B.; Cambon-Thomsen, A. Introduction to statistical analysis of population data in immunogenetics. Transpl. Immunol. 2005, 14, 245–253. [Google Scholar] [CrossRef] [PubMed]
  5. Worldometers Counter. 2020. Available online: https://www.worldometers.info/world-population/united-arab-emirates-population/ (accessed on 2 April 2020).
  6. United Arab Emirates Population Statistics 2023. Available online: https://www.globalmediainsight.com/blog/uae-population-statistics/ (accessed on 1 April 2023).
  7. Wikipedia Encyclopedia. Available online: https://en.wikipedia.org/wiki/United_Arab_Emirates (accessed on 27 July 2021).
  8. Armitage, S.J.; Jasim, S.A.; Marks, A.E.; Parker, A.G.; Usik, V.I.; Uerpmann, H.P. The southern route “out of Africa”: Evidence for an early expansion of modern humans into Arabia. Science 2011, 331, 453–456. [Google Scholar] [CrossRef]
  9. Quintana-Murci, L.; Semino, O.; Bandelt, H.J.; Passarino, G.; McElreavey, K.; Santachiara-Benerecetti, A.S. Genetic evidence of an early exit of Homo sapiens sapiens from Africa through eastern Africa. Nat. Genet. 1999, 23, 437–441. [Google Scholar] [CrossRef] [PubMed]
  10. Hajjej, A.; Almawi, W.Y.; Hattab, L.; El-Gaaied, A.; Hmida, S. The investigation of the origin of Southern Tunisians using HLA genes. J. Hum. Genet. 2017, 62, 419–429. [Google Scholar] [CrossRef] [PubMed]
  11. Hedrick, P.W. Gametic Disequilibrium Measures: Proceed With Caution. Genetics 1987, 117, 331–341. [Google Scholar] [CrossRef]
  12. Cramer, H. Mathematical Methods of Statistics; Princeton University Press: Princeton, NJ, USA, 1946. [Google Scholar]
  13. Single, R.M.; Strayer, N.; Thomson, G.; Paunic, V.; Albrecht, M.; Maiers, M. Asymmetric Linkage Disequilibrium: Tools for Assessing Multiallelic LD. Hum. Immunol. 2016, 77, 288–294. [Google Scholar] [CrossRef] [Green Version]
  14. Osoegawa, K.; Mack, S.J.; Prestegaard, M.; Fernández-Viña, M.A. Tools for Building, Analyzing and Evaluating HLA Haplotypes from Families. Hum. Immunol. 2019, 80, 633–643. [Google Scholar] [CrossRef]
  15. Osoegawa, K.; Mallempati, K.C.; Gangavarapu, S.; Oki, A.; Gendzekhadze, K.; Marino, S.R.; Brown, N.K.; Bettinotti, M.P.; Weimer, E.T.; Montero-Martín, G.; et al. HLA alleles and haplotypes observed in 263 US families. Hum. Immunol. 2019, 80, 644–660. [Google Scholar] [CrossRef]
  16. Lancaster, A.K.; Nelson, M.P.; Single, R.M.; Meyer, D.; Thomson, G. PyPop: A Software Framework for Population Genomics: Analyzing Large-Scale Multi-Locus Genotype Data. In Pacific Symposium on Biocomputing 8; Altman, R.B., Dunker, K., Hunter, L., Jung, T., Klein, T., Eds.; World Scientific: Singapore, 2003; pp. 514–525. [Google Scholar]
  17. Lancaster, A.K.; Single, R.M.; Solberg, O.D.; Nelson, M.P.; Thomson, G. PyPop update—A software pipeline for large-scale multilocus population genomics. Tissue Antigens 2007, 69, 192–197. [Google Scholar] [CrossRef] [Green Version]
  18. Ewens, W. The sampling theory of selectively neutral alleles. Theor. Popul. Biol. 1972, 3, 87–112. [Google Scholar] [CrossRef]
  19. Watterson, G. The homozygosity test of neutrality. Genetics 1978, 88, 405–417. [Google Scholar] [CrossRef]
  20. Slatkin, M. An exact test for neutrality based on the Ewens sampling distribution. Genet. Res. 1994, 64, 71–74. [Google Scholar] [CrossRef]
  21. Slatkin, M. A correction to the exact test based on the Ewens sampling distribution. Genet. Res. 1996, 68, 259–260. [Google Scholar] [CrossRef] [Green Version]
  22. Nei, M.; Tajima, Y.; Tateno, Y. Accuracy of estimated phylogenetic trees from molecular data. II. Gen frequency data. J. Mol. Evol. 1983, 19, 153–170. [Google Scholar] [CrossRef]
  23. Saitou, N.; Nei, M. The neighbor-joining method: A new method for reconstructing phylogenetic trees. Mol. Biol. Evol. 1987, 4, 406–425. [Google Scholar] [CrossRef]
  24. Sneath, P.H.A.; Sokal, R.R. Numerical Taxonomy; Freeman: San Francisco, CA, USA, 1973. [Google Scholar]
  25. Nei, M. Genetic distances between populations. Am. Nat. 1972, 106, 283. [Google Scholar] [CrossRef]
  26. Young, F.W.; Bann, C.M. A Visual Statistics System. In Statistical Computing Environments for Social Researches; Stine, R.A., Fox, J., Eds.; Sage Publications: New York, NY, USA, 1996; pp. 207–236. [Google Scholar]
  27. Solberg, O.D.; Mack, S.J.; Lancaster, A.K.; Single, R.M.; Tsai, Y.; Sanchez-Mazas, A.; Thomson, G. Balancing selection and heterogeneity across the classical human leukocyte antigen loci: A meta-analytic review of 497 population studies. Hum. Immunol. 2008, 69, 443–464. [Google Scholar] [CrossRef] [Green Version]
  28. Valluri, V.; Mustafa, M.; Santhosh, A.; Middleton, D.; Alvares, M.; El Haj, E.; Gumama, O.; Abdel-Wareth, L. Frequencies of HLA-A, HLA-B, HLA-DR, and HLA-DQ phenotypes in the United Arab Emirates population. Tissue Antigens 2005, 66, 107–113. [Google Scholar] [CrossRef]
  29. Kulski, J.K.; AlSafar, H.S.; Mawart, A.; Henschel, A.; Tay, G. HLA class I allele lineages and hapltype frequencies in Arabs of the United Arab Emirates. Int. J. Immunogenet. 2019, 46, 152–159. [Google Scholar] [CrossRef] [PubMed]
  30. Arnaiz-Villena, A.; Yafei, Z.A.; Juarez, I.; Palacio-Gruber, J.; Mahri, A.A.; Alvares, M.; Lopez-Nares, A.; Nieto, J.; Al Seiari, M.; Martin-Villa, J.M.; et al. HLA genetic study from United Arab Emirates (UAE), Abu Dhabi. Hum. Immunol. 2019, 80, 421–422. [Google Scholar] [CrossRef] [PubMed]
  31. Alnaqbi, H.; Tay, G.; Chehadeh, S.; Al Safar, H. Characterizing the diversity of MHC conserved extended haplotypes using families from the United Arab Emirates. Sci. Rep. 2022, 12, 7165. [Google Scholar] [CrossRef] [PubMed]
  32. Database of Allele Frequencies. 2019. Available online: http://www.allelefrequencies.net (accessed on 30 March 2020).
  33. Wallace, G.R. HLA-B* 51 the primary risk in Behçet disease. Proc. Natl. Acad. Sci. USA 2014, 111, 8706–8707. [Google Scholar] [CrossRef] [PubMed] [Green Version]
  34. Al Yafei, Z.; Mack, S.J.; Alvares, M.; Ali, B.R.; Al Kaabi, J.; ElGhazali, G. HLA-DRB1 and –DQB1 alleles, haplotypes and genotypes in Emirati patients with Type 1 Diabetes. Front. Genet. 2022, 13, 841879. [Google Scholar] [CrossRef] [PubMed]
  35. Ameen, R.; Shemmari, S.A.; Askar, M. Next-generation sequencing characterization of HLA in multi-generation families of Kuwaiti descent. Hum. Immunol. 2018, 79, 137–142. [Google Scholar] [CrossRef]
  36. Ameen, R.; Al Shemmari, S.H.; Marsh, S.G.E. HLA haplotype frequencies and genetic profiles of the kuwaiti population. Med. Princ. Pract. 2020, 29, 39–45. [Google Scholar] [CrossRef]
  37. NMDP/Be the Match. Available online: https://www.haplostats.org/haplostats?execution=e1s1 (accessed on 21 July 2022).
  38. Santhosh, A.; Mustafa, M.I.; Vijayalakshmi, V. HLA A-B and HLA A-B-DR haplotype frequencies in United Arab Emirates nationals. Emirates Med. J. 2004, 22, 215–220. [Google Scholar]
  39. Arnaiz-Villena, A.; Gomez-Casado, E.; Martinez-Laso, J. Population genetic relationships between Mediterranean populations determined by HLA allele distribution and a historic Perspective. Tissue Antigens 2002, 60, 111–121. [Google Scholar] [CrossRef]
Figure 1. Map of the United Arab Emirates (UAE) and neighboring countries in the Arab Peninsula.
Genes 14 01159 g001
Figure 2. Neighbor-Joining dendrogram, based on Standard genetic distances (SGD), showing relatedness between Emiratis and other populations using HLA-DRB1 allele frequency data. Population data were taken from references detailed in the Supplementary Table S1. Bootstrap values from 1.000 replicates are shown. The studied population (Emiratis) is marked in red.
Genes 14 01159 g002
Figure 3. Correspondence analysis (bi-dimensional representation), based on the standard genetic distances, showing the relationship between Emiratis and worldwide populations according to HLA-A, -B, DRB1, and DQB1 allele frequencies data. Population data were taken from references detailed in the Supplementary Table S1. The studied population (Emiratis) is marked in red.
Genes 14 01159 g003
Table 1. HLA-A, -C, -B, -DRB1 and -DQB1 Allele Frequencies in Emiratis (2n: 400).
A-LocusB-LocusC-LocusDRB1-LocusDQB1-Locus
AlleleFrequencySD *AlleleFrequencySD*AlleleFrequencySD *AlleleFrequencySD *AlleleFrequencySD *
A*020.22250.0208B*510.19500.0198C*070.20000.0200DRB1*030.22250.0208DQB1*020.32750.0235
A*110.09500.0147B*350.13750.0172C*040.15500.0181DRB1*160.17750.0191DQB1*050.29750.0229
A*260.09000.0143B*080.11500.0160C*060.13750.0172DRB1*070.12750.0167DQB1*030.20250.0201
A*010.08500.0140B*500.08250.0138C*150.13000.0168DRB1*040.10250.0152DQB1*060.14000.0174
A*030.08000.0136B*580.05750.0117C*120.09000.0143DRB1*150.09750.0149DQB1*040.03250.0089
A*240.07750.0134B*400.05000.0109C*030.06750.0126DRB1*110.07000.0128
A*320.07500.0132B*140.04500.0104C*160.06750.0126DRB1*130.05500.0114
A*330.06750.0126B*520.03500.0092C*080.04500.0104DRB1*010.04500.0104
A*680.06750.0126B*180.03250.0089C*140.03000.0085DRB1*100.03750.0095
A*300.05500.0114B*150.03000.0085C*020.03000.0085DRB1*080.02250.0074
A*310.03000.0085B*410.02500.0078C*170.02750.0082DRB1*140.02250.0074
A*230.02500.0078B*530.02250.0074C*010.01250.0056DRB1*120.01250.0056
A*740.01000.0050B*370.02000.0070C*050.00500.0035DRB1*090.00750.0043
A*660.00750.0043B*730.01750.0066C*180.00250.0025
A*340.00500.0035B*570.01750.0066
A*290.00500.0035B*070.01750.0066
A*690.00250.0025B*490.01750.0066
B*440.01500.0061
B*380.01250.0056
B*420.01250.0056
B*270.01000.0050
B*450.01000.0050
B*130.00750.0043
B*390.00500.0035
B*560.00250.0025
B*470.00250.0025
B*810.00250.0025
B*550.00250.0025
* SD: Standard Deviation.
Table 2. Linkage Disequilibrium estimates for two-locus phased haplotypes.
Loc1~Loc2D’WnWLoc1/Loc2WLoc2/Loc1N_Haplotypes
A~B0.4800.3730.3230.397140
A~C0.4140.3120.3190.303112
A~DRB10.3090.2350.2390.234117
A~DQB10.2080.2240.2200.12864
B~C0.8450.7490.7830.63765
B~DRB10.52150.4180.4820.337124
B~DQB10.4320.4690.4690.21984
C~DRB10.4060.2800.3270.31796
C~DQB10.3080.3190.3050.19354
DRB1~DQB10.9070.8200.8950.58326
Table 3. Frequent (≥1%) HLA Class I and Class II 2-Locus haplotypes in Emiratis.
HaplotypeFrequencySD *D’χ2p-ValueHaplotypeFrequencySD *D’χ2p-Value
A~B B~C
A*02~B*510.07500.01320.2114.721.0 × 10−4B*41~C*170.01500.00610.59125.70<1.0 × 10−5
A*26~B*080.05250.01120.5385.261.0 × 10−5B*53~C*040.01500.00610.6118.401.8 × 10−5
A*33~B*580.02500.00780.3952.30<1.0 × 10−5B*07~C*070.01500.00610.8219.231.2 × 10−5
A*03~B*500.02500.00780.2524.31<1.0 × 10−5B*57~C*060.01250.00560.6719.99<1.0 × 10−5
A*11~B*400.02500.00780.4540.16<1.0 × 10−5B*38~C*120.01250.00561.0051.20<1.0 × 10−5
A*32~B*350.02250.00740.197.227.2 × 10−3B*42~C*170.01250.00561.00179.06<1.0 × 10−5
A*24~B*080.02000.00700.166.769.3 × 10−3B*15~C*020.01000.00500.3139.12<1.0 × 10−5
A*33~B*140.02000.00700.4042.55<1.0 × 10−5B*45~C*160.01000.00501.0055.82<1.0 × 10−5
A*01~B*370.01500.00610.7346.42<1.0 × 10⁻⁵B~DRB1
A*03~B*520.01500.00610.3823.95<1.0 × 10−5B*08~DRB1*030.09750.01480.80117.49<1.0 × 10−5
A*03~B*180.01000.00500.259.462.1 × 10−3B*50~DRB1*070.04750.01060.5164.97<1.0 × 10−5
A*11~B*410.01000.00500.3411.109.0 × 10−4B*52~DRB1*150.03000.00850.8495.14<1.0 × 10⁻⁵
B~C B*40~DRB1*160.02750.00820.4520.011.0 × 10−5
B*35~C*040.11750.01610.83238.26<1.0 × 10−5B*58~DRB1*030.02500.00780.276.360.0117
B*50~C*060.08000.01360.96210.04<1.0 × 10−5B*14~DRB1*010.01500.00610.3036.43<1.0 × 10−5
B*51~C*150.07000.01280.4344.92<1.0 × 10−5B*14~DRB1*070.01500.00610.247.187.4 × 10−3
B*51~C*160.05250.01120.7262.65<1.0 × 10−5B*18~DRB1*160.01500.00610.347.426.4 × 10−3
B*14~C*080.04500.01041.00400.00<1.0 × 10−5B*37~DRB1*100.01250.00560.6178.06<1.0 × 10−5
B*58~C*030.04500.01040.77198.26<1.0 × 10−5B*41~DRB1*080.01000.00500.4366.45<1.0 × 10−5
B*40~C*150.04000.00980.7783.56<1.0 × 10−5B*53~DRB1*040.01000.00500.3811.706.0 × 10−4
B*52~C*120.03250.00890.92124.57<1.0 × 10−5B*49~DRB1*130.01000.00500.5536.56<1.0 × 10−5
B*51~C*140.03000.00851.0051.07<1.0 × 10−5B*15~DRB1*110.01000.00500.2813.183.0 × 10−4
B*37~C*060.02000.00701.0051.21<1.0 × 10−5B*42~DRB1*030.01000.00500.749.761.8 × 10−3
B*73~C*150.01750.00661.0047.68<1.0 × 10⁻⁵DRB1~DQB1
B*49~C*070.01750.00661.0028.50<1.0 × 10⁻⁵DRB1*03~DQB1*020.21250.02050.93204.69<1.0 × 10−5
B*18~C*120.01750.00660.4933.00<1.0 × 10⁻⁵DRB1*16~DQB1*050.17250.01890.96187.82<1.0 × 10−5
B*07~C*070.01500.00610.95185.92<1.0 × 10⁻⁵DRB1*07~DQB1*020.11000.01570.7976.03<1.0 × 10⁻⁵
DRB1*04~DQB1*030.08750.01410.82119.94<1.0 × 10⁻⁵DRB1*10~DQB1*050.03750.00951.0036.80<1.0 × 10⁻⁵
DRB1*15~DQB1*060.08500.01400.85192.21<1.0 × 10⁻⁵DRB1*14~DQB1*050.02250.00741.0021.74<1.0 × 10⁻⁵
DRB1*11~DQB1*030.06500.01230.9198.28<1.0 × 10⁻⁵DRB1*08~DQB1*040.01250.00560.5480.11<1.0 × 10⁻⁵
DRB1*13~DQB1*060.04750.01060.84101.25<1.0 × 10⁻⁵DRB1*04~DQB1*040.01000.00500.226.150.0131
DRB1*01~DQB1*050.04500.01041.0044.51<1.0 × 10⁻⁵DRB1*12~DQB1*030.01000.00500.7511.190.0008
* SD: Standard Deviation.
Table 4. Most Frequent (≥0.75%) HLA 5-locus Haplotypes in Emiratis.
A~B~C~DRB1~DQB1 HaplotypeFrequency Standard Deviation A~B~C~DRB1~DQB1 HaplotypeFrequency Standard Deviation
A*26~B*08~C*07~DRB1*03~DQB1*020.04250.0101A*11~B*51~C*07~DRB1*16~DQB1*050.01000.0050
A*02~B*50~C*06~DRB1*07~DQB1*020.01500.0061A*32~B*08~C*07~DRB1*03~DQB1*020.01000.0050
A*03~B*52~C*12~DRB1*15~DQB1*060.01500.0061A*01~B*37~C*06~DRB1*10~DQB1*050.01000.0050
A*02~B*08~C*07~DRB1*03~DQB1*020.01500.0061A*11~B*41~C*07~DRB1*08~DQB1*030.01000.0050
A*24~B*08~C*07~DRB1*03~DQB1*020.01500.0061A*03~B*50~C*06~DRB1*07~DQB1*020.00750.0043
A*01~B*51~C*15~DRB1*03~DQB1*020.01250.0056A*68~B*35~C*04~DRB1*04~DQB1*030.00750.0043
A*33~B*14~C*08~DRB1*01~DQB1*050.01250.0056A*03~B*50~C*06~DRB1*04~DQB1*040.00750.0043
A*02~B*51~C*15~DRB1*04~DQB1*030.01250.0056A*01~B*58~C*03~DRB1*03~DQB1*020.00750.0043
A*11~B*40~C*15~DRB1*16~DQB1*050.01250.0056A*26~B*51~C*14~DRB1*15~DQB1*060.00750.0043
A*33~B*58~C*03~DRB1*03~DQB1*020.01000.0050A*11~B*40~C*15~DRB1*03~DQB1*020.00750.0043
A*68 B*14 C*08 DRB1*07 DQB1*020.01000.0050A*32~B*18~C*12~DRB1*16~DQB1*050.00750.0043
A*33 B*58 C*03 DRB1*16 DQB1*050.01000.0050A*02~B*51~C*16~DRB1*16~DQB1*050.00750.0043
A*02 B*35 C*04 DRB1*16 DQB1*050.01000.0050
Table 5. Standard genetic distances (SGD) between Emiratis and other populations.
HLA-A, -B, -DRB1, and -DQB1 (35 Populations)HLA-DRB1 (85 Populations)
PopulationSGD *PopulationSGDPopulationSGD
Oman0.0276Emirates0.0012Italy0.2688
Saudi Arabia-B0.0886Kuwait-A0.0456Spain-Basques-B0.2703
Saudi Arabia-C0.0930Oman-A0.0589Greece-Cretans0.2738
Saudi Arabia0.0982Bahrain0.0594Iran-A0.2799
Tunisia-A0.1108Sardinia0.0622Iraq-kurdistan0.2899
Algeria0.1127Khuzestani0.1068Jordan-A0.3086
Spain0.1139Algeria-A0.1178Egypt-A0.3235
Saudi Arabia-D0.1140Kuwait0.1186India-Northeast0.3269
Tunisia-Gabes0.1246Tunisia-A0.1267Iran-Kurd0.3316
Morocco0.1258Morocco-Agadir0.1310Palestine0.3322
France0.1344Algeria0.1447Greece-D0.3470
Pakistan0.1380Algeria0.1473Egyptians0.3498
Macedonia0.1409Saudi Arabia-C0.1522Greece-C0.3568
Greece-Cretans0.1436Saudi Arabia-B0.1530Ashkenazi-Jews0.3582
Italy0.1442Gabesians0.1590Syria-A0.3704
Tunisia0.1530Tunisia0.1643Syria0.3799
South Tunisia0.1569Saudi Arabia-D0.1716Albania0.3813
Iraq-Kurdis0.1598Morocco-A0.1747Sudan0.3844
Saudi Arabia-A0.1732Spain-Spaniards0.1770Greece-A0.3944
Greece-D0.1786Saudi Aarbia0.1780Iran-Azeri0.4072
Spain-Basques0.1883Southern Tunisia0.1817Moroccans-Jews0.4130
Tunisia-Ghannouch0.1917Tunisia- Berbers-Met0.1914Lebanon-Yohmor0.4397
Palestine0.2118Portugal0.1995Sri lanka0.4477
Greece-A0.2213Morocco0.2001Libya-Jews0.4537
Spain-Basques0.2226Libya0.2022Lebanon-B0.4603
Ashkenazi-j0.2264France-Rennes0.2024Thailland0.4689
Morocco-Jews0.2450Basques-A0.2053Lebanon-Armen0.4896
Turkey-A0.2564France0.2147Bangladesh0.4928
Spain-Berbers0.2775Tunisia-Berbers0.2169Turkey-A0.5012
Lebanon-A0.2817Iran-Famoori0.2170Lebanon-A0.5068
Guinea-Bubi0.4143Morocco-Chaouya0.2170Lebanon-KZ0.5378
Senegal-Mandenka0.4218Yemen-sana’a0.2278Lebanon0.5956
Mali-Fulani0.4509Pakistan-Sindh0.2284Senegal0.6885
Mali- Mossi0.5496Tunisia-Ghannouchians0.2292Senegal-Mandenka0.7174
Mali-Rimaibe0.6432Macedonia0.2314Iran-Jews0.7476
Basques-Arratia0.2390Lebanon-NS0.7612
Turkey0.2394Guinia-Bubi0.7675
Pakistan-Pathan0.2414Indonesia0.9049
India-Delhi0.2465Mali-Fulani1.0674
Yemen-Jews0.2533Mali-Mossi1.3297
Murcians0.2616Rimaibe1.4181
Greeks-B0.2642
Iranians0.2688
* SGD: standard genetic distance.
Disclaimer/Publisher’s Note: The statements, opinions and data contained in all publications are solely those of the individual author(s) and contributor(s) and not of MDPI and/or the editor(s). MDPI and/or the editor(s) disclaim responsibility for any injury to people or property resulting from any ideas, methods, instructions or products referred to in the content.

