
Human Adult Astrocyte Extracellular Vesicle Transcriptomics Study Identifies Specific RNAs Which Are Preferentially Secreted as EV Luminal Cargo
 , and
, and
Abstract
:1. Introduction
2. Materials and Methods
2.1. Poly-L-lysine Coating of Culture Plates
2.2. Astrocytes Culture
2.3. RNA Isolation from the Astrocyte (Cells)
2.4. Library Preparation for Cell RNA Sequencing (Novogene, UK)
2.5. Bioinformatics Analysis mRNA-seq
2.6. EV Preparation
2.7. Negative Staining for TEM
2.8. Immuno-Negative Staining for TEM
2.9. Nanoparticle Tracking Analysis
2.10. Exoview R100 (Nanoview Biosciences, USA)
2.11. Protein Quantification
2.12. Proteinase K and RNase A/T1 Treatment of EVs
2.13. RNA Extraction for the miRNA-seq
2.14. miRNA-seq
2.15. miRNA Target Analysis
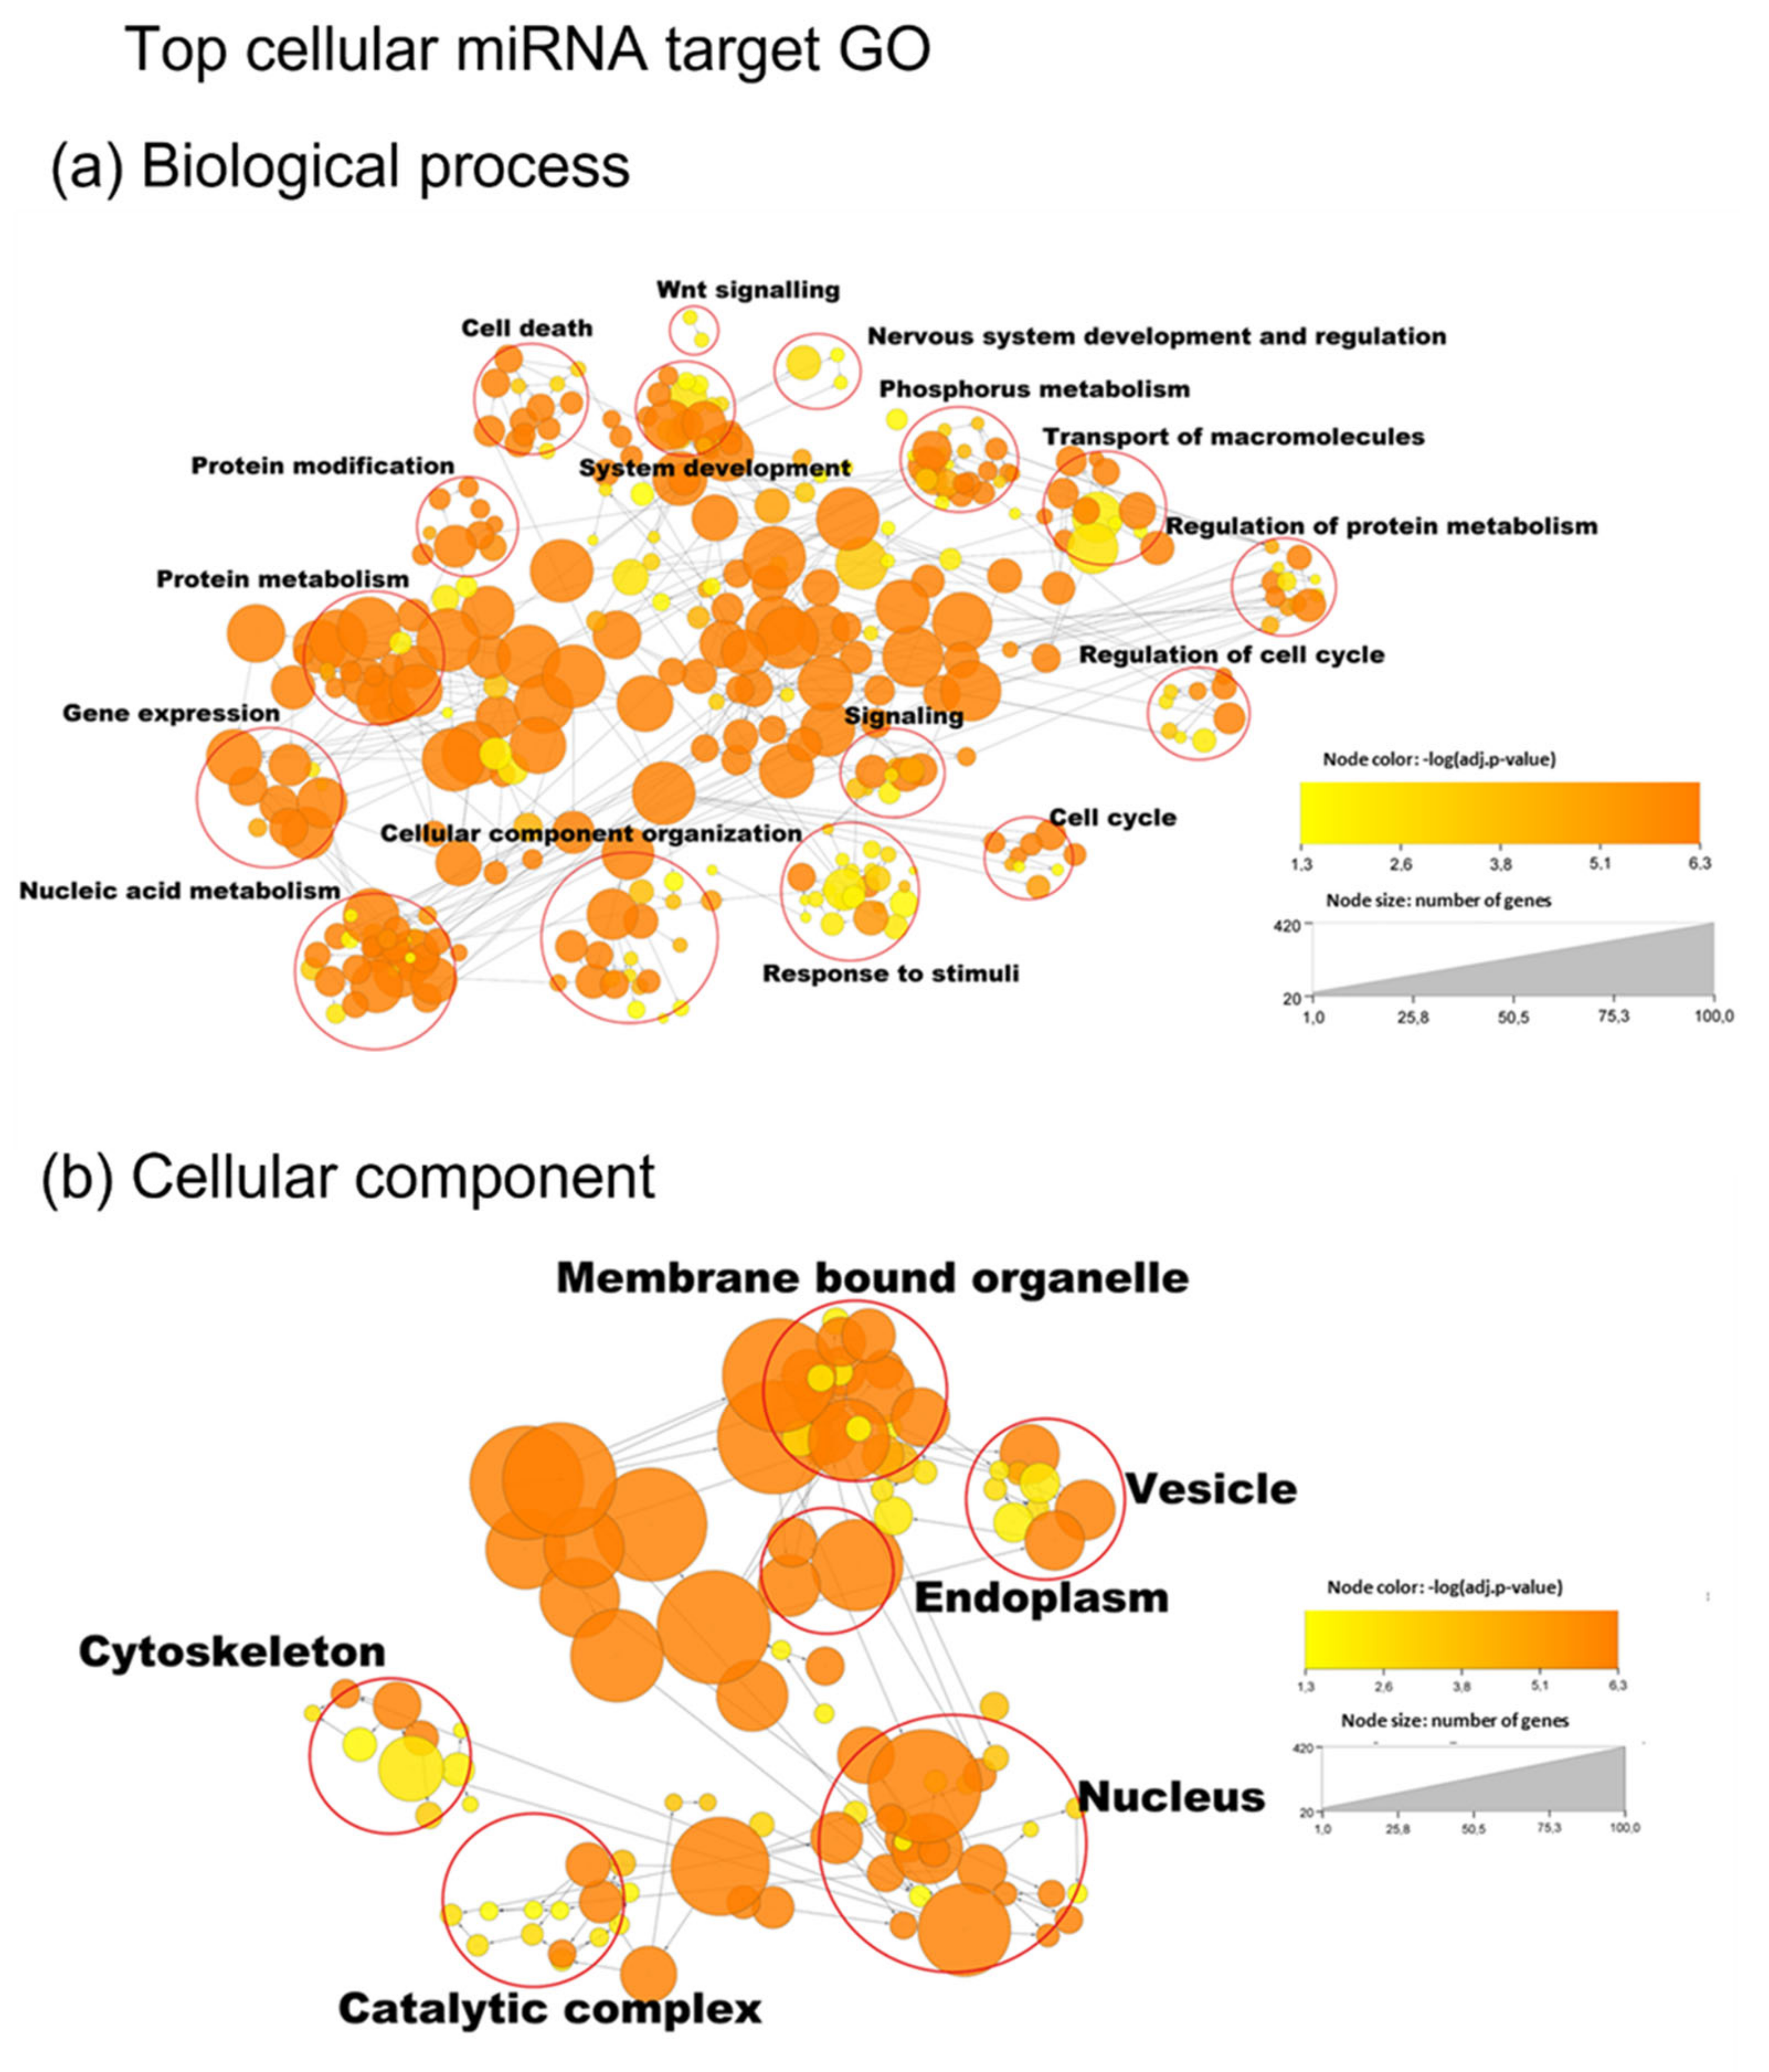
2.16. GO Enrichment Analysis
3. Results
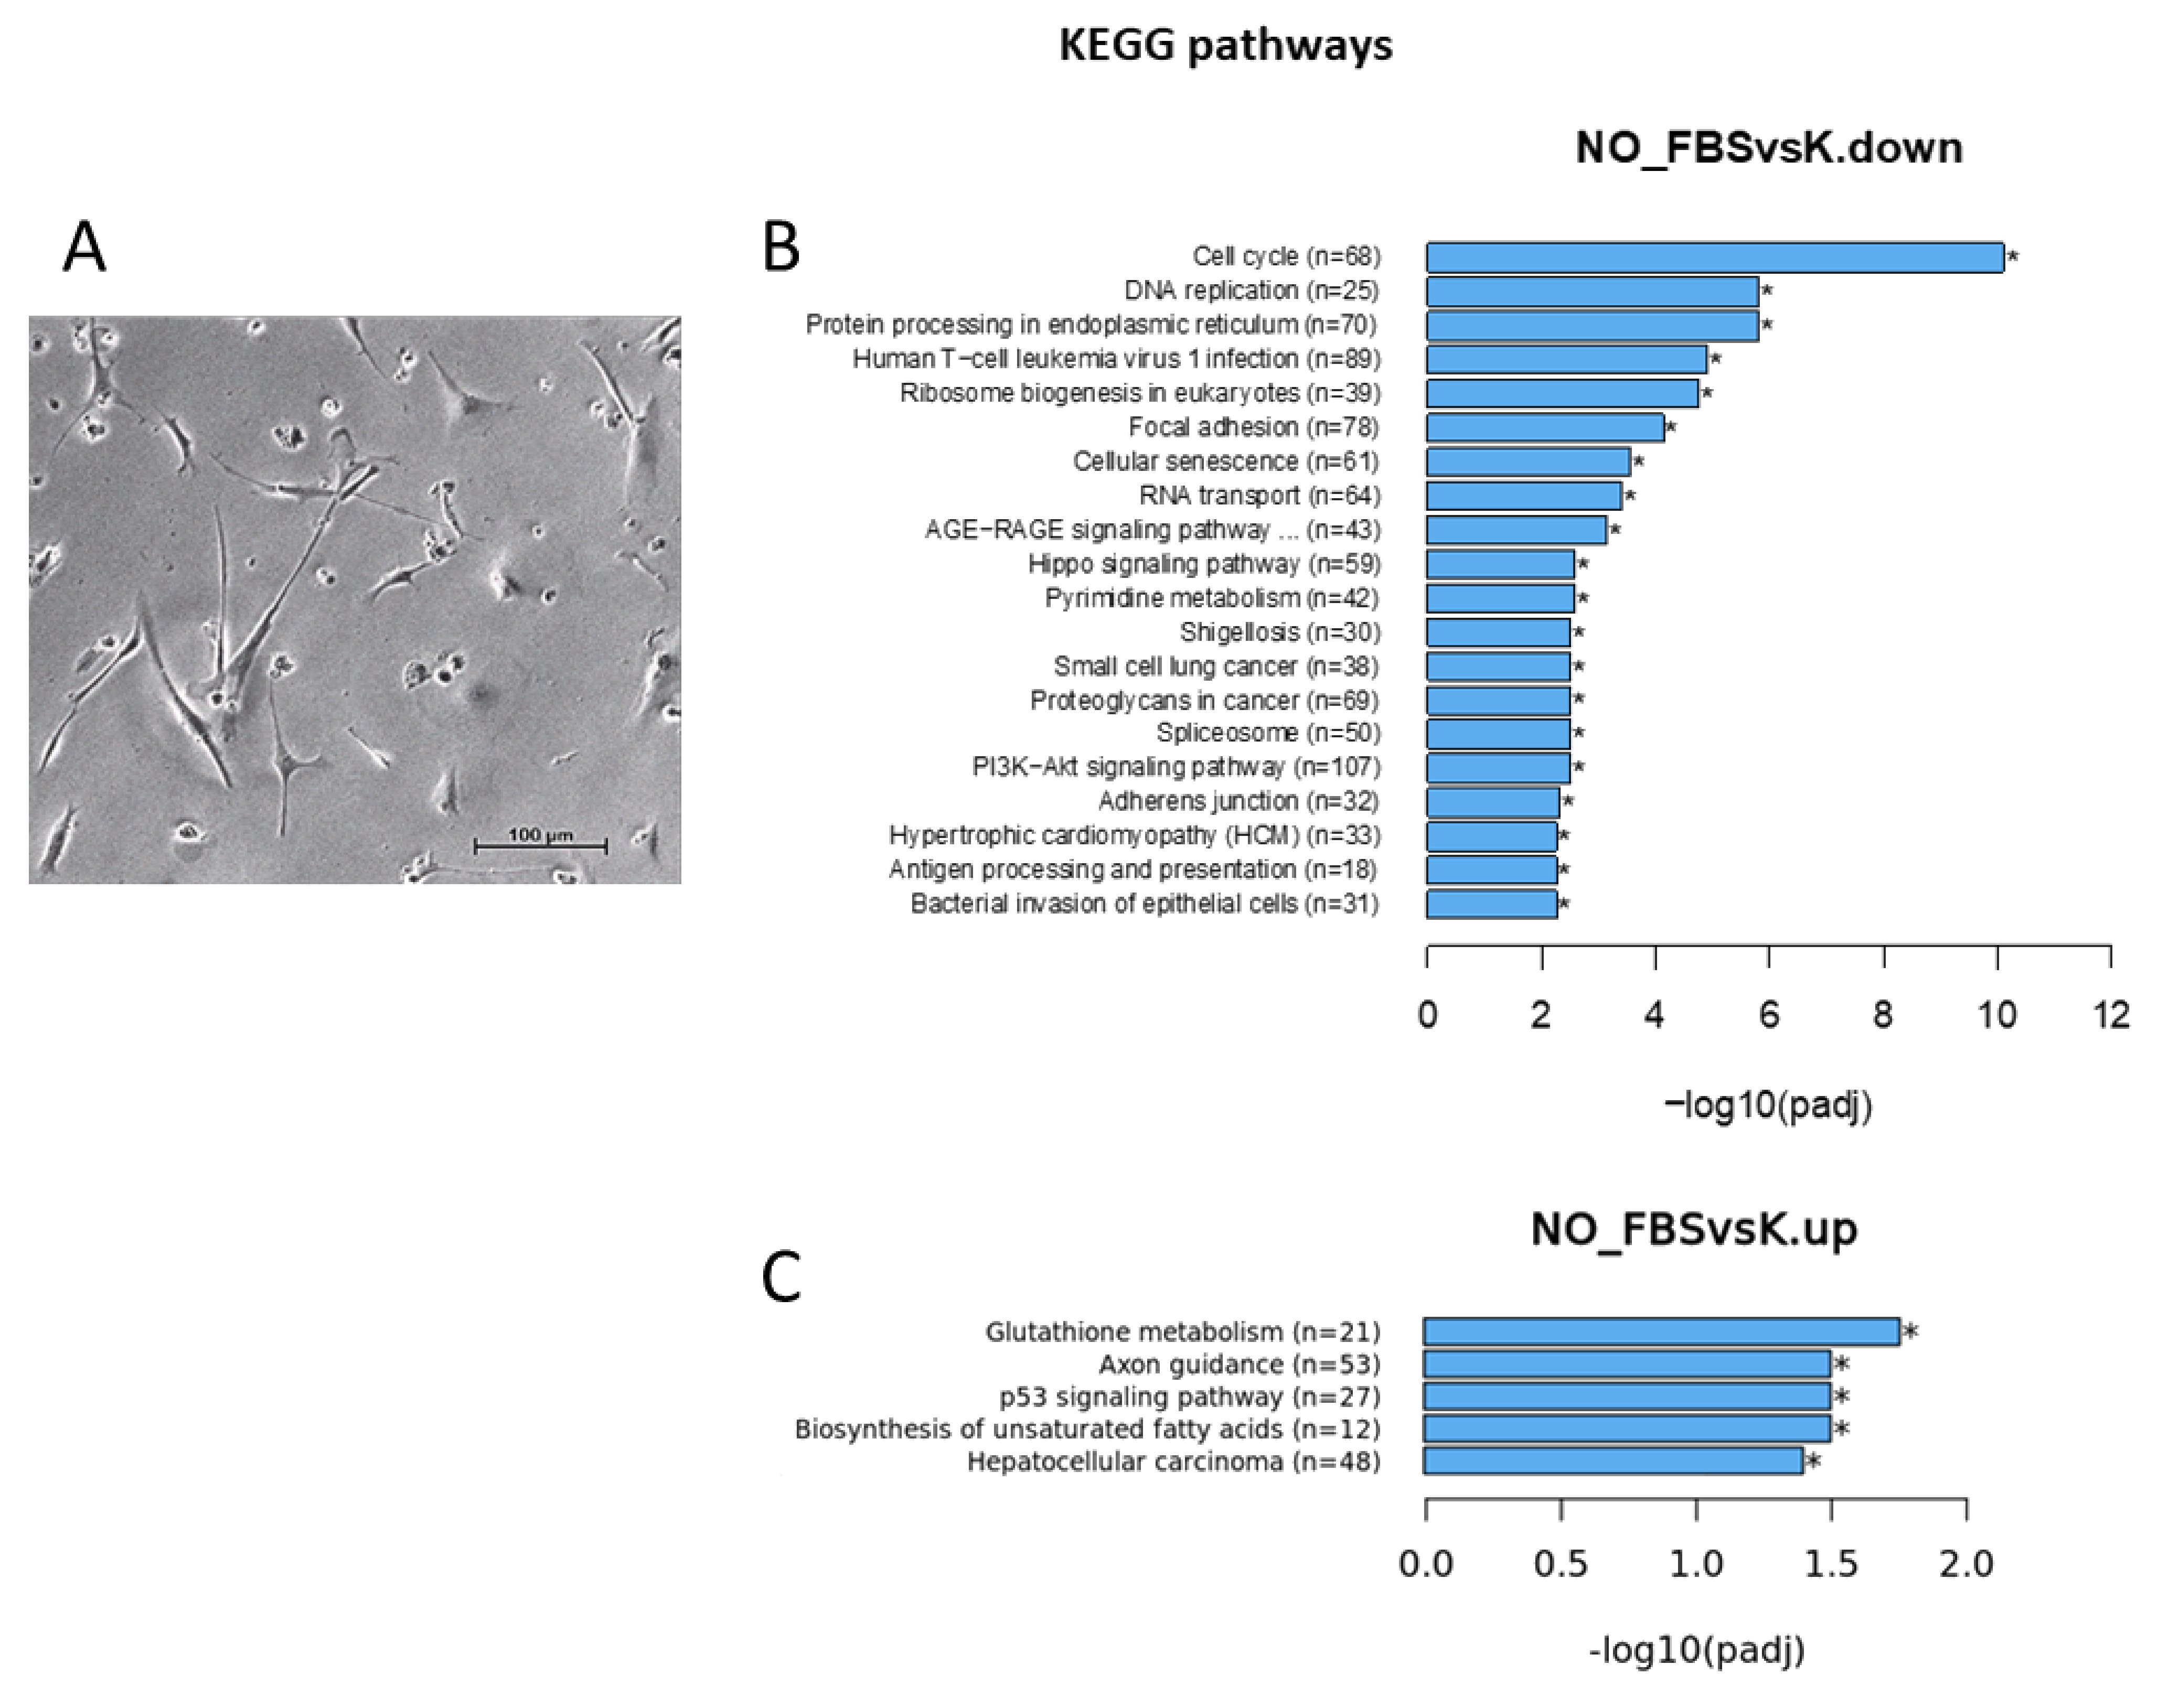
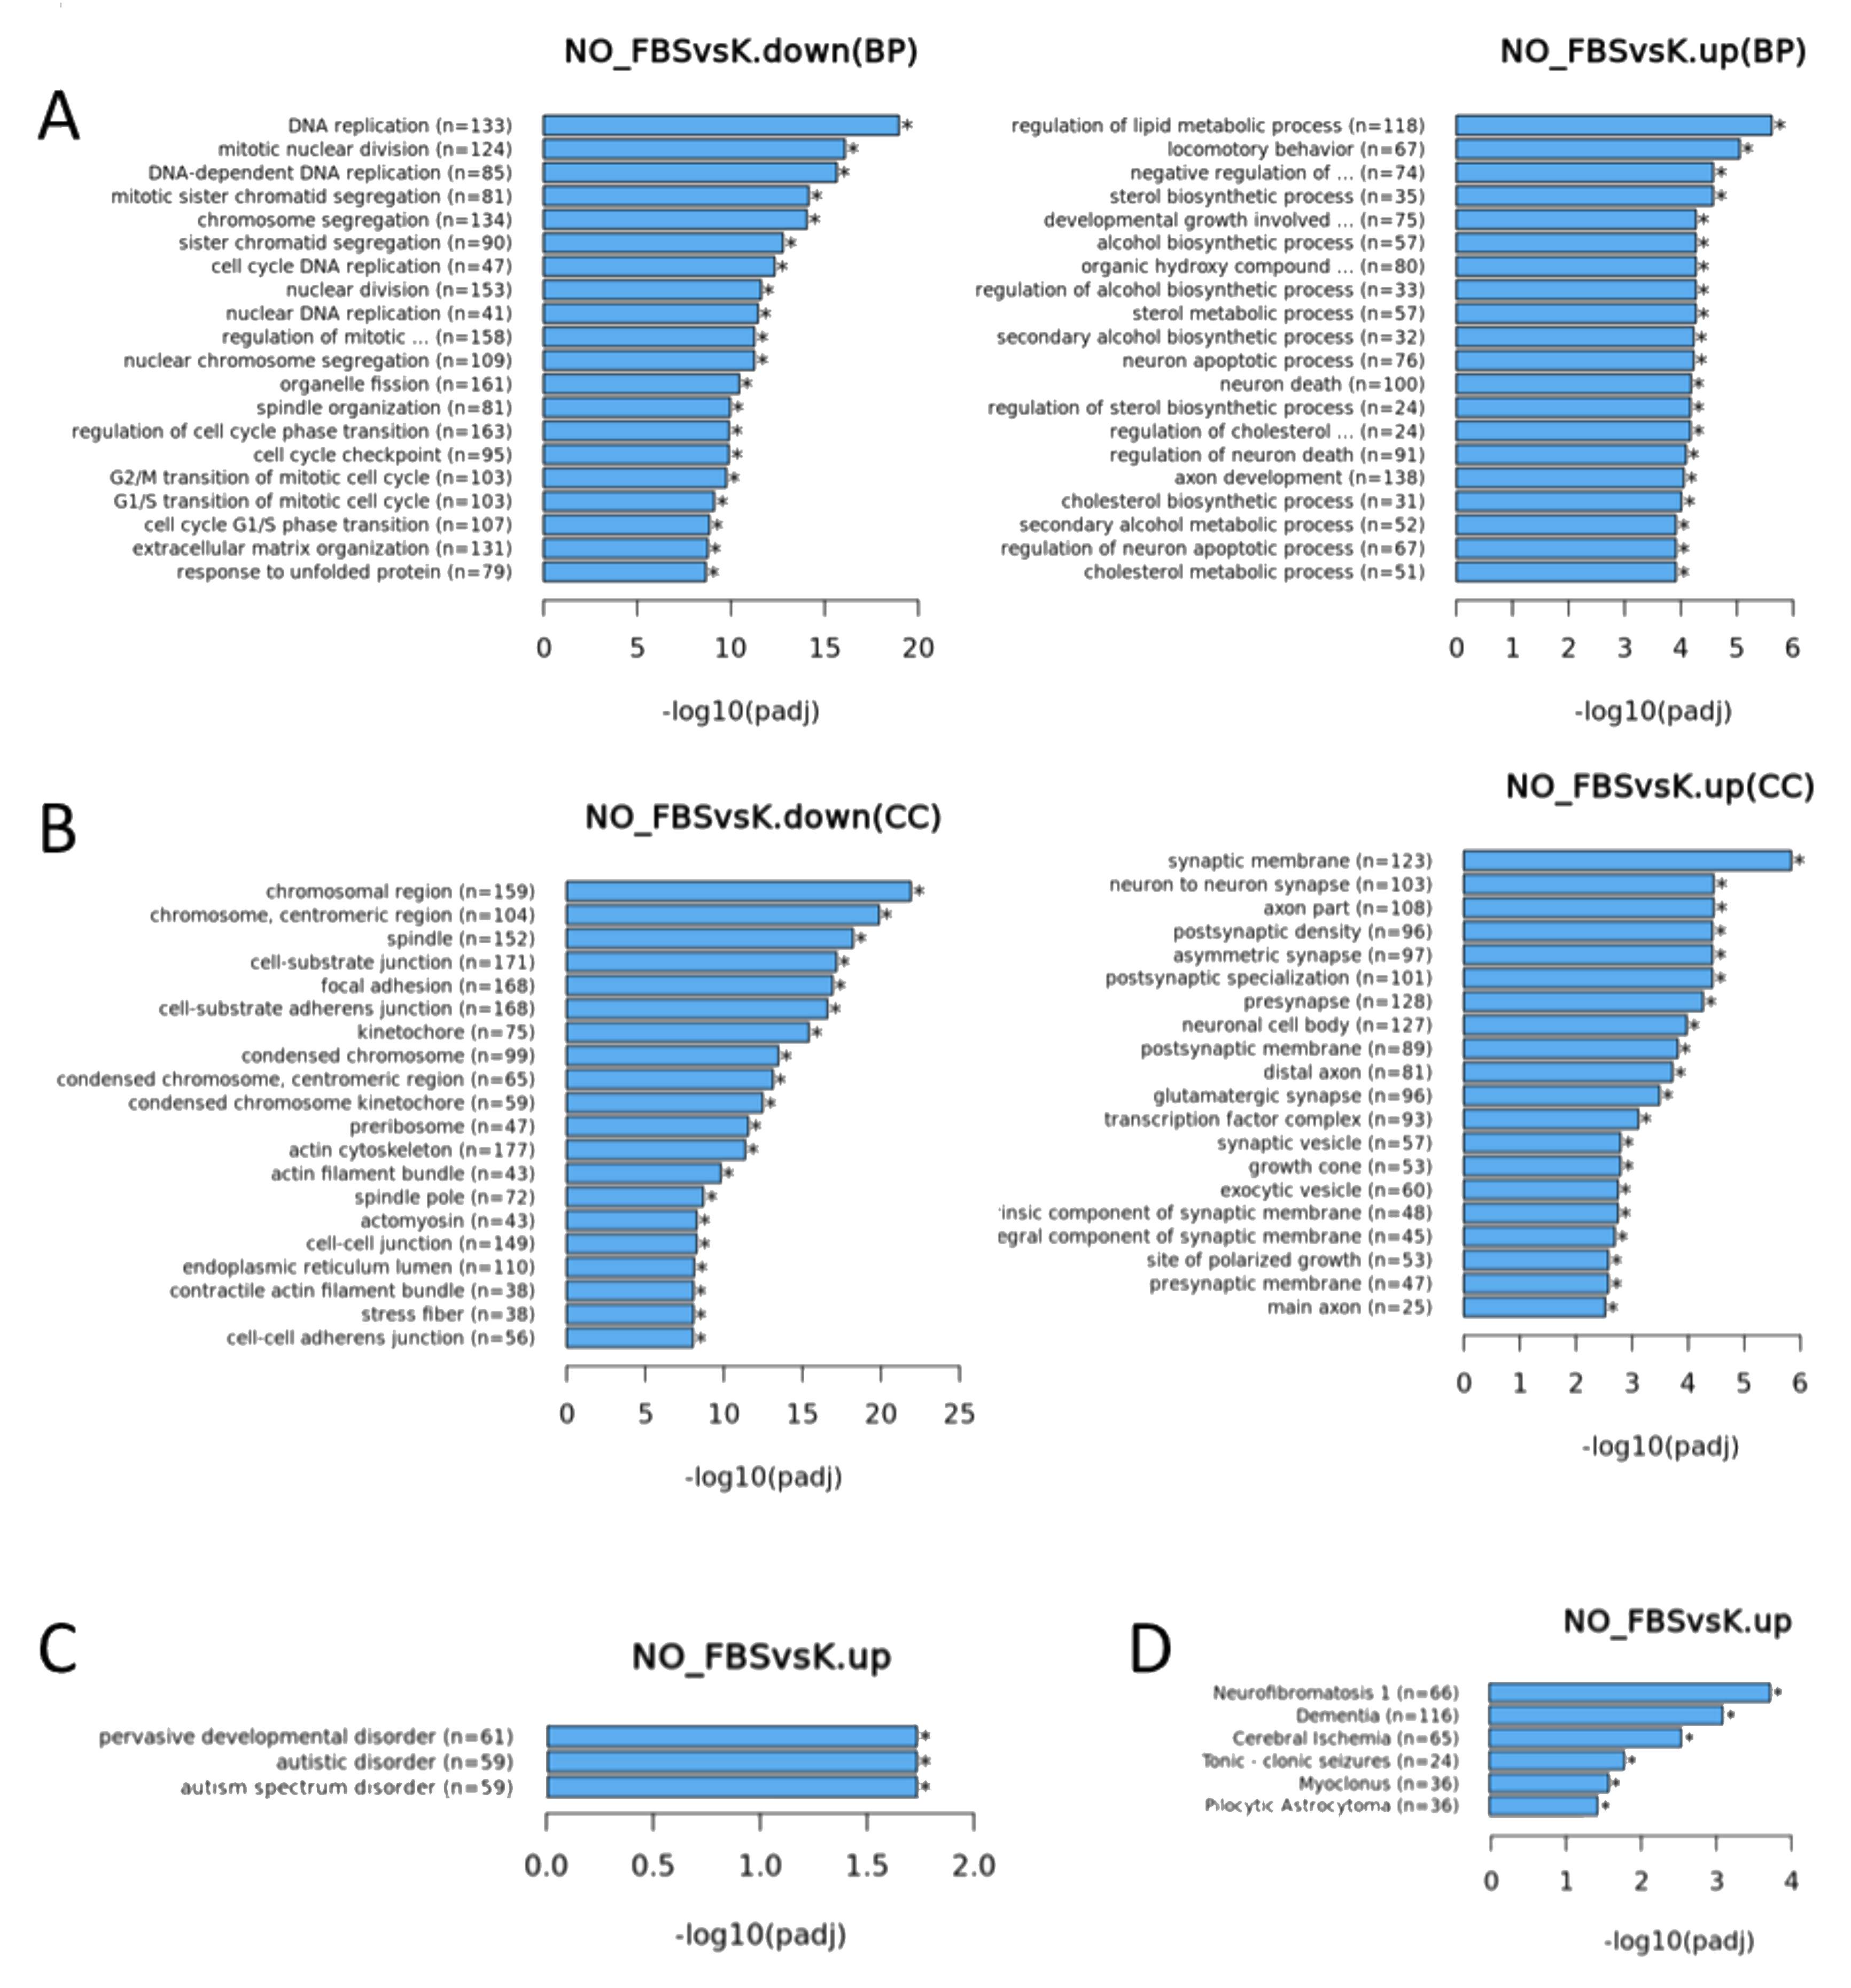
3.1. Cells Transcriptome Change in Response to the Removal of FBS
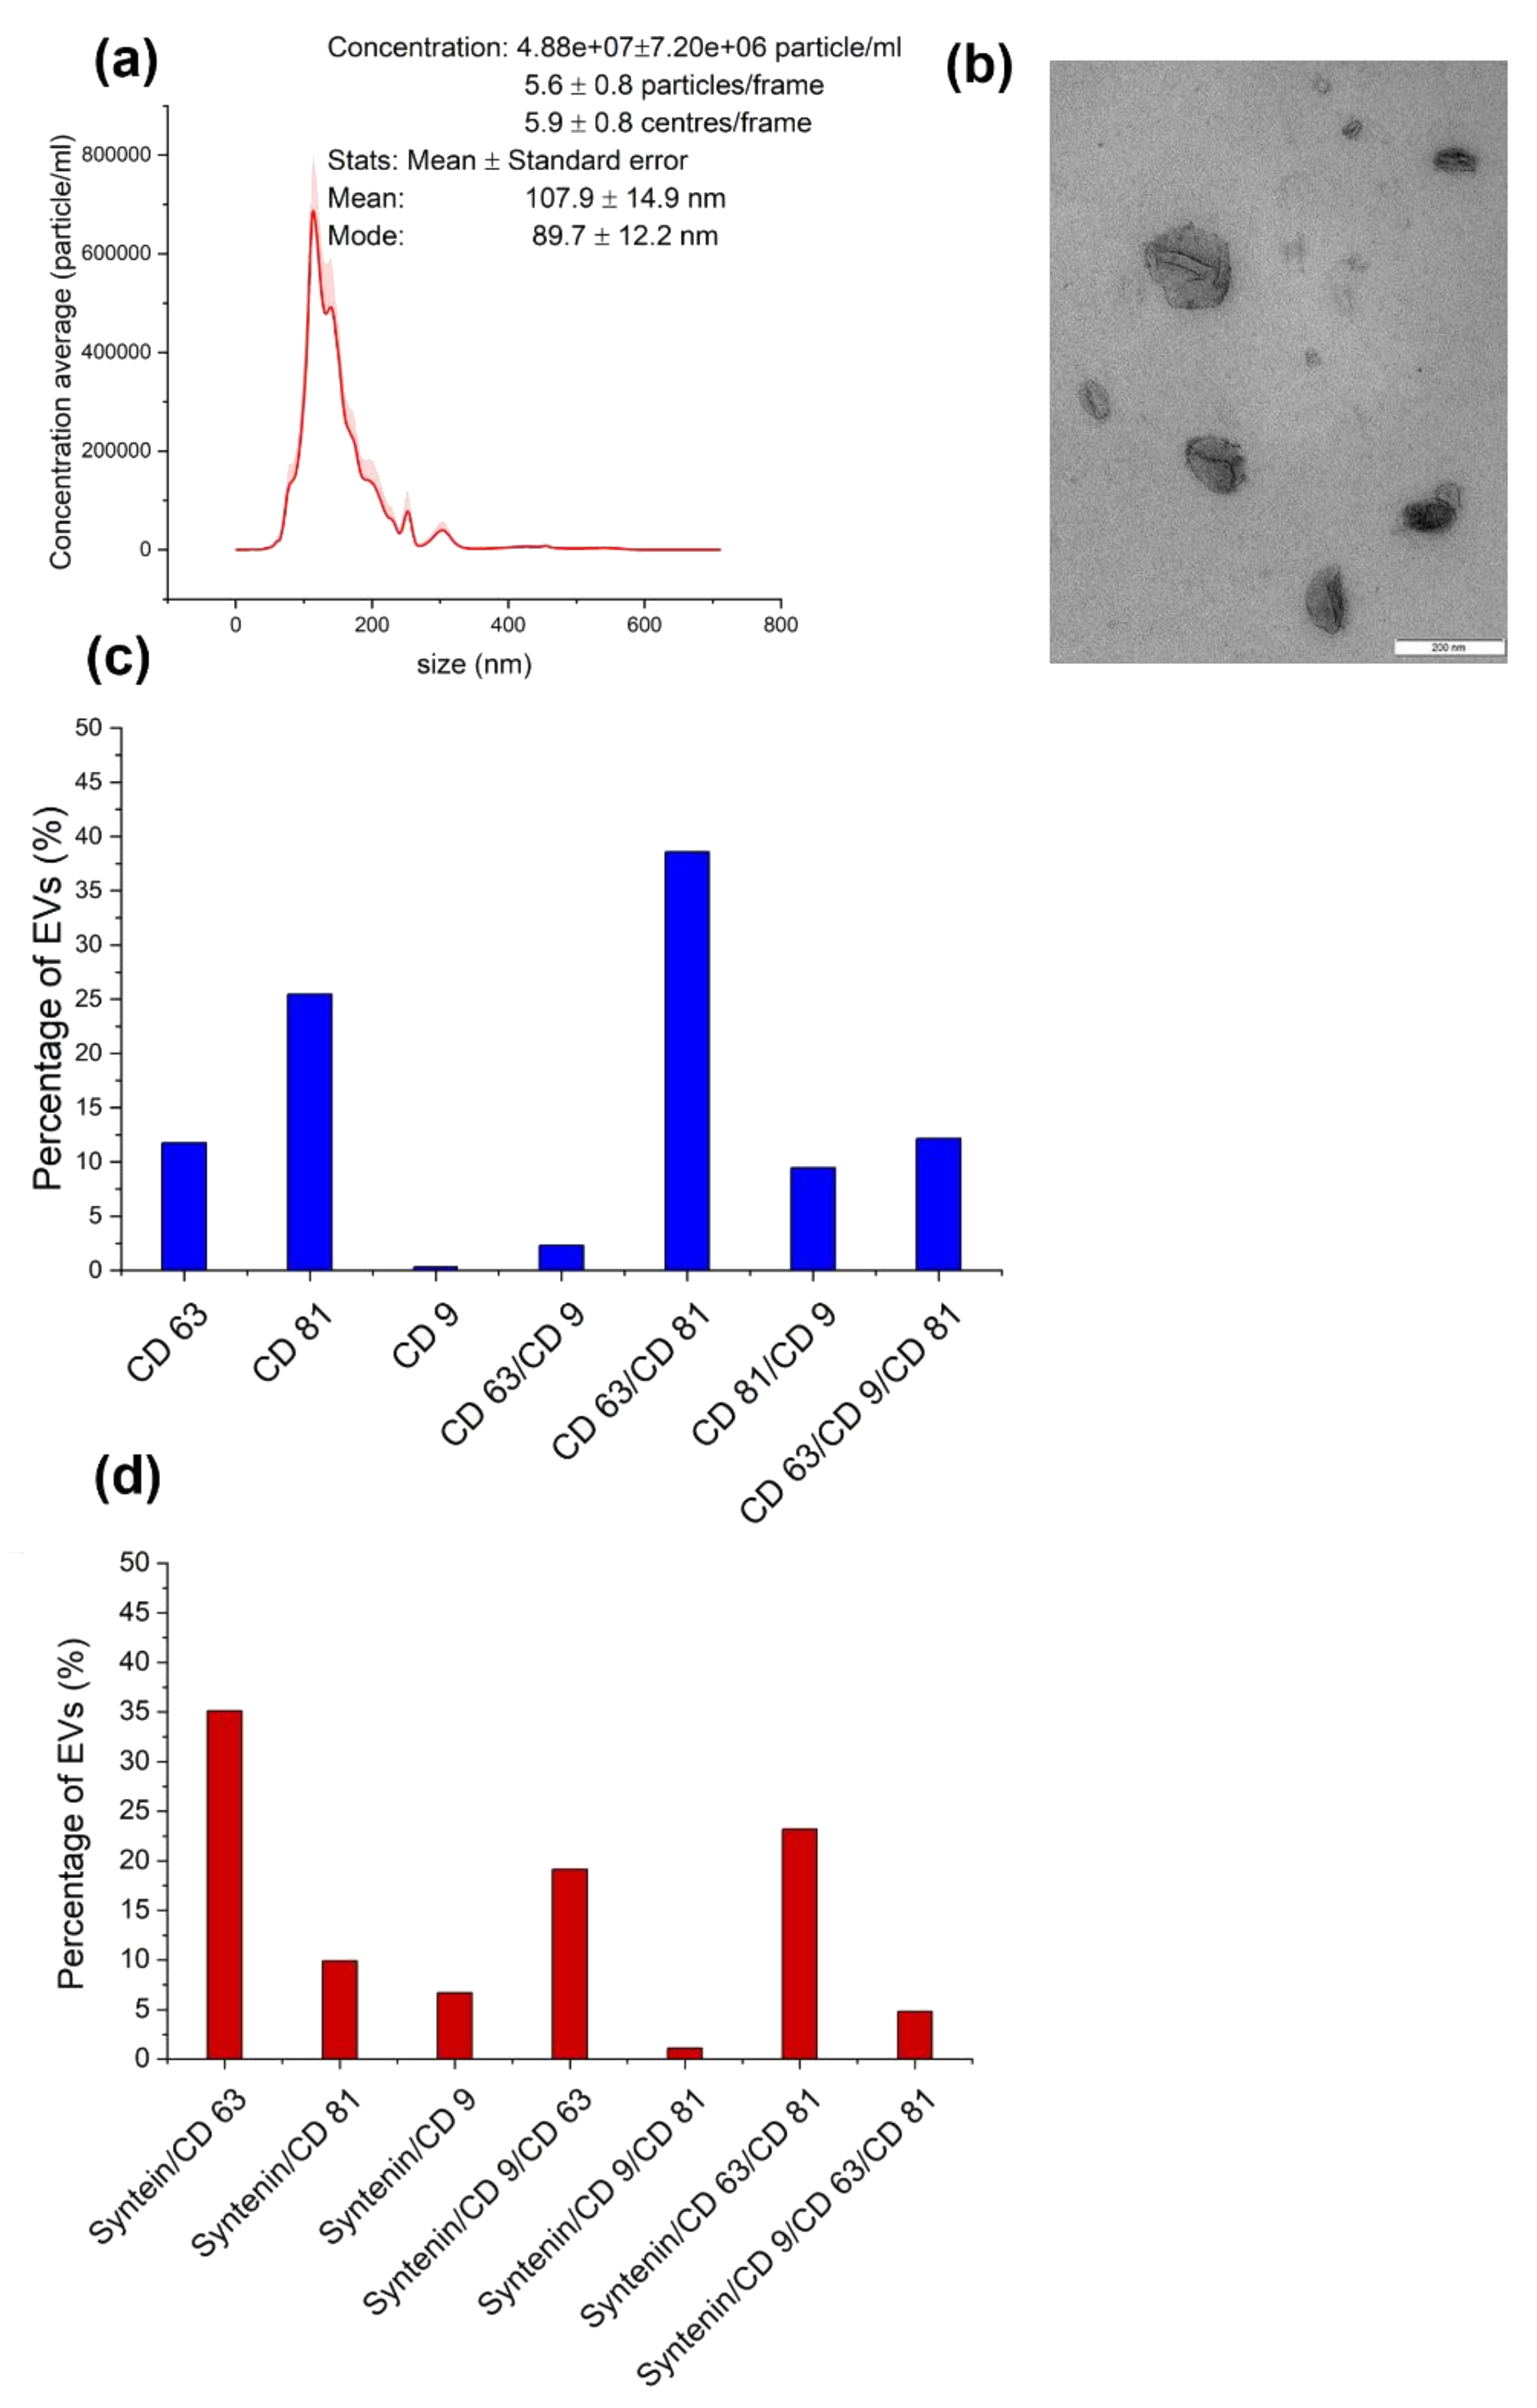
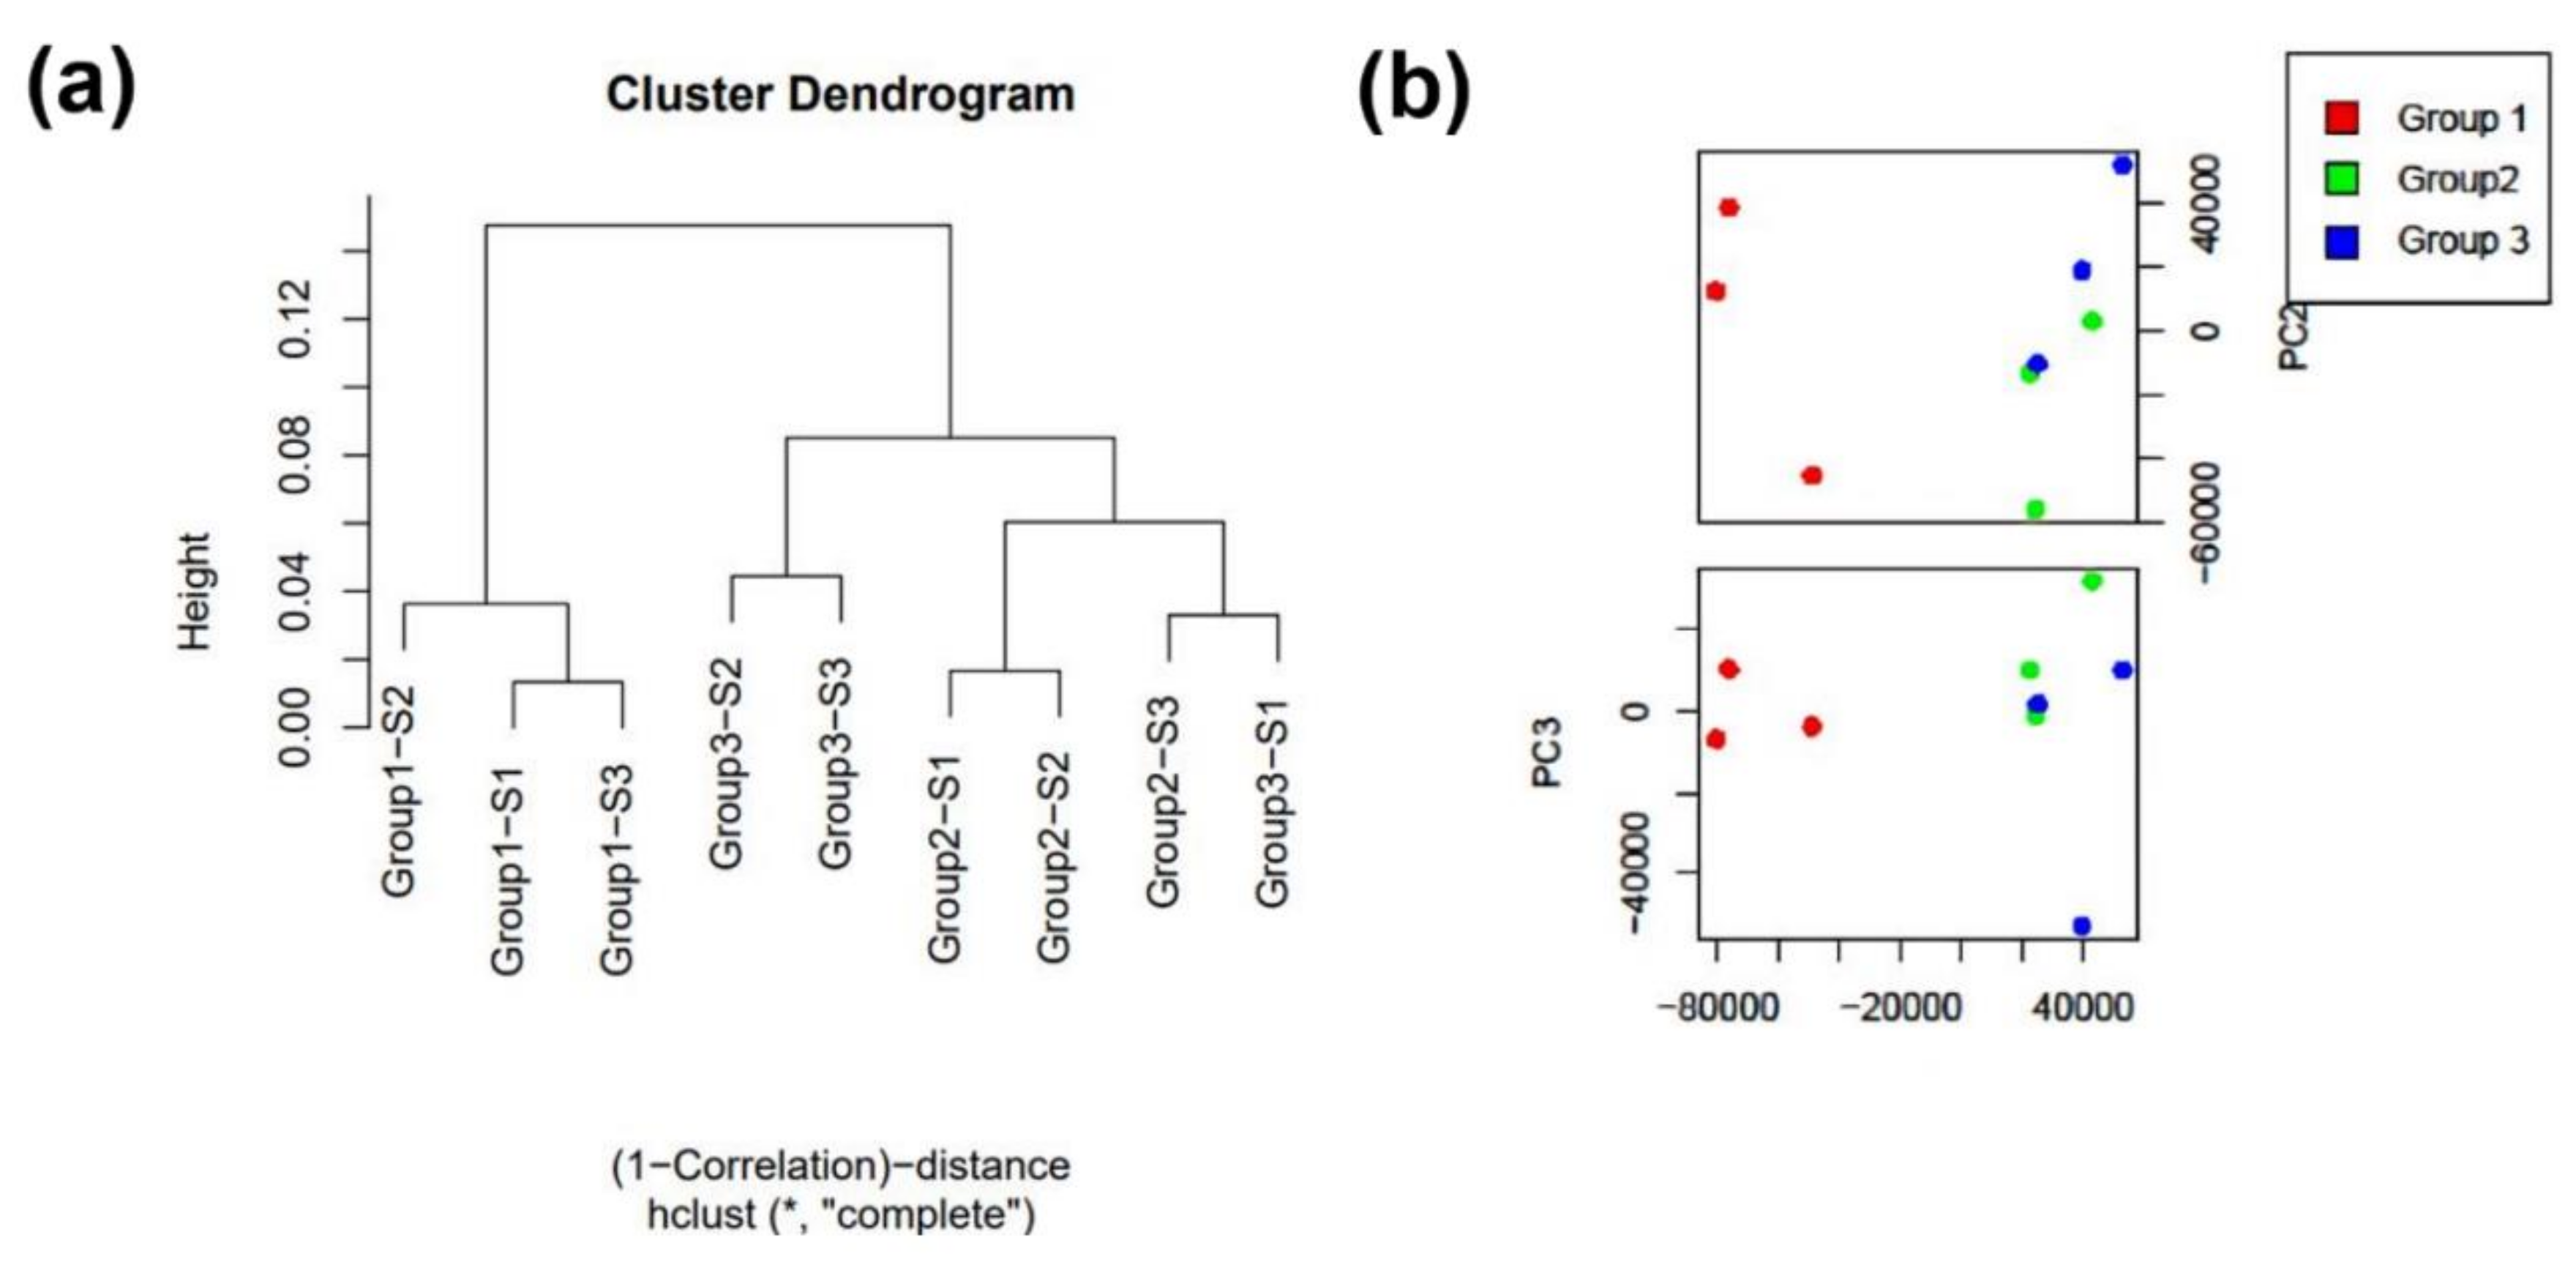
3.2. Astrocyte EV Characterization

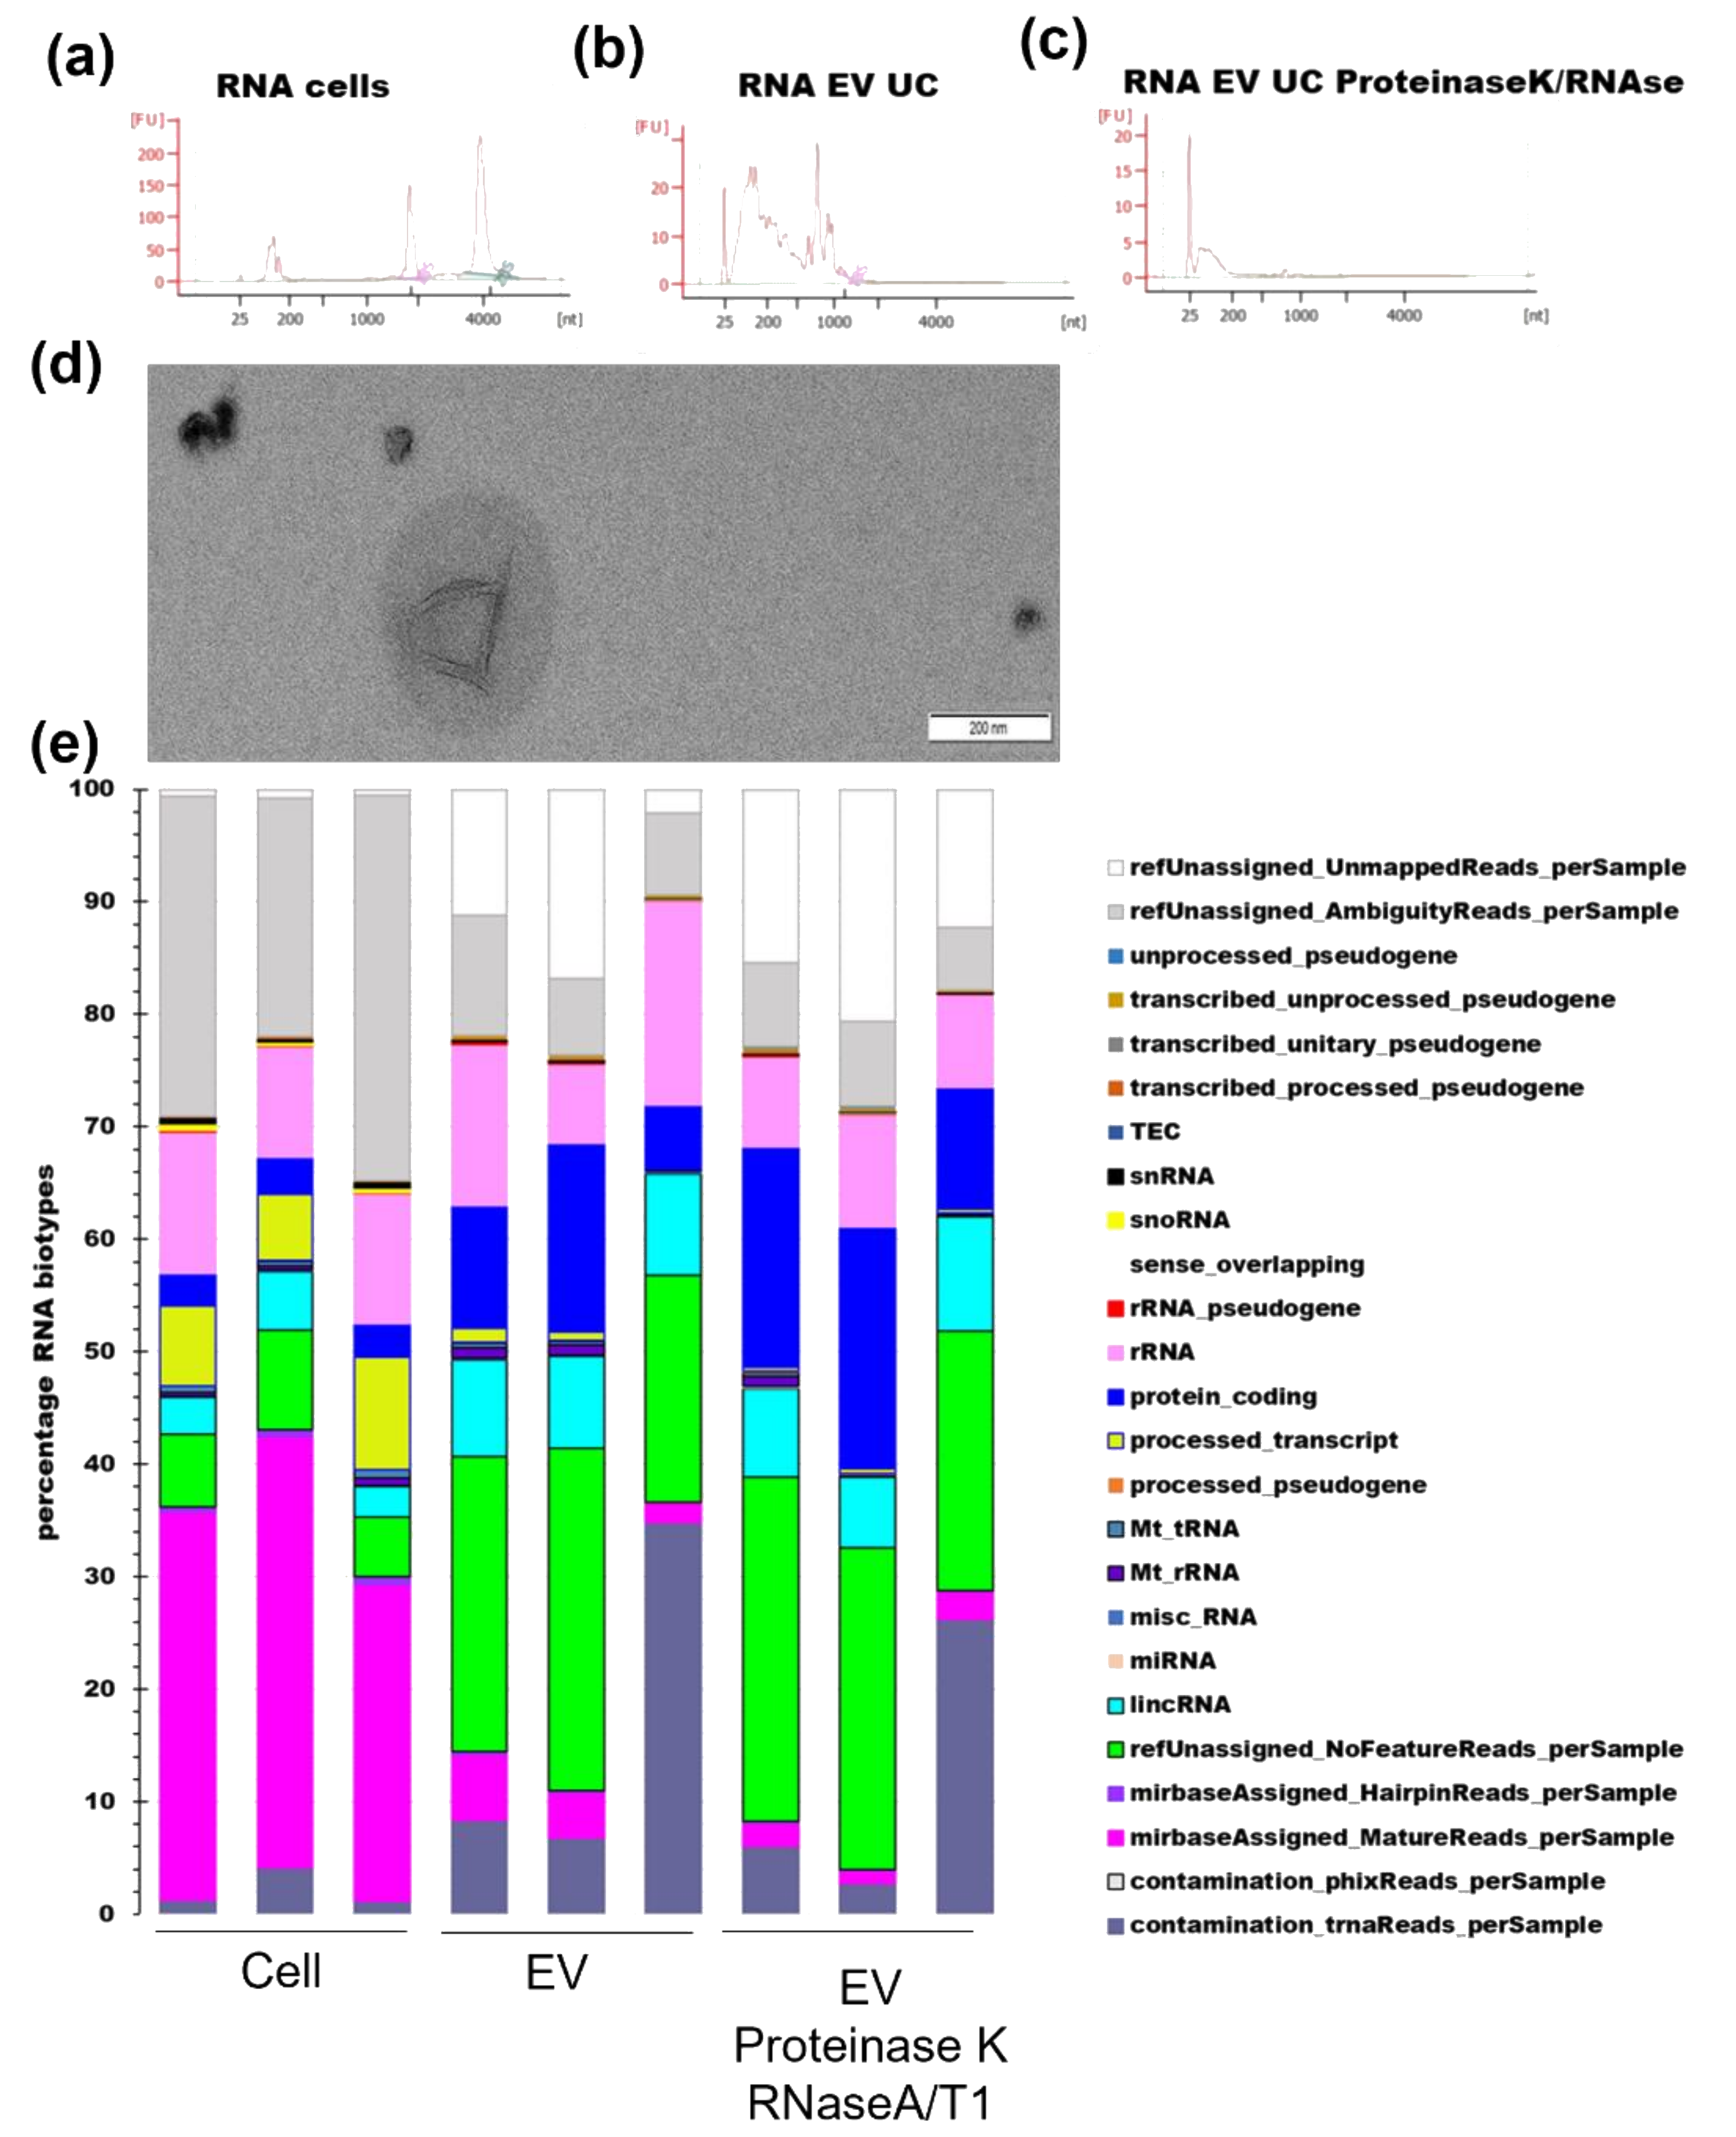
3.3. RNA Profile
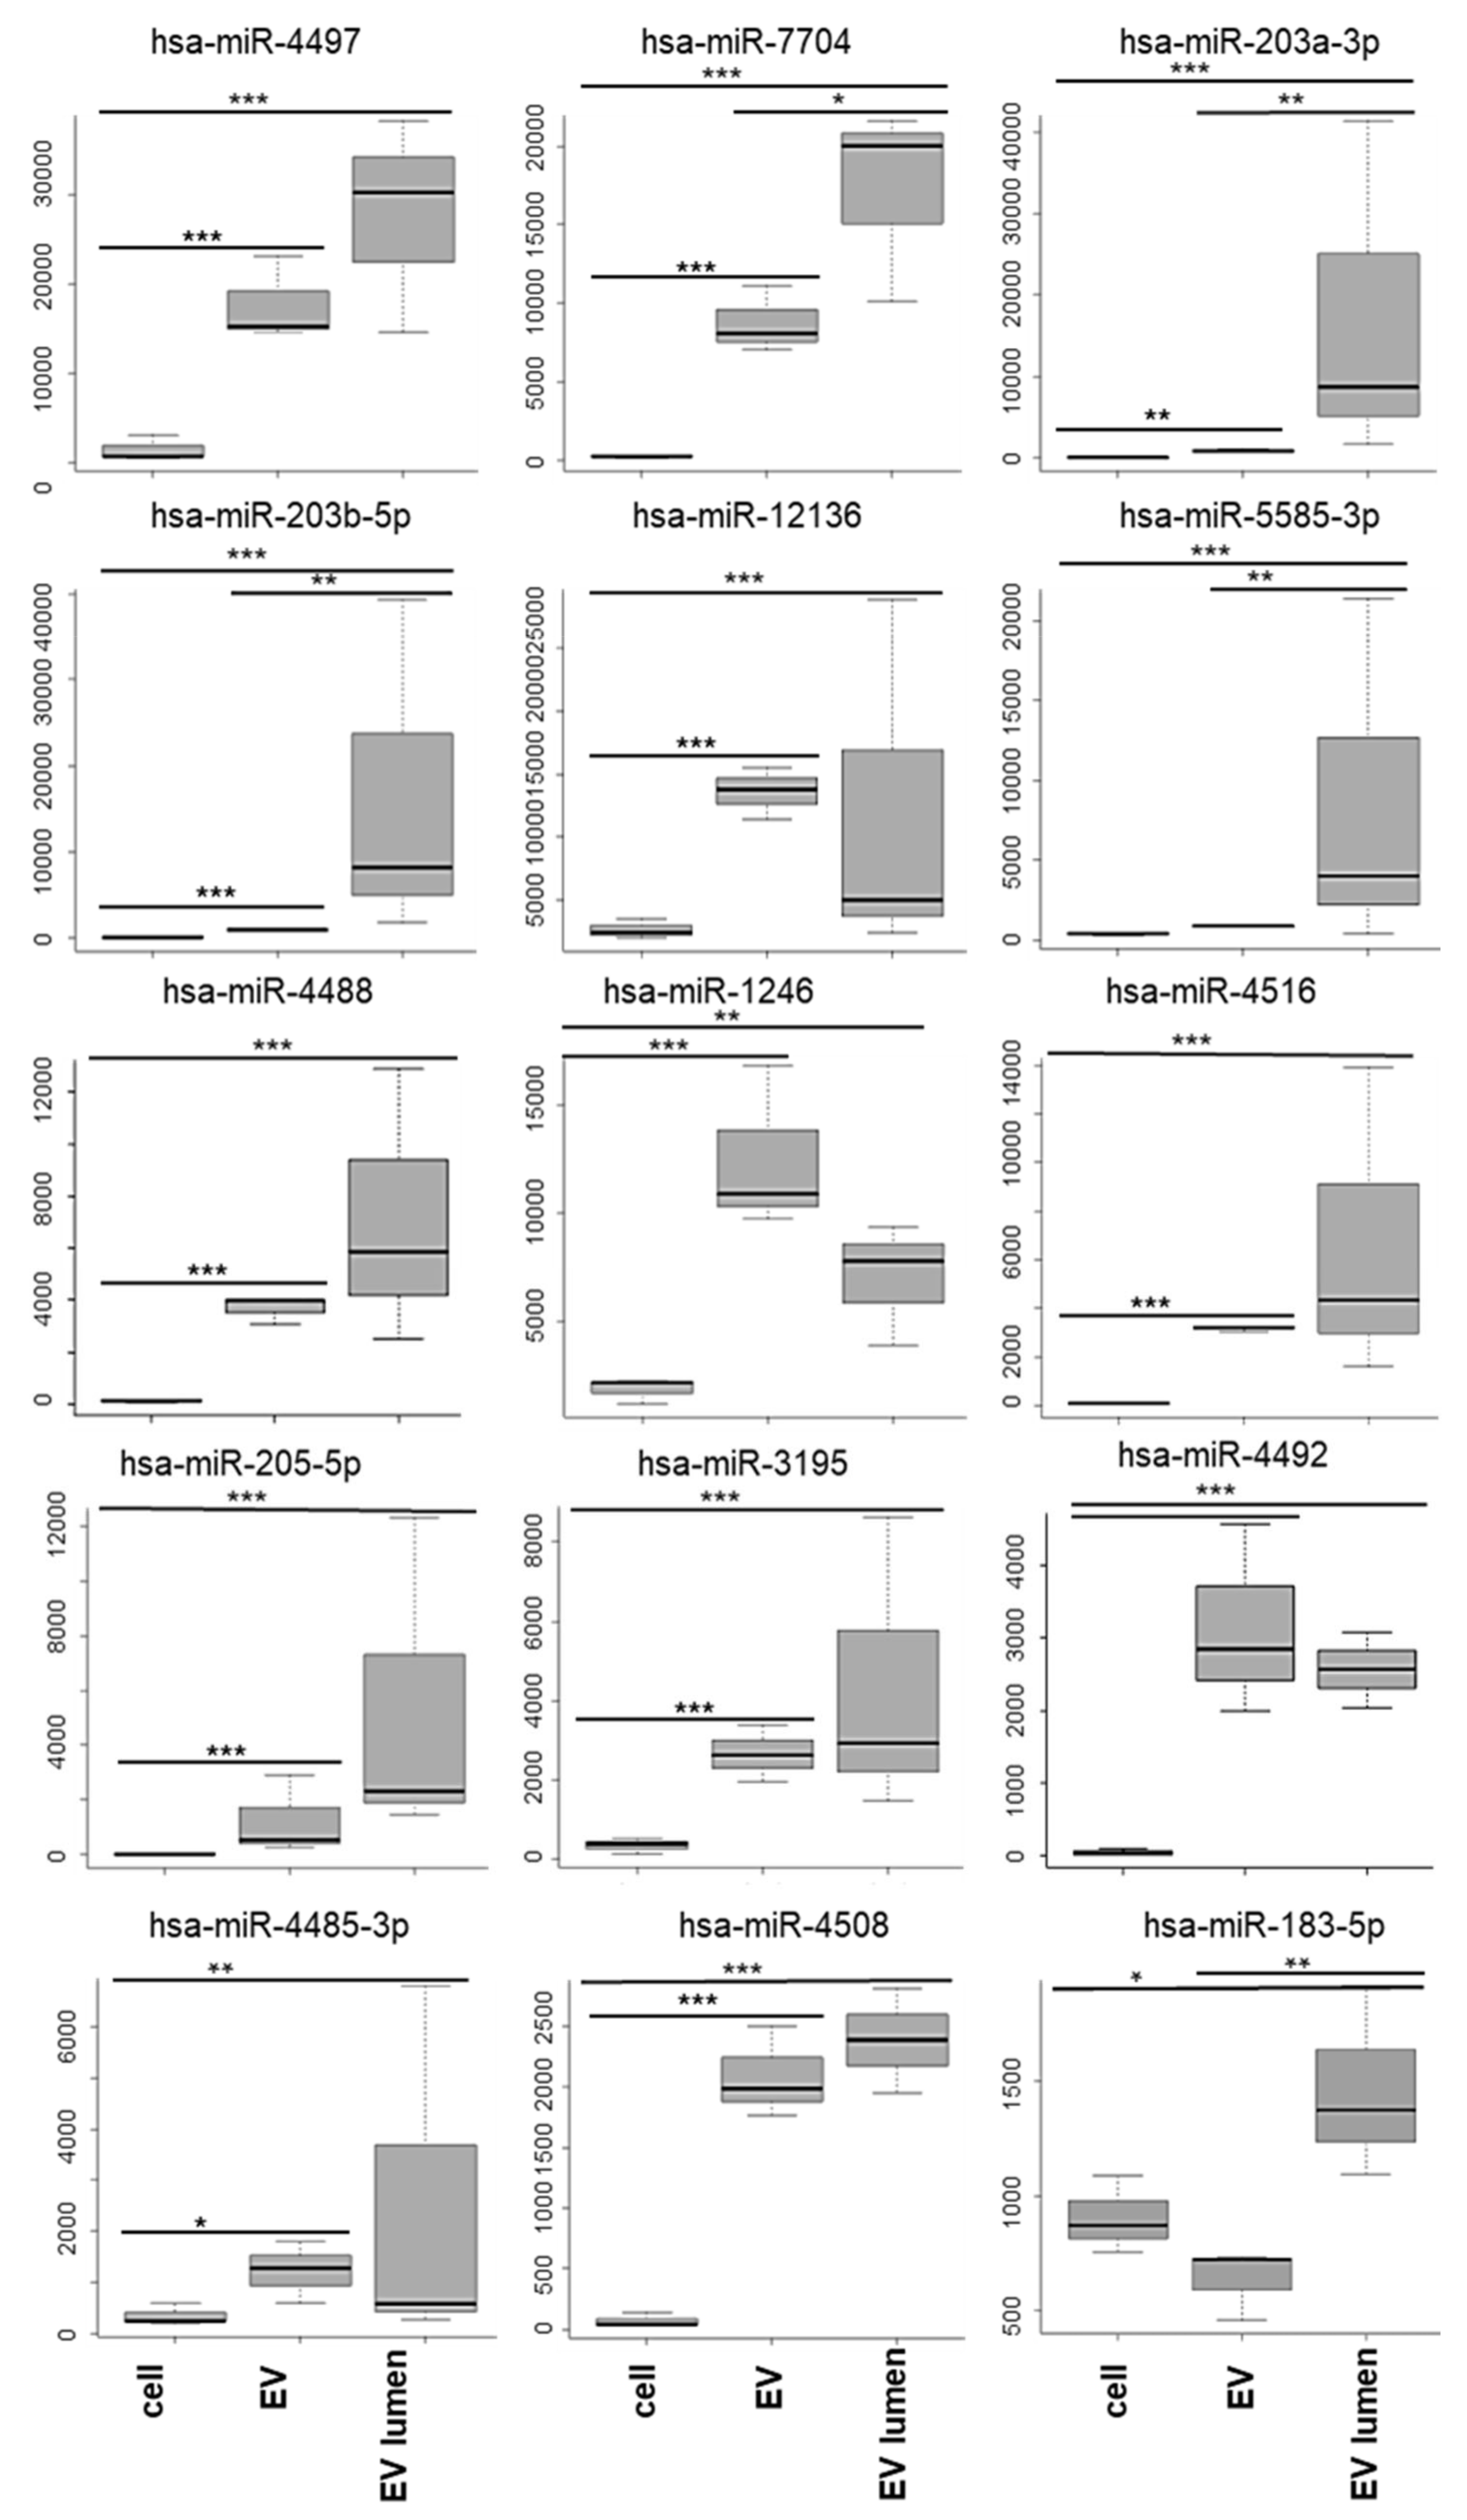
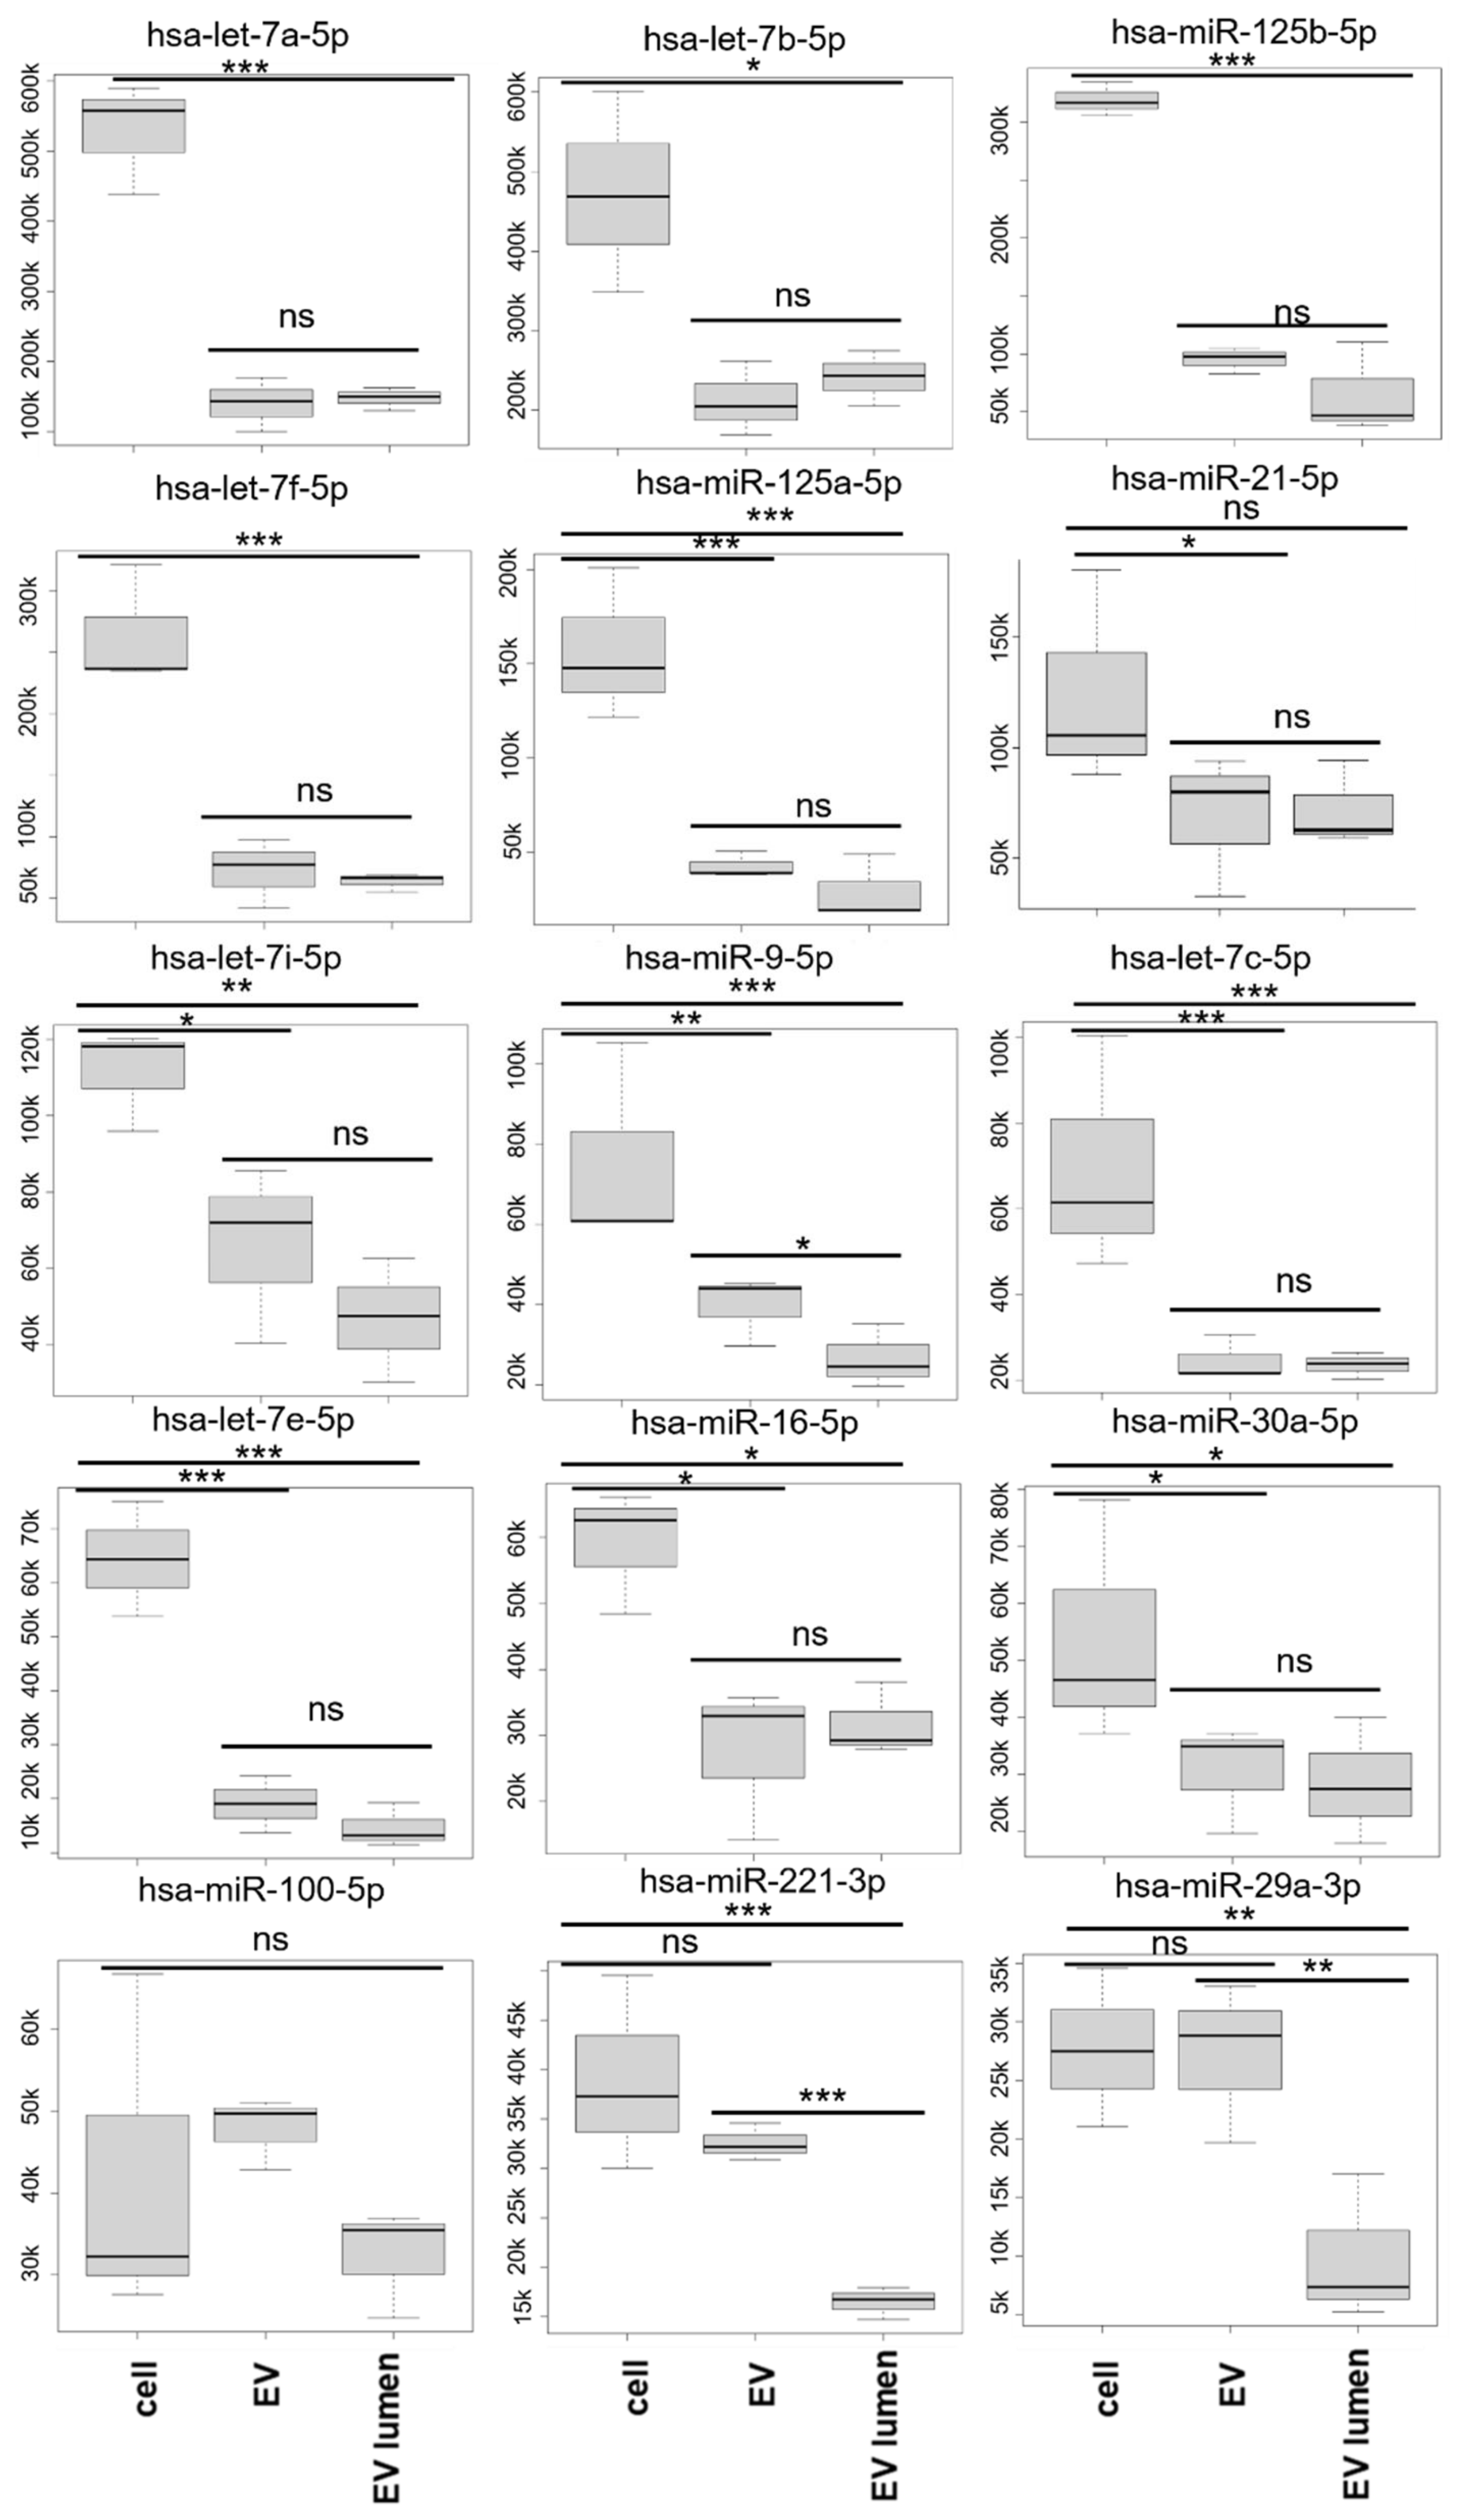
3.4. miRNA Analysis
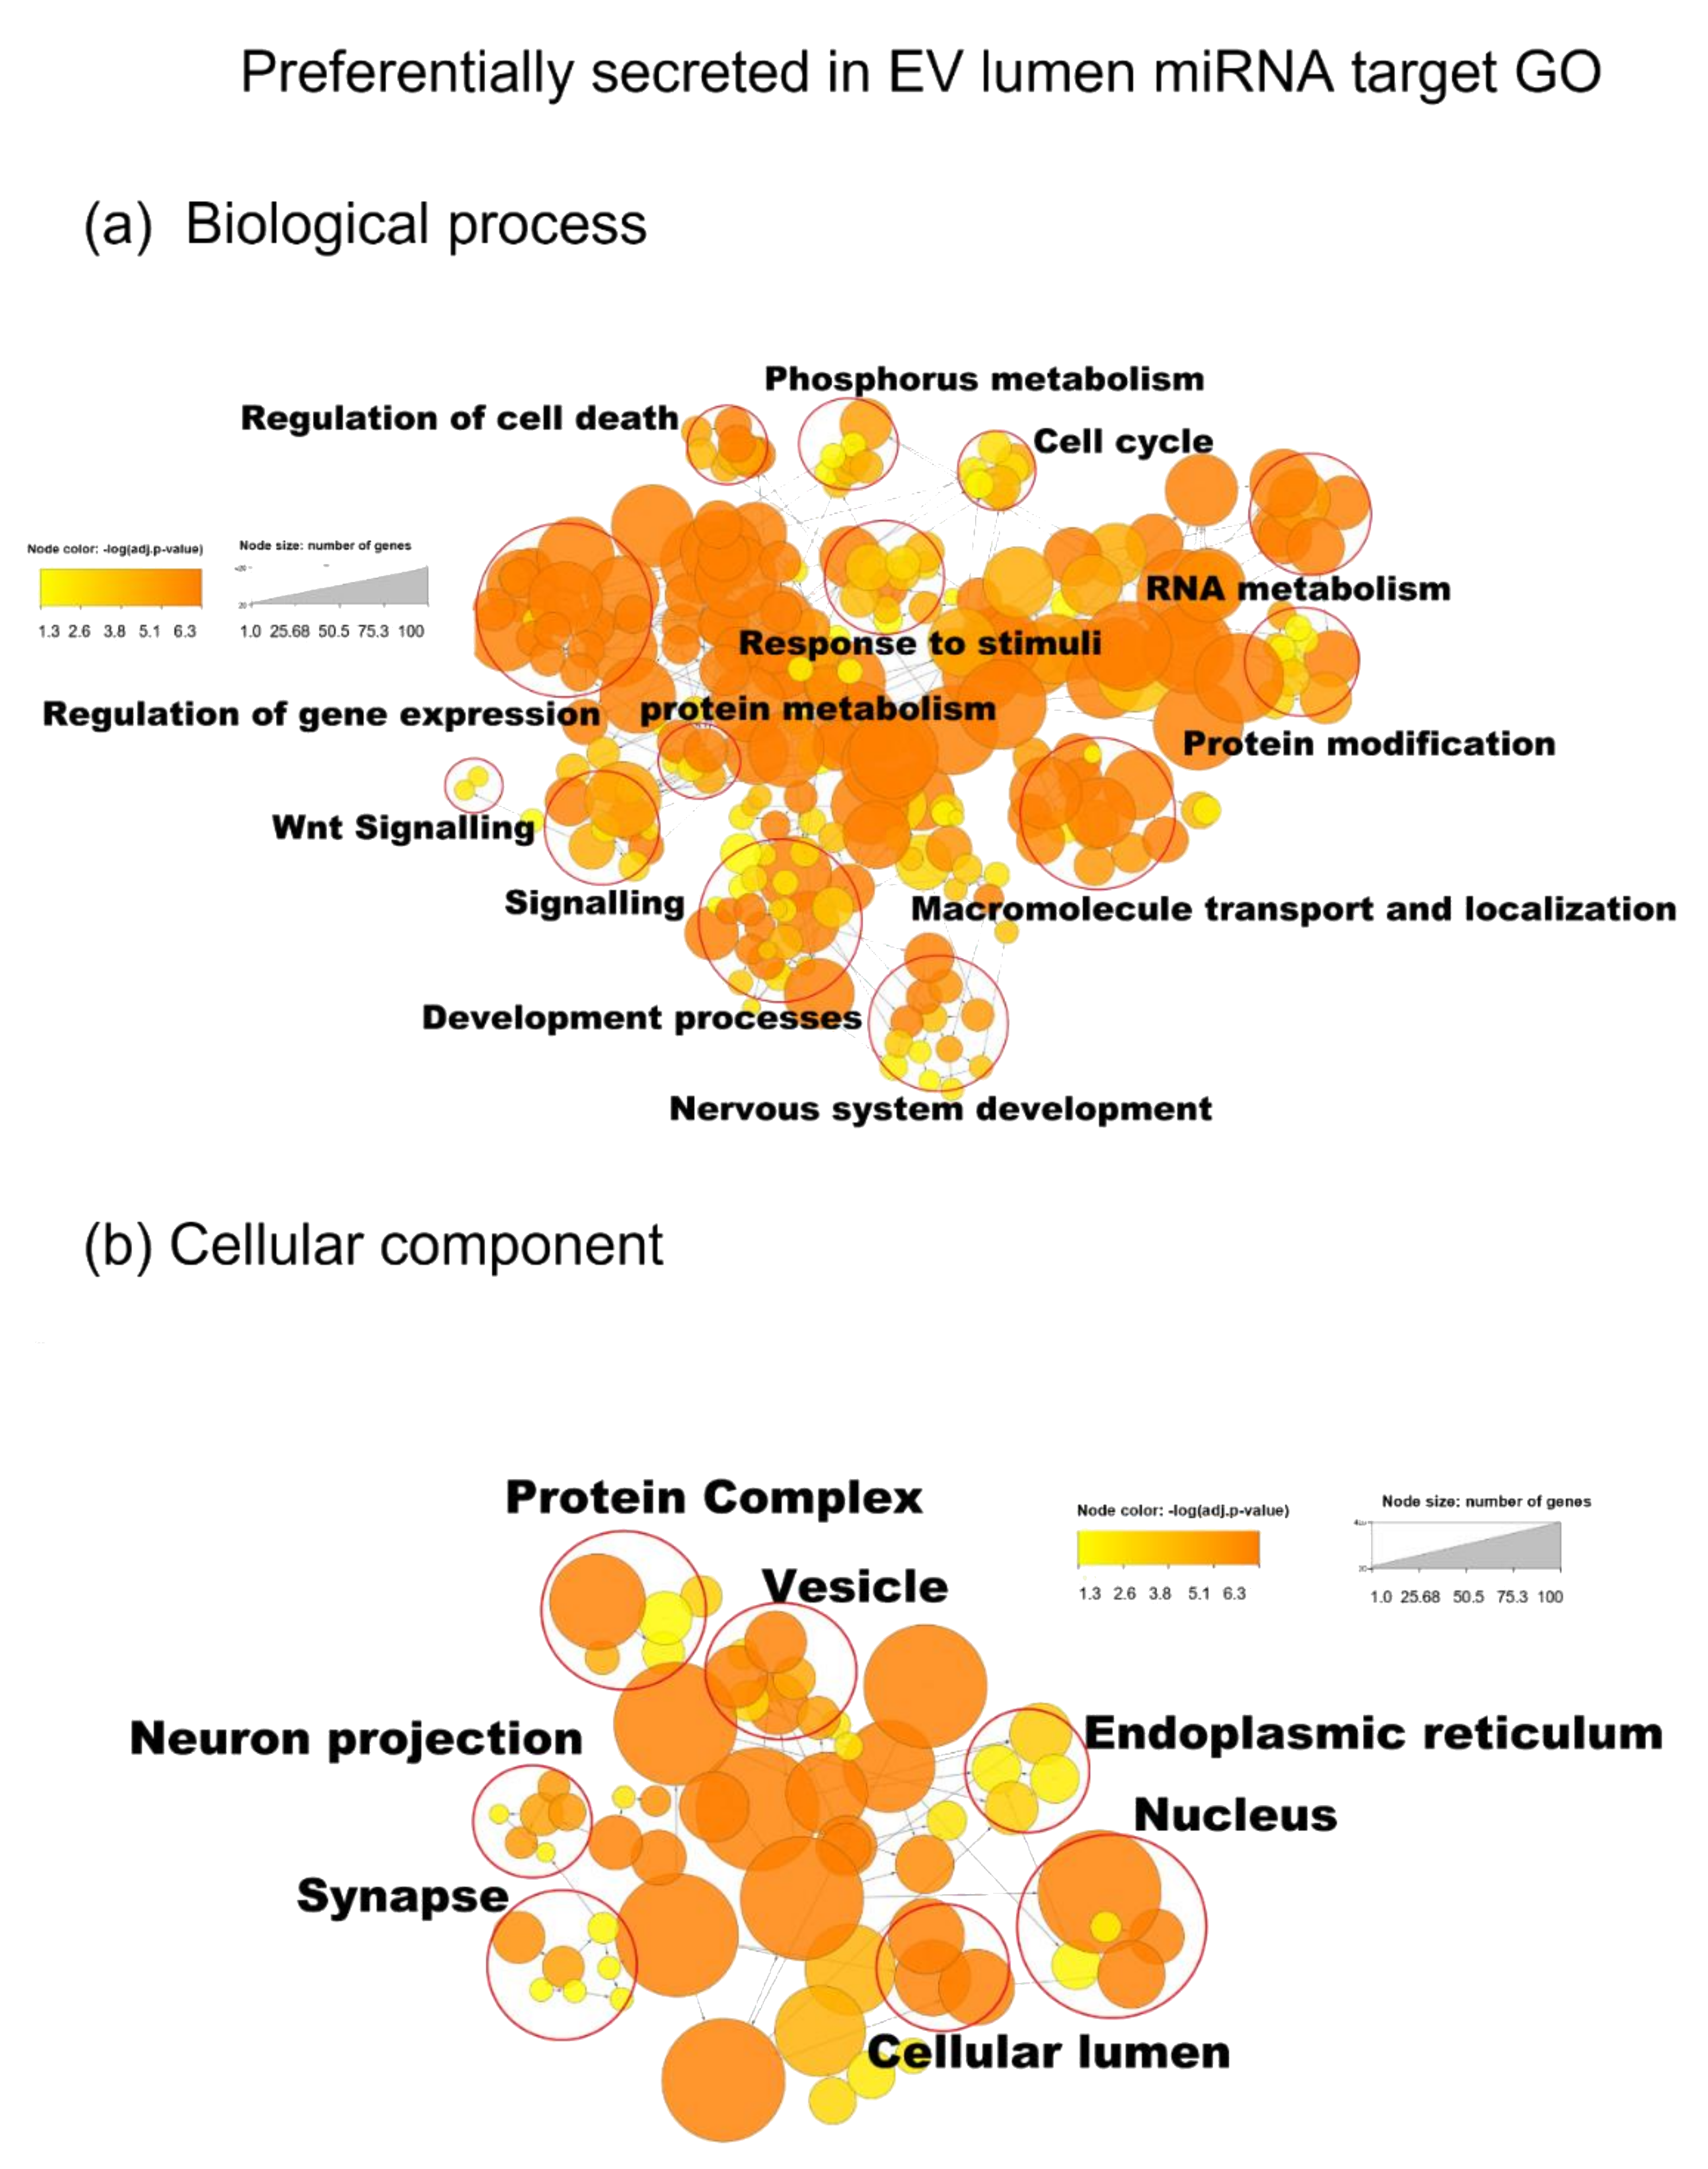
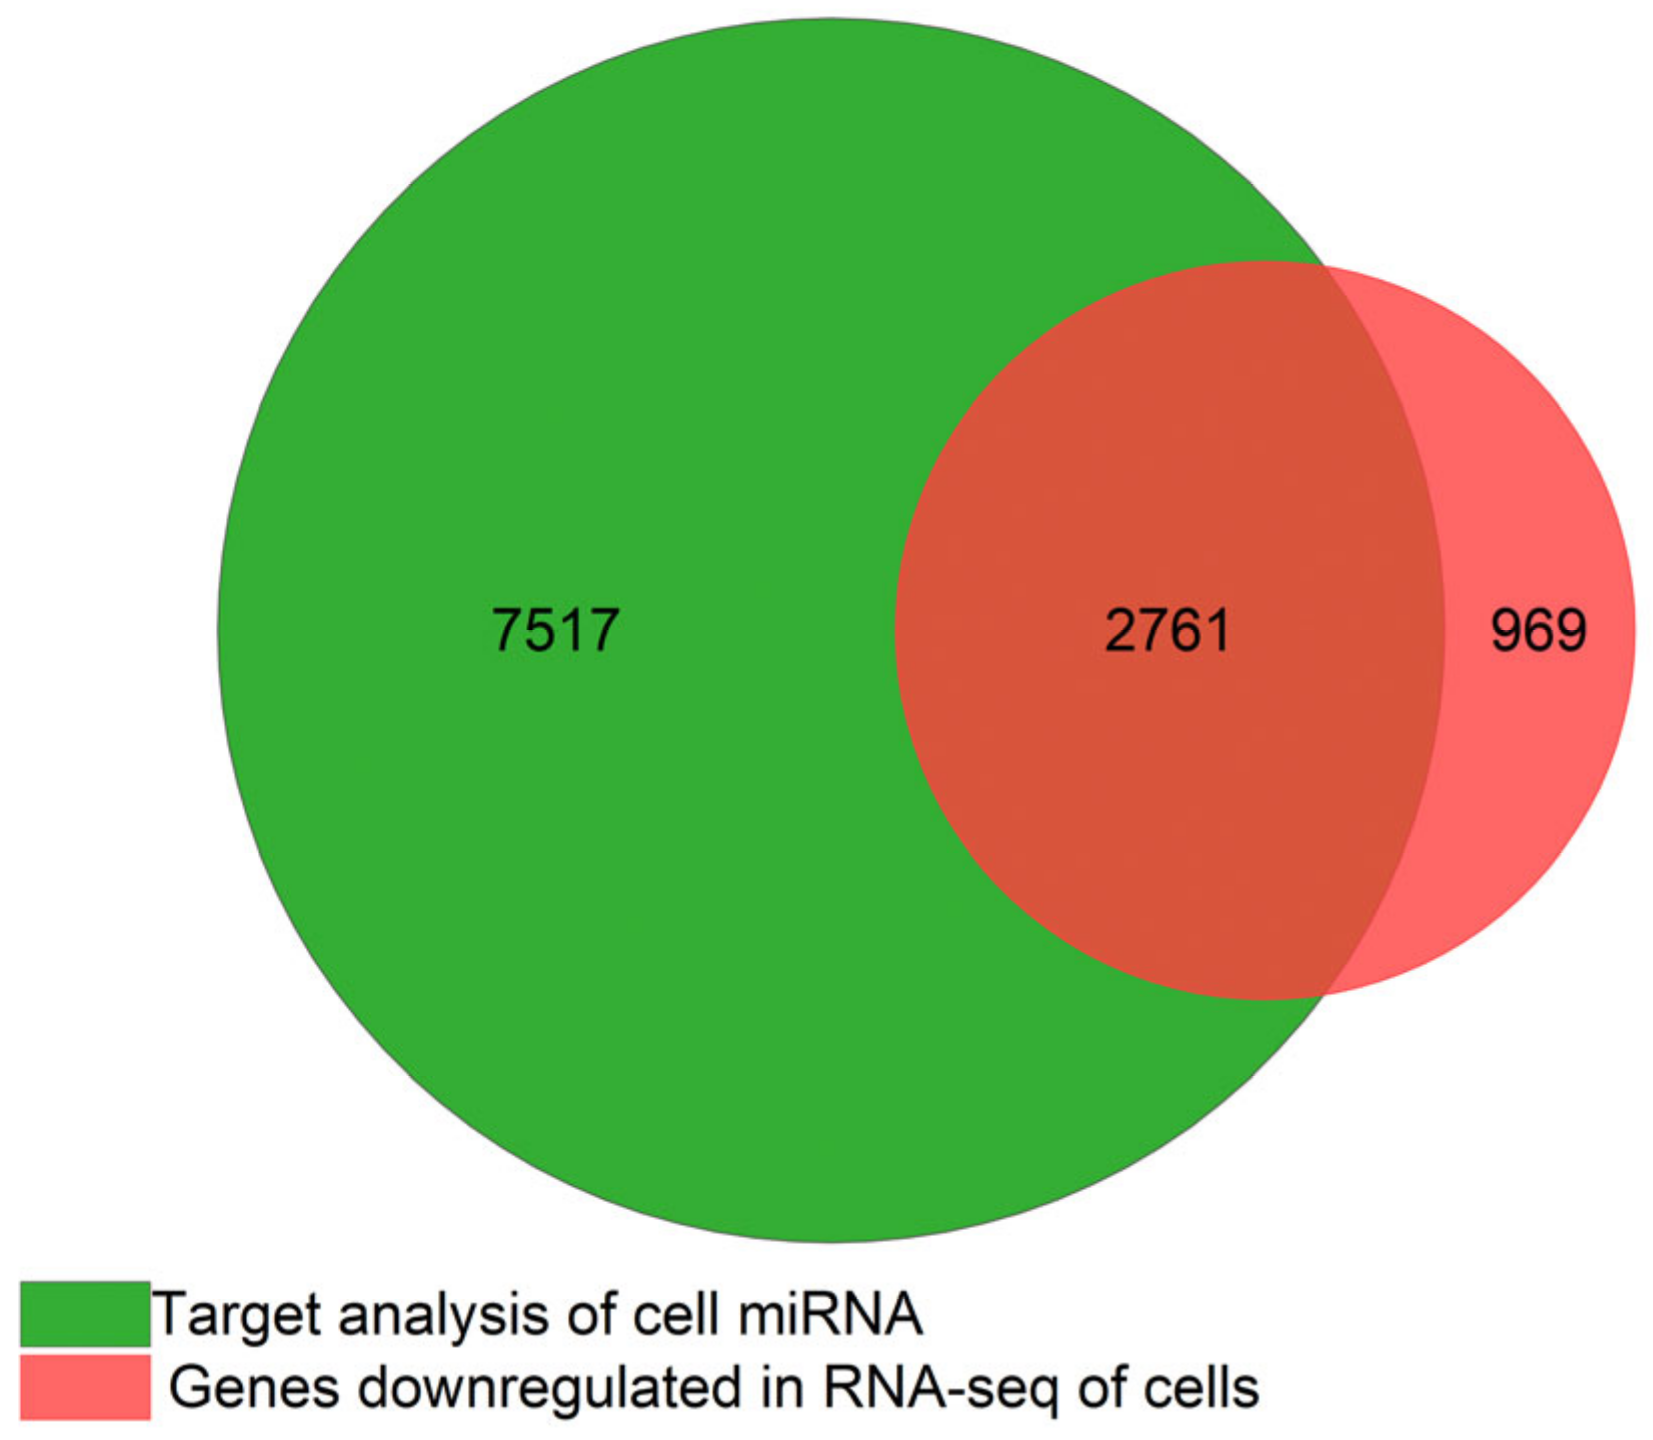
3.5. miRNA Target Analysis
3.6. Exonic RNA
3.7. Unannotated Transcripts
4. Discussion
5. Conclusions
Supplementary Materials
Author Contributions
Funding
Data Availability Statement
Acknowledgments
Conflicts of Interest
References
- Vasile, F.; Dossi, E.; Rouach, N. Human Astrocytes: Structure and Functions in the Healthy Brain. Brain Struct. Funct. 2017, 222, 2017–2029. [Google Scholar] [CrossRef] [PubMed] [Green Version]
- Molofsky, A.V.; Deneen, B. Astrocyte Development: A Guide for the Perplexed. GLIA 2015, 63, 1320–1329. [Google Scholar] [CrossRef] [PubMed]
- Takano, T.; Tian, G.F.; Peng, W.; Lou, N.; Libionka, W.; Han, X.; Nedergaard, M. Astrocyte-Mediated Control of Cerebral Blood Flow. Nat. Neurosci. 2005, 9, 260–267. [Google Scholar] [CrossRef] [PubMed]
- Tabata, H. Diverse Subtypes of Astrocytes and Their Development during Corticogenesis. Front. Neurosci. 2015, 9, 114. [Google Scholar] [CrossRef] [PubMed] [Green Version]
- Hu, X.; Yuan, Y.; Wang, D.; Su, Z. Heterogeneous Astrocytes: Active Players in CNS. Brain Res. Bull. 2016, 125, 1–18. [Google Scholar] [CrossRef]
- Zhang, Y.; Barres, B.A. Astrocyte Heterogeneity: An Underappreciated Topic in Neurobiology. Curr. Opin. Neurobiol. 2010, 20, 588–594. [Google Scholar] [CrossRef]
- Sun, W.; Cornwell, A.; Li, J.; Peng, S.; Joana Osorio, M.; Aalling, N.; Wang, S.; Benraiss, A.; Lou, N.; Goldman, S.A.; et al. SOX9 Is an Astrocyte-Specific Nuclear Marker in the Adult Brain Outside the Neurogenic Regions. J. Neurosci. 2017, 37, 4493–4507. [Google Scholar] [CrossRef] [Green Version]
- Molofsky, A.V.; Krenick, R.; Ullian, E.; Tsai, H.; Deneen, B.; Richardson, W.D.; Barres, B.A.; Rowitch, D.H. Astrocytes and Disease: A Neurodevelopmental Perspective. Genes Dev. 2012, 26, 891–907. [Google Scholar] [CrossRef] [Green Version]
- Chun, C.; Smith, A.S.T.; Kim, H.; Kamenz, D.S.; Lee, J.H.; Lee, J.B.; Mack, D.L.; Bothwell, M.; Clelland, C.D.; Kim, D.H. Astrocyte-Derived Extracellular Vesicles Enhance the Survival and Electrophysiological Function of Human Cortical Neurons In Vitro. Biomaterials 2021, 271, 120700. [Google Scholar] [CrossRef]
- Patel, M.R.; Weaver, A.M. Astrocyte-Derived Small Extracellular Vesicles Promote Synapse Formation via Fibulin-2-Mediated TGF-β Signaling. Cell Rep. 2021, 34, 108829. [Google Scholar] [CrossRef]
- Wang, X.; Yu, X.; Xu, H.; Wei, K.; Wang, S.; Wang, Y.; Han, J. Serum-Derived Extracellular Vesicles Facilitate Temozolomide Resistance in Glioblastoma through a HOTAIR-Dependent Mechanism. Cell Death Dis. 2022, 13, 344. [Google Scholar] [CrossRef]
- Abels, E.R.; Maas, S.L.N.; Nieland, L.; Wei, Z.; Cheah, P.S.; Tai, E.; Kolsteeg, C.J.; Dusoswa, S.A.; Ting, D.T.; Hickman, S.; et al. Glioblastoma-Associated Microglia Reprogramming Is Mediated by Functional Transfer of Extracellular MiR-21. Cell Rep. 2019, 28, 3105–3119.e7. [Google Scholar] [CrossRef] [Green Version]
- Zhang, X.; Abels, E.R.; Redzic, J.S.; Margulis, J.; Finkbeiner, S.; Breakefield, X.O. Potential Transfer of Polyglutamine and CAG-Repeat RNA in Extracellular Vesicles in Huntington’s Disease: Background and Evaluation in Cell Culture. Cell. Mol. Neurobiol. 2016, 36, 459. [Google Scholar] [CrossRef]
- Chaudhuri, A.D.; Dastgheyb, R.M.; Yoo, S.W.; Trout, A.; Talbot, C.C.; Hao, H.; Witwer, K.W.; Haughey, N.J. TNFα and IL-1β Modify the MiRNA Cargo of Astrocyte Shed Extracellular Vesicles to Regulate Neurotrophic Signaling in Neurons. Cell Death Dis. 2018, 9, 363. [Google Scholar] [CrossRef] [Green Version]
- Mingardi, J.; La Via, L.; Tornese, P.; Carini, G.; Trontti, K.; Seguini, M.; Tardito, D.; Bono, F.; Fiorentini, C.; Elia, L.; et al. MiR-9-5p Is Involved in the Rescue of Stress-Dependent Dendritic Shortening of Hippocampal Pyramidal Neurons Induced by Acute Antidepressant Treatment with Ketamine. Neurobiol. Stress 2021, 15, 100381. [Google Scholar] [CrossRef]
- Gu, Q.H.; Yu, D.; Hu, Z.; Liu, X.; Yang, Y.; Luo, Y.; Zhu, J.; Li, Z. MiR-26a and MiR-384-5p Are Required for LTP Maintenance and Spine Enlargement. Nat. Commun. 2015, 6, 6789. [Google Scholar] [CrossRef] [Green Version]
- Sauer, M.; Was, N.; Ziegenhals, T.; Wang, X.; Hafner, M.; Becker, M.; Fischer, U. The MiR-26 Family Regulates Neural Differentiation-Associated MicroRNAs and MRNAs by Directly Targeting REST. J. Cell Sci. 2021, 134, jcs257535. [Google Scholar] [CrossRef]
- Yan, H.; Huang, W.; Rao, J.; Yuan, J. MiR-21 Regulates Ischemic Neuronal Injury via the P53/Bcl-2/Bax Signaling Pathway. Aging 2021, 13, 22242–22255. [Google Scholar] [CrossRef]
- Liu, Y.P.; Yang, Y.D.; Mou, F.F.; Zhu, J.; Li, H.; Zhao, T.T.; Zhao, Y.; Shao, S.J.; Cui, G.H.; Guo, H.D. Exosome-Mediated MiR-21 Was Involved in the Promotion of Structural and Functional Recovery Effect Produced by Electroacupuncture in Sciatic Nerve Injury. Oxid. Med. Cell. Longev. 2022, 2022, 7530102. [Google Scholar] [CrossRef]
- Kumar, S.; Curran, J.E.; Deleon, E.; Leandro, A.C.; Howard, T.E.; Lehman, D.M.; Williams-Blangero, S.; Glahn, D.C.; Blangero, J. Role of MiRNA-MRNA Interaction in Neural Stem Cell Differentiation of Induced Pluripotent Stem Cells. Int. J. Mol. Sci. 2020, 21, 6980. [Google Scholar] [CrossRef]
- Lin, S.T.; Huang, Y.; Zhang, L.; Heng, M.Y.; Ptáček, L.J.; Fu, Y.H. MicroRNA-23a Promotes Myelination in the Central Nervous System. Proc. Natl. Acad. Sci. USA 2013, 110, 17468–17473. [Google Scholar] [CrossRef] [PubMed] [Green Version]
- You, Y.; Muraoka, S.; Jedrychowski, M.P.; Hu, J.; McQuade, A.K.; Young-Pearse, T.; Aslebagh, R.; Shaffer, S.A.; Gygi, S.P.; Blurton-Jones, M.; et al. Human Neural Cell Type-Specific Extracellular Vesicle Proteome Defines Disease-Related Molecules Associated with Activated Astrocytes in Alzheimer’s Disease Brain. J. Extracell. Vesicles 2022, 11, e12183. [Google Scholar] [CrossRef] [PubMed]
- Aulston, B.; Liu, Q.; Mante, M.; Florio, J.; Rissman, R.A.; Yuan, S.H. Extracellular Vesicles Isolated from Familial Alzheimer’s Disease Neuronal Cultures Induce Aberrant Tau Phosphorylation in the Wild-Type Mouse Brain. J. Alzheimer’s Dis. 2019, 72, 575–585. [Google Scholar] [CrossRef] [PubMed]
- Phatnani, H.; Maniatis, T. Astrocytes in Neurodegenerative Disease. Cold Spring Harb. Perspect. Biol. 2015, 7, a020628. [Google Scholar] [CrossRef] [PubMed] [Green Version]
- Ferrara, D.; Pasetto, L.; Bonetto, V.; Basso, M. Role of Extracellular Vesicles in Amyotrophic Lateral Sclerosis. Front. Neurosci. 2018, 12, 574. [Google Scholar] [CrossRef]
- Ipinmoroti, A.O.; Matthews, Q.L. Extracellular Vesicles: Roles in Human Viral Infections, Immune-Diagnostic, and Therapeutic Applications. Pathogens 2020, 9, 1056. [Google Scholar] [CrossRef]
- Martins, S.d.T.; Alves, L.R. Extracellular Vesicles in Viral Infections: Two Sides of the Same Coin? Front. Cell. Infect. Microbiol. 2020, 10, 737. [Google Scholar] [CrossRef]
- Upadhya, R.; Zingg, W.; Shetty, S.; Shetty, A.K. Astrocyte-Derived Extracellular Vesicles: Neuroreparative Properties and Role in the Pathogenesis of Neurodegenerative Disorders. J. Control. Release 2020, 323, 225–239. [Google Scholar] [CrossRef]
- Dickens, A.M.; Tovar-Y-Romo, L.B.; Yoo, S.W.; Trout, A.L.; Bae, M.; Kanmogne, M.; Megra, B.; Williams, D.W.; Witwer, K.W.; Gacias, M.; et al. Astrocyte-Shed Extracellular Vesicles Regulate the Peripheral Leukocyte Response to Inflammatory Brain Lesions. Sci. Signal. 2017, 10, eaai7696. [Google Scholar] [CrossRef] [Green Version]
- Sil, S.; Singh, S.; Chemparathy, D.T.; Chivero, E.T.; Gordon, L.; Buch, S. Astrocytes & Astrocyte Derived Extracellular Vesicles in Morphine Induced Amyloidopathy: Implications for Cognitive Deficits in Opiate Abusers. Aging Dis. 2021, 12, 1389–1408. [Google Scholar] [CrossRef]
- Peng, D.; Wang, Y.; Xiao, Y.; Peng, M.; Mai, W.; Hu, B.; Jia, Y.; Chen, H.; Yang, Y.; Xiang, Q.; et al. Extracellular Vesicles Derived from Astrocyte-Treated with HaFGF14-154 Attenuate Alzheimer Phenotype in AD Mice. Theranostics 2022, 12, 3862–3881. [Google Scholar] [CrossRef]
- Yu, X.; Bai, Y.; Han, B.; Ju, M.; Tang, T.; Shen, L.; Li, M.; Yang, L.; Zhang, Z.; Hu, G.; et al. Extracellular Vesicle-mediated Delivery of CircDYM Alleviates CUS-induced Depressive-like Behaviours. J. Extracell. Vesicles 2022, 11, e12185. [Google Scholar] [CrossRef]
- Men, Y.; Yelick, J.; Jin, S.; Tian, Y.; Chiang, M.S.R.; Higashimori, H.; Brown, E.; Jarvis, R.; Yang, Y. Exosome Reporter Mice Reveal the Involvement of Exosomes in Mediating Neuron to Astroglia Communication in the CNS. Nat. Commun. 2019, 10, 4136. [Google Scholar] [CrossRef] [Green Version]
- He, B.; Chen, W.; Zeng, J.; Tong, W.; Zheng, P. Long Noncoding RNA NKILA Transferred by Astrocyte-Derived Extracellular Vesicles Protects against Neuronal Injury by Upregulating NLRX1 through Binding to Mir-195 in Traumatic Brain Injury. Aging 2021, 13, 8127–8145. [Google Scholar] [CrossRef]
- Kovács, O.T.; Soltész-katona, E.; Marton, N.; Baricza, E.; Hunyady, L.; Turu, G.; Nagy, G. Impact of Medium-Sized Extracellular Vesicles on the Transduction Efficiency of Adeno-Associated Viruses in Neuronal and Primary Astrocyte Cell Cultures. Int. J. Mol. Sci. 2021, 22, 4221. [Google Scholar] [CrossRef]
- Rong, Y.; Ji, C.; Wang, Z.; Ge, X.; Wang, J.; Ye, W.; Tang, P.; Jiang, D.; Fan, J.; Yin, G.; et al. Small Extracellular Vesicles Encapsulating CCL2 from Activated Astrocytes Induce Microglial Activation and Neuronal Apoptosis after Traumatic Spinal Cord Injury. J. Neuroinflamm. 2021, 18, 196. [Google Scholar] [CrossRef]
- Colodner, K.J.; Montana, R.A.; Anthony, D.C.; Folkerth, R.D.; De Girolami, U.; Feany, M.B. Proliferative Potential of Human Astrocytes. J. Neuropathol. Exp. Neurol. 2005, 64, 163–169. [Google Scholar] [CrossRef] [Green Version]
- Cavanagh, J.B.; Neurobiology, A. The Proliferation of Astrocytes around a Needle Wound in the Rat Brain. J. Anat. 1970, 106, 471. [Google Scholar]
- Gaines, D.; Nestorova, G.G. Extracellular Vesicles-Derived MicroRNAs Expression as Biomarkers for Neurological Radiation Injury: Risk Assessment for Space Exploration. Life Sci. Space Res. 2022, 32, 54–62. [Google Scholar] [CrossRef]
- Baranyai, T.; Herczeg, K.; Onódi, Z.; Voszka, I.; Módos, K.; Marton, N.; Nagy, G.; Mäger, I.; Wood, M.J.; El Andaloussi, S.; et al. Isolation of Exosomes from Blood Plasma: Qualitative and Quantitative Comparison of Ultracentrifugation and Size Exclusion Chromatography Methods. PLoS ONE 2015, 10, e0145686. [Google Scholar] [CrossRef] [Green Version]
- Momen-Heravi, F.; Balaj, L.; Alian, S.; Trachtenberg, A.J.; Hochberg, F.H.; Skog, J.; Kuo, W.P. Impact of Biofluid Viscosity on Size and Sedimentation Efficiency of the Isolated Microvesicles. Front. Physiol. 2012, 3, 162. [Google Scholar] [CrossRef] [PubMed] [Green Version]
- Tóth, E.; Turiák, L.; Visnovitz, T.; Cserép, C.; Mázló, A.; Sódar, B.W.; Försönits, A.I.; Petővári, G.; Sebestyén, A.; Komlósi, Z.; et al. Formation of a Protein Corona on the Surface of Extracellular Vesicles in Blood Plasma. J. Extracell. Vesicles 2021, 10, e12140. [Google Scholar] [CrossRef] [PubMed]
- Wolf, M.; Poupardin, R.W.; Ebner-Peking, P.; Andrade, A.C.; Blöchl, C.; Obermayer, A.; Gomes, F.G.; Vari, B.; Maeding, N.; Eminger, E.; et al. A Functional Corona around Extracellular Vesicles Enhances Angiogenesis, Skin Regeneration and Immunomodulation. J. Extracell. Vesicles 2022, 11, e12207. [Google Scholar] [CrossRef] [PubMed]
- Tosar, J.P.; Witwer, K.; Cayota, A. Revisiting Extracellular RNA Release, Processing, and Function. Trends Biochem. Sci. 2021, 46, 438–445. [Google Scholar] [CrossRef]
- Arroyo, J.D.; Chevillet, J.R.; Kroh, E.M.; Ruf, I.K.; Pritchard, C.C.; Gibson, D.F.; Mitchell, P.S.; Bennett, C.F.; Pogosova-Agadjanyan, E.L.; Stirewalt, D.L.; et al. Argonaute2 Complexes Carry a Population of Circulating MicroRNAs Independent of Vesicles in Human Plasma. Proc. Natl. Acad. Sci. USA 2011, 108, 5003–5008. [Google Scholar] [CrossRef] [Green Version]
- Li, K.; Wong, D.K.; Luk, F.S.; Kim, R.Y.; Raffai, R.L. Isolation of Plasma Lipoproteins as a Source of Extracellular RNA. In Extracellular RNA; Methods in Molecular Biology; Humana Press: New York, NY, USA, 2018; Volume 1740, p. 139. [Google Scholar] [CrossRef]
- Théry, C.; Witwer, K.W.; Aikawa, E.; Jose Alcaraz, M.; Anderson, J.D.; Andriantsitohaina, R.; Antoniou, A.; Bach, M.; Bachurski, D.; Baharvand, H.; et al. Minimal Information for Studies of Extracellular Vesicles 2018 (MISEV2018): A Position Statement of the International Society for Extracellular Vesicles and Update of the MISEV2014 Guidelines. J. Extracell. Vesicles 2018, 7, 1535750. [Google Scholar] [CrossRef] [Green Version]
- Driedonks, T.A.P.; Mol, S.; de Bruin, S.; Peters, A.L.; Zhang, X.; Lindenbergh, M.F.S.; Beuger, B.M.; van Stalborch, A.M.D.; Spaan, T.; de Jong, E.C.; et al. Y-RNA Subtype Ratios in Plasma Extracellular Vesicles Are Cell Type- Specific and Are Candidate Biomarkers for Inflammatory Diseases. J. Extracell. Vesicles 2020, 9, 1764213. [Google Scholar] [CrossRef]
- Barman, B.; Sung, B.H.; Krystofiak, E.; Ping, J.; Ramirez, M.; Millis, B.; Allen, R.; Prasad, N.; Chetyrkin, S.; Calcutt, M.W.; et al. VAP-A and Its Binding Partner CERT Drive Biogenesis of RNA-Containing Extracellular Vesicles at ER Membrane Contact Sites. Dev. Cell 2022, 57, 974–994.e8. [Google Scholar] [CrossRef]
- Van Deun, J.; Mestdagh, P.; Agostinis, P.; Akay, Ö.; Anand, S.; Anckaert, J.; Martinez, Z.A.; Baetens, T.; Beghein, E.; Bertier, L.; et al. EV-TRACK: Transparent Reporting and Centralizing Knowledge in Extracellular Vesicle Research. Nat. Methods 2017, 14, 228–232. [Google Scholar] [CrossRef]
- Ter-Ovanesyan, D. Investigation of RNA in Extracellular Vesicles; Harvard University ProQuest Dissertations Publishing: Cambridge, MA, USA, 2019. [Google Scholar]
- Köster, J.; Mölder, F.; Jablonski, K.P.; Letcher, B.; Hall, M.B.; Tomkins-Tinch, C.H.; Sochat, V.; Forster, J.; Lee, S.; Twardziok, S.O.; et al. Sustainable Data Analysis with Snakemake. F1000Research 2021, 10, 33. [Google Scholar] [CrossRef]
- Fischer, D. Fischuu/Pipeline-MiRNA; Stable Release Version 0.6; Zenodo: Honolulu, HI, USA, 2022. [Google Scholar] [CrossRef]
- Martin, M. Cutadapt Removes Adapter Sequences from High-Throughput Sequencing Reads. EMBnet J. 2011, 17, 10–12. [Google Scholar] [CrossRef]
- Langmead, B.; Trapnell, C.; Pop, M.; Salzberg, S.L. Ultrafast and Memory-Efficient Alignment of Short DNA Sequences to the Human Genome. Genome Biol. 2009, 10, R25. [Google Scholar] [CrossRef] [Green Version]
- Chan, P.P.; Lowe, T.M. GtRNAdb 2.0: An Expanded Database of Transfer RNA Genes Identified in Complete and Draft Genomes. Nucleic Acids Res. 2016, 44, D184. [Google Scholar] [CrossRef] [Green Version]
- Dobin, A.; Davis, C.A.; Schlesinger, F.; Drenkow, J.; Zaleski, C.; Jha, S.; Batut, P.; Chaisson, M.; Gingeras, T.R. STAR: Ultrafast Universal RNA-Seq Aligner. Bioinformatics 2013, 29, 15–21. [Google Scholar] [CrossRef]
- Kozomara, A.; Birgaoanu, M.; Griffiths-Jones, S. MiRBase: From MicroRNA Sequences to Function. Nucleic Acids Res. 2019, 47, D155–D162. [Google Scholar] [CrossRef]
- Robinson, M.D.; McCarthy, D.J.; Smyth, G.K. EdgeR: A Bioconductor Package for Differential Expression Analysis of Digital Gene Expression Data. Bioinformatics 2010, 26, 139–140. [Google Scholar] [CrossRef] [Green Version]
- Benjamini, Y.; Hochberg, Y. Controlling the False Discovery Rate: A Practical and Powerful Approach to Multiple Testing. J. R. Stat. Soc. Ser. B 1995, 57, 289–300. [Google Scholar] [CrossRef]
- Karagkouni, D.; Paraskevopoulou, M.D.; Chatzopoulos, S.; Vlachos, I.S.; Tastsoglou, S.; Kanellos, I.; Papadimitriou, D.; Kavakiotis, I.; Maniou, S.; Skoufos, G.; et al. DIANA-TarBase v8: A Decade-Long Collection of Experimentally Supported MiRNA–Gene Interactions. Nucleic Acids Res. 2018, 46, D239–D245. [Google Scholar] [CrossRef] [Green Version]
- Sethupathy, P.; Corda, B.; Hatzigeorgiou, A.G. TarBase: A Comprehensive Database of Experimentally Supported Animal MicroRNA Targets. RNA 2006, 12, 192. [Google Scholar] [CrossRef] [Green Version]
- Wang, X. MiRDB: A MicroRNA Target Prediction and Functional Annotation Database with a Wiki Interface. RNA 2008, 14, 1012. [Google Scholar] [CrossRef] [Green Version]
- Chen, Y.; Wang, X. MiRDB: An Online Database for Prediction of Functional MicroRNA Targets. Nucleic Acids Res. 2020, 48, D127–D131. [Google Scholar] [CrossRef] [PubMed] [Green Version]
- Liu, W.; Wang, X. Prediction of Functional MicroRNA Targets by Integrative Modeling of MicroRNA Binding and Target Expression Data. Genome Biol. 2019, 20, 18. [Google Scholar] [CrossRef] [PubMed]
- Agarwal, V.; Bell, G.W.; Nam, J.W.; Bartel, D.P. Predicting Effective MicroRNA Target Sites in Mammalian MRNAs. eLife 2015, 4, e05005. [Google Scholar] [CrossRef] [PubMed]
- McGeary, S.E.; Lin, K.S.; Shi, C.Y.; Pham, T.M.; Bisaria, N.; Kelley, G.M.; Bartel, D.P. The Biochemical Basis of MicroRNA Targeting Efficacy. Science 2019, 366, eaav1741. [Google Scholar] [CrossRef] [PubMed]
- Maere, S.; Heymans, K.; Kuiper, M. BiNGO: A Cytoscape Plugin to Assess Overrepresentation of Gene Ontology Categories in Biological Networks. Bioinformatics 2005, 21, 3448–3449. [Google Scholar] [CrossRef] [Green Version]
- Ashburner, M.; Ball, C.A.; Blake, J.A.; Botstein, D.; Butler, H.; Cherry, J.M.; Davis, A.P.; Dolinski, K.; Dwight, S.S.; Eppig, J.T.; et al. Gene Ontology: Tool for the Unification of Biology. Nat. Genet. 2000, 25, 25–29. [Google Scholar] [CrossRef] [Green Version]
- Carbon, S.; Douglass, E.; Good, B.M.; Unni, D.R.; Harris, N.L.; Mungall, C.J.; Basu, S.; Chisholm, R.L.; Dodson, R.J.; Hartline, E.; et al. The Gene Ontology Resource: Enriching a GOld Mine. Nucleic Acids Res. 2021, 49, D325–D334. [Google Scholar] [CrossRef]
- Teoria Statistica Delle Classi e Calcolo Delle Probabilità—Carlo E. Bonferroni—Google Books. Available online: https://books.google.fi/books/about/Teoria_statistica_delle_classi_e_calcolo.html?id=3CY-HQAACAAJ&redir_esc=y (accessed on 6 December 2022).
- Raudvere, U.; Kolberg, L.; Kuzmin, I.; Arak, T.; Adler, P.; Peterson, H.; Vilo, J. G: Profiler: A Web Server for Functional Enrichment Analysis and Conversions of Gene Lists (2019 Update). Nucleic Acids Res. 2019, 47, W191–W198. [Google Scholar] [CrossRef] [Green Version]
- Heras-Romero, Y.; Morales-Guadarrama, A.; Santana-Martínez, R.; Ponce, I.; Rincón-Heredia, R.; Poot-Hernández, A.C.; Martínez-Moreno, A.; Urrieta, E.; Bernal-Vicente, B.N.; Campero-Romero, A.N.; et al. Improved Post-Stroke Spontaneous Recovery by Astrocytic Extracellular Vesicles. Mol. Ther. 2022, 30, 798–815. [Google Scholar] [CrossRef]
- Li, S.; Li, L.; Li, J.; Liang, X.; Song, C.; Zou, Y. MiR-203, Fine-Tunning Neuroinflammation by Juggling Different Components of NF-ΚB Signaling. J. Neuroinflamm. 2022, 19, 84. [Google Scholar] [CrossRef]
- Wang, H.; Li, J.; Tao, L.; Lv, L.; Sun, J.; Zhang, T.; Wang, H.; Wang, J. MiR-205 Regulates LRRK2 Expression in Dopamine Neurons in Parkinson’s Disease through Methylation Modification. Iran. J. Public Health 2022, 51, 1637–1647. [Google Scholar] [CrossRef]
- Korvenlaita, N.; Gómez-Budia, M.; Scoyni, F.; Pistono, C.; Giudice, L.; Eamen, S.; Loppi, S.; de Sande, A.H.; Huremagic, B.; Bouvy-Liivrand, M.; et al. Dynamic Release of Neuronal Extracellular Vesicles Containing MiR-21a-5p Is Induced by Hypoxia. J. Extracell. Vesicles 2023, 12, e12297. [Google Scholar] [CrossRef]
- Qian, M.; Chen, Z.; Guo, X.; Wang, S.; Zhang, Z.; Qiu, W.; Qi, Y.; Zhang, S.; Xu, J.; Zhao, R.; et al. Exosomes Derived from Hypoxic Glioma Deliver MiR-1246 and MiR-10b-5p to Normoxic Glioma Cells to Promote Migration and Invasion. Lab. Investig. 2021, 101, 612–624. [Google Scholar] [CrossRef]
- Shabani, M.; Esfahani, B.N.; Ehdaei, B.S.; Moghim, S.; Mirzaei, A.; Sharifi, M.; Mouhebat, L. Inhibition of Herpes Simplex Virus Type 1 Replication by Novel Hsa-MiR-7704 In Vitro. Res. Pharm. Sci. 2019, 14, 167–174. [Google Scholar] [CrossRef]
- Qin, A.Y.; Zhang, X.W.; Liu, L.; Yu, J.P.; Li, H.; Emily Wang, S.Z.; Ren, X.B.; Cao, S. MiR-205 in Cancer: An Angel or a Devil? Eur. J. Cell Biol. 2013, 92, 54–60. [Google Scholar] [CrossRef]
- Chen, X.; Cheng, P.; Hu, C. LncRNA FEZF1-AS1 Accelerates the Migration and Invasion of Laryngeal Squamous Cell Carcinoma Cells through MiR-4497 Targeting GBX2. Eur. Arch. Otorhinolaryngol. 2021, 278, 1523–1535. [Google Scholar] [CrossRef]
- Chen, X.; Zhang, L.; Tang, S. MicroRNA-4497 Functions as a Tumor Suppressor in Laryngeal Squamous Cell Carcinoma via Negatively Modulation the GBX2. Auris Nasus Larynx 2019, 46, 106–113. [Google Scholar] [CrossRef]
- Ghafouri-Fard, S.; Khoshbakht, T.; Hussen, B.M.; Taheri, M.; Samadian, M. A Review on the Role of MiR-1246 in the Pathoetiology of Different Cancers. Front. Mol. Biosci. 2022, 8, 771835. [Google Scholar] [CrossRef]
- Mi, B.; Xiong, Y.; Zhang, C.; Zhou, W.; Chen, L.; Cao, F.; Chen, F.; Geng, Z.; Panayi, A.C.; Sun, Y.; et al. SARS-CoV-2-Induced Overexpression of MiR-4485 Suppresses Osteogenic Differentiation and Impairs Fracture Healing. Int. J. Biol. Sci. 2021, 17, 1277–1288. [Google Scholar] [CrossRef]
- Bian, P.; Liu, C.; Hu, W.; Ding, Y.; Qiu, S.; Li, L. Echinacoside Suppresses the Progression of Breast Cancer by Downregulating the Expression of MiR-4306 and MiR-4508. Integr. Cancer Ther. 2021, 20. [Google Scholar] [CrossRef]
- Park, C.K.; Xu, Z.Z.; Berta, T.; Han, Q.; Chen, G.; Liu, X.J.; Ji, R.R. Extracellular MicroRNAs Activate Nociceptor Neurons to Elicit Pain via TLR7 and TRPA1. Neuron 2014, 82, 47–54. [Google Scholar] [CrossRef] [PubMed] [Green Version]
- Han, Q.; Liu, D.; Convertino, M.; Wang, Z.; Jiang, C.; Kim, Y.H.; Luo, X.; Zhang, X.; Nackley, A.; Dokholyan, N.V.; et al. MiRNA-711 Binds and Activates TRPA1 Extracellularly to Evoke Acute and Chronic Pruritus. Neuron 2018, 99, 449–463.e6. [Google Scholar] [CrossRef] [PubMed] [Green Version]
- Von Felden, J.; Garcia-Lezana, T.; Dogra, N.; Gonzalez-Kozlova, E.; Ahsen, M.E.; Craig, A.; Gifford, S.; Wunsch, B.; Smith, J.T.; Kim, S.; et al. Unannotated Small RNA Clusters Associated with Circulating Extracellular Vesicles Detect Early Stage Liver Cancer. Gut 2022, 71, 2069–2080. [Google Scholar] [CrossRef] [PubMed]
- Nurk, S.; Koren, S.; Rhie, A.; Rautiainen, M.; Bzikadze, A.V.; Mikheenko, A.; Vollger, M.R.; Altemose, N.; Uralsky, L.; Gershman, A.; et al. The Complete Sequence of a Human Genome. Science 2022, 376, 44–53. [Google Scholar] [CrossRef]
- Bart, G.; Fischer, D.; Samoylenko, A.; Zhyvolozhnyi, A.; Stehantsev, P.; Miinalainen, I.; Kaakinen, M.; Nurmi, T.; Singh, P.; Kosamo, S.; et al. Characterization of Nucleic Acids from Extracellular Vesicle-Enriched Human Sweat. BMC Genom. 2021, 22, 425. [Google Scholar] [CrossRef]
- Tosar, J.P.; Gámbaro, F.; Sanguinetti, J.; Bonilla, B.; Witwer, K.W.; Cayota, A. Assessment of Small RNA Sorting into Different Extracellular Fractions Revealed by High-Throughput Sequencing of Breast Cell Lines. Nucleic Acids Res. 2015, 43, 5601–5616. [Google Scholar] [CrossRef] [Green Version]
- Barreiro, K.; Dwivedi, O.P.; Valkonen, S.; Groop, P.H.; Tuomi, T.; Holthofer, H.; Rannikko, A.; Yliperttula, M.; Siljander, P.; Laitinen, S.; et al. Urinary Extracellular Vesicles: Assessment of Pre-Analytical Variables and Development of a Quality Control with Focus on Transcriptomic Biomarker Research. J. Extracell. Vesicles 2021, 10, e12158. [Google Scholar] [CrossRef]
- Webber, J.; Clayton, A. How Pure Are Your Vesicles? J. Extracell. Vesicles 2013, 2, 19861. [Google Scholar] [CrossRef]
- Hill, A.F.; Pegtel, D.M.; Lambertz, U.; Leonardi, T.; O’Driscoll, L.; Pluchino, S.; Ter-Ovanesyan, D.; Hoen, E.N.M.N. ISEV Position Paper: Extracellular Vesicle RNA Analysis and Bioinformatics. J. Extracell. Vesicles 2013, 2, 22859. [Google Scholar] [CrossRef]
- Jolivet, P.; Boulard, C.; Chardot, T.; Anton, M. New Insights into the Structure of Apolipoprotein B from Low-Density Lipoproteins and Identification of a Novel YGP-like Protein in Hen Egg Yolk. J. Agric. Food Chem. 2008, 56, 5871–5879. [Google Scholar] [CrossRef]
- Singh, N.; Bhattacharyya, D. Cholesterol and Its Derivatives Reversibly Inhibit Proteinase K. J. Cell. Physiol. 2017, 232, 596–609. [Google Scholar] [CrossRef]
- Bandeira, F.; Lent, R.; Herculano-Houzel, S. Changing Numbers of Neuronal and Non-Neuronal Cells Underlie Postnatal Brain Growth in the Rat. Proc. Natl. Acad. Sci. USA 2009, 106, 14108–14113. [Google Scholar] [CrossRef] [Green Version]


| Preferentially Secreted miRNAs | |||||||||
|---|---|---|---|---|---|---|---|---|---|
| p-Value | Cellular | EV | EV/Proteinase K/RNase A/T1 | ||||||
| 1 vs. 2 | 1 vs. 3 | 2 vs. 3 | Mean | SD | Mean | SD | Mean | SD | |
| hsa-miR-4497 | 3.44689 × 10⁻⁶ | 3.44689 × 10⁻⁶ | 0.318008849 | 1486.1 | 1445.9 | 17,683.5 | 4737.7 | 27,691.6 | 11,979.7 |
| hsa-miR-7704 | 4.84641 × 10⁻¹¹ | 4.84641 × 10⁻¹¹ | 0.049571908 | 212.4 | 53.8 | 8732.5 | 2130.8 | 17,263.6 | 6224.7 |
| hsa-miR-203a-3p | 1.25252 × 10⁻⁵ | 1.25252 × 10⁻⁵ | 0.004314302 | 35.5 | 26.2 | 942.3 | 173.7 | 17,248.8 | 21,195.2 |
| hsa-miR-203b-5p | 4.3895 × 10⁻⁶ | 4.3895 × 10⁻⁶ | 0.005229131 | 10.4 | 8.1 | 879.7 | 33.4 | 16,387.7 | 20,067.6 |
| hsa-miR-12136 | 0.003894963 | 0.003894963 | 0.799935098 | 2674.0 | 799.1 | 13,600.6 | 2087.0 | 12,101.3 | 14,566.1 |
| hsa-miR-5585-3p | 0.000119697 | 0.000119697 | 0.001698437 | 376.4 | 82.1 | 866.4 | 46.1 | 8608.8 | 11,229.4 |
| hsa-miR-4488 | 7.06203 × 10⁻⁹ | 7.06203 × 10⁻⁹ | 0.111700189 | 126.9 | 44.7 | 3694.3 | 552.9 | 7084.3 | 5297.8 |
| hsa-miR-1246 | 0.002486432 | 0.002486432 | 0.150556157 | 1836.4 | 581.3 | 12,459.7 | 3800.9 | 6997.8 | 2801.1 |
| hsa-miR-4516 | 1.9021 × 10⁻⁷ | 1.9021 × 10⁻⁷ | 0.155468177 | 83.0 | 26.4 | 3167.3 | 102.0 | 6614.2 | 6458.7 |
| hsa-miR-205-5p | 2.21739 × 10⁻⁵ | 2.21739 × 10⁻⁵ | 0.121763527 | 7.2 | 7.9 | 1242.0 | 1463.1 | 5374.7 | 6033.5 |
| hsa-miR-3195 | 3.41776 × 10⁻⁵ | 3.41776 × 10⁻⁵ | 0.299060818 | 342.1 | 195.9 | 2659.3 | 705.8 | 4340.8 | 3783.2 |
| hsa-miR-4492 | 1.26325 × 10⁻⁶ | 1.26325 × 10⁻⁶ | 0.702245337 | 47.4 | 42.5 | 3135.9 | 1309.0 | 2561.7 | 518.3 |
| hsa-miR-4485-3p | 0.00215353 | 0.00215353 | 0.1993365 | 335.0 | 210.3 | 1217.2 | 601.2 | 2554.6 | 3692.2 |
| hsa-miR-4508 | 1.14554 × 10⁻⁵ | 1.14554 × 10⁻⁵ | 0.809739857 | 71.8 | 60.6 | 2086.3 | 377.8 | 2384.9 | 429.1 |
| hsa-miR-183-5p | 0.131353291 | 0.044874832 | 0.001252323 | 904.3 | 168.4 | 636.8 | 156.3 | 1456.1 | 408.2 |
| hsa-miR-122-5p | 6.26532 × 10⁻⁶ | 3.03216 × 10⁻⁷ | 0.140718961 | 68.6 | 4.8 | 565.8 | 197.9 | 962.9 | 235.3 |
| hsa-miR-122b-3p | 7.42542 × 10⁻⁵ | 1.34355 × 10⁻⁶ | 0.067898761 | 62.1 | 7.5 | 397.4 | 123.8 | 815.3 | 186.1 |
| hsa-miR-219a-2-3p | 0.011896228 | 9.17169 × 10⁻⁵ | 0.041862396 | 79.2 | 37.6 | 243.6 | 15.1 | 593.8 | 345.5 |
| hsa-miR-3182 | 0.00388248 | 0.027543506 | 0.280829595 | 58.1 | 49.5 | 1449.8 | 2038.1 | 541.5 | 843.3 |
| hsa-miR-320b | 0.377725867 | 0.046124912 | 0.232894024 | 14.8 | 18.4 | 207.5 | 18.7 | 350.6 | 157.3 |
| hsa-miR-320d | 0.377725867 | 0.046124912 | 0.232894024 | 142/8 | 18,4 | 207.5 | 18.7 | 350.6 | 157.3 |
| hsa-miR-320c | 0.059309372 | 0.014666686 | 0.487932701 | 90.7 | 44.5 | 217.7 | 50.6 | 299.5 | 56.7 |
| hsa-miR-8485 | 0.021271633 | 0.006587555 | 0.543636599 | 33.5 | 23.8 | 181.2 | 153.4 | 275.9 | 271.7 |
| hsa-miR-196b-5p | 1.25523 × 10⁻⁶ | 2.15215 × 10⁻⁸ | 0.061851851 | 11.4 | 0.4 | 61.6 | 5.0 | 114.8 | 53.9 |
| hsa-miR-196a-5p | 0.007104663 | 0.000115384 | 0.082384637 | 19.5 | 8.6 | 50.1 | 30.6 | 97.3 | 46.8 |
| hsa-miR-219a-5p | 0.110077776 | 0.020295633 | 0.36931065 | 14.6 | 5.2 | 43.8 | 10.4 | 82.1 | 58.8 |
| hsa-miR-1269a | 0.110818989 | 0.006215975 | 0.13813471 | 5.2 | 1.4 | 19.8 | 12.3 | 69.9 | 54.4 |
| miRNA | 1 vs. 2 | 1 vs. 3 | 2 vs. 3 | Mean | SD | Mean | SD | Mean | SD |
|---|---|---|---|---|---|---|---|---|---|
| hsa-let-7a-5p | 5.83 × 10⁻⁹ | 1.22 × 10⁻⁸ | 7.30 × 10⁻¹ | 529,093.3 | 79,765.6 | 139,857.4 | 38,543.4 | 147,506.1 | 16,764.8 |
| hsa-let-7b-5p | 1.21 × 10⁻² | 3.17 × 10⁻² | 6.63 × 10⁻¹ | 472,859.8 | 126,401 | 212,171.8 | 46,930.1 | 241,446.2 | 34,655.4 |
| hsa-miR-125b-5p | 1.45 × 10⁻⁶ | 1.73 × 10⁻⁸ | 5.80 × 10⁻² | 319,087.6 | 14,680.1 | 94,938.8 | 11,305.9 | 64,977.1 | 39,435.5 |
| hsa-let-7f-5p | 3.06 × 10⁻⁷ | 6.50 × 10⁻⁸ | 4.95 × 10⁻¹ | 264,282.2 | 49,473.9 | 71,993.5 | 28,249.3 | 63,320.4 | 7203.6 |
| hsa-miR-125a-5p | 1.21 × 10⁻⁴ | 4.86 × 10⁻⁶ | 1.83 × 10⁻¹ | 156,748.4 | 40,381.4 | 42,697.6 | 6905 | 29,103.6 | 17,366.3 |
| hsa-miR-21-5p | 4.29 × 10⁻² | 6.01 × 10⁻² | 8.70 × 10⁻¹ | 124,441.8 | 48,925.7 | 68,901 | 31,859.7 | 72,126.8 | 19,283.1 |
| hsa-let-7i-5p | 2.63 × 10⁻² | 6.53 × 10⁻⁴ | 1.33 × 10⁻¹ | 111,401 | 13,359.8 | 66,078.8 | 23,112.2 | 46,871.5 | 16,231.5 |
| hsa-miR-9-5p | 2.05 × 10⁻³ | 9.43 × 10⁻⁶ | 4.29 × 10⁻² | 75,573.1 | 25,632.3 | 39,619.9 | 8592.5 | 26,560.8 | 7953.5 |
| hsa-let-7c-5p | 1.41 × 10⁻⁴ | 8.59 × 10⁻⁵ | 8.43 × 10⁻¹ | 69,692.5 | 27,534 | 24,635.8 | 5157.6 | 23,533.6 | 3101.8 |
| hsa-let-7e-5p | 1.42 × 10⁻⁴ | 1.34 × 10⁻⁵ | 3.34 × 10⁻¹ | 64,413.8 | 10,642.7 | 19,035.4 | 5293.4 | 14,631.6 | 4079.7 |
| hsa-miR-16-5p | 2.10 × 10⁻³ | 9.51 × 10⁻³ | 5.34 × 10⁻¹ | 59,081 | 9385.1 | 27,564.5 | 11,780.5 | 31,688.8 | 5533.6 |
| hsa-miR-30a-5p | 2.57 × 10⁻² | 1.33 × 10⁻² | 7.69 × 10⁻¹ | 54,005.7 | 21,507.9 | 30,566.2 | 9554.5 | 28,467.3 | 11,094.4 |
| hsa-miR-100-5p | 6.40 × 10⁻¹ | 3.27 × 10⁻¹ | 1.54 × 10⁻¹ | 42,245.5 | 21,385.5 | 47,892 | 4389.6 | 32,398.2 | 6672.9 |
| hsa-miR-221-3p | 3.12 × 10⁻¹ | 4.54 × 10⁻⁵ | 6.31 × 10⁻⁴ | 38,967.4 | 9867.9 | 32,565.1 | 1863.6 | 16,469.9 | 1647 |
| hsa-miR-29a-3p | 9.44 × 10⁻¹ | 1.52 × 10⁻³ | 1.80 × 10⁻³ | 27,723.2 | 6760.4 | 27,171.2 | 6834.6 | 9860.5 | 6266.4 |
| hsa-miR-127-3p | 4.78 × 10⁻¹ | 7.10 × 10⁻³ | 3.51 × 10⁻² | 25,280.3 | 6237.8 | 20,770.9 | 1214.4 | 11,263.9 | 5171.6 |
| hsa-miR-5701 | 1.26 × 10⁻³ | 1.03 × 10⁻⁵ | 4.21 × 10⁻² | 24,280.6 | 11,388.8 | 5983.5 | 4906.1 | 2657.1 | 960.8 |
| hsa-miR-99b-5p | 3.60 × 10⁻³ | 4.76 × 10⁻⁴ | 4.21 × 10⁻¹ | 20,894.3 | 4077.9 | 10,705 | 2112.1 | 9030.7 | 3764.8 |
| hsa-miR-155-5p | 1.85 × 10⁻¹ | 8.49 × 10⁻² | 6.62 × 10⁻¹ | 20,070.4 | 5918.6 | 11,339.5 | 5008.2 | 9422.3 | 4966.9 |
| hsa-miR-191-5p | 3.81 × 10⁻² | 1.50 × 10⁻³ | 1.74 × 10⁻¹ | 19,803.5 | 4049.2 | 11,828 | 771.8 | 8503.3 | 4741.3 |
| hsa-miR-31-5p | 1.14 × 10⁻¹ | 6.65 × 10⁻³ | 1.89 × 10⁻¹ | 19,435.5 | 6663.5 | 11,579.1 | 695.4 | 7556.1 | 5367.7 |
| hsa-miR-432-5p | 5.03 × 10⁻² | 3.76 × 10⁻² | 8.88 × 10⁻¹ | 18,655.3 | 4168.3 | 10,851.8 | 2684.8 | 10,452.5 | 1212.2 |
| hsa-miR-181a-5p | 5.70 × 10⁻² | 7.21 × 10⁻⁵ | 1.01 × 10⁻² | 18,287.2 | 1595.9 | 12,258.9 | 642.7 | 7009.5 | 2056.9 |
| hsa-miR-26a-5p | 4.16 × 10⁻³ | 1.67 × 10⁻³ | 7.08 × 10⁻¹ | 18,210.9 | 5627.8 | 9024 | 2513.7 | 8292.4 | 2714.5 |
| hsa-miR-92a-3p | 2.79 × 10⁻¹ | 8.79 × 10⁻¹ | 2.20 × 10⁻¹ | 14,085.7 | 371.8 | 11,360 | 2628 | 14,518.7 | 8103.1 |
| hsa-miR-10a-5p | 5.25 × 10⁻³ | 6.48 × 10⁻⁵ | 8.66 × 10⁻² | 14,036.5 | 4479.4 | 6903.2 | 1719.8 | 4567.8 | 1295.2 |
| hsa-miR-34a-5p | 6.21 × 10⁻² | 8.50 × 10⁻⁵ | 8.73 × 10⁻³ | 14,017.5 | 4038.1 | 7588.1 | 616.6 | 3067.5 | 2179.7 |
| hsa-miR-30d-5p | 2.04 × 10⁻³ | 3.01 × 10⁻⁴ | 4.38 × 10⁻¹ | 12,473.2 | 596.6 | 5033.3 | 2021.5 | 4092.6 | 2103.3 |
| hsa-miR-151a-3p | 1.32 × 10⁻² | 1.66 × 10⁻² | 9.22 × 10⁻¹ | 11,823.7 | 2825.5 | 6597.2 | 2217.5 | 6739.2 | 1057.9 |
| hsa-miR-409-3p | 1.30 × 10⁻¹ | 8.38 × 10⁻³ | 1.90 × 10⁻¹ | 11,160.4 | 916 | 5990.6 | 871.8 | 3503.2 | 1113.7 |
| hsa-miR-222-3p | 2.55 × 10⁻² | 2.61 × 10⁻³ | 3.33 × 10⁻¹ | 10,942.3 | 1406.4 | 6227.5 | 2143.2 | 4934.5 | 1916.3 |
| hsa-miR-27b-3p | 3.56 × 10⁻² | 1.14 × 10⁻¹ | 5.61 × 10⁻¹ | 10,782 | 970.9 | 5677.7 | 842.3 | 6720.4 | 3611.2 |
| hsa-miR-103b | 1.20 × 10⁻¹ | 1.28 × 10⁻⁴ | 6.84 × 10⁻³ | 10,578 | 2875 | 7452.5 | 2397 | 3915.6 | 656.5 |
| hsa-miR-103a-3p | 1.13 × 10⁻¹ | 2.21 × 10⁻⁴ | 1.22 × 10⁻² | 10,515.6 | 2827.4 | 7346.5 | 2603.3 | 4064 | 591.1 |
| p-Value | Cellular | EV | EV Proteinase K/RNase A/T1 | |||||||
|---|---|---|---|---|---|---|---|---|---|---|
| Ensemble ID | Gene Name | 1 vs. 2 | 1 vs. 3 | 2 vs. 3 | Mean | SD | Mean | SD | Mean | SD |
| ENSG00000056277 | ZNF280C | 3.05 × 10⁻³ | 3.94 × 10⁻¹⁰ | 6.50 × 10⁻⁷ | 2.63 | 0.10 | 49.32 | 19.04 | 7249.93 | 1221.95 |
| ENSG00000130653 | PNPLA7 | 7.47 × 10⁻⁴ | 3.45 × 10⁻⁸ | 2.02 × 10⁻⁴ | 1.33 | 0.05 | 65.26 | 25.19 | 2342.14 | 394.76 |
| ENSG00000160633 | SAFB | 6.80 × 10⁻⁵ | 1.62 × 10⁻⁶ | 1.68 × 10⁻¹ | 26.16 | 0.95 | 754.40 | 291.18 | 1314.36 | 221.53 |
| ENSG00000146247 | PHIP | 2.59 × 10⁻⁵ | 4.96 × 10⁻⁶ | 4.90 × 10⁻¹ | 13.87 | 0.51 | 1071.58 | 413.61 | 1246.43 | 210.08 |
| ENSG00000147606 | SLC26A7 | 5.66 × 10⁻³ | 1.86 × 10⁻⁶ | 1.40 × 10⁻³ | 2.03 | 0.07 | 51.81 | 20.00 | 1171.03 | 197.37 |
| ENSG00000109805 | NCAPG | 1.70 × 10⁻⁴ | 2.28 × 10⁻⁶ | 8.47 × 10⁻² | 9.54 | 0.35 | 387.89 | 149.72 | 1043.40 | 175.86 |
| ENSG00000085831 | TTC39A | 3.15 × 10⁻⁵ | 4.13 × 10⁻⁷ | 6.54 × 10⁻² | 2.72 | 0.10 | 311.02 | 120.05 | 1039.82 | 175.26 |
| ENSG00000142102 | PGGHG | 3.45 × 10⁻² | 1.11 × 10⁻³ | 1.40 × 10⁻¹ | 59.88 | 2.18 | 400.42 | 154.55 | 866.71 | 146.08 |
| ENSG00000163608 | NEPRO | 8.08 × 10⁻³ | 3.28 × 10⁻⁴ | 1.72 × 10⁻¹ | 26.21 | 0.96 | 345.68 | 133.43 | 734.30 | 123.76 |
| ENSG00000147614 | ATP6V0D2 | 4.61 × 10⁻⁴ | 2.58 × 10⁻⁴ | 7.84 × 10⁻¹ | 11.51 | 0.42 | 748.64 | 288.96 | 652.44 | 109.97 |
| ENSG00000112414 | ADGRG6 | 1.68 × 10⁻⁵ | 6.01 × 10⁻⁶ | 6.78 × 10⁻¹ | 9.48 | 0.35 | 659.23 | 254.45 | 609.43 | 102.72 |
| ENSG00000172037 | LAMB2 | 1.56 × 10⁻³ | 1.71 × 10⁻⁴ | 3.23 × 10⁻¹ | 11.42 | 0.42 | 358.42 | 138.34 | 581.29 | 97.97 |
| ENSG00000177888 | ZBTB41 | 3.31 × 10⁻⁵ | 1.30 × 10⁻⁶ | 1.39 × 10⁻¹ | 1.00 | 0.04 | 213.25 | 82.31 | 563.31 | 94.94 |
| ENSG00000196781 | TLE1 | 7.06 × 10⁻³ | 1.62 × 10⁻⁶ | 5.13 × 10⁻⁴ | 0.00 | 0.00 | 7.00 | 2.70 | 561.30 | 94.61 |
| ENSG00000148734 | NPFFR1 | 1.08 × 10⁻⁴ | 1.90 × 10⁻⁵ | 4.39 × 10⁻¹ | 4.98 | 0.18 | 399.44 | 154.17 | 524.36 | 88.38 |
| ENSG00000146054 | TRIM7 | 1.94 × 10⁻⁴ | 2.84 × 10⁻⁵ | 4.47 × 10⁻¹ | 14.09 | 0.51 | 428.12 | 165.25 | 506.73 | 85.41 |
| ENSG00000213398 | LCAT | 1.18 × 10⁻⁴ | 1.57 × 10⁻⁵ | 3.43 × 10⁻¹ | 1.99 | 0.07 | 259.65 | 100.22 | 422.23 | 71.17 |
| ENSG00000137699 | TRIM29 | 7.20 × 10⁻⁸ | 5.26 × 10⁻⁶ | 1.06 × 10⁻¹ | 9.28 | 0.34 | 1857.84 | 717.08 | 403.56 | 68.02 |
| ENSG00000177034 | MTX3 | 2.62 × 10⁻¹ | 3.13 × 10⁻⁴ | 2.42 × 10⁻³ | 1.32 | 0.05 | 6.74 | 2.60 | 375.27 | 63.25 |
| ENSG00000272031 | ANKRD34A | 2.37 × 10⁻⁴ | 2.21 × 10⁻⁵ | 2.54 × 10⁻¹ | 1.32 | 0.05 | 176.66 | 68.19 | 363.44 | 61.26 |
| ENSG00000139641 | ESYT1 | 9.11 × 10⁻⁴ | 1.56 × 10⁻⁴ | 4.13 × 10⁻¹ | 5.12 | 0.19 | 251.43 | 97.05 | 361.36 | 60.91 |
| ENSG00000124493 | GRM4 | 3.77 × 10⁻³ | 2.35 × 10⁻⁵ | 1.70 × 10⁻² | 0.33 | 0.01 | 29.23 | 11.28 | 355.53 | 59.92 |
| ENSG00000156345 | CDK20 | 3.42 × 10⁻¹ | 1.22 × 10⁻⁵ | 4.24 × 10⁻⁵ | 0.00 | 0.00 | 0.31 | 0.12 | 341.28 | 57.52 |
| ENSG00000049239 | H6PD | 7.37 × 10⁻² | 1.64 × 10⁻³ | 5.58 × 10⁻² | 4.28 | 0.16 | 47.02 | 18.15 | 332.48 | 56.04 |
| ENSG00000103034 | NDRG4 | 1.30 × 10⁻² | 1.04 × 10⁻³ | 2.33 × 10⁻¹ | 8.88 | 0.32 | 152.32 | 58.79 | 327.29 | 55.16 |
| ENSG00000006715 | VPS41 | 4.75 × 10⁻³ | 8.03 × 10⁻⁶ | 3.87 × 10⁻³ | 0.00 | 0.00 | 10.03 | 3.87 | 325.90 | 54.93 |
| ENSG00000170190 | SLC16A5 | 7.64 × 10⁻³ | 2.18 × 10⁻⁵ | 5.66 × 10⁻³ | 0.00 | 0.00 | 9.65 | 3.72 | 325.37 | 54.84 |
| ENSG00000166135 | HIF1AN | 2.23 × 10⁻⁴ | 1.84 × 10⁻⁴ | 9.32 × 10⁻¹ | 6.88 | 0.25 | 440.75 | 170.12 | 322.07 | 54.28 |
| ENSG00000149577 | SIDT2 | 2.80 × 10⁻⁶ | 3.16 × 10⁻⁶ | 9.51 × 10⁻¹ | 0.33 | 0.01 | 500.52 | 193.19 | 321.09 | 54.12 |
| ENSG00000163785 | RYK | 6.33 × 10⁻⁴ | 8.99 × 10⁻⁵ | 3.52 × 10⁻¹ | 2.61 | 0.10 | 193.18 | 74.56 | 319.40 | 53.83 |
| ENSG00000177380 | PPFIA3 | 1.95 × 10⁻⁴ | 2.17 × 10⁻⁵ | 3.13 × 10⁻¹ | 1.99 | 0.07 | 187.81 | 72.49 | 318.46 | 53.68 |
| ENSG00000135870 | RC3H1 | 1.61 × 10⁻¹ | 1.27 × 10⁻³ | 1.88 × 10⁻² | 3.62 | 0.13 | 23.39 | 9.03 | 317.04 | 53.44 |
| ENSG00000183778 | B3GALT5 | 6.26 × 10⁻² | 2.03 × 10⁻³ | 1.12 × 10⁻¹ | 14.79 | 0.54 | 103.97 | 40.13 | 307.03 | 51.75 |
| ENSG00000114127 | XRN1 | 2.04 × 10⁻³ | 9.23 × 10⁻⁵ | 1.41 × 10⁻¹ | 1.96 | 0.07 | 101.34 | 39.11 | 307.00 | 51.74 |
| ENSG00000120256 | LRP11 | 1.03 × 10⁻⁴ | 8.04 × 10⁻⁶ | 1.72 × 10⁻¹ | 0.00 | 0.00 | 95.54 | 36.88 | 300.75 | 50.69 |
| ENSG00000164916 | FOXK1 | 4.81 × 10⁻² | 1.10 × 10⁻³ | 6.02 × 10⁻² | 3.33 | 0.12 | 46.46 | 17.93 | 298.61 | 50.33 |
| ENSG00000143552 | NUP210L | 4.12 × 10⁻² | 3.14 × 10⁻⁵ | 1.34 × 10⁻³ | 0.00 | 0.00 | 2.90 | 1.12 | 287.18 | 48.40 |
| ENSG00000171303 | KCNK3 | 2.19 × 10⁻⁴ | 5.36 × 10⁻³ | 1.90 × 10⁻¹ | 33.05 | 1.20 | 1164.85 | 449.61 | 285.04 | 48.04 |
| ENSG00000147164 | SNX12 | 4.87 × 10⁻⁵ | 2.60 × 10⁻⁵ | 7.60 × 10⁻¹ | 1.33 | 0.05 | 311.23 | 120.13 | 280.68 | 47.31 |
| ENSG00000180884 | ZNF792 | 3.04 × 10⁻⁴ | 1.70 × 10⁻⁵ | 1.65 × 10⁻¹ | 0.67 | 0.02 | 102.19 | 39.44 | 278.11 | 46.87 |
| ENSG00000188315 | C3orf62 | 4.71 × 10⁻³ | 9.39 × 10⁻⁵ | 4.85 × 10⁻² | 0.34 | 0.01 | 35.08 | 13.54 | 277.18 | 46.72 |
| ENSG00000159388 | BTG2 | 9.27 × 10⁻³ | 3.31 × 10⁻⁴ | 1.06 × 10⁻¹ | 2.34 | 0.09 | 68.79 | 26.55 | 269.71 | 45.46 |
| ENSG00000121892 | PDS5A | 2.52 × 10⁻² | 1.05 × 10⁻³ | 1.33 × 10⁻¹ | 6.47 | 0.24 | 86.81 | 33.51 | 267.16 | 45.03 |
| ENSG00000161850 | KRT82 | 4.69 × 10⁻² | 1.74 × 10⁻⁴ | 7.98 × 10⁻³ | 0.33 | 0.01 | 8.74 | 3.37 | 261.01 | 43.99 |
| ENSG00000188112 | C6orf132 | 2.37 × 10⁻² | 1.28 × 10⁻⁴ | 1.25 × 10⁻² | 0.33 | 0.01 | 13.02 | 5.03 | 259.72 | 43.77 |
| ENSG00000204577 | LILRB3 | 7.32 × 10⁻⁴ | 1.65 × 10⁻⁴ | 4.88 × 10⁻¹ | 3.68 | 0.13 | 201.86 | 77.91 | 258.14 | 43.51 |
| ENSG00000185651 | UBE2L3 | 6.44 × 10⁻⁴ | 2.16 × 10⁻³ | 5.66 × 10⁻¹ | 10.38 | 0.38 | 640.17 | 247.09 | 255.17 | 43.01 |
| ENSG00000125843 | AP5S1 | 1.80 × 10⁻⁴ | 4.14 × 10⁻⁵ | 4.86 × 10⁻¹ | 1.66 | 0.06 | 195.74 | 75.55 | 252.75 | 42.60 |
| ENSG00000057608 | GDI2 | 2.65 × 10⁻² | 2.07 × 10⁻³ | 2.35 × 10⁻¹ | 11.83 | 0.43 | 125.25 | 48.34 | 251.89 | 42.45 |
| ENSG00000206262 | FOXL2NB | 3.40 × 10⁻² | 1.01 × 10⁻³ | 8.67 × 10⁻² | 3.94 | 0.14 | 56.18 | 21.68 | 251.27 | 42.35 |
| ENSG00000186185 | KIF18B | 7.55 × 10⁻⁴ | 1.27 × 10⁻⁵ | 6.28 × 10⁻² | 0.67 | 0.02 | 57.05 | 22.02 | 248.62 | 41.90 |
| ENSG00000171495 | MROH2B | 4.27 × 10⁻³ | 1.18 × 10⁻⁴ | 9.65 × 10⁻² | 2.02 | 0.07 | 68.24 | 26.34 | 246.60 | 41.56 |
| ENSG00000141837 | CACNA1A | 2.20 × 10⁻⁶ | 3.45 × 10⁻⁶ | 8.37 × 10⁻¹ | 0.99 | 0.04 | 428.96 | 165.57 | 245.22 | 41.33 |
| ENSG00000104967 | NOVA2 | 2.49 × 10⁻¹ | 4.71 × 10⁻³ | 3.96 × 10⁻² | 5.28 | 0.19 | 25.65 | 9.90 | 245.15 | 41.32 |
| ENSG00000077942 | FBLN1 | 5.86 × 10⁻² | 2.24 × 10⁻³ | 1.06 × 10⁻¹ | 5.88 | 0.21 | 60.71 | 23.43 | 242.10 | 40.80 |
| ENSG00000110324 | IL10RA | 1.04 × 10⁻¹ | 2.12 × 10⁻⁴ | 4.13 × 10⁻³ | 0.33 | 0.01 | 4.90 | 1.89 | 233.84 | 39.41 |
| ENSG00000136828 | RALGPS1 | 4.43 × 10⁻¹ | 9.55 × 10⁻³ | 3.74 × 10⁻² | 6.83 | 0.25 | 20.84 | 8.04 | 226.74 | 38.22 |
| ENSG00000122863 | CHST3 | 5.21 × 10⁻² | 1.19 × 10⁻³ | 5.39 × 10⁻² | 1.65 | 0.06 | 27.55 | 10.63 | 225.20 | 37.96 |
| ENSG00000162924 | REL | 9.54 × 10⁻² | 5.51 × 10⁻⁴ | 1.43 × 10⁻² | 1.33 | 0.05 | 13.53 | 5.22 | 217.43 | 36.65 |
| ENSG00000102468 | HTR2A | 1.72 × 10⁻¹ | 3.28 × 10⁻⁴ | 3.55 × 10⁻³ | 0.33 | 0.01 | 3.45 | 1.33 | 213.83 | 36.04 |
| ENSG00000162735 | PEX19 | 7.04 × 10⁻³ | 9.13 × 10⁻⁵ | 2.40 × 10⁻² | 0.00 | 0.00 | 12.61 | 4.87 | 210.82 | 35.53 |
| ENSG00000012048 | BRCA1 | 9.05 × 10⁻⁷ | 2.01 × 10⁻⁶ | 7.17 × 10⁻¹ | 0.66 | 0.02 | 410.82 | 158.57 | 206.53 | 34.81 |
| ENSG00000107949 | BCCIP | 6.48 × 10⁻⁴ | 4.98 × 10⁻⁵ | 1.91 × 10⁻¹ | 0.33 | 0.01 | 73.54 | 28.38 | 204.79 | 34.52 |
| ENSG00000068976 | PYGM | 1.15 × 10⁻² | 3.92 × 10⁻⁴ | 8.71 × 10⁻² | 0.98 | 0.04 | 39.03 | 15.06 | 202.92 | 34.20 |
| ENSG00000154822 | PLCL2 | 3.31 × 10⁻³ | 7.15 × 10⁻⁵ | 4.25 × 10⁻² | 0.00 | 0.00 | 19.33 | 7.46 | 200.14 | 33.73 |
| ENSG00000102178 | UBL4A | 5.80 × 10⁻³ | 9.51 × 10⁻⁵ | 3.10 × 10⁻² | 0.00 | 0.00 | 14.36 | 5.54 | 198.06 | 33.38 |
| ENSG00000157322 | CLEC18A | 1.73 × 10⁻³ | 2.50 × 10⁻⁴ | 3.27 × 10⁻¹ | 1.33 | 0.05 | 103.60 | 39.99 | 196.40 | 33.10 |
| ENSG00000154655 | L3MBTL4 | 2.80 × 10⁻² | 1.84 × 10⁻⁴ | 1.58 × 10⁻² | 0.34 | 0.01 | 11.54 | 4.46 | 195.64 | 32.97 |
| ENSG00000167117 | ANKRD40CL | 1.10 × 10⁻³ | 5.97 × 10⁻⁵ | 1.09 × 10⁻¹ | 0.00 | 0.00 | 37.94 | 14.65 | 194.74 | 32.82 |
| ENSG00000175792 | RUVBL1 | 1.64 × 10⁻³ | 2.60 × 10⁻⁴ | 3.60 × 10⁻¹ | 1.67 | 0.06 | 111.26 | 42.95 | 190.54 | 32.12 |
| ENSG00000226321 | CROCC2 | 6.60 × 10⁻⁴ | 4.99 × 10⁻⁵ | 1.89 × 10⁻¹ | 0.33 | 0.01 | 68.25 | 26.34 | 190.11 | 32.04 |
| ENSG00000183813 | CCR4 | 2.78 × 10⁻² | 3.52 × 10⁻⁴ | 2.70 × 10⁻² | 0.33 | 0.01 | 13.36 | 5.16 | 189.62 | 31.96 |
| ENSG00000108576 | SLC6A4 | 2.84 × 10⁻⁴ | 1.03 × 10⁻⁴ | 6.09 × 10⁻¹ | 1.00 | 0.04 | 166.01 | 64.08 | 187.12 | 31.54 |
| ENSG00000001461 | NIPAL3 | 1.01 × 10⁻² | 5.94 × 10⁻⁴ | 1.46 × 10⁻¹ | 1.33 | 0.05 | 51.41 | 19.84 | 185.44 | 31.26 |
| ENSG00000196664 | TLR7 | 1.74 × 10⁻³ | 2.57 × 10⁻⁴ | 3.24 × 10⁻¹ | 1.01 | 0.04 | 94.64 | 36.53 | 184.81 | 31.15 |
| ENSG00000198626 | RYR2 | 1.86 × 10⁻⁴ | 8.75 × 10⁻⁵ | 7.06 × 10⁻¹ | 0.99 | 0.04 | 184.95 | 71.39 | 181.56 | 30.60 |
| ENSG00000174945 | AMZ1 | 6.04 × 10⁻³ | 4.30 × 10⁻⁴ | 1.90 × 10⁻¹ | 1.69 | 0.06 | 65.49 | 25.28 | 179.80 | 30.30 |
| ENSG00000186517 | ARHGAP30 | 5.88 × 10⁻⁴ | 8.50 × 10⁻⁵ | 2.62 × 10⁻¹ | 0.00 | 0.00 | 66.31 | 25.59 | 178.92 | 30.16 |
| ENSG00000103197 | TSC2 | 7.61 × 10⁻⁵ | 2.86 × 10⁻⁵ | 6.32 × 10⁻¹ | 0.66 | 0.02 | 163.90 | 63.26 | 174.99 | 29.49 |
| ENSG00000089101 | CFAP61 | 3.45 × 10⁻³ | 6.12 × 10⁻⁴ | 3.82 × 10⁻¹ | 2.05 | 0.07 | 103.29 | 39.87 | 174.17 | 29.36 |
| ENSG00000136717 | BIN1 | 2.00 × 10⁻² | 4.27 × 10⁻⁴ | 5.32 × 10⁻² | 0.67 | 0.02 | 22.60 | 8.72 | 173.01 | 29.16 |
| ENSG00000112787 | FBRSL1 | 8.16 × 10⁻² | 1.04 × 10⁻³ | 3.42 × 10⁻² | 1.98 | 0.07 | 19.79 | 7.64 | 171.30 | 28.87 |
| ENSG00000115919 | KYNU | 2.73 × 10⁻⁴ | 3.50 × 10⁻⁴ | 9.04 × 10⁻¹ | 2.31 | 0.08 | 281.22 | 108.55 | 170.18 | 28.68 |
| ENSG00000136274 | NACAD | 1.47 × 10⁻⁴ | 4.01 × 10⁻⁵ | 4.59 × 10⁻¹ | 0.00 | 0.00 | 108.03 | 41.70 | 170.00 | 28.65 |
| ENSG00000171105 | INSR | 7.69 × 10⁻³ | 8.57 × 10⁻⁴ | 2.76 × 10⁻¹ | 2.63 | 0.10 | 80.60 | 31.11 | 169.47 | 28.56 |
| ENSG00000069188 | SDK2 | 1.30 × 10⁻² | 1.23 × 10⁻⁴ | 1.75 × 10⁻² | 0.00 | 0.00 | 7.77 | 3.00 | 168.30 | 28.37 |
| ENSG00000152556 | PFKM | 7.70 × 10⁻¹ | 9.28 × 10⁻³ | 1.51 × 10⁻² | 4.25 | 0.15 | 7.34 | 2.83 | 164.95 | 27.80 |
| ENSG00000162367 | TAL1 | 2.43 × 10⁻³ | 1.24 × 10⁻⁴ | 1.26 × 10⁻¹ | 0.33 | 0.01 | 41.87 | 16.16 | 164.15 | 27.67 |
| ENSG00000181378 | CFAP65 | 7.48 × 10⁻⁵ | 1.61 × 10⁻⁴ | 7.26 × 10⁻¹ | 2.68 | 0.10 | 320.63 | 123.76 | 160.32 | 27.02 |
| ENSG00000155897 | ADCY8 | 7.68 × 10⁻² | 1.48 × 10⁻³ | 4.15 × 10⁻² | 0.99 | 0.04 | 14.74 | 5.69 | 160.22 | 27.00 |
| ENSG00000136869 | TLR4 | 2.58 × 10⁻⁵ | 5.35 × 10⁻⁵ | 7.24 × 10⁻¹ | 0.99 | 0.04 | 325.94 | 125.80 | 159.68 | 26.91 |
| ENSG00000156869 | FRRS1 | 1.11 × 10⁻³ | 3.48 × 10⁻⁵ | 7.13 × 10⁻² | 0.00 | 0.00 | 26.40 | 10.19 | 158.91 | 26.78 |
| ENSG00000047648 | ARHGAP6 | 3.56 × 10⁻³ | 7.42 × 10⁻⁵ | 4.34 × 10⁻² | 0.00 | 0.00 | 16.60 | 6.41 | 158.42 | 26.70 |
| ENSG00000156959 | LHFPL4 | 1.51 × 10⁻³ | 1.41 × 10⁻⁴ | 2.11 × 10⁻¹ | 0.33 | 0.01 | 56.41 | 21.77 | 157.45 | 26.54 |
| ENSG00000133056 | PIK3C2B | 2.25 × 10⁻³ | 4.45 × 10⁻⁴ | 4.06 × 10⁻¹ | 1.31 | 0.05 | 94.09 | 36.32 | 153.32 | 25.84 |
| ENSG00000068323 | TFE3 | 8.87 × 10⁻³ | 6.96 × 10⁻⁴ | 1.93 × 10⁻¹ | 1.35 | 0.05 | 52.22 | 20.16 | 151.32 | 25.51 |
| ENSG00000169876 | MUC17 | 3.73 × 10⁻⁴ | 1.91 × 10⁻⁵ | 1.23 × 10⁻¹ | 0.00 | 0.00 | 39.46 | 15.23 | 151.32 | 25.50 |
| ENSG00000131126 | TEX101 | 2.10 × 10⁻⁷ | 3.73 × 10⁻⁵ | 4.04 × 10⁻² | 3.29 | 0.12 | 1148.45 | 443.28 | 150.42 | 25.35 |
| ENSG00000170390 | DCLK2 | 7.79 × 10⁻³ | 1.72 × 10⁻⁴ | 4.10 × 10⁻² | 0.00 | 0.00 | 12.22 | 4.72 | 147.67 | 24.89 |
| ENSG00000168070 | MAJIN | 5.51 × 10⁻² | 2.05 × 10⁻⁴ | 6.09 × 10⁻³ | 0.00 | 0.00 | 2.63 | 1.01 | 146.68 | 24.72 |
| ENSG00000132874 | SLC14A2 | 3.35 × 10⁻⁵ | 1.73 × 10⁻⁵ | 7.17 × 10⁻¹ | 0.00 | 0.00 | 146.04 | 56.37 | 145.22 | 24.48 |
| ENSG00000153551 | CMTM7 | 4.62 × 10⁻³ | 1.60 × 10⁻⁴ | 6.69 × 10⁻² | 0.00 | 0.00 | 17.38 | 6.71 | 144.92 | 24.43 |
| ENSG00000181215 | C4orf50 | 6.94 × 10⁻⁵ | 3.87 × 10⁻⁵ | 7.65 × 10⁻¹ | 0.34 | 0.01 | 154.72 | 59.72 | 140.95 | 23.76 |
| ENSG00000168961 | LGALS9 | 3.05 × 10⁻³ | 1.20 × 10⁻⁴ | 7.96 × 10⁻² | 0.00 | 0.00 | 20.78 | 8.02 | 140.55 | 23.69 |
| ENSG00000168487 | BMP1 | 2.25 × 10⁻² | 2.55 × 10⁻⁴ | 1.98 × 10⁻² | 0.00 | 0.00 | 6.01 | 2.32 | 139.54 | 23.52 |
| ENSG00000169860 | P2RY1 | 1.55 × 10⁻⁴ | 3.37 × 10⁻⁵ | 3.98 × 10⁻¹ | 0.00 | 0.00 | 80.33 | 31.00 | 139.53 | 23.52 |
| ENSG00000138079 | SLC3A1 | 1.51 × 10⁻² | 8.95 × 10⁻⁴ | 1.42 × 10⁻¹ | 1.00 | 0.04 | 35.48 | 13.69 | 137.33 | 23.15 |
| ENSG00000050767 | COL23A1 | 1.11 × 10⁻¹ | 2.08 × 10⁻⁴ | 2.86 × 10⁻³ | 0.00 | 0.00 | 1.36 | 0.53 | 135.73 | 22.88 |
| ENSG00000183760 | ACP7 | 2.19 × 10⁻² | 1.09 × 10⁻³ | 1.18 × 10⁻¹ | 1.00 | 0.04 | 29.60 | 11.43 | 134.93 | 22.74 |
| ENSG00000188343 | FAM92A | 2.70 × 10⁻² | 2.27 × 10⁻⁴ | 1.48 × 10⁻² | 0.00 | 0.00 | 4.83 | 1.86 | 134.14 | 22.61 |
| ENSG00000006788 | MYH13 | 2.99 × 10⁻³ | 8.27 × 10⁻⁵ | 5.95 × 10⁻² | 0.00 | 0.00 | 17.61 | 6.80 | 133.07 | 22.43 |
| ENSG00000095777 | MYO3A | 5.31 × 10⁻³ | 8.25 × 10⁻⁴ | 3.45 × 10⁻¹ | 1.69 | 0.06 | 71.88 | 27.74 | 131.93 | 22.24 |
| ENSG00000114779 | ABHD14B | 8.15 × 10⁻⁴ | 3.22 × 10⁻⁴ | 6.01 × 10⁻¹ | 0.34 | 0.01 | 104.77 | 40.44 | 128.59 | 21.67 |
| ENSG00000103489 | XYLT1 | 5.14 × 10⁻⁴ | 8.12 × 10⁻⁵ | 2.96 × 10⁻¹ | 0.00 | 0.00 | 53.71 | 20.73 | 125.75 | 21.20 |
| ENSG00000117020 | AKT3 | 1.75 × 10⁻³ | 1.60 × 10⁻⁴ | 1.72 × 10⁻¹ | 0.00 | 0.00 | 32.16 | 12.41 | 125.07 | 21.08 |
| ENSG00000094631 | HDAC6 | 8.49 × 10⁻⁴ | 1.29 × 10⁻⁴ | 3.25 × 10⁻¹ | 0.33 | 0.01 | 63.89 | 24.66 | 124.69 | 21.02 |
| ENSG00000215912 | TTC34 | 9.33 × 10⁻⁴ | 9.98 × 10⁻⁵ | 2.12 × 10⁻¹ | 0.00 | 0.00 | 39.67 | 15.31 | 120.63 | 20.33 |
| ENSG00000155858 | LSM11 | 2.95 × 10⁻³ | 4.26 × 10⁻⁴ | 3.10 × 10⁻¹ | 0.67 | 0.02 | 57.84 | 22.33 | 120.20 | 20.26 |
| ENSG00000176601 | MAP3K19 | 9.62 × 10⁻⁴ | 1.48 × 10⁻⁴ | 3.52 × 10⁻¹ | 0.66 | 0.02 | 69.04 | 26.65 | 119.74 | 20.18 |
| ENSG00000177181 | RIMKLA | 1.10 × 10⁻² | 3.46 × 10⁻⁴ | 5.53 × 10⁻² | 0.00 | 0.00 | 10.80 | 4.17 | 119.21 | 20.09 |
| ENSG00000131951 | LRRC9 | 9.00 × 10⁻³ | 1.25 × 10⁻³ | 2.72 × 10⁻¹ | 0.66 | 0.02 | 45.51 | 17.57 | 118.81 | 20.02 |
| ENSG00000261649 | GOLGA6L7 | 5.73 × 10⁻³ | 8.41 × 10⁻⁴ | 2.96 × 10⁻¹ | 0.66 | 0.02 | 51.27 | 19.79 | 118.80 | 20.02 |
| ENSG00000043591 | ADRB1 | 4.30 × 10⁻³ | 1.06 × 10⁻³ | 4.47 × 10⁻¹ | 0.99 | 0.04 | 73.88 | 28.52 | 118.38 | 19.95 |
| ENSG00000181555 | SETD2 | 2.04 × 10⁻² | 6.36 × 10⁻⁴ | 6.86 × 10⁻² | 0.33 | 0.01 | 16.22 | 6.26 | 118.36 | 19.95 |
| ENSG00000157637 | SLC38A10 | 1.76 × 10⁻³ | 1.90 × 10⁻⁴ | 1.99 × 10⁻¹ | 0.00 | 0.00 | 33.48 | 12.92 | 118.01 | 19.89 |
| ENSG00000140403 | DNAJA4 | 1.37 × 10⁻² | 1.93 × 10⁻³ | 3.00 × 10⁻¹ | 1.67 | 0.06 | 53.70 | 20.73 | 117.28 | 19.77 |
| ENSG00000073803 | MAP3K13 | 1.76 × 10⁻² | 5.29 × 10⁻⁴ | 6.86 × 10⁻² | 0.34 | 0.01 | 17.00 | 6.56 | 117.06 | 19.73 |
| ENSG00000196628 | TCF4 | 9.66 × 10⁻⁶ | 3.68 × 10⁻⁴ | 1.18 × 10⁻¹ | 3.29 | 0.12 | 666.80 | 257.37 | 115.50 | 19.47 |
| ENSG00000011376 | LARS2 | 3.45 × 10⁻⁴ | 5.24 × 10⁻⁵ | 2.99 × 10⁻¹ | 0.00 | 0.00 | 51.95 | 20.05 | 114.89 | 19.36 |
| ENSG00000172349 | IL16 | 7.06 × 10⁻³ | 2.80 × 10⁻⁴ | 9.83 × 10⁻² | 0.33 | 0.01 | 23.81 | 9.19 | 114.77 | 19.34 |
| ENSG00000100401 | RANGAP1 | 3.11 × 10⁻² | 1.96 × 10⁻³ | 1.39 × 10⁻¹ | 0.99 | 0.04 | 26.26 | 10.14 | 113.94 | 19.20 |
| ENSG00000140287 | HDC | 5.49 × 10⁻⁴ | 8.45 × 10⁻⁵ | 2.92 × 10⁻¹ | 0.00 | 0.00 | 48.67 | 18.79 | 113.90 | 19.20 |
| ENSG00000105419 | MEIS3 | 4.49 × 10⁻² | 1.92 × 10⁻³ | 1.03 × 10⁻¹ | 1.31 | 0.05 | 22.99 | 8.87 | 112.87 | 19.02 |
| ENSG00000078900 | TP73 | 8.37 × 10⁻⁴ | 2.08 × 10⁻⁴ | 4.57 × 10⁻¹ | 0.33 | 0.01 | 73.88 | 28.52 | 112.62 | 18.98 |
| ENSG00000171467 | ZNF318 | 1.20 × 10⁻³ | 2.58 × 10⁻⁴ | 4.08 × 10⁻¹ | 0.33 | 0.01 | 65.92 | 25.44 | 112.07 | 18.89 |
| ENSG00000106031 | HOXA13 | 1.60 × 10⁻¹ | 1.60 × 10⁻³ | 2.03 × 10⁻² | 0.66 | 0.02 | 6.04 | 2.33 | 109.86 | 18.52 |
| ENSG00000135766 | EGLN1 | 8.43 × 10⁻³ | 2.12 × 10⁻⁴ | 4.88 × 10⁻² | 0.00 | 0.00 | 10.67 | 4.12 | 108.86 | 18.35 |
| ENSG00000184735 | DDX53 | 2.62 × 10⁻² | 1.32 × 10⁻³ | 1.00 × 10⁻¹ | 0.33 | 0.01 | 16.59 | 6.40 | 107.49 | 18.12 |
| ENSG00000185271 | KLHL33 | 3.79 × 10⁻³ | 7.72 × 10⁻⁴ | 4.05 × 10⁻¹ | 0.99 | 0.04 | 63.67 | 24.58 | 106.27 | 17.91 |
| ENSG00000129451 | KLK10 | 1.00 × 100 | 5.35 × 10⁻⁴ | 4.63 × 10⁻⁴ | 0.00 | 0.00 | 0.00 | 0.00 | 105.86 | 17.84 |
| ENSG00000105289 | TJP3 | 3.46 × 10⁻³ | 2.40 × 10⁻⁴ | 1.31 × 10⁻¹ | 0.00 | 0.00 | 21.56 | 8.32 | 105.60 | 17.80 |
| ENSG00000175806 | MSRA | 5.22 × 10⁻¹ | 7.25 × 10⁻³ | 2.02 × 10⁻² | 1.31 | 0.05 | 3.93 | 1.52 | 103.76 | 17.49 |
| ENSG00000100916 | BRMS1L | 3.44 × 10⁻³ | 4.39 × 10⁻⁴ | 2.66 × 10⁻¹ | 0.33 | 0.01 | 41.76 | 16.12 | 103.26 | 17.40 |
| ENSG00000189350 | TOGARAM2 | 8.38 × 10⁻¹ | 1.39 × 10⁻² | 1.89 × 10⁻² | 2.31 | 0.08 | 3.67 | 1.42 | 101.98 | 17.19 |
| ENSG00000143921 | ABCG8 | 1.27 × 10⁻² | 7.10 × 10⁻⁴ | 1.22 × 10⁻¹ | 0.33 | 0.01 | 21.46 | 8.28 | 101.96 | 17.19 |
| ENSG00000162174 | ASRGL1 | 2.58 × 10⁻³ | 3.31 × 10⁻⁴ | 2.75 × 10⁻¹ | 0.33 | 0.01 | 43.39 | 16.75 | 101.68 | 17.14 |
| ENSG00000162409 | PRKAA2 | 4.24 × 10⁻³ | 9.02 × 10⁻⁴ | 4.00 × 10⁻¹ | 0.66 | 0.02 | 57.18 | 22.07 | 101.60 | 17.12 |
| ENSG00000156886 | ITGAD | 4.53 × 10⁻⁵ | 1.53 × 10⁻⁴ | 4.74 × 10⁻¹ | 0.00 | 0.00 | 345.95 | 133.53 | 101.21 | 17.06 |
| ENSG00000105877 | DNAH11 | 1.17 × 10⁻² | 1.32 × 10⁻³ | 2.34 × 10⁻¹ | 0.66 | 0.02 | 34.95 | 13.49 | 100.05 | 16.86 |
| ENSG00000183808 | RBM12B | 5.58 × 10⁻⁵ | 2.37 × 10⁻⁵ | 6.46 × 10⁻¹ | 0.00 | 0.00 | 91.18 | 35.19 | 99.62 | 16.79 |
| ENSG00000121904 | CSMD2 | 1.86 × 10⁻³ | 1.62 × 10⁻⁴ | 1.71 × 10⁻¹ | 0.00 | 0.00 | 26.45 | 10.21 | 99.47 | 16.77 |
| ENSG00000108950 | FAM20A | 1.01 × 10⁻⁵ | 1.36 × 10⁻⁵ | 8.77 × 10⁻¹ | 0.00 | 0.00 | 170.13 | 65.67 | 99.12 | 16.71 |
| ENSG00000183695 | MRGPRX2 | 1.13 × 10⁻³ | 1.40 × 10⁻⁴ | 2.40 × 10⁻¹ | 0.00 | 0.00 | 35.12 | 13.56 | 99.11 | 16.70 |
| ENSG00000171109 | MFN1 | 1.10 × 10⁻² | 7.66 × 10⁻⁴ | 1.51 × 10⁻¹ | 0.34 | 0.01 | 23.85 | 9.21 | 96.43 | 16.25 |
| ENSG00000141696 | P3H4 | 9.92 × 10⁻⁴ | 1.01 × 10⁻³ | 9.92 × 10⁻¹ | 1.70 | 0.06 | 142.54 | 55.02 | 95.92 | 16.17 |
| ENSG00000188452 | CERKL | 2.54 × 10⁻² | 5.21 × 10⁻⁴ | 5.12 × 10⁻² | 0.33 | 0.01 | 11.96 | 4.61 | 92.00 | 15.51 |
| ENSG00000124120 | TTPAL | 3.33 × 10⁻⁴ | 8.26 × 10⁻⁵ | 4.34 × 10⁻¹ | 0.00 | 0.00 | 55.66 | 21.48 | 91.46 | 15.41 |
| ENSG00000145536 | ADAMTS16 | 9.76 × 10⁻⁵ | 5.18 × 10⁻⁵ | 7.26 × 10⁻¹ | 0.00 | 0.00 | 92.20 | 35.59 | 91.36 | 15.40 |
| ENSG00000106404 | CLDN15 | 7.29 × 10⁻³ | 2.02 × 10⁻⁴ | 5.71 × 10⁻² | 0.00 | 0.00 | 10.75 | 4.15 | 90.85 | 15.31 |
| ENSG00000166260 | COX11 | 2.87 × 10⁻³ | 3.52 × 10⁻⁴ | 2.18 × 10⁻¹ | 0.00 | 0.00 | 26.32 | 10.16 | 90.38 | 15.23 |
| ENSG00000132326 | PER2 | 2.77 × 10⁻³ | 5.87 × 10⁻⁴ | 3.93 × 10⁻¹ | 0.34 | 0.01 | 49.52 | 19.12 | 90.02 | 15.17 |
| ENSG00000110171 | TRIM3 | 1.33 × 10⁻⁴ | 7.89 × 10⁻⁵ | 7.67 × 10⁻¹ | 0.00 | 0.00 | 94.90 | 36.63 | 89.56 | 15.09 |
| ENSG00000147647 | DPYS | 6.33 × 10⁻³ | 1.57 × 10⁻³ | 4.36 × 10⁻¹ | 0.66 | 0.02 | 51.90 | 20.03 | 88.39 | 14.90 |
| ENSG00000117222 | RBBP5 | 5.60 × 10⁻³ | 1.54 × 10⁻³ | 4.87 × 10⁻¹ | 0.99 | 0.04 | 59.64 | 23.02 | 87.90 | 14.82 |
| ENSG00000058729 | RIOK2 | 2.19 × 10⁻³ | 4.52 × 10⁻⁴ | 3.93 × 10⁻¹ | 0.33 | 0.01 | 49.47 | 19.09 | 87.87 | 14.81 |
| ENSG00000023734 | STRAP | 2.31 × 10⁻¹ | 2.20 × 10⁻³ | 1.61 × 10⁻² | 0.33 | 0.01 | 2.87 | 1.11 | 87.03 | 14.67 |
| ENSG00000169242 | EFNA1 | 8.49 × 10⁻¹ | 5.64 × 10⁻³ | 7.12 × 10⁻³ | 0.67 | 0.02 | 1.10 | 0.42 | 86.49 | 14.58 |
| ENSG00000112679 | DUSP22 | 4.83 × 10⁻² | 2.23 × 10⁻³ | 1.01 × 10⁻¹ | 0.66 | 0.02 | 14.88 | 5.75 | 85.81 | 14.46 |
| ENSG00000099341 | PSMD8 | 5.49 × 10⁻³ | 3.34 × 10⁻⁴ | 1.53 × 10⁻¹ | 0.33 | 0.01 | 24.71 | 9.54 | 84.80 | 14.29 |
| ENSG00000140718 | FTO | 5.47 × 10⁻³ | 9.13 × 10⁻⁴ | 3.44 × 10⁻¹ | 0.67 | 0.02 | 43.32 | 16.72 | 84.65 | 14.27 |
| ENSG00000154222 | CC2D1B | 1.91 × 10⁻² | 9.53 × 10⁻⁴ | 1.10 × 10⁻¹ | 0.33 | 0.01 | 16.63 | 6.42 | 84.48 | 14.24 |
| ENSG00000263528 | IKBKE | 2.78 × 10⁻³ | 2.70 × 10⁻⁴ | 1.86 × 10⁻¹ | 0.00 | 0.00 | 22.83 | 8.81 | 84.07 | 14.17 |
| ENSG00000105641 | SLC5A5 | 4.13 × 10⁻² | 1.42 × 10⁻³ | 7.12 × 10⁻² | 0.33 | 0.01 | 10.64 | 4.11 | 83.67 | 14.10 |
| ENSG00000104237 | RP1 | 2.45 × 10⁻² | 8.68 × 10⁻⁴ | 8.01 × 10⁻² | 0.33 | 0.01 | 13.22 | 5.10 | 83.43 | 14.06 |
| ENSG00000143869 | GDF7 | 8.15 × 10⁻⁸ | 8.37 × 10⁻³ | 1.04 × 10⁻⁴ | 12.26 | 0.45 | 3490.31 | 1347.19 | 82.10 | 13.84 |
| ENSG00000134571 | MYBPC3 | 1.01 × 10⁻² | 2.02 × 10⁻³ | 3.69 × 10⁻¹ | 0.66 | 0.02 | 40.75 | 15.73 | 81.63 | 13.76 |
| ENSG00000198646 | NCOA6 | 4.46 × 10⁻⁴ | 1.60 × 10⁻⁴ | 5.54 × 10⁻¹ | 0.00 | 0.00 | 60.49 | 23.35 | 81.62 | 13.76 |
| ENSG00000187244 | BCAM | 4.79 × 10⁻³ | 8.09 × 10⁻⁴ | 2.69 × 10⁻¹ | 0.00 | 0.00 | 25.64 | 9.90 | 81.53 | 13.74 |
| ENSG00000087470 | DNM1L | 8.07 × 10⁻³ | 1.79 × 10⁻³ | 4.04 × 10⁻¹ | 0.66 | 0.02 | 44.09 | 17.02 | 80.20 | 13.52 |
| ENSG00000102144 | PGK1 | 3.55 × 10⁻³ | 3.40 × 10⁻⁴ | 1.79 × 10⁻¹ | 0.00 | 0.00 | 20.53 | 7.93 | 79.73 | 13.44 |
| ENSG00000067842 | ATP2B3 | 1.37 × 10⁻² | 1.83 × 10⁻³ | 2.48 × 10⁻¹ | 0.33 | 0.01 | 26.03 | 10.05 | 78.92 | 13.30 |
| ENSG00000177535 | OR2B11 | 1.85 × 10⁻¹ | 5.93 × 10⁻³ | 4.97 × 10⁻² | 0.34 | 0.01 | 4.35 | 1.68 | 78.84 | 13.29 |
| ENSG00000112335 | SNX3 | 3.54 × 10⁻³ | 1.22 × 10⁻³ | 5.41 × 10⁻¹ | 0.33 | 0.01 | 54.64 | 21.09 | 77.26 | 13.02 |
| ENSG00000134253 | TRIM45 | 2.71 × 10⁻² | 1.15 × 10⁻³ | 6.69 × 10⁻² | 0.00 | 0.00 | 6.41 | 2.48 | 77.18 | 13.01 |
| ENSG00000178568 | ERBB4 | 1.37 × 10⁻³ | 2.45 × 10⁻⁴ | 3.19 × 10⁻¹ | 0.00 | 0.00 | 33.44 | 12.91 | 77.03 | 12.98 |
| ENSG00000168010 | ATG16L2 | 5.15 × 10⁻³ | 1.82 × 10⁻³ | 5.39 × 10⁻¹ | 0.33 | 0.01 | 52.64 | 20.32 | 76.83 | 12.95 |
| ENSG00000172548 | NIPAL4 | 2.05 × 10⁻³ | 2.75 × 10⁻⁴ | 2.49 × 10⁻¹ | 0.00 | 0.00 | 26.94 | 10.40 | 76.50 | 12.89 |
| ENSG00000255587 | RAB44 | 4.01 × 10⁻² | 8.19 × 10⁻⁴ | 3.36 × 10⁻² | 0.00 | 0.00 | 3.95 | 1.52 | 76.45 | 12.89 |
| ENSG00000153246 | PLA2R1 | 1.52 × 10⁻⁶ | 4.52 × 10⁻⁴ | 1.75 × 10⁻² | 1.98 | 0.07 | 1059.16 | 408.81 | 76.44 | 12.88 |
| ENSG00000055957 | ITIH1 | 3.12 × 10⁻¹ | 4.47 × 10⁻³ | 2.42 × 10⁻² | 0.66 | 0.02 | 3.59 | 1.38 | 76.00 | 12.81 |
| ENSG00000121297 | TSHZ3 | 4.30 × 10⁻³ | 3.51 × 10⁻⁴ | 1.56 × 10⁻¹ | 0.00 | 0.00 | 17.51 | 6.76 | 75.15 | 12.67 |
| ENSG00000164035 | EMCN | 5.94 × 10⁻² | 1.43 × 10⁻³ | 3.53 × 10⁻² | 0.00 | 0.00 | 3.10 | 1.20 | 75.01 | 12.64 |
| ENSG00000261594 | TPBGL | 1.88 × 10⁻³ | 2.32 × 10⁻⁴ | 2.40 × 10⁻¹ | 0.00 | 0.00 | 25.97 | 10.02 | 74.15 | 12.50 |
| ENSG00000171540 | OTP | 3.76 × 10⁻¹ | 1.04 × 10⁻² | 4.06 × 10⁻² | 0.66 | 0.02 | 3.35 | 1.29 | 73.67 | 12.42 |
| ENSG00000076201 | PTPN23 | 1.69 × 10⁻¹ | 2.57 × 10⁻³ | 3.23 × 10⁻² | 0.66 | 0.02 | 5.69 | 2.20 | 72.42 | 12.21 |
| ENSG00000110057 | UNC93B1 | 1.57 × 10⁻³ | 7.44 × 10⁻⁴ | 6.78 × 10⁻¹ | 0.33 | 0.01 | 66.02 | 25.48 | 71.64 | 12.08 |
| ENSG00000140522 | RLBP1 | 2.46 × 10⁻¹ | 3.95 × 10⁻³ | 2.60 × 10⁻² | 0.33 | 0.01 | 2.86 | 1.11 | 71.40 | 12.03 |
| ENSG00000092054 | MYH7 | 1.41 × 10⁻⁴ | 6.04 × 10⁻⁴ | 4.55 × 10⁻¹ | 0.66 | 0.02 | 227.55 | 87.83 | 71.32 | 12.02 |
| ENSG00000128891 | CCDC32 | 1.22 × 10⁻⁴ | 3.47 × 10⁻⁴ | 5.81 × 10⁻¹ | 0.33 | 0.01 | 184.19 | 71.10 | 70.18 | 11.83 |
| ENSG00000185189 | NRBP2 | 4.41 × 10⁻³ | 5.55 × 10⁻⁴ | 2.23 × 10⁻¹ | 0.00 | 0.00 | 20.37 | 7.86 | 70.17 | 11.83 |
| ENSG00000013619 | MAMLD1 | 1.10 × 10⁻¹ | 1.38 × 10⁻³ | 1.79 × 10⁻² | 0.00 | 0.00 | 1.60 | 0.62 | 69.11 | 11.65 |
| ENSG00000099899 | TRMT2A | 3.91 × 10⁻³ | 9.09 × 10⁻⁴ | 4.21 × 10⁻¹ | 0.33 | 0.01 | 40.08 | 15.47 | 68.99 | 11.63 |
| ENSG00000149403 | GRIK4 | 1.34 × 10⁻² | 1.58 × 10⁻³ | 1.84 × 10⁻¹ | 0.00 | 0.00 | 13.42 | 5.18 | 68.95 | 11.62 |
| ENSG00000188782 | CATSPER4 | 4.85 × 10⁻² | 1.81 × 10⁻³ | 5.45 × 10⁻² | 0.00 | 0.00 | 3.96 | 1.53 | 68.65 | 11.57 |
| ENSG00000134323 | MYCN | 1.51 × 10⁻³ | 9.28 × 10⁻⁴ | 7.52 × 10⁻¹ | 0.00 | 0.00 | 66.32 | 25.60 | 68.41 | 11.53 |
| ENSG00000121057 | AKAP1 | 3.59 × 10⁻³ | 6.70 × 10⁻⁴ | 3.67 × 10⁻¹ | 0.33 | 0.01 | 36.33 | 14.02 | 68.37 | 11.52 |
| ENSG00000156738 | MS4A1 | 1.56 × 10⁻³ | 3.07 × 10⁻⁴ | 3.50 × 10⁻¹ | 0.00 | 0.00 | 31.86 | 12.30 | 67.83 | 11.43 |
| ENSG00000074211 | PPP2R2C | 3.95 × 10⁻² | 1.78 × 10⁻³ | 1.33 × 10⁻¹ | 1.68 | 0.06 | 21.13 | 8.16 | 67.74 | 11.42 |
| ENSG00000164292 | RHOBTB3 | 6.08 × 10⁻³ | 7.55 × 10⁻⁴ | 2.13 × 10⁻¹ | 0.00 | 0.00 | 18.00 | 6.95 | 67.69 | 11.41 |
| ENSG00000149256 | TENM4 | 4.46 × 10⁻³ | 6.08 × 10⁻⁴ | 2.36 × 10⁻¹ | 0.00 | 0.00 | 20.35 | 7.86 | 67.13 | 11.31 |
| ENSG00000092068 | SLC7A8 | 1.11 × 10⁻² | 7.97 × 10⁻⁴ | 1.26 × 10⁻¹ | 0.00 | 0.00 | 11.17 | 4.31 | 66.75 | 11.25 |
| ENSG00000095464 | PDE6C | 1.59 × 10⁻³ | 5.36 × 10⁻⁴ | 5.07 × 10⁻¹ | 0.00 | 0.00 | 42.19 | 16.29 | 66.73 | 11.25 |
| ENSG00000221968 | FADS3 | 9.78 × 10⁻¹ | 1.05 × 10⁻² | 1.04 × 10⁻² | 0.66 | 0.02 | 0.83 | 0.32 | 66.23 | 11.16 |
| ENSG00000153132 | CLGN | 2.12 × 10⁻¹ | 5.37 × 10⁻³ | 4.11 × 10⁻² | 0.33 | 0.01 | 3.47 | 1.34 | 66.12 | 11.14 |
| ENSG00000116661 | FBXO2 | 1.95 × 10⁻¹ | 6.13 × 10⁻³ | 5.03 × 10⁻² | 0.33 | 0.01 | 3.88 | 1.50 | 65.90 | 11.11 |
| ENSG00000144589 | STK11IP | 4.25 × 10⁻⁴ | 4.28 × 10⁻⁴ | 9.98 × 10⁻¹ | 0.00 | 0.00 | 95.62 | 36.91 | 64.72 | 10.91 |
| ENSG00000135114 | OASL | 3.91 × 10⁻² | 3.11 × 10⁻³ | 1.51 × 10⁻¹ | 0.34 | 0.01 | 13.34 | 5.15 | 63.76 | 10.75 |
| ENSG00000186017 | ZNF566 | 4.54 × 10⁻³ | 7.40 × 10⁻⁴ | 2.72 × 10⁻¹ | 0.00 | 0.00 | 21.42 | 8.27 | 63.52 | 10.71 |
| ENSG00000148840 | PPRC1 | 6.55 × 10⁻⁴ | 7.42 × 10⁻³ | 2.52 × 10⁻¹ | 3.98 | 0.15 | 282.54 | 109.05 | 63.40 | 10.68 |
| ENSG00000248905 | FMN1 | 1.45 × 10⁻¹ | 5.57 × 10⁻³ | 6.47 × 10⁻² | 0.34 | 0.01 | 5.15 | 1.99 | 63.06 | 10.63 |
| ENSG00000204428 | LY6G5C | 2.08 × 10⁻² | 1.07 × 10⁻³ | 8.57 × 10⁻² | 0.00 | 0.00 | 7.10 | 2.74 | 62.75 | 10.58 |
| ENSG00000176095 | IP6K1 | 3.77 × 10⁻² | 1.07 × 10⁻³ | 4.62 × 10⁻² | 0.00 | 0.00 | 4.11 | 1.59 | 61.71 | 10.40 |
| ENSG00000113494 | PRLR | 3.92 × 10⁻³ | 1.68 × 10⁻³ | 6.25 × 10⁻¹ | 0.33 | 0.01 | 50.37 | 19.44 | 61.28 | 10.33 |
| ENSG00000167302 | TEPSIN | 2.93 × 10⁻² | 2.60 × 10⁻³ | 1.28 × 10⁻¹ | 0.00 | 0.00 | 7.33 | 2.83 | 60.71 | 10.23 |
| ENSG00000007314 | SCN4A | 1.26 × 10⁻² | 1.04 × 10⁻³ | 1.39 × 10⁻¹ | 0.00 | 0.00 | 10.53 | 4.07 | 60.39 | 10.18 |
| ENSG00000160410 | SHKBP1 | 8.40 × 10⁻³ | 1.70 × 10⁻³ | 3.66 × 10⁻¹ | 0.33 | 0.01 | 29.65 | 11.45 | 60.35 | 10.17 |
| ENSG00000120156 | TEK | 1.77 × 10⁻³ | 5.46 × 10⁻⁴ | 4.77 × 10⁻¹ | 0.00 | 0.00 | 36.13 | 13.95 | 60.12 | 10.13 |
| ENSG00000001167 | NFYA | 3.92 × 10⁻³ | 7.31 × 10⁻⁴ | 3.14 × 10⁻¹ | 0.00 | 0.00 | 23.50 | 9.07 | 59.90 | 10.10 |
| ENSG00000142409 | ZNF787 | 2.16 × 10⁻³ | 8.92 × 10⁻⁴ | 5.77 × 10⁻¹ | 0.00 | 0.00 | 42.01 | 16.21 | 59.45 | 10.02 |
| ENSG00000123191 | ATP7B | 4.75 × 10⁻⁴ | 5.29 × 10⁻⁴ | 9.49 × 10⁻¹ | 0.00 | 0.00 | 94.41 | 36.44 | 59.29 | 9.99 |
| ENSG00000186496 | ZNF396 | 3.56 × 10⁻² | 3.06 × 10⁻³ | 1.64 × 10⁻¹ | 0.33 | 0.01 | 13.27 | 5.12 | 59.06 | 9.95 |
| ENSG00000153292 | ADGRF1 | 5.98 × 10⁻³ | 9.03 × 10⁻⁴ | 3.11 × 10⁻¹ | 0.33 | 0.01 | 27.30 | 10.54 | 58.98 | 9.94 |
| ENSG00000007216 | SLC13A2 | 9.08 × 10⁻³ | 7.49 × 10⁻⁴ | 1.49 × 10⁻¹ | 0.00 | 0.00 | 12.14 | 4.69 | 58.93 | 9.93 |
| ENSG00000168522 | FNTA | 1.09 × 10⁻³ | 9.17 × 10⁻⁴ | 9.22 × 10⁻¹ | 0.33 | 0.01 | 76.63 | 29.58 | 58.03 | 9.78 |
| ENSG00000213672 | NCKIPSD | 8.13 × 10⁻³ | 8.85 × 10⁻⁴ | 1.87 × 10⁻¹ | 0.00 | 0.00 | 13.89 | 5.36 | 57.98 | 9.77 |
| ENSG00000127241 | MASP1 | 1.37 × 10⁻³ | 1.06 × 10⁻³ | 8.83 × 10⁻¹ | 0.34 | 0.01 | 72.33 | 27.92 | 57.91 | 9.76 |
| ENSG00000284723 | OR8S1 | 3.80 × 10⁻² | 1.46 × 10⁻³ | 6.09 × 10⁻² | 0.00 | 0.00 | 4.41 | 1.70 | 57.67 | 9.72 |
| ENSG00000183317 | EPHA10 | 7.27 × 10⁻³ | 1.76 × 10⁻³ | 3.58 × 10⁻¹ | 0.00 | 0.00 | 22.47 | 8.67 | 57.37 | 9.67 |
| ENSG00000198049 | AVPR1B | 1.00 × 10⁻² | 1.68 × 10⁻³ | 2.60 × 10⁻¹ | 0.00 | 0.00 | 15.80 | 6.10 | 54.89 | 9.25 |
| ENSG00000126464 | PRR12 | 8.91 × 10⁻³ | 1.98 × 10⁻³ | 3.33 × 10⁻¹ | 0.00 | 0.00 | 19.25 | 7.43 | 53.84 | 9.07 |
| ENSG00000198952 | SMG5 | 1.06 × 10⁻¹ | 4.30 × 10⁻³ | 7.41 × 10⁻² | 0.33 | 0.01 | 5.87 | 2.27 | 53.55 | 9.03 |
| ENSG00000162676 | GFI1 | 3.36 × 10⁻² | 2.78 × 10⁻³ | 1.20 × 10⁻¹ | 0.00 | 0.00 | 6.20 | 2.39 | 53.52 | 9.02 |
| ENSG00000099840 | IZUMO4 | 2.10 × 10⁻³ | 8.95 × 10⁻⁴ | 5.94 × 10⁻¹ | 0.00 | 0.00 | 39.46 | 15.23 | 53.41 | 9.00 |
| ENSG00000102935 | ZNF423 | 2.04 × 10⁻³ | 7.68 × 10⁻⁴ | 5.48 × 10⁻¹ | 0.00 | 0.00 | 36.24 | 13.99 | 53.13 | 8.96 |
| ENSG00000149654 | CDH22 | 2.24 × 10⁻³ | 6.17 × 10⁻⁴ | 4.47 × 10⁻¹ | 0.00 | 0.00 | 30.26 | 11.68 | 52.98 | 8.93 |
| ENSG00000160179 | ABCG1 | 1.74 × 10⁻⁵ | 2.23 × 10⁻⁴ | 1.63 × 10⁻¹ | 0.00 | 0.00 | 400.47 | 154.57 | 52.95 | 8.92 |
| ENSG00000198870 | STKLD1 | 6.46 × 10⁻³ | 9.99 × 10⁻⁴ | 2.59 × 10⁻¹ | 0.00 | 0.00 | 16.62 | 6.41 | 52.27 | 8.81 |
| ENSG00000177885 | GRB2 | 1.17 × 10⁻³ | 4.85 × 10⁻⁴ | 5.99 × 10⁻¹ | 0.00 | 0.00 | 40.48 | 15.62 | 52.12 | 8.78 |
| ENSG00000144455 | SUMF1 | 1.85 × 10⁻³ | 2.63 × 10⁻³ | 8.54 × 10⁻¹ | 0.99 | 0.04 | 92.62 | 35.75 | 51.75 | 8.72 |
| ENSG00000095370 | SH2D3C | 4.45 × 10⁻⁴ | 5.78 × 10⁻⁴ | 8.77 × 10⁻¹ | 0.00 | 0.00 | 91.12 | 35.17 | 51.36 | 8.66 |
| ENSG00000123307 | NEUROD4 | 9.84 × 10⁻² | 3.75 × 10⁻³ | 5.09 × 10⁻² | 0.00 | 0.00 | 2.09 | 0.81 | 50.62 | 8.53 |
| ENSG00000138363 | ATIC | 1.20 × 10⁻¹ | 2.37 × 10⁻³ | 4.10 × 10⁻² | 0.33 | 0.01 | 4.50 | 1.74 | 50.51 | 8.51 |
| ENSG00000234828 | IQCM | 1.66 × 10⁻³ | 6.82 × 10⁻⁴ | 5.89 × 10⁻¹ | 0.00 | 0.00 | 37.86 | 14.61 | 50.45 | 8.50 |
| ENSG00000167523 | SPATA33 | 9.57 × 10⁻³ | 1.15 × 10⁻³ | 2.05 × 10⁻¹ | 0.00 | 0.00 | 12.62 | 4.87 | 50.33 | 8.48 |
| ENSG00000142583 | SLC2A5 | 1.40 × 10⁻⁴ | 5.39 × 10⁻⁴ | 4.87 × 10⁻¹ | 0.33 | 0.01 | 152.28 | 58.78 | 50.31 | 8.48 |
| ENSG00000176170 | SPHK1 | 1.46 × 10⁻² | 2.04 × 10⁻³ | 2.17 × 10⁻¹ | 0.00 | 0.00 | 11.82 | 4.56 | 50.26 | 8.47 |
| ENSG00000213762 | ZNF134 | 1.99 × 10⁻¹ | 3.91 × 10⁻³ | 2.46 × 10⁻² | 0.00 | 0.00 | 0.87 | 0.34 | 50.15 | 8.45 |
| ENSG00000093183 | SEC22C | 1.52 × 10⁻² | 2.24 × 10⁻³ | 2.27 × 10⁻¹ | 0.00 | 0.00 | 11.85 | 4.57 | 49.62 | 8.36 |
| ENSG00000140025 | EFCAB11 | 1.84 × 10⁻⁵ | 5.57 × 10⁻⁴ | 1.25 × 10⁻¹ | 1.00 | 0.04 | 302.13 | 116.61 | 48.87 | 8.24 |
| ENSG00000128335 | APOL2 | 4.49 × 10⁻² | 3.60 × 10⁻³ | 1.15 × 10⁻¹ | 0.00 | 0.00 | 5.01 | 1.93 | 48.84 | 8.23 |
| ENSG00000167615 | LENG8 | 1.64 × 10⁻³ | 4.30 × 10⁻⁴ | 4.42 × 10⁻¹ | 0.00 | 0.00 | 28.48 | 10.99 | 48.80 | 8.23 |
| ENSG00000279631 | AL158211.5 | 5.00 × 10⁻² | 3.38 × 10⁻³ | 9.65 × 10⁻² | 0.00 | 0.00 | 4.34 | 1.68 | 48.71 | 8.21 |
| ENSG00000142513 | ACP4 | 6.07 × 10⁻⁵ | 3.61 × 10⁻⁴ | 3.74 × 10⁻¹ | 0.33 | 0.01 | 173.85 | 67.10 | 48.35 | 8.15 |
| ENSG00000129566 | TEP1 | 9.30 × 10⁻³ | 1.49 × 10⁻³ | 2.58 × 10⁻¹ | 0.00 | 0.00 | 14.41 | 5.56 | 48.24 | 8.13 |
| ENSG00000178999 | AURKB | 1.30 × 10⁻¹ | 6.73 × 10⁻⁴ | 8.25 × 10⁻³ | 0.00 | 0.00 | 1.11 | 0.43 | 47.82 | 8.06 |
| ENSG00000243232 | PCDHAC2 | 1.47 × 10⁻¹ | 4.46 × 10⁻³ | 3.86 × 10⁻² | 0.00 | 0.00 | 1.33 | 0.51 | 47.79 | 8.06 |
| ENSG00000158169 | FANCC | 1.29 × 10⁻² | 1.22 × 10⁻³ | 1.63 × 10⁻¹ | 0.00 | 0.00 | 9.81 | 3.79 | 47.57 | 8.02 |
| ENSG00000185359 | HGS | 7.02 × 10⁻² | 1.74 × 10⁻³ | 3.84 × 10⁻² | 0.00 | 0.00 | 2.41 | 0.93 | 47.25 | 7.96 |
| ENSG00000167632 | TRAPPC9 | 9.22 × 10⁻⁴ | 1.91 × 10⁻³ | 7.03 × 10⁻¹ | 0.67 | 0.02 | 103.89 | 40.10 | 47.04 | 7.93 |
| ENSG00000106511 | MEOX2 | 2.97 × 10⁻¹ | 4.32 × 10⁻³ | 8.45 × 10⁻⁴ | 0.33 | 0.01 | 0.00 | 0.00 | 46.84 | 7.89 |
| ENSG00000163075 | CFAP221 | 1.81 × 10⁻² | 2.53 × 10⁻³ | 2.12 × 10⁻¹ | 0.00 | 0.00 | 10.32 | 3.98 | 46.73 | 7.88 |
| ENSG00000116329 | OPRD1 | 1.11 × 10⁻¹ | 2.69 × 10⁻³ | 3.37 × 10⁻² | 0.00 | 0.00 | 1.59 | 0.61 | 46.62 | 7.86 |
| ENSG00000135414 | GDF11 | 1.51 × 10⁻² | 1.59 × 10⁻³ | 1.74 × 10⁻¹ | 0.00 | 0.00 | 9.56 | 3.69 | 46.53 | 7.84 |
| ENSG00000139219 | COL2A1 | 2.69 × 10⁻² | 2.75 × 10⁻³ | 1.54 × 10⁻¹ | 0.00 | 0.00 | 7.20 | 2.78 | 46.47 | 7.83 |
| ENSG00000179046 | TRIML2 | 1.00 × 100 | 2.91 × 10⁻³ | 2.58 × 10⁻³ | 0.00 | 0.00 | 0.00 | 0.00 | 46.37 | 7.82 |
| ENSG00000174145 | NWD2 | 1.88 × 10⁻² | 2.00 × 10⁻³ | 1.68 × 10⁻¹ | 0.00 | 0.00 | 8.61 | 3.32 | 46.37 | 7.81 |
| ENSG00000107338 | SHB | 8.91 × 10⁻² | 4.40 × 10⁻² | 2.63 × 10⁻³ | 1.65 | 0.06 | 0.00 | 0.00 | 46.04 | 7.76 |
| ENSG00000172987 | HPSE2 | 6.23 × 10⁻⁴ | 2.13 × 10⁻⁴ | 5.53 × 10⁻¹ | 0.00 | 0.00 | 35.00 | 13.51 | 45.84 | 7.73 |
| ENSG00000136267 | DGKB | 5.27 × 10⁻⁴ | 3.19 × 10⁻³ | 3.56 × 10⁻¹ | 1.03 | 0.04 | 178.64 | 68.95 | 45.38 | 7.65 |
| ENSG00000141577 | CEP131 | 1.02 × 10⁻¹ | 4.71 × 10⁻³ | 6.06 × 10⁻² | 0.00 | 0.00 | 2.09 | 0.81 | 45.37 | 7.65 |
| ENSG00000122121 | XPNPEP2 | 1.00 × 100 | 3.44 × 10⁻³ | 3.05 × 10⁻³ | 0.00 | 0.00 | 0.00 | 0.00 | 44.33 | 7.47 |
| ENSG00000174871 | CNIH2 | 1.81 × 10⁻³ | 1.02 × 10⁻³ | 7.24 × 10⁻¹ | 0.00 | 0.00 | 41.60 | 16.06 | 44.10 | 7.43 |
| ENSG00000122176 | FMOD | 5.86 × 10⁻⁴ | 6.06 × 10⁻⁴ | 9.85 × 10⁻¹ | 0.00 | 0.00 | 66.08 | 25.51 | 43.89 | 7.40 |
| ENSG00000149305 | HTR3B | 1.79 × 10⁻² | 1.93 × 10⁻³ | 1.73 × 10⁻¹ | 0.00 | 0.00 | 8.63 | 3.33 | 43.83 | 7.39 |
| ENSG00000234224 | TMEM229A | 2.93 × 10⁻² | 1.41 × 10⁻³ | 8.34 × 10⁻² | 0.00 | 0.00 | 4.96 | 1.92 | 43.50 | 7.33 |
| ENSG00000149269 | PAK1 | 1.73 × 10⁻³ | 1.07 × 10⁻³ | 7.63 × 10⁻¹ | 0.00 | 0.00 | 43.31 | 16.71 | 43.24 | 7.29 |
| ENSG00000140945 | CDH13 | 1.97 × 10⁻¹ | 3.07 × 10⁻² | 4.63 × 10⁻³ | 0.66 | 0.02 | 0.00 | 0.00 | 43.18 | 7.28 |
| ENSG00000111331 | OAS3 | 9.44 × 10⁻³ | 1.99 × 10⁻³ | 3.26 × 10⁻¹ | 0.00 | 0.00 | 15.62 | 6.03 | 42.84 | 7.22 |
| ENSG00000169783 | LINGO1 | 1.08 × 10⁻² | 2.01 × 10⁻³ | 2.92 × 10⁻¹ | 0.00 | 0.00 | 14.02 | 5.41 | 42.78 | 7.21 |
| ENSG00000140470 | ADAMTS17 | 2.81 × 10⁻² | 2.94 × 10⁻³ | 1.58 × 10⁻¹ | 0.00 | 0.00 | 6.90 | 2.66 | 42.70 | 7.20 |
| ENSG00000076555 | ACACB | 1.10 × 10⁻² | 1.36 × 10⁻³ | 2.11 × 10⁻¹ | 0.00 | 0.00 | 11.00 | 4.24 | 42.52 | 7.17 |
| ENSG00000104884 | ERCC2 | 2.82 × 10⁻³ | 1.19 × 10⁻³ | 5.93 × 10⁻¹ | 0.00 | 0.00 | 31.44 | 12.13 | 42.50 | 7.16 |
| ENSG00000112530 | PACRG | 3.89 × 10⁻¹ | 6.94 × 10⁻³ | 1.90 × 10⁻² | 0.00 | 0.00 | 0.29 | 0.11 | 41.77 | 7.04 |
| ENSG00000115694 | STK25 | 2.32 × 10⁻² | 2.21 × 10⁻³ | 1.53 × 10⁻¹ | 0.00 | 0.00 | 7.21 | 2.78 | 41.56 | 7.00 |
| ENSG00000102921 | N4BP1 | 1.91 × 10⁻⁶ | 1.74 × 10⁻⁴ | 2.66 × 10⁻² | 0.00 | 0.00 | 822.43 | 317.44 | 41.03 | 6.91 |
| ENSG00000169683 | LRRC45 | 8.86 × 10⁻¹ | 1.06 × 10⁻² | 7.97 × 10⁻³ | 0.33 | 0.01 | 0.30 | 0.11 | 40.91 | 6.90 |
| ENSG00000140093 | SERPINA10 | 2.13 × 10⁻¹ | 6.08 × 10⁻³ | 3.43 × 10⁻² | 0.00 | 0.00 | 0.82 | 0.32 | 40.74 | 6.87 |
| ENSG00000119522 | DENND1A | 3.88 × 10⁻³ | 1.12 × 10⁻³ | 4.48 × 10⁻¹ | 0.00 | 0.00 | 22.13 | 8.54 | 40.41 | 6.81 |
| ENSG00000179889 | PDXDC1 | 1.68 × 10⁻³ | 1.58 × 10⁻³ | 9.70 × 10⁻¹ | 0.33 | 0.01 | 56.49 | 21.81 | 40.03 | 6.75 |
| ENSG00000123977 | DAW1 | 3.57 × 10⁻⁴ | 2.28 × 10⁻⁴ | 8.10 × 10⁻¹ | 0.00 | 0.00 | 45.41 | 17.53 | 39.92 | 6.73 |
| ENSG00000139410 | SDSL | 6.31 × 10⁻³ | 1.50 × 10⁻³ | 3.74 × 10⁻¹ | 0.00 | 0.00 | 17.55 | 6.77 | 39.45 | 6.65 |
| ENSG00000100983 | GSS | 3.04 × 10⁻¹ | 1.33 × 10⁻² | 2.99 × 10⁻³ | 0.33 | 0.01 | 0.00 | 0.00 | 39.25 | 6.62 |
| ENSG00000136861 | CDK5RAP2 | 2.85 × 10⁻¹ | 5.21 × 10⁻⁴ | 3.19 × 10⁻³ | 0.00 | 0.00 | 0.42 | 0.16 | 39.15 | 6.60 |
| ENSG00000117868 | ESYT2 | 1.57 × 10⁻² | 1.82 × 10⁻³ | 1.93 × 10⁻¹ | 0.00 | 0.00 | 9.10 | 3.51 | 39.10 | 6.59 |
| ENSG00000132464 | ENAM | 9.14 × 10⁻² | 3.88 × 10⁻³ | 5.97 × 10⁻² | 0.00 | 0.00 | 2.15 | 0.83 | 39.06 | 6.58 |
| ENSG00000119403 | PHF19 | 1.91 × 10⁻² | 2.36 × 10⁻³ | 1.98 × 10⁻¹ | 0.00 | 0.00 | 8.47 | 3.27 | 38.42 | 6.48 |
| ENSG00000186352 | ANKRD37 | 1.97 × 10⁻¹ | 5.29 × 10⁻³ | 3.36 × 10⁻² | 0.00 | 0.00 | 0.87 | 0.33 | 38.20 | 6.44 |
| ENSG00000110719 | TCIRG1 | 4.29 × 10⁻² | 3.54 × 10⁻³ | 1.24 × 10⁻¹ | 0.00 | 0.00 | 4.67 | 1.80 | 37.83 | 6.38 |
| ENSG00000115145 | STAM2 | 1.00 × 100 | 4.00 × 10⁻³ | 3.55 × 10⁻³ | 0.00 | 0.00 | 0.00 | 0.00 | 37.73 | 6.36 |
| ENSG00000104419 | NDRG1 | 6.84 × 10⁻³ | 1.79 × 10⁻³ | 4.02 × 10⁻¹ | 0.00 | 0.00 | 17.73 | 6.84 | 37.64 | 6.34 |
| ENSG00000139990 | DCAF5 | 6.90 × 10⁻³ | 1.66 × 10⁻³ | 3.78 × 10⁻¹ | 0.00 | 0.00 | 16.79 | 6.48 | 37.62 | 6.34 |
| ENSG00000155096 | AZIN1 | 4.73 × 10⁻³ | 1.60 × 10⁻³ | 4.98 × 10⁻¹ | 0.00 | 0.00 | 22.39 | 8.64 | 37.49 | 6.32 |
| ENSG00000079999 | KEAP1 | 1.19 × 10⁻³ | 1.85 × 10⁻³ | 8.12 × 10⁻¹ | 0.33 | 0.01 | 71.76 | 27.70 | 37.46 | 6.31 |
| ENSG00000119285 | HEATR1 | 1.80 × 10⁻² | 1.14 × 10⁻³ | 1.20 × 10⁻¹ | 0.00 | 0.00 | 6.45 | 2.49 | 37.32 | 6.29 |
| ENSG00000171954 | CYP4F22 | 6.09 × 10⁻³ | 1.26 × 10⁻³ | 3.44 × 10⁻¹ | 0.00 | 0.00 | 15.54 | 6.00 | 36.45 | 6.14 |
| ENSG00000140538 | NTRK3 | 1.15 × 10⁻³ | 5.73 × 10⁻⁴ | 6.84 × 10⁻¹ | 0.00 | 0.00 | 33.31 | 12.86 | 36.44 | 6.14 |
| ENSG00000036448 | MYOM2 | 5.14 × 10⁻³ | 9.91 × 10⁻⁴ | 3.33 × 10⁻¹ | 0.00 | 0.00 | 15.70 | 6.06 | 36.39 | 6.13 |
| ENSG00000177728 | TMEM94 | 5.15 × 10⁻² | 1.69 × 10⁻³ | 5.51 × 10⁻² | 0.00 | 0.00 | 2.92 | 1.13 | 36.36 | 6.13 |
| ENSG00000188522 | FAM83G | 6.49 × 10⁻² | 3.35 × 10⁻³ | 7.71 × 10⁻² | 0.00 | 0.00 | 2.91 | 1.12 | 36.13 | 6.09 |
| ENSG00000189013 | KIR2DL4 | 1.72 × 10⁻¹ | 6.32 × 10⁻³ | 4.59 × 10⁻² | 0.00 | 0.00 | 1.07 | 0.41 | 35.63 | 6.01 |
| ENSG00000170085 | SIMC1 | 6.09 × 10⁻² | 3.29 × 10⁻³ | 8.18 × 10⁻² | 0.00 | 0.00 | 3.10 | 1.20 | 35.39 | 5.97 |
| ENSG00000069431 | ABCC9 | 3.51 × 10⁻⁴ | 4.76 × 10⁻⁴ | 8.64 × 10⁻¹ | 0.00 | 0.00 | 63.13 | 24.37 | 35.29 | 5.95 |
| ENSG00000137055 | PLAA | 2.64 × 10⁻⁴ | 1.15 × 10⁻³ | 4.82 × 10⁻¹ | 0.66 | 0.02 | 101.84 | 39.31 | 35.26 | 5.94 |
| ENSG00000279235 | AC011944.2 | 1.00 × 100 | 9.76 × 10⁻³ | 8.87 × 10⁻³ | 0.00 | 0.00 | 0.00 | 0.00 | 35.21 | 5.93 |
| ENSG00000171475 | WIPF2 | 1.64 × 10⁻³ | 1.25 × 10⁻³ | 8.67 × 10⁻¹ | 0.00 | 0.00 | 41.80 | 16.14 | 35.09 | 5.91 |
| ENSG00000117174 | ZNHIT6 | 7.14 × 10⁻² | 2.48 × 10⁻³ | 5.60 × 10⁻² | 0.00 | 0.00 | 2.42 | 0.93 | 34.79 | 5.86 |
| ENSG00000180448 | ARHGAP45 | 1.90 × 10⁻¹ | 3.25 × 10⁻² | 4.49 × 10⁻³ | 0.67 | 0.02 | 0.00 | 0.00 | 34.79 | 5.86 |
| ENSG00000162415 | ZSWIM5 | 8.88 × 10⁻¹ | 2.17 × 10⁻² | 1.68 × 10⁻² | 0.33 | 0.01 | 0.29 | 0.11 | 34.35 | 5.79 |
| ENSG00000117091 | CD48 | 1.00 × 100 | 9.21 × 10⁻³ | 8.36 × 10⁻³ | 0.00 | 0.00 | 0.00 | 0.00 | 34.21 | 5.77 |
| ENSG00000181804 | SLC9A9 | 3.83 × 10⁻¹ | 7.48 × 10⁻³ | 2.11 × 10⁻² | 0.00 | 0.00 | 0.29 | 0.11 | 34.10 | 5.75 |
| ENSG00000165238 | WNK2 | 2.60 × 10⁻² | 2.62 × 10⁻³ | 1.62 × 10⁻¹ | 0.00 | 0.00 | 6.15 | 2.38 | 33.80 | 5.70 |
| ENSG00000163239 | TDRD10 | 2.31 × 10⁻³ | 7.97 × 10⁻⁴ | 5.41 × 10⁻¹ | 0.00 | 0.00 | 23.85 | 9.21 | 33.70 | 5.68 |
| ENSG00000186009 | ATP4B | 1.00 × 100 | 9.97 × 10⁻³ | 9.06 × 10⁻³ | 0.00 | 0.00 | 0.00 | 0.00 | 33.69 | 5.68 |
| ENSG00000169994 | MYO7B | 4.34 × 10⁻³ | 1.81 × 10⁻³ | 5.83 × 10⁻¹ | 0.00 | 0.00 | 24.04 | 9.28 | 33.58 | 5.66 |
| ENSG00000162068 | NTN3 | 1.00 × 100 | 9.60 × 10⁻³ | 8.71 × 10⁻³ | 0.00 | 0.00 | 0.00 | 0.00 | 33.16 | 5.59 |
| ENSG00000159433 | STARD9 | 4.40 × 10⁻⁴ | 3.12 × 10⁻² | 5.63 × 10⁻² | 4.39 | 0.16 | 309.78 | 119.57 | 32.51 | 5.48 |
| ENSG00000187166 | H1FNT | 3.66 × 10⁻¹ | 9.86 × 10⁻³ | 2.99 × 10⁻² | 0.00 | 0.00 | 0.33 | 0.13 | 32.44 | 5.47 |
| ENSG00000167792 | NDUFV1 | 3.50 × 10⁻² | 1.91 × 10⁻³ | 9.57 × 10⁻² | 0.00 | 0.00 | 4.12 | 1.59 | 31.52 | 5.31 |
| ENSG00000154478 | GPR26 | 8.86 × 10⁻³ | 1.81 × 10⁻³ | 3.34 × 10⁻¹ | 0.00 | 0.00 | 12.61 | 4.87 | 31.35 | 5.28 |
| ENSG00000106052 | TAX1BP1 | 7.96 × 10⁻⁴ | 1.12 × 10⁻³ | 8.39 × 10⁻¹ | 0.00 | 0.00 | 58.36 | 22.52 | 30.96 | 5.22 |
| ENSG00000137210 | TMEM14B | 3.69 × 10⁻¹ | 1.01 × 10⁻² | 3.06 × 10⁻² | 0.00 | 0.00 | 0.33 | 0.13 | 30.66 | 5.17 |
| ENSG00000008735 | MAPK8IP2 | 4.07 × 10⁻³ | 1.81 × 10⁻³ | 6.16 × 10⁻¹ | 0.00 | 0.00 | 23.36 | 9.02 | 30.37 | 5.12 |
| ENSG00000173614 | NMNAT1 | 3.16 × 10⁻¹ | 3.21 × 10⁻² | 8.21 × 10⁻³ | 0.33 | 0.01 | 0.00 | 0.00 | 30.14 | 5.08 |
| ENSG00000132000 | PODNL1 | 3.80 × 10⁻⁶ | 1.01 × 10⁻⁴ | 1.12 × 10⁻¹ | 0.00 | 0.00 | 220.70 | 85.19 | 29.82 | 5.03 |
| ENSG00000198223 | CSF2RA | 3.12 × 10⁻¹ | 3.12 × 10⁻² | 7.89 × 10⁻³ | 0.33 | 0.01 | 0.00 | 0.00 | 29.75 | 5.01 |
| ENSG00000112159 | MDN1 | 4.47 × 10⁻⁴ | 4.12 × 10⁻³ | 2.80 × 10⁻¹ | 0.99 | 0.04 | 130.24 | 50.27 | 29.58 | 4.99 |
| ENSG00000123080 | CDKN2C | 1.27 × 10⁻¹ | 6.29 × 10⁻³ | 6.70 × 10⁻² | 0.00 | 0.00 | 1.59 | 0.61 | 28.83 | 4.86 |
| ENSG00000183840 | GPR39 | 1.61 × 10⁻¹ | 4.81 × 10⁻³ | 4.04 × 10⁻² | 0.00 | 0.00 | 1.09 | 0.42 | 28.69 | 4.84 |
| ENSG00000197312 | DDI2 | 9.52 × 10⁻³ | 2.02 × 10⁻³ | 3.46 × 10⁻¹ | 0.00 | 0.00 | 11.81 | 4.56 | 28.44 | 4.79 |
| ENSG00000137504 | CREBZF | 2.29 × 10⁻¹ | 4.41 × 10⁻³ | 2.56 × 10⁻² | 0.00 | 0.00 | 0.65 | 0.25 | 28.38 | 4.78 |
| ENSG00000177352 | CCDC71 | 1.00 × 100 | 1.20 × 10⁻² | 1.10 × 10⁻² | 0.00 | 0.00 | 0.00 | 0.00 | 28.34 | 4.78 |
| ENSG00000169635 | HIC2 | 1.38 × 10⁻⁵ | 2.71 × 10⁻⁴ | 1.32 × 10⁻¹ | 0.00 | 0.00 | 210.03 | 81.07 | 27.91 | 4.70 |
| ENSG00000103365 | GGA2 | 1.38 × 10⁻¹ | 5.74 × 10⁻³ | 5.63 × 10⁻² | 0.00 | 0.00 | 1.34 | 0.52 | 27.64 | 4.66 |
| ENSG00000104140 | RHOV | 1.00 × 100 | 9.51 × 10⁻³ | 8.57 × 10⁻³ | 0.00 | 0.00 | 0.00 | 0.00 | 27.27 | 4.60 |
| ENSG00000167822 | OR8J3 | 1.03 × 10⁻³ | 2.44 × 10⁻² | 1.05 × 10⁻¹ | 1.65 | 0.06 | 280.21 | 108.15 | 27.17 | 4.58 |
| ENSG00000114650 | SCAP | 3.02 × 10⁻² | 2.72 × 10⁻³ | 1.57 × 10⁻¹ | 0.00 | 0.00 | 5.08 | 1.96 | 27.06 | 4.56 |
| ENSG00000142552 | RCN3 | 1.00 × 100 | 1.27 × 10⁻² | 1.15 × 10⁻² | 0.00 | 0.00 | 0.00 | 0.00 | 26.65 | 4.49 |
| ENSG00000131061 | ZNF341 | 2.31 × 10⁻⁴ | 7.85 × 10⁻⁴ | 4.92 × 10⁻¹ | 0.00 | 0.00 | 86.09 | 33.23 | 26.65 | 4.49 |
| ENSG00000123388 | HOXC11 | 1.00 × 100 | 1.16 × 10⁻² | 1.05 × 10⁻² | 0.00 | 0.00 | 0.00 | 0.00 | 26.49 | 4.46 |
| ENSG00000173334 | TRIB1 | 3.20 × 10⁻¹ | 9.57 × 10⁻³ | 3.95 × 10⁻² | 0.00 | 0.00 | 0.46 | 0.18 | 26.40 | 4.45 |
| ENSG00000095906 | NUBP2 | 1.04 × 10⁻³ | 1.26 × 10⁻³ | 9.13 × 10⁻¹ | 0.00 | 0.00 | 44.23 | 17.07 | 26.36 | 4.44 |
| ENSG00000204385 | SLC44A4 | 1.46 × 10⁻³ | 3.19 × 10⁻³ | 6.12 × 10⁻¹ | 0.00 | 0.00 | 77.60 | 29.95 | 26.33 | 4.44 |
| ENSG00000283654 | LMLN2 | 9.53 × 10⁻⁴ | 3.67 × 10⁻³ | 4.64 × 10⁻¹ | 0.33 | 0.01 | 88.90 | 34.31 | 26.31 | 4.43 |
| ENSG00000059145 | UNKL | 5.72 × 10⁻² | 3.49 × 10⁻³ | 9.76 × 10⁻² | 0.00 | 0.00 | 2.91 | 1.12 | 25.41 | 4.28 |
| ENSG00000165061 | ZMAT4 | 1.00 × 100 | 1.31 × 10⁻² | 1.19 × 10⁻² | 0.00 | 0.00 | 0.00 | 0.00 | 25.21 | 4.25 |
| ENSG00000186106 | ANKRD46 | 9.98 × 10⁻⁴ | 1.21 × 10⁻³ | 9.11 × 10⁻¹ | 0.00 | 0.00 | 42.14 | 16.27 | 25.04 | 4.22 |
| ENSG00000278619 | MRM1 | 1.00 × 100 | 1.04 × 10⁻² | 9.35 × 10⁻³ | 0.00 | 0.00 | 0.00 | 0.00 | 24.69 | 4.16 |
| ENSG00000103995 | CEP152 | 1.10 × 10⁻¹ | 5.16 × 10⁻³ | 7.06 × 10⁻² | 0.00 | 0.00 | 1.69 | 0.65 | 24.50 | 4.13 |
| ENSG00000165071 | TMEM71 | 1.00 × 100 | 1.07 × 10⁻² | 9.69 × 10⁻³ | 0.00 | 0.00 | 0.00 | 0.00 | 24.49 | 4.13 |
| ENSG00000131023 | LATS1 | 1.06 × 10⁻¹ | 5.34 × 10⁻³ | 7.37 × 10⁻² | 0.00 | 0.00 | 1.75 | 0.68 | 24.26 | 4.09 |
| ENSG00000130413 | STK33 | 3.68 × 10⁻¹ | 1.08 × 10⁻² | 3.34 × 10⁻² | 0.00 | 0.00 | 0.33 | 0.13 | 23.91 | 4.03 |
| ENSG00000196967 | ZNF585A | 2.26 × 10⁻³ | 2.09 × 10⁻³ | 9.61 × 10⁻¹ | 0.00 | 0.00 | 33.07 | 12.76 | 23.90 | 4.03 |
| ENSG00000138162 | TACC2 | 2.26 × 10⁻¹ | 8.83 × 10⁻³ | 5.26 × 10⁻² | 0.00 | 0.00 | 0.76 | 0.29 | 23.81 | 4.01 |
| ENSG00000140015 | KCNH5 | 1.00 × 100 | 7.39 × 10⁻³ | 6.57 × 10⁻³ | 0.00 | 0.00 | 0.00 | 0.00 | 23.68 | 3.99 |
| ENSG00000177600 | RPLP2 | 1.16 × 10⁻³ | 1.20 × 10⁻³ | 9.89 × 10⁻¹ | 0.00 | 0.00 | 35.41 | 13.67 | 23.66 | 3.99 |
| ENSG00000149923 | PPP4C | 1.00 × 100 | 5.82 × 10⁻³ | 5.14 × 10⁻³ | 0.00 | 0.00 | 0.00 | 0.00 | 23.56 | 3.97 |
| ENSG00000198104 | OR2T6 | 1.11 × 10⁻² | 9.05 × 10⁻⁴ | 1.76 × 10⁻¹ | 0.00 | 0.00 | 6.76 | 2.61 | 23.44 | 3.95 |
| ENSG00000159882 | ZNF230 | 3.85 × 10⁻¹ | 1.30 × 10⁻² | 3.62 × 10⁻² | 0.00 | 0.00 | 0.29 | 0.11 | 23.25 | 3.92 |
| ENSG00000085719 | CPNE3 | 1.00 × 100 | 7.53 × 10⁻³ | 6.70 × 10⁻³ | 0.00 | 0.00 | 0.00 | 0.00 | 22.48 | 3.79 |
| ENSG00000183921 | SDR42E2 | 1.00 × 100 | 1.45 × 10⁻² | 1.32 × 10⁻² | 0.00 | 0.00 | 0.00 | 0.00 | 22.07 | 3.72 |
| ENSG00000120910 | PPP3CC | 1.00 × 100 | 1.58 × 10⁻² | 1.44 × 10⁻² | 0.00 | 0.00 | 0.00 | 0.00 | 21.89 | 3.69 |
| ENSG00000169813 | HNRNPF | 1.09 × 10⁻¹ | 4.82 × 10⁻³ | 6.61 × 10⁻² | 0.00 | 0.00 | 1.60 | 0.62 | 21.86 | 3.68 |
| ENSG00000169976 | SF3B5 | 5.33 × 10⁻⁴ | 1.90 × 10⁻³ | 4.54 × 10⁻¹ | 0.00 | 0.00 | 80.95 | 31.24 | 21.75 | 3.67 |
| ENSG00000205517 | RGL3 | 1.00 × 100 | 1.49 × 10⁻² | 1.36 × 10⁻² | 0.00 | 0.00 | 0.00 | 0.00 | 21.73 | 3.66 |
| ENSG00000149136 | SSRP1 | 6.70 × 10⁻³ | 1.13 × 10⁻³ | 3.22 × 10⁻¹ | 0.00 | 0.00 | 9.78 | 3.77 | 21.66 | 3.65 |
| ENSG00000108684 | ASIC2 | 1.00 × 100 | 1.45 × 10⁻² | 1.32 × 10⁻² | 0.00 | 0.00 | 0.00 | 0.00 | 21.61 | 3.64 |
| ENSG00000196352 | CD55 | 1.67 × 10⁻³ | 8.10 × 10⁻⁴ | 6.85 × 10⁻¹ | 0.00 | 0.00 | 20.16 | 7.78 | 21.55 | 3.63 |
| ENSG00000123415 | SMUG1 | 3.74 × 10⁻¹ | 7.74 × 10⁻³ | 2.33 × 10⁻² | 0.00 | 0.00 | 0.29 | 0.11 | 21.53 | 3.63 |
| ENSG00000144040 | SFXN5 | 1.00 × 100 | 1.33 × 10⁻² | 1.21 × 10⁻² | 0.00 | 0.00 | 0.00 | 0.00 | 21.45 | 3.62 |
| ENSG00000119760 | SUPT7L | 5.17 × 10⁻⁴ | 2.65 × 10⁻³ | 3.28 × 10⁻¹ | 0.00 | 0.00 | 110.83 | 42.78 | 21.01 | 3.54 |
| ENSG00000141219 | C17orf80 | 1.00 × 100 | 1.29 × 10⁻² | 1.17 × 10⁻² | 0.00 | 0.00 | 0.00 | 0.00 | 19.88 | 3.35 |
| ENSG00000274209 | ANTXRL | 1.00 × 100 | 1.64 × 10⁻² | 1.50 × 10⁻² | 0.00 | 0.00 | 0.00 | 0.00 | 19.80 | 3.34 |
| ENSG00000164535 | DAGLB | 1.00 × 100 | 1.66 × 10⁻² | 1.51 × 10⁻² | 0.00 | 0.00 | 0.00 | 0.00 | 19.66 | 3.31 |
| ENSG00000169249 | ZRSR2 | 1.00 × 100 | 1.65 × 10⁻² | 1.50 × 10⁻² | 0.00 | 0.00 | 0.00 | 0.00 | 19.44 | 3.28 |
| ENSG00000187800 | PEAR1 | 1.00 × 100 | 1.67 × 10⁻² | 1.53 × 10⁻² | 0.00 | 0.00 | 0.00 | 0.00 | 19.41 | 3.27 |
| ENSG00000213221 | DNLZ | 1.00 × 100 | 1.58 × 10⁻² | 1.44 × 10⁻² | 0.00 | 0.00 | 0.00 | 0.00 | 19.29 | 3.25 |
| ENSG00000160951 | PTGER1 | 1.14 × 10⁻³ | 2.69 × 10⁻³ | 6.02 × 10⁻¹ | 0.00 | 0.00 | 55.05 | 21.25 | 19.26 | 3.25 |
| ENSG00000132517 | SLC52A1 | 1.00 × 100 | 1.71 × 10⁻² | 1.56 × 10⁻² | 0.00 | 0.00 | 0.00 | 0.00 | 18.70 | 3.15 |
| ENSG00000008300 | CELSR3 | 1.54 × 10⁻³ | 1.65 × 10⁻³ | 9.71 × 10⁻¹ | 0.00 | 0.00 | 28.66 | 11.06 | 18.67 | 3.15 |
| ENSG00000128052 | KDR | 8.91 × 10⁻⁴ | 3.73 × 10⁻³ | 3.78 × 10⁻¹ | 0.00 | 0.00 | 89.21 | 34.43 | 18.65 | 3.14 |
| ENSG00000183307 | TMEM121B | 3.21 × 10⁻⁴ | 1.42 × 10⁻³ | 4.12 × 10⁻¹ | 0.00 | 0.00 | 70.06 | 27.04 | 18.43 | 3.11 |
| ENSG00000163687 | DNASE1L3 | 1.00 × 100 | 1.79 × 10⁻² | 1.63 × 10⁻² | 0.00 | 0.00 | 0.00 | 0.00 | 18.25 | 3.08 |
| ENSG00000169679 | BUB1 | 1.00 × 100 | 6.44 × 10⁻³ | 5.63 × 10⁻³ | 0.00 | 0.00 | 0.00 | 0.00 | 17.66 | 2.98 |
| ENSG00000164488 | DACT2 | 3.76 × 10⁻⁴ | 7.60 × 10⁻³ | 1.46 × 10⁻¹ | 0.66 | 0.02 | 121.59 | 46.93 | 17.57 | 2.96 |
| ENSG00000151952 | TMEM132D | 1.36 × 10⁻³ | 3.08 × 10⁻³ | 6.24 × 10⁻¹ | 0.00 | 0.00 | 47.33 | 18.27 | 17.34 | 2.92 |
| ENSG00000010292 | NCAPD2 | 1.00 × 100 | 3.21 × 10⁻³ | 2.74 × 10⁻³ | 0.00 | 0.00 | 0.00 | 0.00 | 17.33 | 2.92 |
| ENSG00000164076 | CAMKV | 1.00 × 100 | 1.89 × 10⁻² | 1.72 × 10⁻² | 0.00 | 0.00 | 0.00 | 0.00 | 17.13 | 2.89 |
| ENSG00000205978 | NYNRIN | 7.33 × 10⁻⁷ | 4.92 × 10⁻³ | 8.47 × 10⁻⁴ | 1.00 | 0.04 | 751.28 | 289.98 | 16.86 | 2.84 |
| ENSG00000104881 | PPP1R13L | 1.96 × 10⁻¹ | 7.19 × 10⁻³ | 5.01 × 10⁻² | 0.00 | 0.00 | 0.83 | 0.32 | 16.59 | 2.80 |
| ENSG00000280789 | PAGR1 | 1.00 × 100 | 1.80 × 10⁻² | 1.64 × 10⁻² | 0.00 | 0.00 | 0.00 | 0.00 | 16.57 | 2.79 |
| ENSG00000167702 | KIFC2 | 1.02 × 10⁻³ | 2.57 × 10⁻³ | 5.96 × 10⁻¹ | 0.00 | 0.00 | 44.49 | 17.17 | 15.92 | 2.68 |
| ENSG00000104951 | IL4I1 | 1.00 × 100 | 1.93 × 10⁻² | 1.76 × 10⁻² | 0.00 | 0.00 | 0.00 | 0.00 | 15.90 | 2.68 |
| ENSG00000167617 | CDC42EP5 | 1.00 × 100 | 1.99 × 10⁻² | 1.82 × 10⁻² | 0.00 | 0.00 | 0.00 | 0.00 | 15.89 | 2.68 |
| ENSG00000168675 | LDLRAD4 | 2.01 × 10⁻³ | 1.33 × 10⁻² | 2.94 × 10⁻¹ | 0.34 | 0.01 | 85.19 | 32.88 | 15.78 | 2.66 |
| ENSG00000167513 | CDT1 | 1.52 × 10⁻¹ | 6.36 × 10⁻³ | 6.60 × 10⁻² | 0.00 | 0.00 | 1.09 | 0.42 | 15.59 | 2.63 |
| ENSG00000166682 | TMPRSS5 | 1.00 × 100 | 2.28 × 10⁻² | 2.08 × 10⁻² | 0.00 | 0.00 | 0.00 | 0.00 | 14.52 | 2.45 |
| ENSG00000157450 | RNF111 | 1.91 × 10⁻⁴ | 5.83 × 10⁻³ | 9.49 × 10⁻² | 0.33 | 0.01 | 138.09 | 53.30 | 14.51 | 2.45 |
| ENSG00000169085 | VXN | 1.77 × 10⁻³ | 1.39 × 10⁻² | 2.56 × 10⁻¹ | 0.33 | 0.01 | 85.31 | 32.93 | 14.38 | 2.42 |
| ENSG00000172508 | CARNS1 | 1.00 × 100 | 2.28 × 10⁻² | 2.08 × 10⁻² | 0.00 | 0.00 | 0.00 | 0.00 | 14.16 | 2.39 |
| ENSG00000112115 | IL17A | 1.47 × 10⁻¹ | 5.73 × 10⁻³ | 5.97 × 10⁻² | 0.00 | 0.00 | 1.10 | 0.42 | 14.13 | 2.38 |
| ENSG00000188747 | NOXA1 | 1.00 × 100 | 2.17 × 10⁻² | 1.98 × 10⁻² | 0.00 | 0.00 | 0.00 | 0.00 | 14.05 | 2.37 |
| ENSG00000145907 | G3BP1 | 8.05 × 10⁻⁴ | 2.95 × 10⁻³ | 4.54 × 10⁻¹ | 0.00 | 0.00 | 50.47 | 19.48 | 13.81 | 2.33 |
| ENSG00000135362 | PRR5L | 1.00 × 100 | 2.13 × 10⁻² | 1.94 × 10⁻² | 0.00 | 0.00 | 0.00 | 0.00 | 13.45 | 2.27 |
| ENSG00000048342 | CC2D2A | 1.00 × 100 | 2.14 × 10⁻² | 1.95 × 10⁻² | 0.00 | 0.00 | 0.00 | 0.00 | 13.15 | 2.22 |
| ENSG00000161547 | SRSF2 | 1.00 × 100 | 5.18 × 10⁻³ | 4.43 × 10⁻³ | 0.00 | 0.00 | 0.00 | 0.00 | 12.98 | 2.19 |
| ENSG00000173611 | SCAI | 1.00 × 100 | 2.12 × 10⁻² | 1.93 × 10⁻² | 0.00 | 0.00 | 0.00 | 0.00 | 12.59 | 2.12 |
| ENSG00000101447 | FAM83D | 1.00 × 100 | 2.10 × 10⁻² | 1.90 × 10⁻² | 0.00 | 0.00 | 0.00 | 0.00 | 12.37 | 2.09 |
| ENSG00000124228 | DDX27 | 1.18 × 10⁻¹ | 4.36 × 10⁻³ | 6.40 × 10⁻² | 0.00 | 0.00 | 1.15 | 0.44 | 11.05 | 1.86 |
| ENSG00000164405 | UQCRQ | 1.00 × 100 | 2.29 × 10⁻² | 2.08 × 10⁻² | 0.00 | 0.00 | 0.00 | 0.00 | 10.97 | 1.85 |
| ENSG00000103423 | DNAJA3 | 1.00 × 100 | 1.54 × 10⁻² | 1.36 × 10⁻² | 0.00 | 0.00 | 0.00 | 0.00 | 10.70 | 1.80 |
| Significantly Enriched in EVs | |||
|---|---|---|---|
| Chr | Start | End | Name |
| 20 | 37437053 | 37437078 | novel475_26bp |
| 2 | 185057197 | 185057222 | novel410_26bp |
| 12 | 129972983 | 129973001 | novel153_19bp |
| X | 117500158 | 117500185 | novel914_28bp |
| 13 | 28624284 | 28624304 | novel156_21bp |
| 8 | 114852333 | 114852352 | novel808_20bp |
| Significantly higher in cells | |||
| Chr | start | end | name |
| 7 | 145997340 | 145997428 | novel794_89bp |
| 6 | 27177193 | 27177214 | novel692_22bp |
| 20 | 48612475 | 48612492 | novel478_18bp |
| MT | 311 | 408 | novel894_98bp |
| 11 | 10510171 | 10510209 | novel98_39bp |
| 11 | 10509189 | 10509302 | novel92_114bp |
Disclaimer/Publisher’s Note: The statements, opinions and data contained in all publications are solely those of the individual author(s) and contributor(s) and not of MDPI and/or the editor(s). MDPI and/or the editor(s) disclaim responsibility for any injury to people or property resulting from any ideas, methods, instructions or products referred to in the content. |
© 2023 by the authors. Licensee MDPI, Basel, Switzerland. This article is an open access article distributed under the terms and conditions of the Creative Commons Attribution (CC BY) license (https://creativecommons.org/licenses/by/4.0/).
Share and Cite
Shanthi, K.B.; Fischer, D.; Sharma, A.; Kiviniemi, A.; Kaakinen, M.; Vainio, S.J.; Bart, G. Human Adult Astrocyte Extracellular Vesicle Transcriptomics Study Identifies Specific RNAs Which Are Preferentially Secreted as EV Luminal Cargo. Genes 2023, 14, 853. https://doi.org/10.3390/genes14040853
Shanthi KB, Fischer D, Sharma A, Kiviniemi A, Kaakinen M, Vainio SJ, Bart G. Human Adult Astrocyte Extracellular Vesicle Transcriptomics Study Identifies Specific RNAs Which Are Preferentially Secreted as EV Luminal Cargo. Genes. 2023; 14(4):853. https://doi.org/10.3390/genes14040853
Chicago/Turabian StyleShanthi, Keerthanaa Balasubramanian, Daniel Fischer, Abhishek Sharma, Antti Kiviniemi, Mika Kaakinen, Seppo J. Vainio, and Geneviève Bart. 2023. "Human Adult Astrocyte Extracellular Vesicle Transcriptomics Study Identifies Specific RNAs Which Are Preferentially Secreted as EV Luminal Cargo" Genes 14, no. 4: 853. https://doi.org/10.3390/genes14040853