Article

Whole Genome Sequencing Provides Information on the Genomic Architecture and Diversity of Cultivated Gilthead Seabream (Sparus aurata) Broodstock Nuclei

1
Department of Agricultural and Food Sciences, Division of Animal Sciences, University of Bologna, Viale G. Fanin 46, 40127 Bologna, Italy
2
Centro di Ricerca “Zootecnia e Acquacoltura”, Consiglio per la Ricerca in Agricoltura e l’Analisi dell’Economia Agraria (CREA), 00198 Roma, Italy
3
Panittica Italia Società Agricola Srl, Torre Canne di Fasano, 72016 Brindisi, Italy
4
Department of Animal Science, Iowa State University, Ames, IA 50011-3150, USA
*
Author to whom correspondence should be addressed.
Genes 2023, 14(4), 839; https://doi.org/10.3390/genes14040839
Submission received: 20 February 2023 / Revised: 21 March 2023 / Accepted: 27 March 2023 / Published: 30 March 2023
(This article belongs to the Special Issue Genomics in Aquaculture and Fisheries)

Abstract

:
The gilthead seabream (Sparus aurata) is a species of relevance for the Mediterranean aquaculture industry. Despite the advancement of genetic tools for the species, breeding programs still do not often include genomics. In this study, we designed a genomic strategy to identify signatures of selection and genomic regions of high differentiation among populations of farmed fish stocks. A comparative DNA pooling sequencing approach was applied to identify signatures of selection in gilthead seabream from the same hatchery and from different nuclei that had not been subjected to genetic selection. Identified genomic regions were further investigated to detect SNPs with predicted high impact. The analyses underlined major genomic differences in the proportion of fixed alleles among the investigated nuclei. Some of these differences highlighted genomic regions, including genes involved in general metabolism and development already detected in QTL for growth, size, skeletal deformity, and adaptation to variation of oxygen levels in other teleosts. The obtained results pointed out the need to control the genetic effect of breeding programs in this species to avoid the reduction of genetic variability within populations and the increase in inbreeding level that, in turn, might lead to an increased frequency of alleles with deleterious effects.

1. Introduction

Gilthead seabream (S. aurata) is one of the most relevant species of the Mediterranean aquaculture industry, with an annual production that exceeds 208,808 metric tons, mainly obtained in Turkey, Greece, Croatia, and Italy [1]. The development in seabream aquaculture has been associated with the robustness and plasticity of this species, highly adaptable to different environments and resilient to diet changes and microbial outbreaks [2]. Technological advances in reproduction, larval rearing conditions, production of high-quality feed, disease prevention, and environmental control have supported the expansion of this industry [2,3].
To further support these developments, breeding programs have recently been initiated in Europe to reduce deformities while improving growth, flesh quality, feed efficiency, reproduction, and disease resistance in cultivated gilthead seabream populations, mainly starting from wild and heterogeneous stocks [2,4,5]. In this context, genetic characterization of these semi-domesticated populations might be useful to see how breeding programmes are shaping their genetic background and to evaluate their genetic potential.
More recent advancements at the genomic level, including the production of a complete reference genome for the species [6] and the development of a Single Nucleotide Polymorphism (SNP) array for high throughput genotyping of more than 30,000 SNPs [7], have provided important tools and information to explore cultivated genetic resources of gilthead seabream. These tools have allowed some first attempts to dissect the genetic architecture of economically relevant traits in S. aurata, such as feed efficiency [8], disease resistance [9,10,11], deformity [12], and pigmentation defects [13].
Genomic information can also be useful to investigate the effects of both natural and artificial selection in fish species and to identify signatures of selection that are the footprints left across the genome [14]. These regions might usually harbour functionally important variants that could provide a selective advantage due to their potential effects on economically relevant traits [14,15,16].
Thus far, several population genetic studies have been carried out in gilthead seabream mainly investigating wild and, in few cases, farmed gilthead seabream stocks using mitochondrial DNA markers, microsatellites, or high-density SNP data [7,17,18,19,20,21,22,23,24,25]. Population genetic structures caused by geographic distances, genetic drift, and bottlenecks could be captured. Few of these studies have also attempted to identify signatures of selection in the genome of this species using different types of DNA markers [24,25]. As far as we know, whole genome sequencing data have not been extensively analysed thus far in S. aurata for the same purposes. Whole-genome sequencing of DNA pools constituted from many individuals (Pool-seq) is a cost-effective approach to determine unbiased genome-wide allele frequencies in populations under investigation [26].
In this study, we applied a comparative DNA pooling sequencing approach in gilthead seabream from farmed genetic stocks to detect signatures of selection in the genome of this species. The experimental design was based on the genomic analysis of offspring of different broodstock nuclei out of the same hatchery. As gilthead seabream are mass spawners, reproduction in hatchery facilities is managed in broodstock nuclei that contain several males and females to generate offspring that can be tracked back to the nucleus from which they were generated. These nuclei are not subjected to genetic base selection and were compared to detect genomic regions of high divergence possibly originated by some genetic advantage or by genetic drift and bottleneck effects. These regions were further investigated to detect SNPs with high predicted impact. This study designed a genomic strategy to identify signatures of selection and genomic regions of high differentiation among populations of farmed fish stocks and provided a first picture of the impact of gilthead seabream breeding at the genome level.

2. Materials and Methods

2.1. Gilthead Seabream Populations and Genomic Datasets

The analysed gilthead seabream juveniles were sampled from one commercial hatchery, located in Italy. The samples were offspring from three different broodstock nuclei (nucleus A, B, and C). Each nucleus was composed of 60–87 males and 60–185 females of Atlantic origin. Individual DNA extraction (Promega tissue DNA extraction kit; Promega Corporation, Madison, WI, USA) was carried out from the offspring of these families, which aged approximately 60–66 days post-hatching. Then, five DNA pools were constructed with equimolar contributions of 20 to 30 individual DNA samples: three pools for nucleus A (A1, A2, and A3), one for nucleus B, and one for nucleus C. Whole-genome re-sequencing was carried out from the five DNA pools using Illumina HiSeq 2500, 150 bp paired-end sequencing technology, following the manufacturer’s protocols (Table 1). In addition, raw reads data obtained from 24 DNA pools of wild and farmed seabream data produced by Peñaloza et al. 2021 [7] were retrieved from the Sequence Nucleotide Archive (SRA: PRJEB40423) and used in the first part of the comparative genomic analyses. These raw reads were obtained from farmed and wild populations sampled across the Mediterranean areas. Briefly, these retrieved datasets were from 12 DNA pools derived from farmed stocks of 7 countries and 12 DNA pools of wild stocks from 5 geographical locations. Each DNA pool was constituted by DNA obtained from 14 to 50 fish (Table S1) [7].

2.2. Sequencing, Alignment, and Variant Calling

For each group, pool-seq data (newly produced or retrieved from a previous study [7]) were trimmed with Trimmomatic v. 0.38 [27] with the following parameters: HEADCROP:9 and SLIDINGWINDOW:4:15 for the datasets produced from the investigated hatchery and MINLEN:36, CROP:148, SLIDINGWINDOW:4:15, and MINLEN:36 for the datasets retrieved from Peñaloza et al. 2021 [7]. Filtered paired reads were aligned to the gilthead seabream reference genome fSpaAur1.2 (NCBI accession no. GCA_900880675.1) using BWA 0.7.12 [28] with the mem function and standard options. Reads were filtered removing PCR duplicates and retaining only those with mapping quality of at least 30 using Samtools v1.10 [29]. Variant calling on the mapped reads was performed with the CRISP software using default parameters [30]. Only bi-allelic SNPs with quality >100 and depth ≥ 40 averaged across the datasets were considered.
The effect of each detected SNP was assessed with the Variant Effect Predictor [31] based on the gilthead seabream reference genome (GCA_900880675.1).

2.3. Population Genomic Analyses and Genome Annotation

Using the filtered SNPs from all DNA-pools, a Principal Component Analyses (PCA) was obtained with the “prcomp” function of R (https://www.R-project.org/ (accessed on 20 May 2022)).
Pairwise FST values between DNA pools were calculated for each SNP located on assembled chromosomes, adapting the formula reported by Karlsson et al. 2007 [32]:
F s t = k = 1 k N k k = 1 k D k N k = p 1 k ( q 2 k q 1 k ) + p 2 k ( q 1 k q 2 k ) D k = p 1 k q 2 k + p 2 k q 1 k
where 1, 2, kK is the number of biallelic markers in the two populations and the variant allele for marker k has the frequencies p 1 k and p 2 k in the two populations. The global FST of each pairwise comparison was retrieved by averaging the FST calculated for each SNP. In this case, all DNA pools derived from wild populations and all DNA pools derived from farmed populations of the previous study [7] were analysed both as one wild and one farmed group and as separate populations.
For comparisons among the farmed Italian juvenile DNA pools, mean FST values (mFST) were calculated by averaging the SNP-based FST in 50% overlapping window sizes of 500 kb, as already described in previous studies [12,13]. Here, windows with mFST values above the 99th percentile of the empirical distribution and with more than 200 SNPs were retained for further analyses.
Genes within these outlier regions were retrieved with bedtools [33] with the genome annotation file provided for fSpaAur1.2 in NCBI. Gene enrichment was performed among the genes in the outlier regions with PANTHER [34] and Danio rerio selected as the reference gene set. In this analysis, only Gene Ontology (GO) terms related to biological pathways with false discovery rate (FDR) <0.05 were considered as significantly enriched. Redundant GO terms were removed with REVIGO [35] considering the D. rerio database and applying SimRel as semantic similarity measure.

3. Results and Discussion

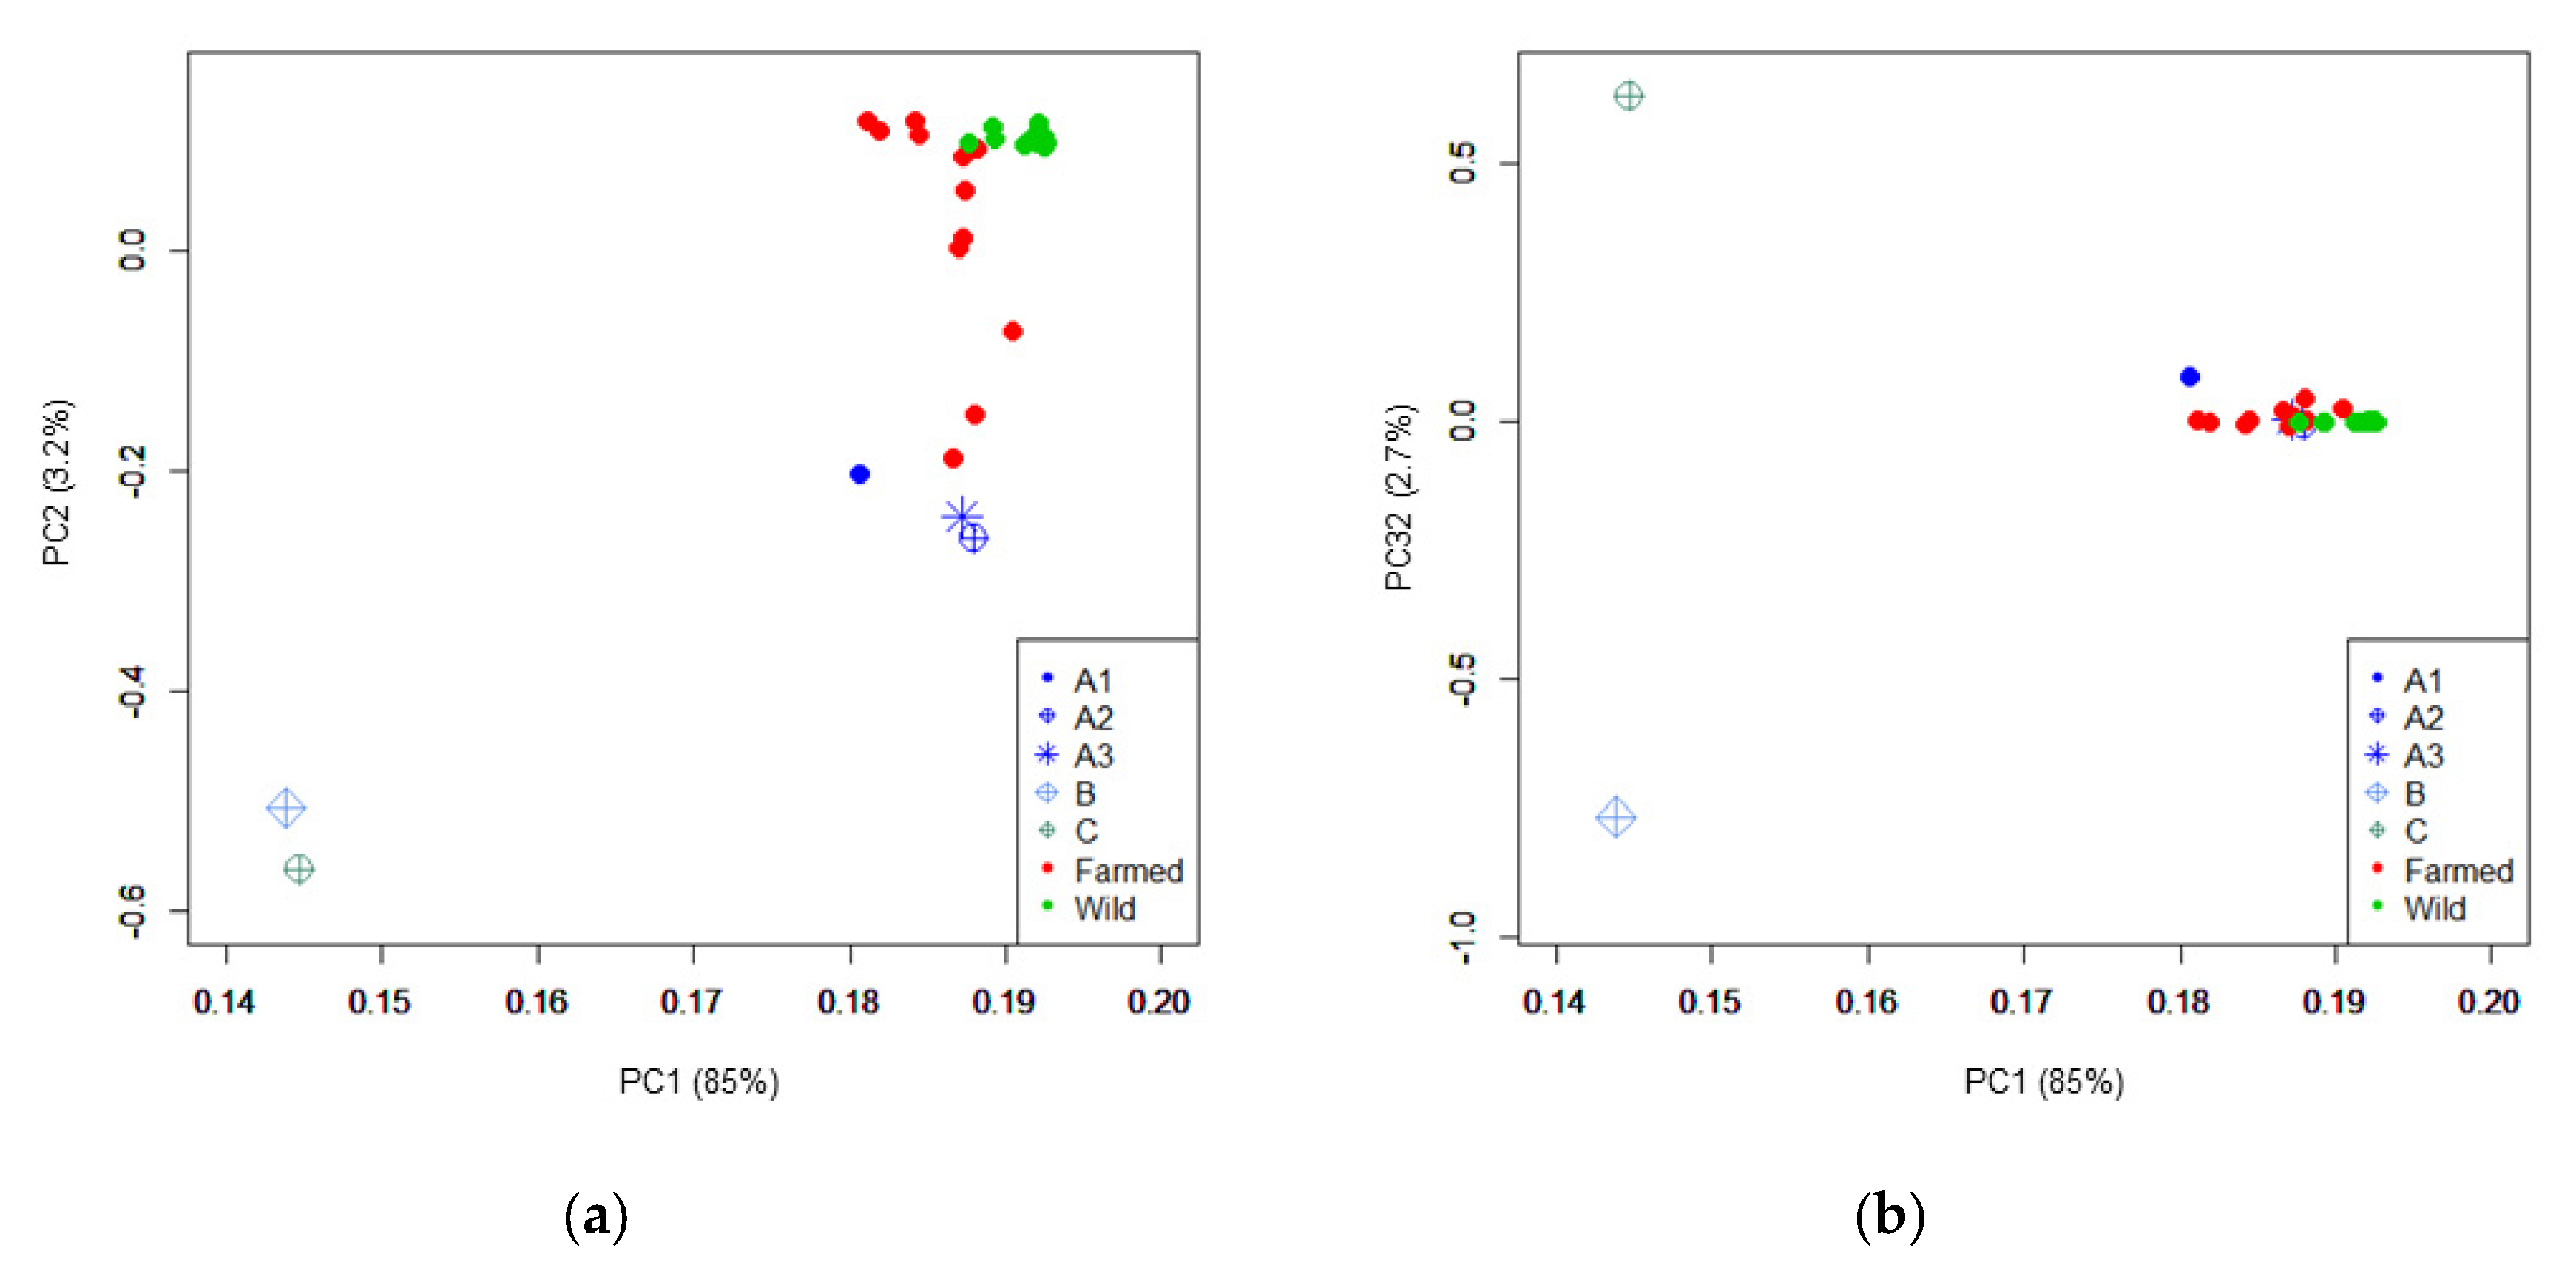
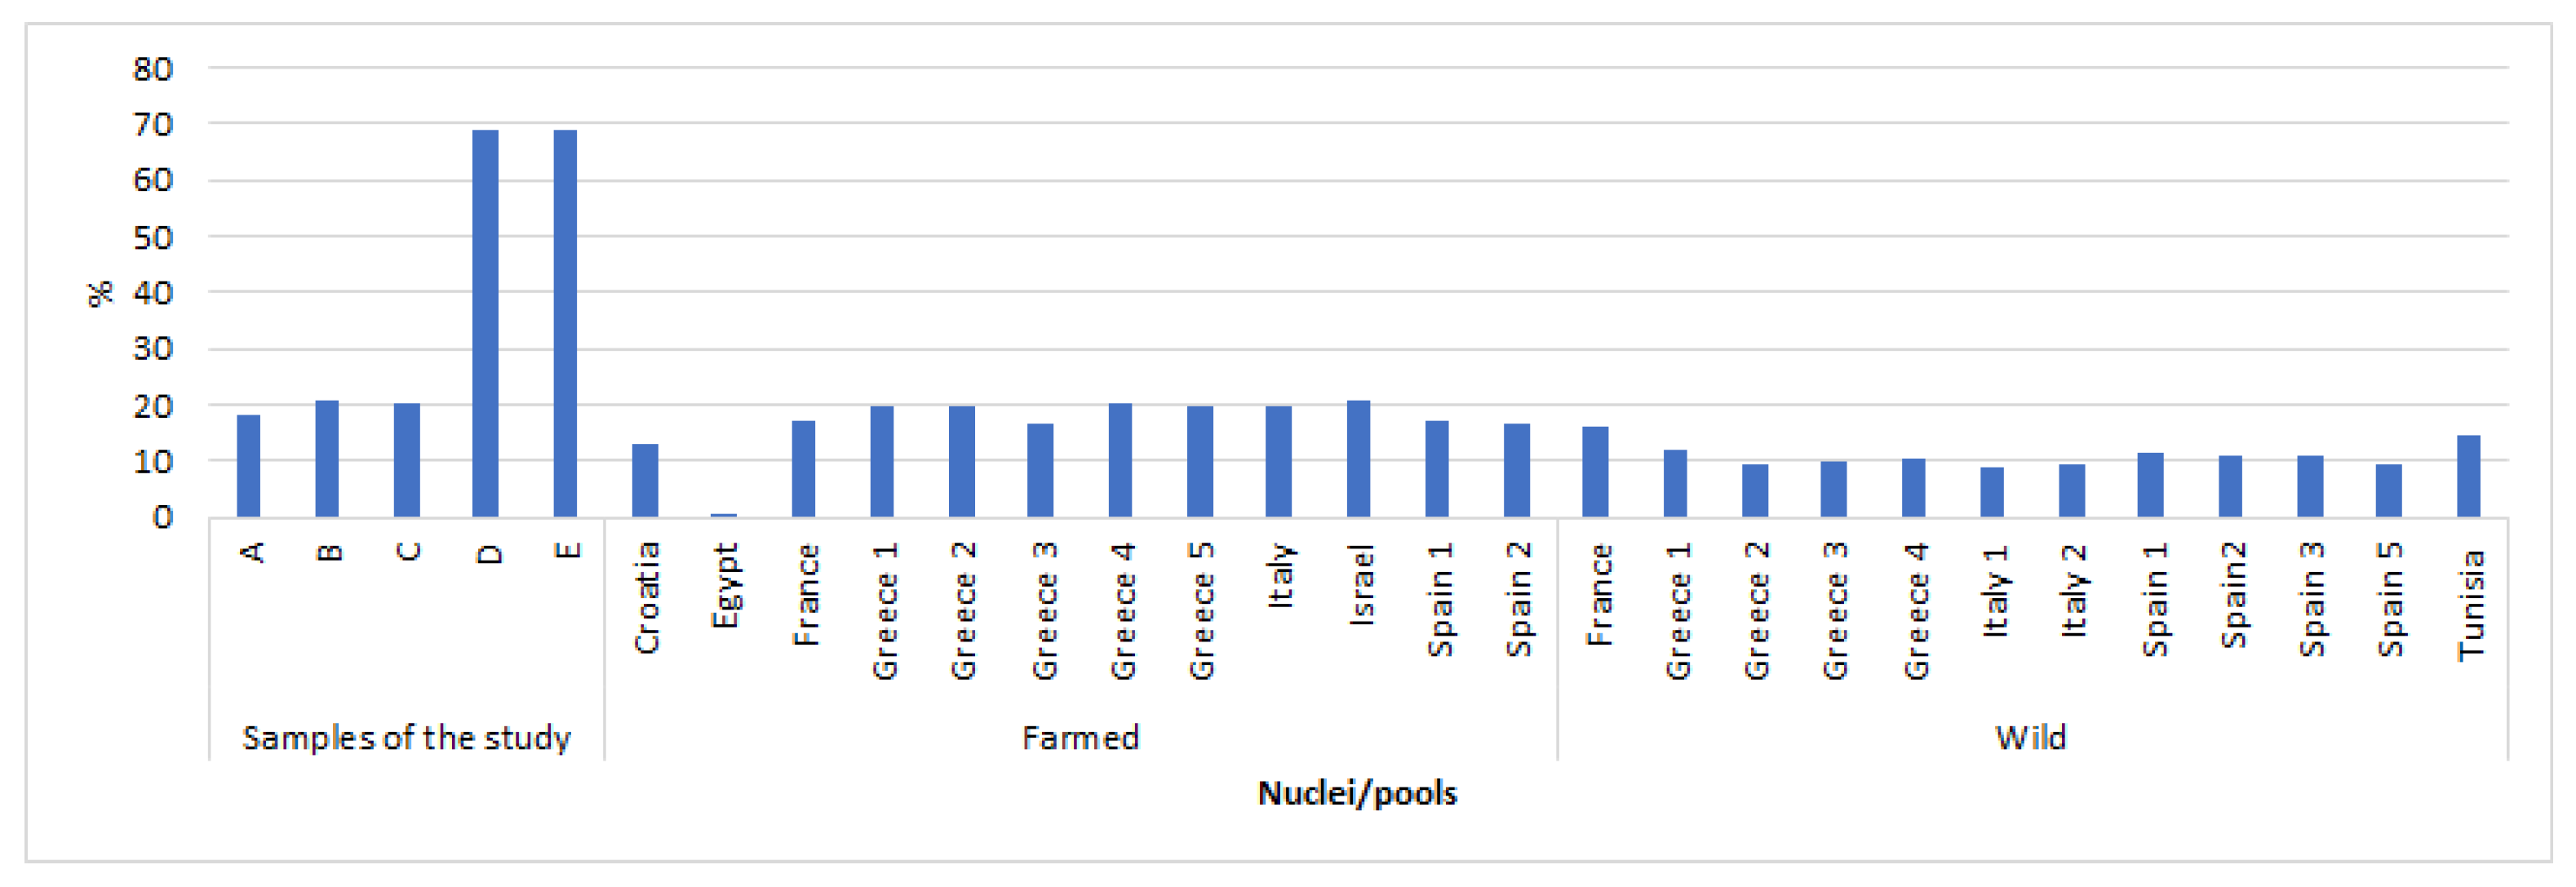
3.1. Population Genomic Parameters of Different Gilthead Seabream Stocks

The alignment of the sequencing data obtained from the five sequenced Italian farmed stocks to the S. aurata reference genome produced an average depth of coverage of 60× ± 1.73×. Detailed information on the sequencing depth of all DNA pools, including those retrieved from Peñaloza et al. 2021 [7], is reported in Table 1 and Table S1. The variant calling generated a total of 11,431,945 SNPs that were used to compute the PCA plots, shown in Figure 1. A close proximity between wild and farmed stocks was observed in agreement with what was reported by Peñaloza et al. 2021 [7]. This is probably due to the fact that breeding programs in this species involve periodic restocking or that, in most of the farmed populations, genetic programs are not yet well established. In Figure 1, the three DNA pools (A1, A2, and A3), derived from offspring of the A broodstock nucleus, are all close to the farmed DNA pools, whereas DNA pools B and C were distant from the rest of the pools and from each other. This distance is visible when considering both Component (C) 1 vs. C2 (Figure 1a) and C1 vs. C3 (Figure 1b).
This picture is confirmed by the consideration of the global FST values. As expected due to their common origin from the same nucleus, the three pairwise comparisons between DNA pools A1, A2, and A3 showed low FST values (<0.053). Also, they showed a low FST value when compared with farmed and wild populations retrieved from a previous study (Table 2). This is confirmed also considering all the wild and farmed pools separately (Table S2). The latter populations were in turn quite close to each other (FST = 0.010) suggesting that all these populations were not very differentiated from wild stocks. It is also worth mentioning that we analysed publicly available datasets by averaging information within two groups (farmed and wild) to reduce the genetic differentiation between the datasets. However, the closeness between nucleus A and these wild-related stocks may indicate that nucleus A experienced recent genetic introgression from wild populations or that neither selection pressure nor genetic drift drove substantial genetic differentiation from the original stocks. Nucleus A was quite different from both nuclei B and C. These two were also quite different from the other farmed and wild populations that we included in our study (Table 2 and Table S2). Nucleus B was also very distant from nucleus C (FST = 0.405) suggesting very divergent selection trajectories and/or different origins.
These differences can also be seen when investigating the percentage of fixed alleles within each group (Figure 2). DNA pools A1, A2, and A3 had a similar percentage that ranged from 19 to 26%, in line with wild and farmed pools. The DNA pools with the highest percentage of monomorphic alleles were DNA pools B and C, both with 69% and an overlapping of SNPs of 68%, which confirms the genetic diversity of these pools underlined by the PCA analysis. The low genetic diversity observed in these nuclei may indicate a higher level of inbreeding than in nucleus A [36].
The control of inbreeding rate is very important when a selection program is implemented since inbreeding depression might negatively counterbalance any genetic progress. Estimates of inbreeding depression in fish have consistently shown that consanguineous progeny presents lower viability, less growth, lower reproductive performance, and less resistance to infections [37,38,39,40]. Since seabream is a species with high fecundity, nongenetic maternal effects and high mortality at early life stages can rapidly induce a loss of genetic variability if inbreeding is poorly considered in mating schemes [41].
Considering the common origin of the three DNA pools derived from nucleus A, in the subsequent genome-wide comparison analyses we combined these three subpopulations into one.

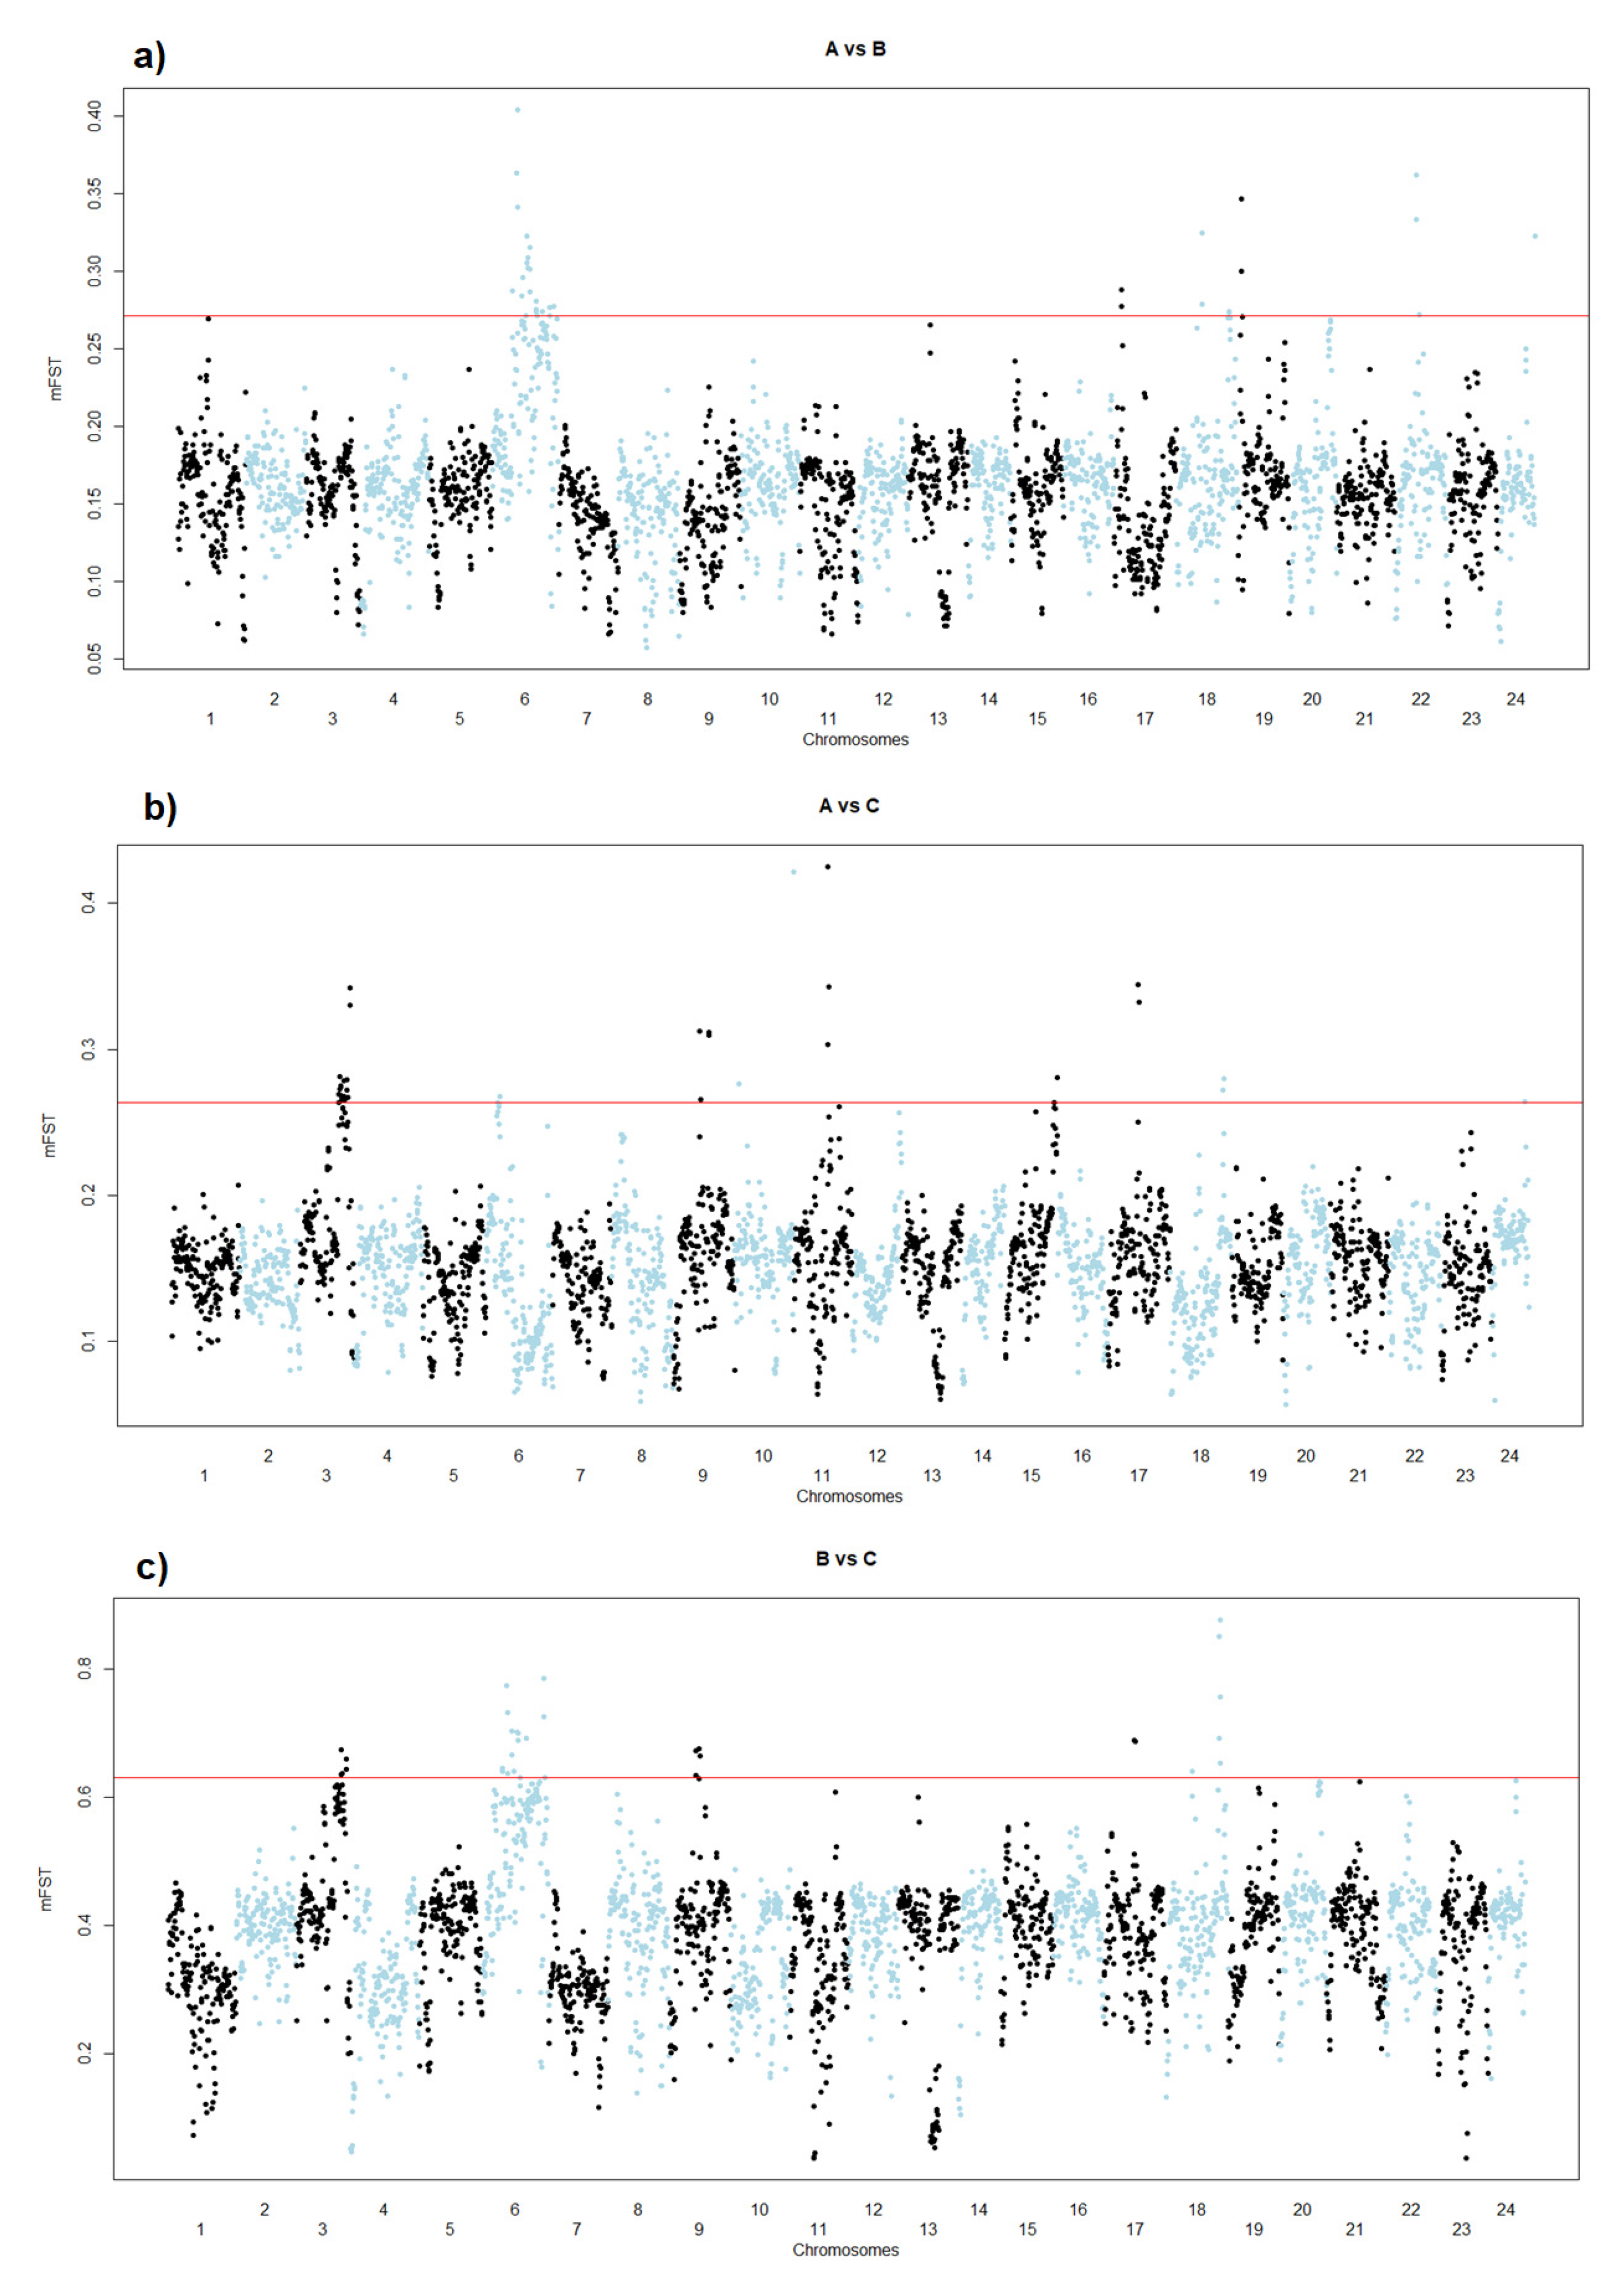
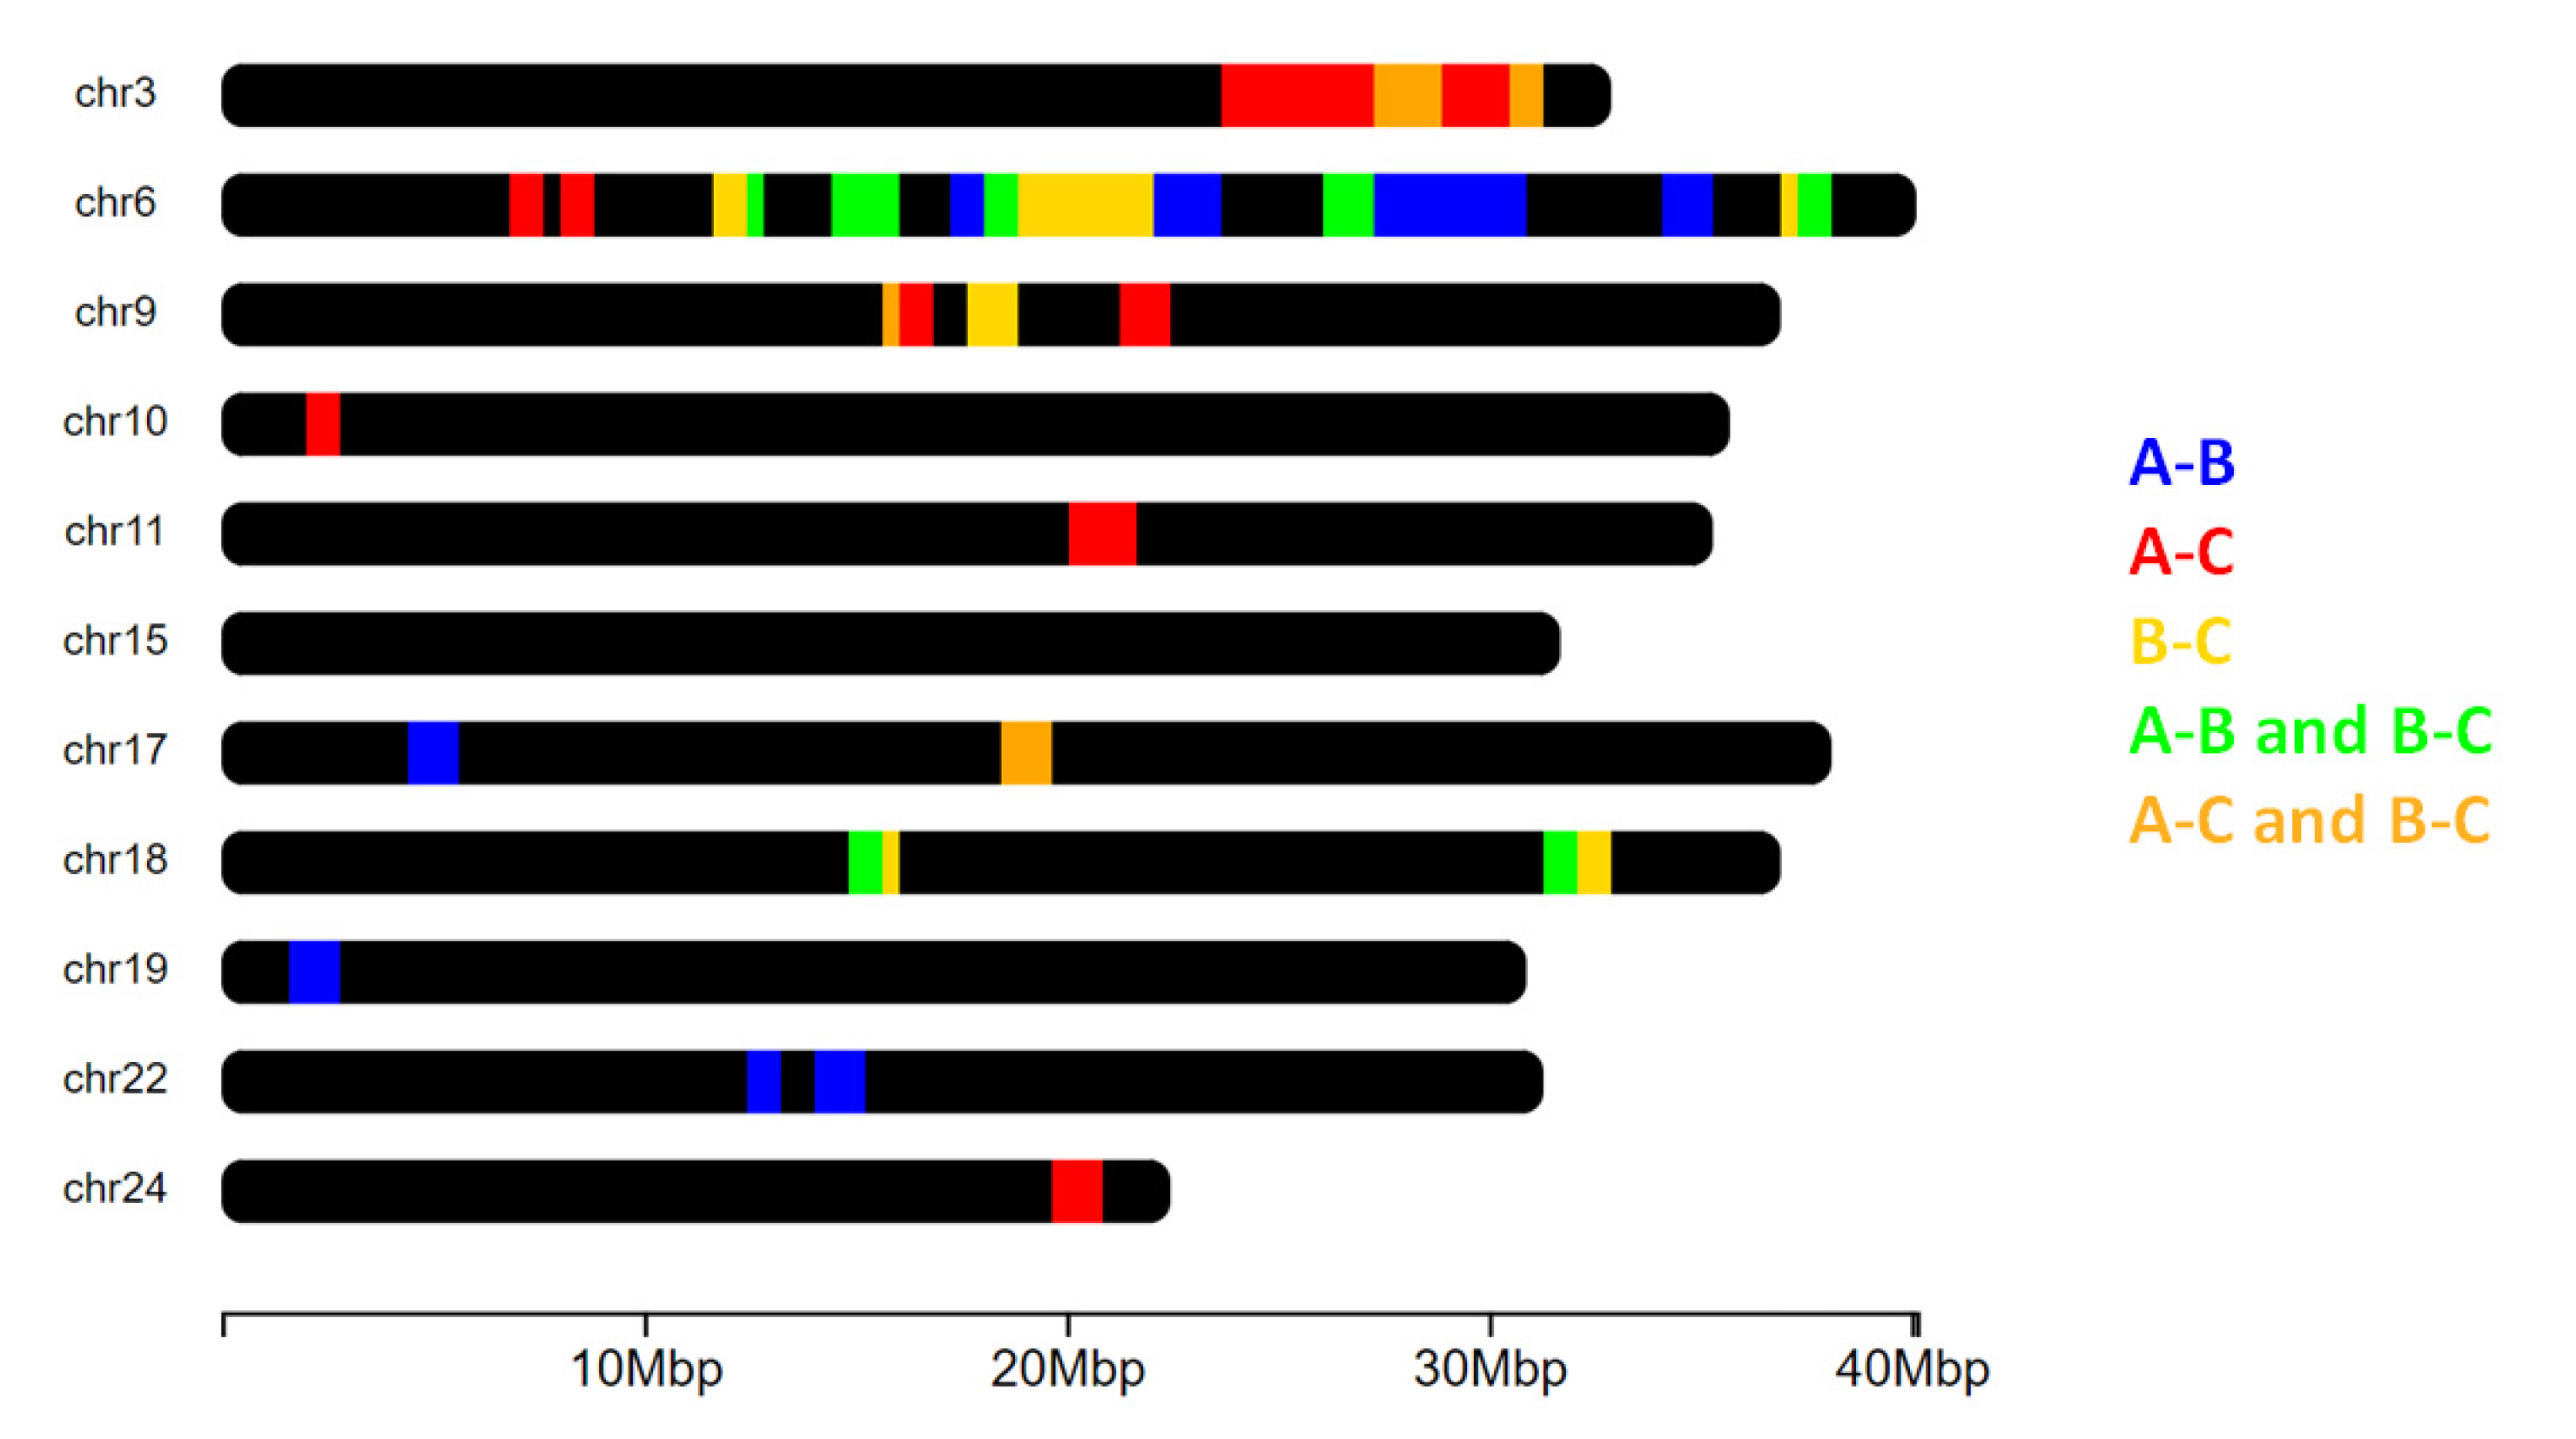
3.2. Genome-Wide Window-Based FST Analyses

The results of the pairwise window-based FST analyses between nuclei A, B, and C are graphically represented in the Manhattan plots of Figure 3 and are summarised in Figure 4. Tables S3–S5 reported all details of these comparisons with precise coordinates of the genomic regions that trespassed the defined thresholds and the genes included in those regions. From the comparison between nuclei A and B, a total of 14 genomic regions emerged. These outlier regions were located on six different chromosomes (6, 17, 18, 19, 22, and 24; Figure 3a and Table S3). The major differences between nuclei A and C (Figure 3b and Table S4) were detected in 11 regions located on 8 different chromosomes (3, 6, 9, 10, 11, 15, 17, 18, and 24) with the largest region spanning about 7.25 Mb of chromosome 3 (positions 23.75–31.0 Mb). The most relevant differences between nuclei B and C (Figure 3c and Table S5) were detected in 13 regions positioned on chromosomes 3, 6, 9, 17, and 18 with the largest region encompassing about 4.25 Mb on chromosome 6 (positions 17.75–22.00).
Considering the different pairwise comparisons, some partially overlapping regions were observed (Figure 3 and Figure 4): some were detected on chromosomes 3, 9, 17, and 18 for the comparisons between nuclei A and C and between nuclei B and C (Figure 4). Overlapping regions in the pairwise analyses, derived from nuclei A and B and between nuclei B and C, emerged on chromosomes 6, 17, and 18. Chromosome 6 contained a high number of signatures of selection derived from the pairwise comparisons A vs. B and B vs. C.
Some of the regions in the block 12–38 Mb of chromosome 6 were detected when comparing nuclei A and B and when comparing nuclei B and C, but they did not emerge when comparing nuclei A and C. These regions detected on chromosome 6 partially overlapped or were adjacent to regions that have been proposed as candidates for the lack of pigmentation defect in gilthead seabream [13]. This agrees with the fact that some of the fry that constituted nucleus A were depigmented or were carriers of the genetic defect causing depigmentation. Even if this phenotypic state of fry that composed nuclei B and C is unknown, from the present analyses we may postulate that nucleus C may have a higher genetic similarity with nucleus A in relation to the “depigmentation-carrier” and that nucleus B is the population that may have the lower proportion of this genetic defect.

3.3. Functional Annotation of Outliers FST Window Regions

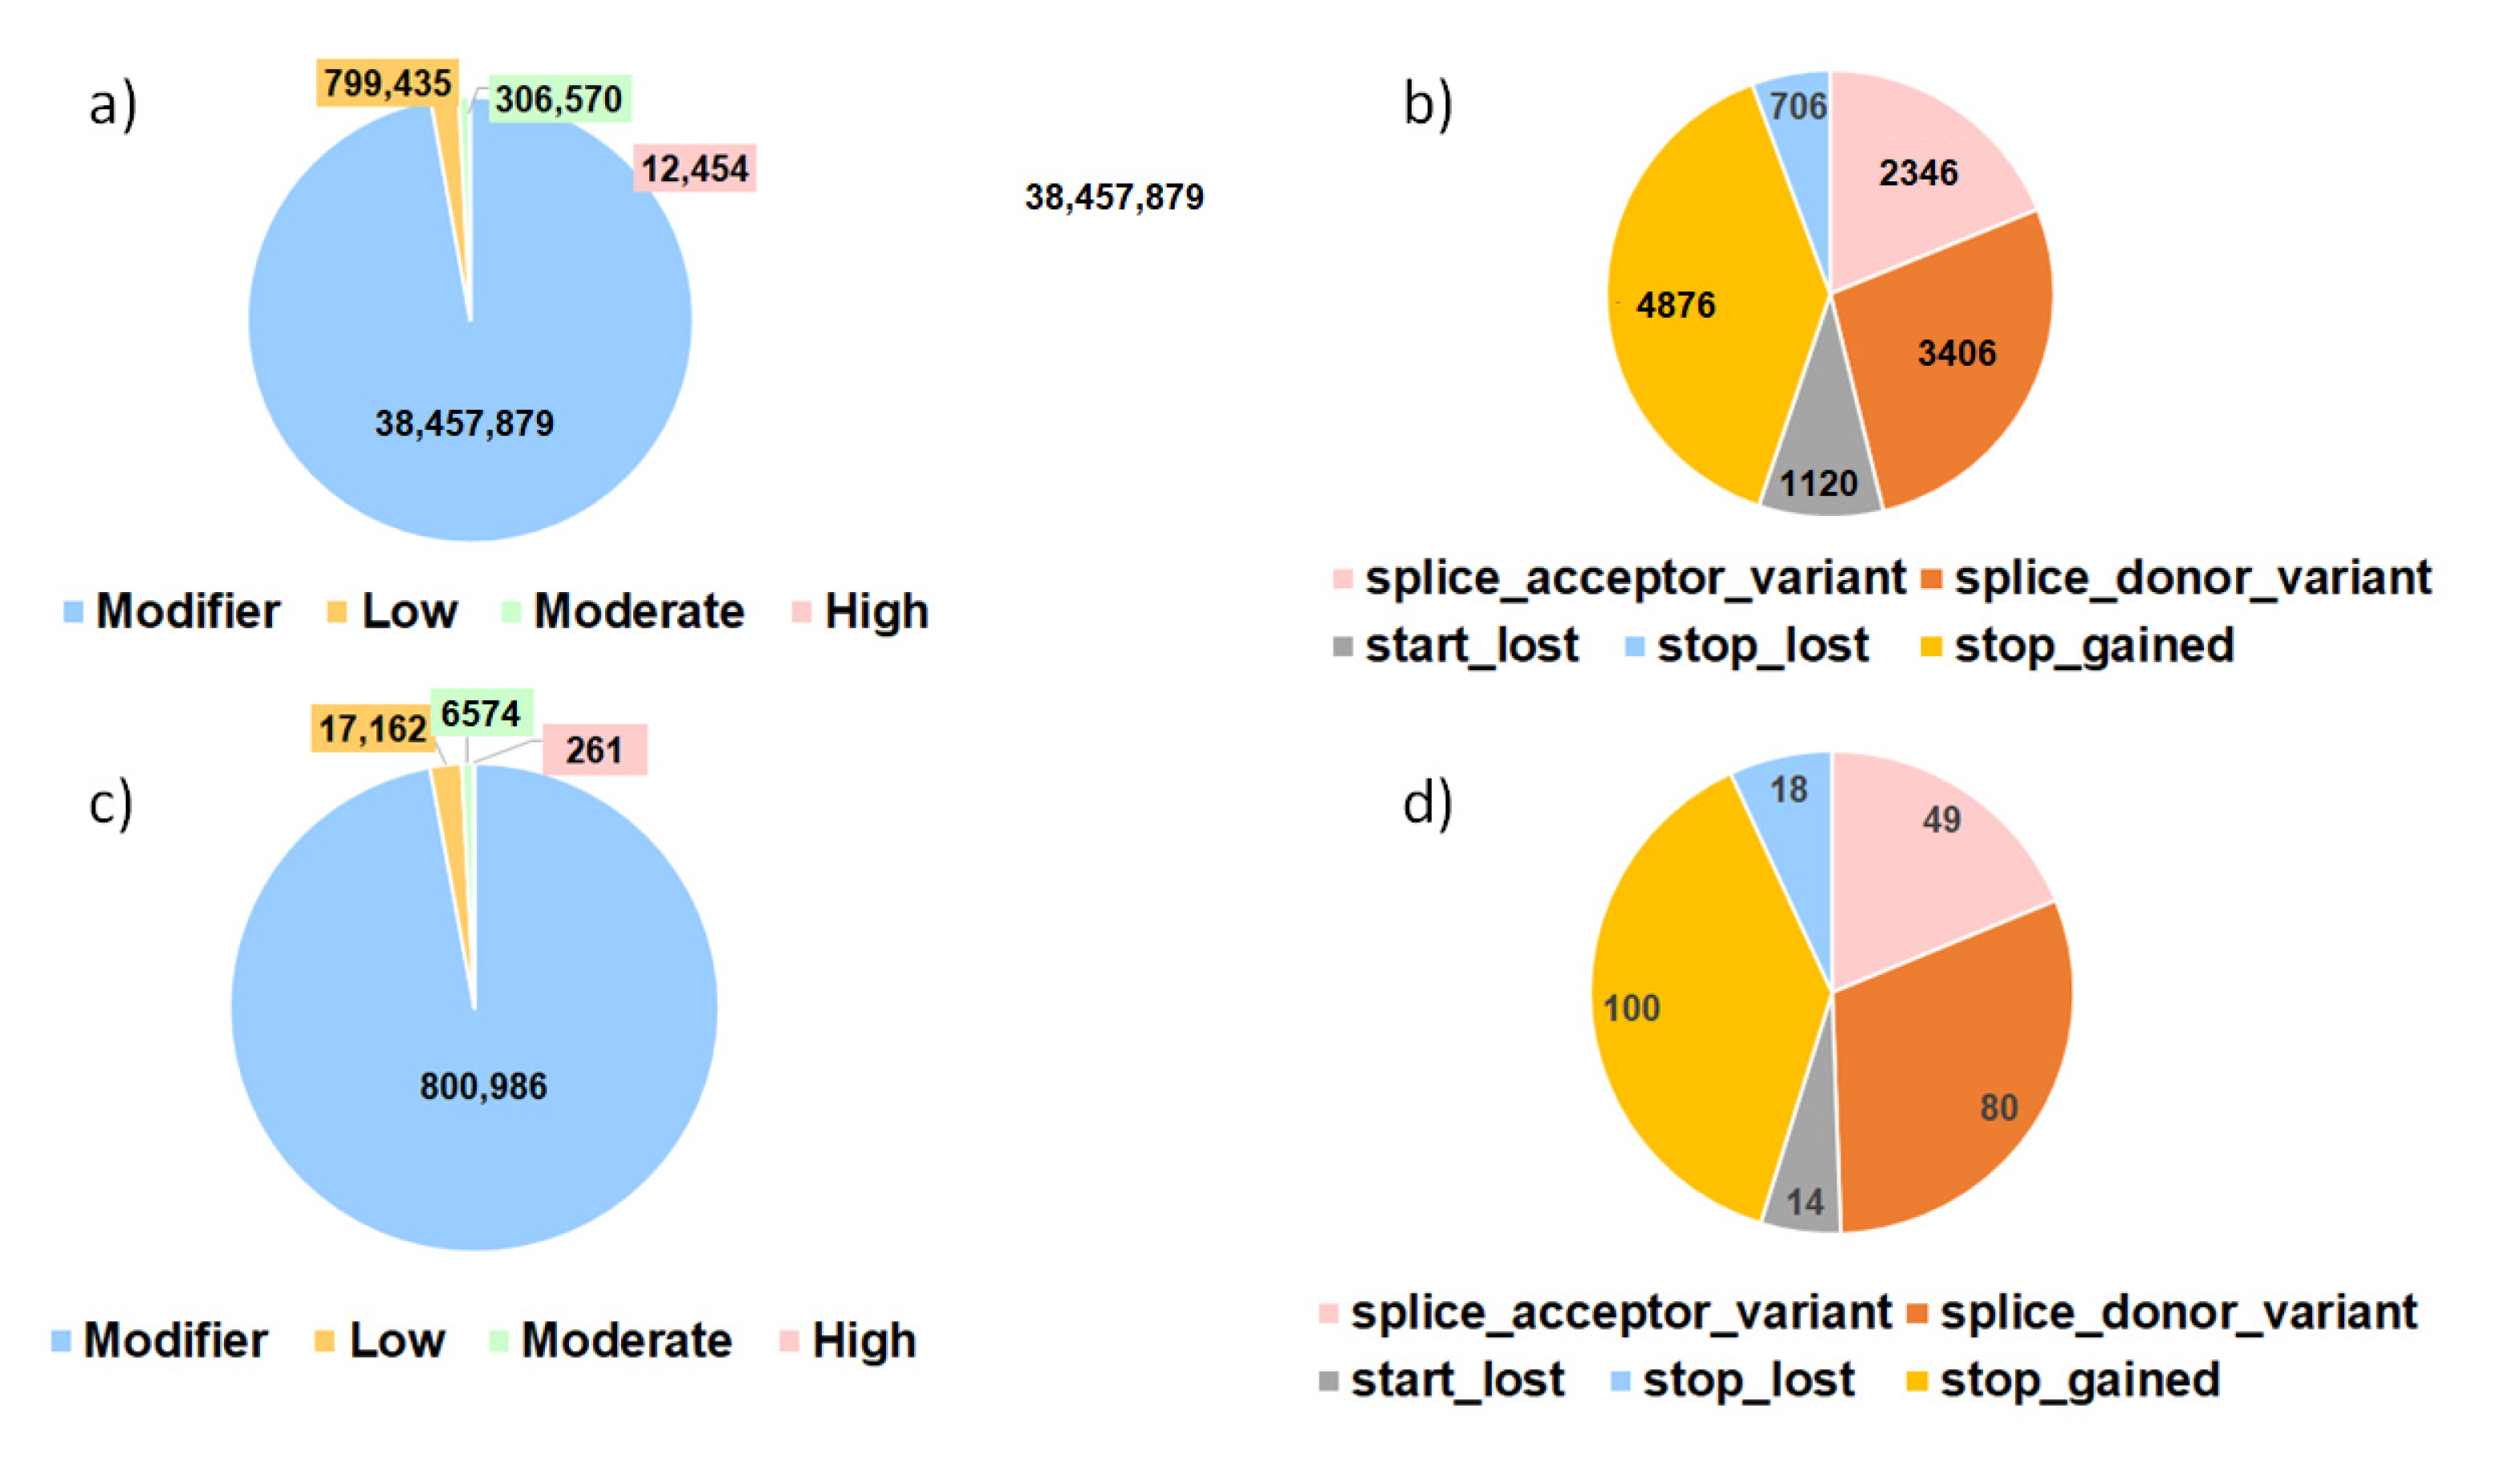
3.3.1. Impacts of SNPs

Variant effect analysis performed on the whole dataset is shown in Figure 5a,b. A total of 39,576,338 different effects have been detected: due to alternative splicing and gene overlapping along the genome, the same SNP location can have multiple predicted effects. The majority of the effects (97.17%) have been predicted as modifiers that might have no or very low impact. Other SNPs have been classified to have low impact (2.02%), moderate impact (0.77%), and high impact (0.07%) (Figure 5a). Among the 12,454 variations with high impact, most of them were catalogued as stop gained and stop lost and then splice variants (Figure 5b). In the regions with high FST values, this proportion is unchanged, both considering the overall number (Figure 5c) and the distribution of the 261 SNPs with high impact (Figure 5d).
These variations with high impact were in 129 genes (Table S6). A few of the genes included in the high-impact FST list had been previously linked with growth-related traits in other fish species. For example, fibronectin type III domain containing 5b (FNDC5B), which encodes for a subunit of the irisin protein, is known to regulate food intake, energy homeostasis, and glucose metabolism in teleosts [42,43]. This gene has been reported in QTL linked to head and body size in bighead carp Hypophthalmichthys nobilis [44,45]. Another gene related with head size in the same species is the solute carrier family 30 member 9 (SLC30A9) gene. Its encoded protein is involved in cellular zinc ion homeostasis and zinc ion transport. This gene has been proposed as a candidate for head length [45]. Another gene included in one of these regions was family with sequence similarity 135 member B (FAM135B), which encodes for a factor that promotes the secretion of the granulin growth factor, which has high expression in epithelial, immune, chondrocytes, and neuronal cells [46]. This gene has been reported to affect growth-related traits in livestock species [47] and in Chinese longsnout catfish [48]. In this catfish species, this gene has been suggested as a candidate for caudal peduncle depth, which is one of the parameters used to estimate fish growth [48].

3.3.2. Overrepresentation of Biological Processes

The over-representation analyses revealed the enrichment of 27 GO terms in the regions that emerged in the comparison between nuclei A and B, 4 GO terms in the comparison between nuclei A and C, and 22 GO terms in the comparison between nuclei B and C. After filtering redundant GO terms, these numbers were reduced to a total of 24 GO terms in the contrast between nuclei A and B and 13 in the comparison between nuclei B and C (no redundant GO terms were detected in the analysis between nuclei A and C). All non-redundant GO terms are reported in Table S7. While comparisons of nucleus A vs. B and A vs. C detected GO terms mainly related to metabolism, comparison between nuclei B and C was enriched in GO terms related to morphogenesis and development. Even if the actual size of the fry that contributed to the different DNA pools is not known with precision and we do not have any phenotypic information available on the fish, this result may suggest that nuclei B and C are different in terms of growth potential. This may be of relevance as size in aquaculture can affect several steps of the selection, e.g., size “discard” at different developmental stages, and can also affect the final value of a single fish at market level.
Some of the genes containing high-impact variations were part of one or more GO terms derived from the previous enrichment analyses. For the genes detected in the comparison between nuclei A and B, it is worth mentioning the disintegrin and metalloprotease with thrombospondin type-1 motif member 9 (ADAMTS9). This gene encodes for a cell-autonomous antiangiogenic metalloprotease that is involved in ovarian development [49]. In the enrichment analyses, this gene is included in several GO terms that are linked with metabolic processes and organ development. A multi-trait genome-wide association study in Nile tilapia associated variations in proximity to this gene with fillet trait [50]. Interleukin 1 receptor accessory protein-like 2 (IL1RAPL2), included in a genomic region that emerged in the comparison between nuclei A and B and present in the enriched gene list for cellular process (GO: 0009987), was suggested to be involved in the main QTL explaining 0.8% of variation for the acute hypoxia tolerance in a rainbow trout population [51]. The solute carrier family 4 member 8 (SLC4A8), having a large impact variation in the comparison between nuclei A and B, encodes for an electroneutral Na+-driven Cl/HCO3 exchanger whose expression in the gills seems to be reduced in salt water, as shown in Spotted seabass [52].
A region that emerged in the comparison between nuclei B and C contains variations with predicted high impact in the dual serine/threonine and tyrosine protein kinase (DSTYK) gene. This gene is a regulator of cell death, is expressed in multiple tissues, and was included in the GO terms linked with developmental processes. In zebrafish, a mutation on the dstyk gene is linked with spinal deformity [53].
One of the genes reported to have variations with high impact, present in one or more GO terms and shared in two comparisons (A vs. B and B vs. C), is the mediator of RNA polymerase II transcription subunit 12 homolog (MED12). This gene is involved in developmental processes and is part of the enriched GO terms linked to development and morphogenesis for the B vs. C comparison, for example, animal organ development (GO:0048513) and skeletal system morphogenesis (GO:0048705). It has also been proposed as a candidate gene explaining a QTL for body weight gain in rainbow trout [54].

4. Conclusions

FST analyses underlined major genomic differences among the investigated gilthead seabream broodstock nuclei. Some of these differences highlighted genomic regions that contain genes involved in general metabolism and development; genes that have been detected in QTL for growth, size, and skeletal deformity; and adaptation to variation of oxygen level in other teleosts. The genomic diversity that was evidenced might be the results of the genetic histories of these nuclei, including the combined effect of directional selection, genetic drift, and bottleneck, that they might have experienced. Our results pointed out the need to control the genetic effects of breeding programmes in this species to avoid the negative effects of the reduction of genetic variability within the population with a consequent increase in the inbreeding level that, in turn, could lead to an increased frequency of deleterious alleles. Whole genome sequencing analyses might provide genomic pictures of breeding stocks that are useful to better design breeding strategies based on a whole genome-based information on the levels of within nucleus genetic variability and across nuclei genetic diversity so to enhance the production efficiency of the hatcheries.

Supplementary Materials

The following supporting information can be downloaded at: https://www.mdpi.com/article/10.3390/genes14040839/s1. Table S1: Populations retrieved from Peñaloza et al. 2021 [7] included in this study, overall number of high-quality reads utilized for the alignment and depth of sequencing considering the alignment to the gilthead seabream reference genome. Table S2: Global FST of the five pools under investigation against the single pools that composed the wild and farmed pools. Table S3: FST regions of high divergence in the comparison between nuclei A and B. Reported data includes: chromosome, beginning of the region (start), end of the region (end), size of the region (size) and genes contained in the regions (genes). Table S4: FST regions of high divergence in the comparison between nuclei A and C. Reported data includes: chromosome, beginning of the region (start), end of the region (end), size of the region (size) and genes contained in the regions (genes). Table S5: FST regions of high divergence in the comparison between nuclei B and C. Reported data includes: chromosome, begin of the region (start), end of the region (end), size of the region (size) and genes contained in the regions (genes). Table S6: Variant effect predictor of high impact variation in the FST regions. Table S7: Non-redundant Gene Ontology (GO) Term list for the different comparisons, including GO term code, GO term biological process name, fold enrichment, false discovery rate (FDR) value and genes included in the enrichment.

Author Contributions

Conceptualization, F.B., F.C., L.B, M.F.R. and L.F.; Data curation, F.B. and A.R.; Funding acquisition, M.F.R. and L.F.; Methodology, F.B. and A.R.; Resources, F.C. and M.C. Visualization, F.B.; Writing—original draft, F.B. and L.F.; Writing—review & editing, A.R., F.C., L.B., S.B., G.S., M.C. and M.F.R. All authors have read and agreed to the published version of the manuscript.

Funding

This research was supported by the Ensminger Fund, State of Iowa Funds and by University of Bologna RFO Funds.

Institutional Review Board Statement

The samples that we have used in our paper derived from a commercial hatchery (Panittica Italia) and were part of their routine procedure. Therefore, no animal was used for the sole goal of our project, we simply used what they would have sampled in any case. For this, our university (University of Bologna) does not require authorization.

Informed Consent Statement

Not applicable.

Data Availability Statement

Data are available in the following project number ENA: PRJEB33627.

Acknowledgments

We thank Novogene for technical support.

Conflicts of Interest

The authors declare no conflict of interest.

References

  1. EUROSTAT. Production from Aquaculture Excluding Hatcheries and Nurseries (fish_AQ2A Datasheet). 2020. Available online: https://ec.europa.eu/eurostat/databrowser/view/FISH_AQ2A__custom_4842525/default/table?lang=en (accessed on 5 February 2023).
  2. Manchado, M.; Planas, J.V.; Cousin, X.; Rebordinos, L.; Claros, M.G. Surrent status in other finfish species: Description of current genomic resources for the Gilthead seabream (Sparus aurata) and soles (Solea senegalensis and Solea solea). In Genomics in Aquaculture; Academic Press: Cambridge, MA, USA, 2016; pp. 195–221. [Google Scholar]
  3. Moretti, A.; Fernandez-Criado, M.P.; Cittolin, G. Ruggero Guidastri Manual on Hatchery Production of Seabass and Gilthead Seabream; Food & Agriculture Organization: Quebec City, QC, Canada, 1999; Volume 1. [Google Scholar]
  4. Ferosekhan, S.; Turkmen, S.; Pérez-García, C.; Xu, H.; Gómez, A.; Shamna, N.; Afonso, J.M.; Rosenlund, G.; Fontanillas, R.; Gracia, A.; et al. Influence of genetic selection for growth and broodstock diet N-3 LC-PUFA levels on reproductive performance of Gilthead seabream, Sparus aurata. Animals 2021, 11, 519. [Google Scholar] [CrossRef] [PubMed]
  5. Boudry, P.; Allal, F.; Aslam, M.L.; Bargelloni, L.; Bean, T.P.; Brard-Fudulea, S.; Brieuc, M.S.O.; Calboli, F.C.F.; Gilbey, J.; Haffray, P.; et al. Current status and potential of genomic selection to improve selective breeding in the main aquaculture species of international council for the exploration of the sea (ICES) member countries. Aquac. Rep. 2021, 20, 100700. [Google Scholar] [CrossRef]
  6. Pauletto, M.; Manousaki, T.; Ferraresso, S.; Babbucci, M.; Tsakogiannis, A.; Louro, B.; Vitulo, N.; Quoc, V.H.; Carraro, R.; Bertotto, D.; et al. Genomic analysis of sparus aurata reveals the evolutionary dynamics of sex-biased genes in a sequential hermaphrodite fish. Commun. Biol. 2018, 1, 119. [Google Scholar] [CrossRef] [PubMed]
  7. Peñaloza, C.; Manousaki, T.; Franch, R.; Tsakogiannis, A.; Sonesson, A.K.; Aslam, M.L.; Allal, F.; Bargelloni, L.; Houston, R.D.; Tsigenopoulos, C.S. Development and testing of a combined species snp array for the european seabass (Dicentrarchus labrax) and Gilthead seabream (Sparus aurata). Genomics 2021, 113, 2096–2107. [Google Scholar] [CrossRef]
  8. Besson, M.; Rombout, N.; Salou, G.; Vergnet, A.; Cariou, S.; Bruant, J.S.; Izquierdo, M.; Bestin, A.; Clota, F.; Haffray, P.; et al. Potential for genomic selection on feed efficiency in Gilthead sea bream (Sparus aurata), based on individual feed conversion ratio, carcass and lipid traits. Aquac. Rep. 2022, 24, 101132. [Google Scholar] [CrossRef]
  9. Palaiokostas, C.; Ferraresso, S.; Franch, R.; Houston, R.D.; Bargelloni, L. Genomic prediction of resistance to pasteurellosis in Gilthead sea bream (Sparus aurata) using 2B-RAD sequencing. G3 Genes Genomes Genet. 2016, 6, 3693–3700. [Google Scholar] [CrossRef] [Green Version]
  10. Aslam, M.L.; Carraro, R.; Bestin, A.; Cariou, S.; Sonesson, A.K.; Bruant, J.S.; Haffray, P.; Bargelloni, L.; Meuwissen, T.H.E. Genetics of resistance to photobacteriosis in Gilthead sea bream (Sparus aurata) using 2b-RAD sequencing. BMC Genet. 2018, 19, 43. [Google Scholar] [CrossRef] [PubMed] [Green Version]
  11. Griot, R.; Allal, F.; Phocas, F.; Brard-Fudulea, S.; Morvezen, R.; Haffray, P.; François, Y.; Morin, T.; Bestin, A.; Bruant, J.S.; et al. Optimization of genomic selection to improve disease resistance in two marine fishes, the european Sea bass (Dicentrarchus labrax) and the Gilthead sea bream (Sparus aurata). Front. Genet. 2021, 12, 754416. [Google Scholar] [CrossRef]
  12. Bertolini, F.; Ribani, A.; Capoccioni, F.; Buttazzoni, L.; Utzeri, V.J.; Bovo, S.; Schiavo, G.; Caggiano, M.; Rothschild, M.F.; Fontanesi, L. A Comparative Whole Genome Sequencing analysis identified a candidate locus for lack of operculum in cultivated Gilthead seabream (Sparus aurata). Anim. Genet. 2021, 52, 365–370. [Google Scholar] [CrossRef]
  13. Bertolini, F.; Ribani, A.; Capoccioni, F.; Buttazzoni, L.; Utzeri, V.J.; Bovo, S.; Schiavo, G.; Caggiano, M.; Fontanesi, L.; Rothschild, M.F. Identification of a major locus determining a pigmentation defect in cultivated Gilthead seabream (Sparus aurata). Anim. Genet. 2020, 51, 319–323. [Google Scholar] [CrossRef]
  14. López, M.E.; Neira, R.; Yáñez, J.M. Applications in the search for genomic selection signatures in fish. Front. Genet. 2014, 5, 458. [Google Scholar] [CrossRef] [PubMed] [Green Version]
  15. Bertolini, F.; Geraci, C.; Schiavo, G.; Sardina, M.T.; Chiofalo, V.; Fontanesi, L. Whole Genome Semiconductor Based Sequencing of farmed european Sea bass (Dicentrarchus labrax) mediterranean genetic stocks using a dna pooling approach. Mar. Genom. 2016, 28, 63–70. [Google Scholar] [CrossRef] [PubMed] [Green Version]
  16. Martinez, V.; Dettleff, P.; Lopez, P.; Fernandez, G.; Jedlicki, A.; Yañez, J.M.; Davidson, W.S. Assessing footprints of selection in commercial atlantic salmon populations using microsatellite data. Anim. Genet. 2013, 44, 223–226. [Google Scholar] [CrossRef] [PubMed]
  17. de Innocentiis, S.; Lesti, A.; Livi, S.; Rossi, A.R.; Crosetti, D.; Sola, L. Microsatellite markers reveal population structure in Gilthead sea bream Sparus aurata from the atlantic ocean and mediterranean sea. Fish. Sci. 2004, 70, 852–859. [Google Scholar] [CrossRef]
  18. Loukovitis, D.; Sarropoulou, E.; Vogiatzi, E.; Tsigenopoulos, C.S.; Kotoulas, G.; Magoulas, A.; Chatziplis, D. Genetic variation in farmed populations of the Gilthead sea bream Sparus aurata in Greece using microsatellite DNA markers. Aquac. Res. 2012, 43, 239–246. [Google Scholar] [CrossRef]
  19. Coscia, I.; Vogiatzi, E.; Kotoulas, G.; Tsigenopoulos, C.S.; Mariani, S. Exploring neutral and adaptive processes in expanding populations of Gilthead sea bream, Sparus aurata, in the north-east atlantic. Heredity 2012, 108, 537–546. [Google Scholar] [CrossRef] [PubMed] [Green Version]
  20. Maroso, F.; Gkagkavouzis, K.; de Innocentiis, S.; Hillen, J.; do Prado, F.; Karaiskou, N.; Taggart, J.B.; Carr, A.; Nielsen, E.; Triantafyllidis, A.; et al. Genome-Wide analysis clarifies the population genetic structure of wild Gilthead sea bream (Sparus aurata). PLoS ONE 2021, 16, e0236230. [Google Scholar] [CrossRef]
  21. Segvic-Bubic, T.; Lepen, I.; Trumbic, Z.; Ljubkovic, J.; Sutlovic, D.; Matic-Skoko, S.; Grubisic, L.; Glamuzina, B.; Mladineo, I. Population genetic structure of reared and wild Gilthead sea bream (Sparus aurata) in the adriatic sea inferred with microsatellite loci. Aquaculture 2011, 318, 309–315. [Google Scholar] [CrossRef]
  22. Franchini, P.; Sola, L.; Crosetti, D.; Milana, V.; Rossi, A.R. Low Levels of population genetic structure in the Gilthead sea bream, sparus aurata, along the coast of Italy. ICES J. Mar. Sci. 2012, 69, 41–50. [Google Scholar] [CrossRef] [Green Version]
  23. Žužul, I.; Šegvić-Bubić, T.; Talijančić, I.; Džoić, T.; Lepen Pleić, I.; Beg Paklar, G.; Ivatek-Šahdan, S.; Katavić, I.; Grubišić, L. Spatial connectivity pattern of expanding Gilthead seabream populations and its interactions with aquaculture sites: A combined population genetic and physical modelling approach. Sci. Rep. 2019, 9, 1–14. [Google Scholar] [CrossRef] [Green Version]
  24. Guinand, B.; Chauvel, C.; Lechene, M.; Tournois, J.; Tsigenopoulos, C.S.; Darnaude, A.M.; McKenzie, D.J.; Gagnaire, P.A. Candidate gene variation in Gilthead sea bream reveals complex spatiotemporal selection patterns between marine and lagoon habitats. Mar. Ecol. Prog. Ser. 2016, 558, 115–127. [Google Scholar] [CrossRef] [Green Version]
  25. Gkagkavouzis, K.; Papakostas, S.; Maroso, F.; Karaiskou, N.; Carr, A.; Nielsen, E.E.; Bargelloni, L.; Triantafyllidis, A. Investigating genetic diversity and genomic signatures of hatchery-induced evolution in Gilthead seabream (Sparus aurata) populations. Diversity 2021, 13, 563. [Google Scholar] [CrossRef]
  26. Schlötterer, C.; Tobler, R.; Kofler, R.; Nolte, V. Sequencing pools of individuals-mining genome-wide polymorphism data without big funding. Nat. Rev. Genet. 2014, 15, 749–763. [Google Scholar] [CrossRef]
  27. Bolger, A.M.; Lohse, M.; Usadel, B. Trimmomatic: A flexible trimmer for illumina sequence data. Bioinformatics 2014, 30, 2114–2120. [Google Scholar] [CrossRef] [PubMed] [Green Version]
  28. Li, H.; Durbin, R. Fast and accurate short read alignment with Burrows-Wheeler Transform. Bioinformatics 2009, 25, 1754–1760. [Google Scholar] [CrossRef] [Green Version]
  29. Li, H.; Handsaker, B.; Wysoker, A.; Fennell, T.; Ruan, J.; Homer, N.; Marth, G.; Abecasis, G.; Durbin, R. The sequence alignment/map format and SAMtools. Bioinformatics 2009, 25, 2078–2079. [Google Scholar] [CrossRef] [PubMed] [Green Version]
  30. Bansal, V. A Statistical Method for the Detection of Variants from Next-Generation Resequencing of DNA Pools. Bioinformatics 2010, 26, i318–i324. [Google Scholar] [CrossRef] [PubMed] [Green Version]
  31. McLaren, W.; Gil, L.; Hunt, S.E.; Riat, H.S.; Ritchie, G.R.S.; Thormann, A.; Flicek, P.; Cunningham, F. The Ensembl Variant Effect Predictor. Genome Biol. 2016, 17, 1–14. [Google Scholar] [CrossRef] [PubMed] [Green Version]
  32. Karlsson, E.K.; Baranowska, I.; Wade, C.M.; Salmon Hillbertz, N.H.C.; Zody, M.C.; Anderson, N.; Biagi, T.M.; Patterson, N.; Pielberg, G.R.; Kulbokas, E.J.; et al. Efficient mapping of mendelian traits in dogs through genome-wide association. Nat. Genet. 2007, 39, 1321–1328. [Google Scholar] [CrossRef] [PubMed]
  33. Quinlan, A.R.; Hall, I.M. BEDTools: A Flexible suite of utilities for comparing genomic features. Bioinformatics 2010, 26, 841–842. [Google Scholar] [CrossRef] [Green Version]
  34. Thomas, P.D.; Campbell, M.J.; Kejariwal, A.; Mi, H.; Karlak, B.; Daverman, R.; Diemer, K.; Muruganujan, A.; Narechania, A. PANTHER: A library of protein families and subfamilies indexed by function. Genome Res. 2003, 13, 2129–2141. [Google Scholar] [CrossRef] [PubMed] [Green Version]
  35. Supek, F.; Bošnjak, M.; Škunca, N.; Šmuc, T. Revigo summarizes and visualizes long lists of Gene Ontology terms. PLoS ONE 2011, 6, e21800. [Google Scholar] [CrossRef] [PubMed] [Green Version]
  36. Wade, C.M. Inbreeding and genetic diversity in dogs: Results from DNA analysis. Vet. J. 2011, 189, 183–188. [Google Scholar] [CrossRef]
  37. Arkush, K.D.; Giese, A.R.; Mendonca, H.L.; McBride, A.M.; Marty, G.D.; Hedrick, P.W. Resistance to three pathogens in the endangered winter-run Chinook salmon (Oncorhynchus tshawytscha): Effects of inbreeding and major histocompatibility complex genotypes. Can. J. Fish. Aquat. Sci. 2002, 59, 966–975. [Google Scholar] [CrossRef]
  38. Pante, M.J.R.; Gjerde, B.; McMillan, I. Effect of inbreeding on body weight at harvest in Rainbow trout, Oncorhynchus mykiss. Aquaculture 2001, 192, 201–211. [Google Scholar] [CrossRef]
  39. Rye, M.; Mao, I.L. Nonadditive genetic effects and inbreeding depression for body weight in Atlantic salmon (Salmo salar). Livest. Prod. Sci. 1998, 57, 15–22. [Google Scholar] [CrossRef]
  40. Gjerde, B.; Gunnes, K.; Gjedrem, T. Effect of inbreeding on survival and growth in Rainbow trout. Aquaculture 1983, 34, 327–332. [Google Scholar] [CrossRef]
  41. Perez-Enriquez, R.; Takagi, M.; Taniguchi, N. Genetic variability and pedigree tracing of a hatchery-reared stock of Red sea bream (Pagrus major) used for stock enhancement, based on microsatellite DNA markers. Aquaculture 1999, 173, 413–423. [Google Scholar] [CrossRef]
  42. Sundarrajan, L.; Unniappan, S. Small interfering RNA mediated knockdown of irisin suppresses food intake and modulates appetite regulatory peptides in Zebrafish. Gen. Comp. Endocrinol. 2017, 252, 200–208. [Google Scholar] [CrossRef] [PubMed]
  43. Yang, L.; Zhi, S.; Yang, G.; Qin, C.; Zhao, W.; Niu, M.; Zhang, W.; Tang, W.; Yan, X.; Zhang, Y.; et al. Molecular identification of fndc5 and effect of irisin on the glucose metabolism in Common carp (Cyprinus carpio). Gen. Comp. Endocrinol. 2021, 301, 113647. [Google Scholar] [CrossRef] [PubMed]
  44. Chen, G.; Zhou, Y.; Yu, X.; Wang, J.; Luo, W.; Pang, M.; Tong, J. Genome-Wide Association study reveals SNPs and candidate genes related to growth and body shape in Bighead carp (Hypophthalmichthys nobilis). Mar. Biotechnol. 2022, 24, 1138–1147. [Google Scholar] [CrossRef] [PubMed]
  45. Zhou, Y.; Fu, B.; Yu, X.; Chen, G.; Wang, J.; Luo, W.; Feng, Y.; Tong, J. Genome-Wide Association study reveals genomic regions and candidate genes for head size and shape in Bighead carp (Hypophthalmichthys nobilis). Aquaculture 2021, 539, 736648. [Google Scholar] [CrossRef]
  46. Bateman, A.; Bennett, H.P.J. The granulin gene family: From cancer to dementia. BioEssays 2009, 31, 1245–1254. [Google Scholar] [CrossRef] [PubMed]
  47. Ruan, D.; Zhuang, Z.; Ding, R.; Qiu, Y.; Zhou, S.; Wu, J.; Xu, C.; Hong, L.; Huang, S.; Zheng, E.; et al. Weighted single-step GWAS identified candidate genes associated with growth traits in a Duroc pig population. Genes 2021, 12, 117. [Google Scholar] [CrossRef] [PubMed]
  48. Mou, C.Y.; Li, Y.; Zhou, J.; Li, Q.; Zhou, B.; Wei, Z.; Luo, H.; Ke, H.Y.; Duan, Y.L.; Zhai, W.T.; et al. Genome-Wide Association study reveals growth-related markers and candidate genes for selection in Chinese longsnout catfish (Leiocassis longirostris). Aquaculture 2022, 560, 738513. [Google Scholar] [CrossRef]
  49. Carter, N.J.; Roach, Z.A.; Byrnes, M.M.; Zhu, Y. Adamts9 is necessary for ovarian development in Zebrafish. Gen. Comp. Endocrinol. 2019, 277, 130–140. [Google Scholar] [CrossRef] [PubMed]
  50. Yoshida, G.M.; Yáñez, J.M. Multi-Trait GWAS Using Imputed High-Density Genotypes from Whole-Genome Sequencing identifies genes associated with body traits in Nile tilapia. BMC Genom. 2021, 22, 57. [Google Scholar] [CrossRef] [PubMed]
  51. Prchal, M.; D’Ambrosio, J.; Lagarde, H.; Lallias, D.; Patrice, P.; François, Y.; Poncet, C.; Desgranges, A.; Haffray, P.; Dupont-Nivet, M.; et al. Genome-Wide Association study and genomic prediction of tolerance to acute hypoxia in Rainbow trout. Aquaculture 2023, 565, 739068. [Google Scholar] [CrossRef]
  52. Wang, L.Y.; Tian, Y.; Wen, H.S.; Yu, P.; Liu, Y.; Qi, X.; Gao, Z.C.; Zhang, K.Q.; Li, Y. SLC4 Gene family in Spotted sea bass (Lateolabrax maculatus): Structure, evolution, and expression profiling in response to alkalinity stress and salinity changes. Genes 2020, 11, 1271. [Google Scholar] [CrossRef]
  53. Sun, X.; Zhou, Y.; Zhang, R.; Wang, Z.; Xu, M.; Zhang, D.; Huang, J.; Luo, F.; Li, F.; Ni, Z.; et al. Dstyk mutation leads to congenital scoliosis-like vertebral malformations in Zebrafish via dysregulated MTORC1/TFEB pathway. Nat. Commun. 2020, 11, 479. [Google Scholar] [CrossRef] [Green Version]
  54. Ali, A.; Al-Tobasei, R.; Lourenco, D.; Leeds, T.; Kenney, B.; Salem, M. Genome-Wide identification of loci associated with growth in Rainbow trout. BMC Genom. 2020, 21, 209. [Google Scholar] [CrossRef] [PubMed] [Green Version]
Figure 1. PCA obtained plots of the gilthead seabream populations and nuclei investigated in this study. The first three Principal Components (PC) are reported with the explained variation in parentheses. The three subpopulations of offspring derived from the same nucleus (A1, A2, and A3) are all labelled in blue but indicated with different marks. (a) PC1 1 and PC2; (b) PC1 and PC3.
Genes 14 00839 g001
Figure 2. Proportion of monomorphic alleles observed in the different Italian gilthead seabream nuclei sequenced in this study and in farmed and wild populations retrieved from Peñaloza et al., 2021 [7].
Genes 14 00839 g002
Figure 3. Manhattan plots of the mFST values observed in the pairwise analyses between the DNA pools constructed from the fry of the three different nuclei cultivated in the Italian hatchery: (a) DNA pool A vs. DNA pool B; (b) DNA pool A vs. DNA pool C; and (c) DNA pool B vs. DNA pool C.
Genes 14 00839 g003
Figure 4. Overview of the chromosomes (chr) in which signatures of selection were detected. The x axis shows the chromosome length. The chromosomes that did not include any highlighted regions were not reported.
Genes 14 00839 g004
Figure 5. Proportion of variants detected (%) in the variant effect analyses for all the SNPs detected in the variant calling (a,b) and the variants identified in the detected outlier regions from the FST analyses (c,d). (a,c) describe all the variants divided according to their predicted impact. Modifier: usually non-coding variants or variants affecting non-coding genes, where predictions are difficult or there is no evidence of impact. Moderate: a non-destructive variant that can change protein effectiveness. Low: assumed to be mostly harmless or unlikely to change protein behavior. High: the variant is assumed to have high (disruptive) impact in the protein, probably causing protein truncation, loss of function, or triggering nonsense mediated decay. (b,d) include only the proportions of the different predicted variations of the SNPs with high impact.
Genes 14 00839 g005
Table 1. Nuclei from the same hatchery investigated in this study, the number of fish used to constitute the DNA-pools, the overall number of high-quality reads utilised for the alignment, and depth of sequencing considering the alignment to the gilthead seabream reference genome.
NucleiNo. of FishNo. of Reads 1Depth (×)
Italy A130320,381,05157.69
Italy A220347,592,48662.59
Italy A330330,168,76359.45
Italy B30341,904,08961.57
Italy C30339,891,84661.21
1 Number of filtered and aligned reads.
Table 2. Pairwise global FST values for each of the groups and for the combined farmed and wild population retrieved from the previous study [7]. For further details about FST comparisons see Table S2.
Nuclei/PopulationsA1A2A3BCFarmedWild
A10
A20.0530
A30.0520.0320
B0.2030.1630.1720
C0.1910.1620.1690.4050
Farmed0.050.040.040.1630.1660
Wild0.060.050.050.1660.1650.010
Disclaimer/Publisher’s Note: The statements, opinions and data contained in all publications are solely those of the individual author(s) and contributor(s) and not of MDPI and/or the editor(s). MDPI and/or the editor(s) disclaim responsibility for any injury to people or property resulting from any ideas, methods, instructions or products referred to in the content.

