
Chromosome-Length Assembly of the Baikal Seal (Pusa sibirica) Genome Reveals a Historically Large Population Prior to Isolation in Lake Baikal
 , , , , , , , , , , and
Abstract
:1. Introduction
2. Materials and Methods
2.1. Sequencing of Baikal Seal Individuals
2.2. Filtration, QC, and Postprocessing of Sequencing Data
2.3. Assembly of Baikal Seal Reference Genome
2.4. Genomes of other Pinnipeds and QC of All Assemblies
2.5. Whole Genome Alignment and Connection between Assembly and Karyotype
2.6. Read Alignment, Coverage Estimation, and Variant Calling
2.7. Heterozygosity
2.8. Demographic Reconstruction
2.9. Phylogenetic Tree Reconstruction and Dating
3. Results
3.1. Genome Size and Assembly, Repeat Content
3.2. Connection between Assembly and Karyotype
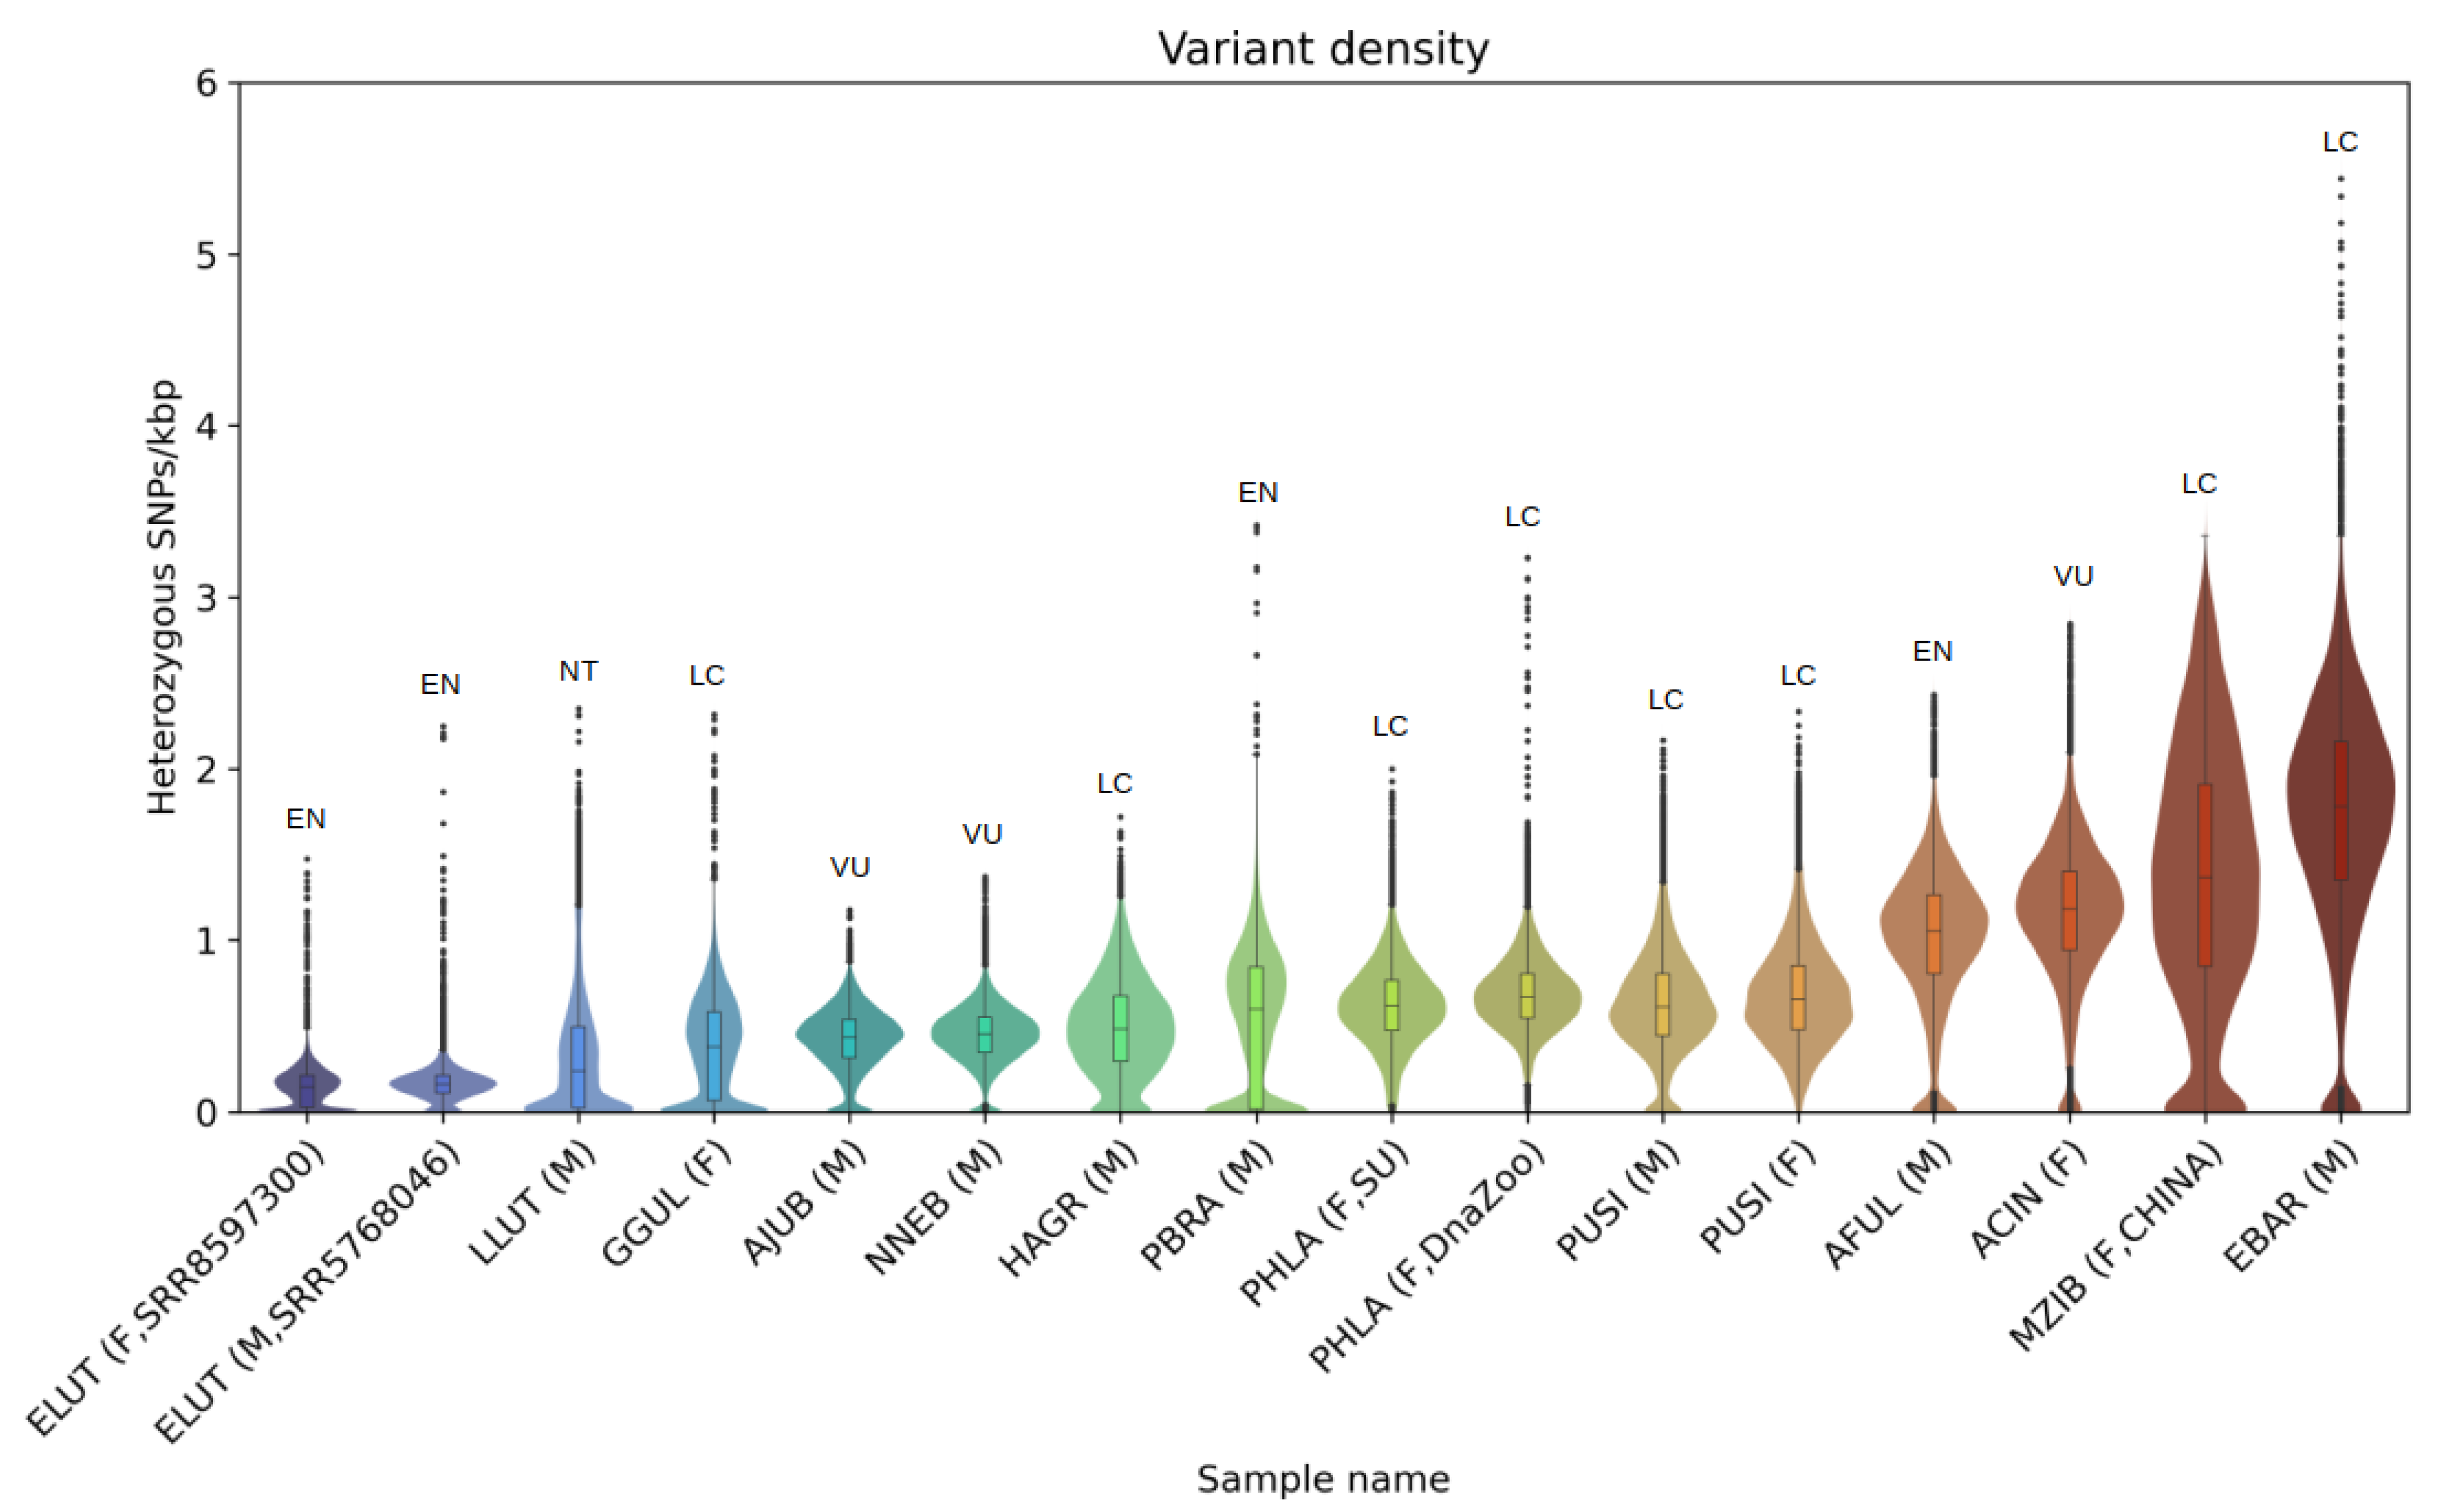
3.3. Heterozygosity and SNP Density
3.4. Demographic Reconstruction
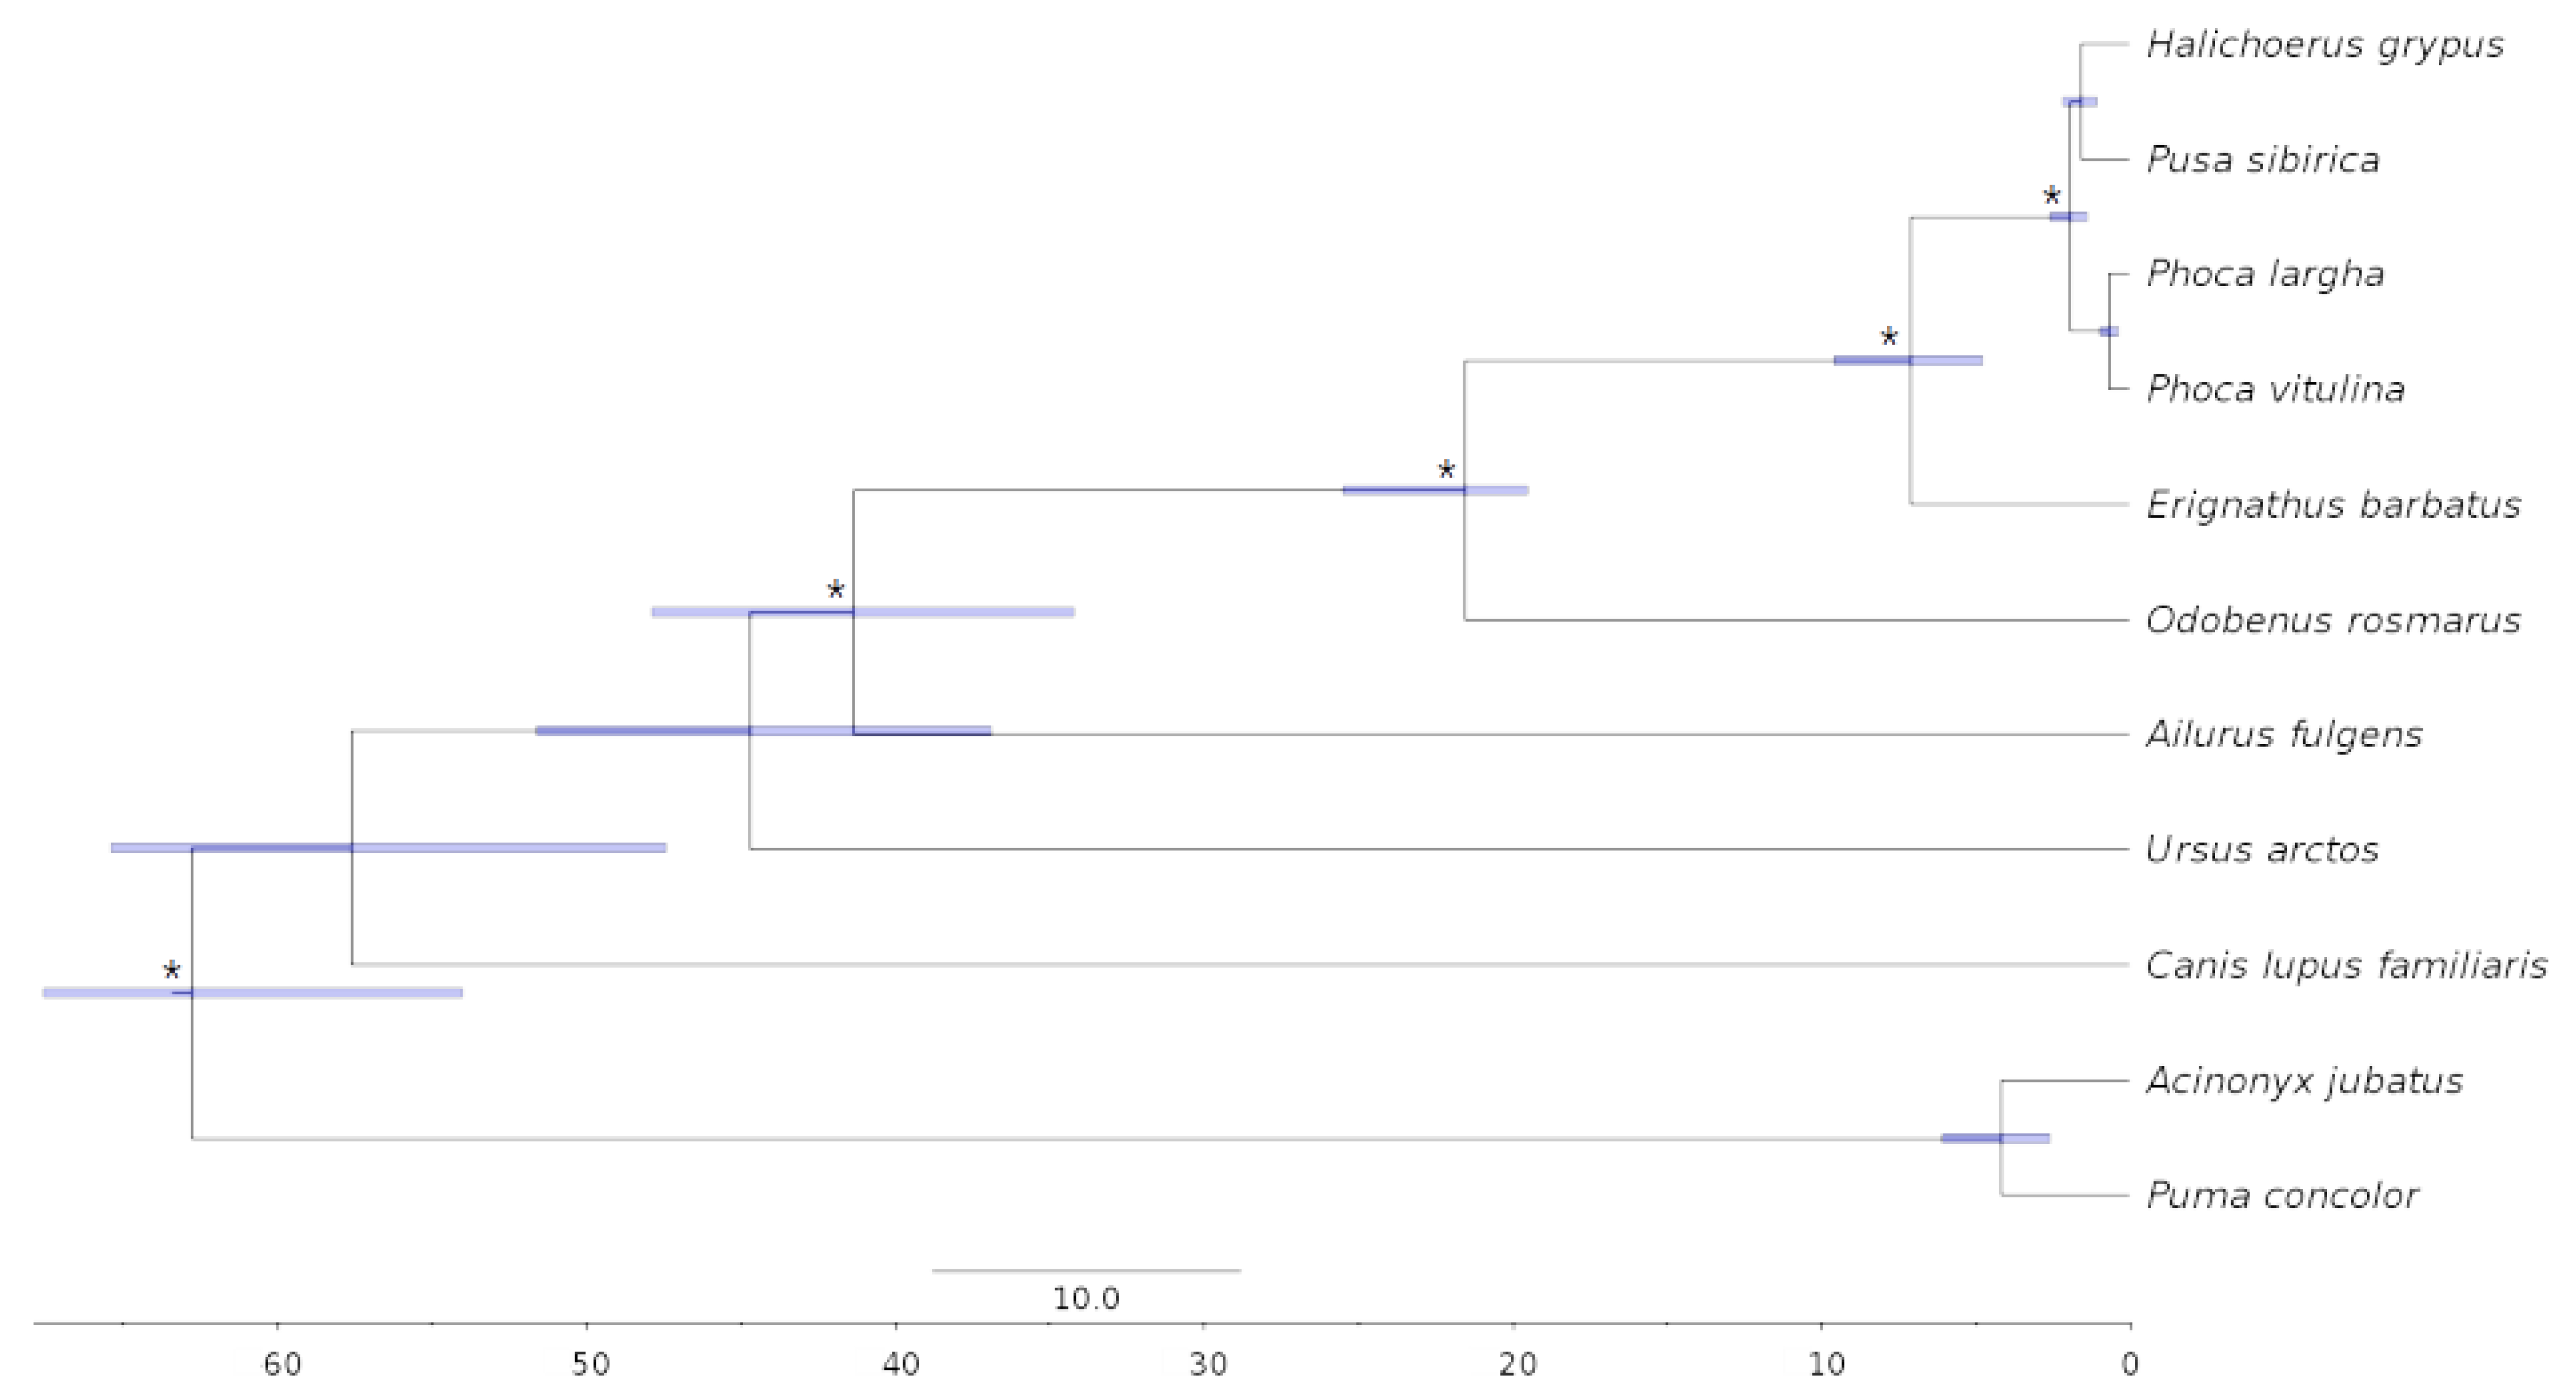
3.5. Phylogenomics and Molecular Dating
4. Discussion
4.1. Chromosome-Level Assemblies and Karyotypes
4.2. Genome Rearrangements and Speciation
4.3. Heterozygosity
4.4. Interpretation of Demographic History Reconstruction
4.5. Phylogenetic Analysis
5. Conclusions
Supplementary Materials
Author Contributions
Funding
Institutional Review Board Statement
Informed Consent Statement
Data Availability Statement
Acknowledgments
Conflicts of Interest
Abbreviations
| MP | Maximum parsimony |
| ML | Maximum likelihood |
| NJ | Neighbor joining |
| BI | Bayesian inference |
References
- Astakhov, V. Middle Pleistocene Glaciations of the Russian North. Quat. Sci. Rev. 2004, 23, 1285–1311. [Google Scholar] [CrossRef]
- Palo, J.U.; Väinölä, R. The Enigma of the Landlocked Baikal and Caspian Seals Addressed through Phylogeny of Phocine Mitochondrial Sequences. Biol. J. Linn. Soc. 2006, 88, 61–72. [Google Scholar] [CrossRef] [Green Version]
- Hassanin, A.; Veron, G.; Ropiquet, A.; Jansen van Vuuren, B.; Lécu, A.; Goodman, S.M.; Haider, J.; Nguyen, T.T. Evolutionary History of Carnivora (Mammalia, Laurasiatheria) Inferred from Mitochondrial Genomes. PLoS ONE 2021, 16, e0240770. [Google Scholar] [CrossRef]
- Sasaki, H.; Numachi, K.; Grachev, M.A. The Origin and Genetic Relationships of the Baikal Seal, Phoca Sibirica, by Restriction Analysis of Mitochondrial DNA. Zoolog. Sci. 2003, 20, 1417–1422. [Google Scholar] [CrossRef] [PubMed] [Green Version]
- Petrov, E.A.; Kupchinsky, A.B. Baikal Museum SB RAS Introduction of the Baikal Seal (Pusa sibirica Gm.) to Lake Baikal and Current Threats to the Population due to Climate Change: A Review. 1. Introduction of the Baikal Seal in the Lake Baikal: Family Ties, Time and Migration. Bull. Irkutsk State Univ. Ser. Biol. Ecol. 2021, 38, 103–134. [Google Scholar] [CrossRef]
- Miyazaki, N. Caspian and Baikal Seals: Pusa Caspica and Pusa Sibirica. In Encyclopedia of Marine Mammals, 2nd ed.; Academic Press: Cambridge, MA, USA, 2009; pp. 188–191. [Google Scholar] [CrossRef]
- Nomokonova, T.; Losey, R.; Iakunaeva, V.; Emel’ianova, I.; Baginova, E.; Pastukhov, M. People and Seals at Siberia’s Lake Baikal. J. Ethnobiol. 2013, 33, 259–280. [Google Scholar] [CrossRef]
- Nomokonova, T.; Losey, R.J.; Goriunova, O.I.; Novikov, A.G.; Weber, A.W. A 9000 Year History of Seal Hunting on Lake Baikal, Siberia: The Zooarchaeology of Sagan-Zaba II. PLoS ONE 2015, 10, e0128314. [Google Scholar] [CrossRef] [Green Version]
- Krafft, B.; Kovacs, K.; Lydersen, C. Distribution of Sex and Age Groups of Ringed Seals Pusa Hispida in the Fast-Ice Breeding Habitat of Kongsfjorden, Svalbard. Mar. Ecol.-Prog. Ser. 2007, 335, 199–206. [Google Scholar] [CrossRef]
- Smith, T.; Stirling, I. The Breeding Habitat of the Ringed Seal (Phoca hispida). The Birth Lair and Associated Structures. Can. J. Zool. 2011, 53, 1297–1305. [Google Scholar] [CrossRef]
- Wilson, S.; Dolgova, E.; Trukhanova, I.; Dmitrieva, L.; Crawford, I.; Baimukanov, M.; Goodman, S. Breeding Behavior and Pup Development of the Caspian Seal, Pusa Caspica. J. Mammal. 2016, 98, 143–153. [Google Scholar] [CrossRef] [Green Version]
- IWC Commercial Whaling. Available online: https://iwc.int/management-and-conservation/whaling/commercial (accessed on 23 January 2023).
- Ozersky, T.; Pastukhov, M.; Poste, A.; Deng, X.; Moore, M. Long-Term and Ontogenetic Patterns of Heavy Metal Contamination in Lake Baikal Seals (Pusa sibirica). Environ. Sci. Technol. 2017, 51, 18. [Google Scholar] [CrossRef] [PubMed] [Green Version]
- Weber, A.; Goriunova, O.I.; Konopatskii, A.K. Prehistoric Seal Hunting on Lake Baikal: Methodology and Preliminary Results of the Analysis of Canine Sections. J. Archaeol. Sci. 1993, 20, 629–644. [Google Scholar] [CrossRef]
- Watanabe, Y.Y.; Baranov, E.A.; Miyazaki, N. Ultrahigh Foraging Rates of Baikal Seals Make Tiny Endemic Amphipods Profitable in Lake Baikal. Proc. Natl. Acad. Sci. USA 2020, 117, 31242–31248. [Google Scholar] [CrossRef] [PubMed]
- Stewart, B.S.; Petrov, E.A.; Baranov, E.A.; Ivanov, A.T.M. Seasonal Movements and Dive Patterns of Juvenile Baikal Seals, Phoca Sibirica. Mar. Mammal Sci. 1996, 12, 528–542. [Google Scholar] [CrossRef]
- Watanabe, Y.; Baranov, E.A.; Sato, K.; Naito, Y.; Miyazaki, N. Foraging Tactics of Baikal Seals Differ between Day and Night. Mar. Ecol. Prog. Ser. 2004, 279, 283–289. [Google Scholar] [CrossRef]
- Watanabe, Y.Y.; Baranov, E.A.; Miyazaki, N. Drift Dives and Prolonged Surfacing Periods in Baikal Seals: Resting Strategies in Open Waters? J. Exp. Biol. 2015, 218, 2793–2798. [Google Scholar] [CrossRef] [Green Version]
- Goodman, S. IUCN Red List of Threatened Species: Pusa Sibirica. 2015. Available online: https://dx.doi.org/10.2305/IUCN.UK.2016-1.RLTS.T41676A45231738.en (accessed on 21 December 2022).
- BaikalNIRO BaikalNIRO–Scientists Assessed the Offspring of the Baikal Seal. Available online: http://baikal.vniro.ru/ru/novosti/item/104-uchjonye-proveli-otsenku-priploda-bajkal-skoj-nerpy (accessed on 21 January 2023).
- Ivanov, K.M.; Kupchinskii, A.B.; Ovdin, M.Y.; Petrov, Y.A.; Sirovatskii, A.A.; Shabanov, D.Y. Experience in application of UAV in ecological studies of the Baikal seal (Pusa Sibirica GM.) population at the beginning of shore rookeries formation. Междунарoдный Научнo-Исследoвательский Журнал 2022, 8, 122. [Google Scholar] [CrossRef]
- Klimova, A.; Phillips, C.D.; Fietz, K.; Olsen, M.T.; Harwood, J.; Amos, W.; Hoffman, J.I. Global Population Structure and Demographic History of the Grey Seal. Mol. Ecol. 2014, 23, 3999–4017. [Google Scholar] [CrossRef]
- Gilpin, J.B.; Science, N.S.I. of N. On the Seals of Nova Scotia. 1874. Available online: https://dalspace.library.dal.ca/bitstream/handle/10222/11271/Pt4Art7.pdf?...1 (accessed on 21 December 2022).
- NOAA Fisheries Gray Seal | NOAA Fisheries. Available online: https://www.fisheries.noaa.gov/species/gray-seal (accessed on 22 January 2023).
- Wood, S.; Frasier, T.; Frasier, B.; Gilbert, J.; White, B.; Bowen, W.; Hammill, M.; Waring, G.; Brault, S. The Genetics of Recolonization: An Analysis of the Stock Structure of Grey Seals (Halichoerus Grypus) in the Northwest Atlantic. Can. J. Zool. 2011, 89, 490–497. [Google Scholar] [CrossRef] [Green Version]
- Han, J.-B.; Sun, F.-Y.; Gao, X.-G.; He, C.-B.; Wang, P.-L.; Ma, Z.-Q.; Wang, Z.-H. Low Microsatellite Variation in Spotted Seal (Phoca Largha) Shows a Decrease in Population Size in the Liaodong Gulf Colony. Ann. Zool. Fenn. 2010, 47, 15–27. [Google Scholar] [CrossRef]
- Conn, P.B.; Ver Hoef, J.M.; McClintock, B.T.; Moreland, E.E.; London, J.M.; Cameron, M.F.; Dahle, S.P.; Boveng, P.L. Estimating Multispecies Abundance Using Automated Detection Systems: Ice-Associated Seals in the Bering Sea. Methods Ecol. Evol. 2014, 5, 1280–1293. [Google Scholar] [CrossRef]
- Allen, P.J.; Amos, W.; Pomeroy, P.P.; Twiss, S.D. Microsatellite Variation in Grey Seals (Halichoerus Grypus) Shows Evidence of Genetic Differentiation between Two British Breeding Colonies. Mol. Ecol. 1995, 4, 653–662. [Google Scholar] [CrossRef] [PubMed]
- Boskovic, R.; Kovacs, K.M.; Hammill, M.O.; White, B.N. Geographic Distribution of Mitochondrial DNA Haplotypes in Grey Seals (Halichoerus Grypus). Can. J. Zool. 1996, 74, 1787–1796. [Google Scholar] [CrossRef]
- Nakagawa, E.; Kobayashi, M.; Suzuki, M.; Tsubota, T. Genetic Variation in the Harbor Seal (Phoca Vitulina) and Spotted Seal (Phoca Largha) Around Hokkaido, Japan, Based on Mitochondrial Cytochrome b Sequences. Zool. Sci. 2010, 27, 263–268. [Google Scholar] [CrossRef] [PubMed]
- Fulton, T.L.; Strobeck, C. Multiple Fossil Calibrations, Nuclear Loci and Mitochondrial Genomes Provide New Insight into Biogeography and Divergence Timing for True Seals (Phocidae, Pinnipedia). J. Biogeogr. 2010, 37, 814–829. [Google Scholar] [CrossRef]
- Fulton, T.L.; Strobeck, C. Multiple Markers and Multiple Individuals Refine True Seal Phylogeny and Bring Molecules and Morphology Back in Line. Proc. Biol. Sci. 2010, 277, 1065–1070. [Google Scholar] [CrossRef] [Green Version]
- Brandies, P.; Peel, E.; Hogg, C.J.; Belov, K. The Value of Reference Genomes in the Conservation of Threatened Species. Genes 2019, 10, 846. [Google Scholar] [CrossRef] [Green Version]
- Formenti, G.; Theissinger, K.; Fernandes, C.; Bista, I.; Bombarely, A.; Bleidorn, C.; Ciofi, C.; Crottini, A.; Godoy, J.A.; Höglund, J.; et al. The Era of Reference Genomes in Conservation Genomics. Trends Ecol. Evol. 2022, 37, 197–202. [Google Scholar] [CrossRef]
- Totikov, A.; Tomarovsky, A.; Prokopov, D.; Yakupova, A.; Bulyonkova, T.; Derezanin, L.; Rasskazov, D.; Wolfsberger, W.W.; Koepfli, K.-P.; Oleksyk, T.K.; et al. Chromosome-Level Genome Assemblies Expand Capabilities of Genomics for Conservation Biology. Genes 2021, 12, 1336. [Google Scholar] [CrossRef]
- Paez, S.; Kraus, R.H.S.; Shapiro, B.; Gilbert, M.T.P.; Jarvis, E.D.; Vertebrate Genomes Project Conservation Group; Al-Ajli, F.O.; Ceballos, G.; Crawford, A.J.; Fedrigo, O.; et al. Reference Genomes for Conservation. Science 2022, 377, 364–366. [Google Scholar] [CrossRef]
- Beklemisheva, V.R.; Perelman, P.L.; Lemskaya, N.A.; Kulemzina, A.I.; Proskuryakova, A.A.; Burkanov, V.N.; Graphodatsky, A.S. The Ancestral Carnivore Karyotype As Substantiated by Comparative Chromosome Painting of Three Pinnipeds, the Walrus, the Steller Sea Lion and the Baikal Seal (Pinnipedia, Carnivora). PLoS ONE 2016, 11, e0147647. [Google Scholar] [CrossRef] [Green Version]
- Andrews, S. FASTQC. A Quality Control Tool for High Throughput Sequence Data 2010. Available online: https://www.bioinformatics.babraham.ac.uk/projects/fastqc/ (accessed on 21 December 2022).
- Marçais, G.; Kingsford, C. A Fast, Lock-Free Approach for Efficient Parallel Counting of Occurrences of k-Mers. Bioinformatics 2011, 27, 764–770. [Google Scholar] [CrossRef] [Green Version]
- Bolger, A.M.; Lohse, M.; Usadel, B. Trimmomatic: A Flexible Trimmer for Illumina Sequence Data. Bioinformatics 2014, 30, 2114–2120. [Google Scholar] [CrossRef] [Green Version]
- Leggett, R.M.; Clavijo, B.J.; Clissold, L.; Clark, M.D.; Caccamo, M. NextClip: An Analysis and Read Preparation Tool for Nextera Long Mate Pair Libraries. Bioinformatics 2014, 30, 566–568. [Google Scholar] [CrossRef] [Green Version]
- Kajitani, R.; Toshimoto, K.; Noguchi, H.; Toyoda, A.; Ogura, Y.; Okuno, M.; Yabana, M.; Harada, M.; Nagayasu, E.; Maruyama, H.; et al. Efficient de Novo Assembly of Highly Heterozygous Genomes from Whole-Genome Shotgun Short Reads. Genome Res. 2014, 24, 1384–1395. [Google Scholar] [CrossRef] [Green Version]
- Dudchenko, O.; Batra, S.S.; Omer, A.D.; Nyquist, S.K.; Hoeger, M.; Durand, N.C.; Shamim, M.S.; Machol, I.; Lander, E.S.; Aiden, A.P.; et al. De Novo Assembly of the Aedes Aegypti Genome Using Hi-C Yields Chromosome-Length Scaffolds. Science 2017, 356, 92–95. [Google Scholar] [CrossRef] [Green Version]
- Dudchenko, O.; Shamim, M.S.; Batra, S.S.; Durand, N.C.; Musial, N.T.; Mostofa, R.; Pham, M.; Glenn St Hilaire, B.; Yao, W.; Stamenova, E.; et al. The Juicebox Assembly Tools Module Facilitates <em>de Novo</Em> Assembly of Mammalian Genomes with Chromosome-Length Scaffolds for under $1000. bioRxiv 2018, 254797. [Google Scholar] [CrossRef] [Green Version]
- Dudchenko, O. SEAL Team. Available online: https://www.dnazoo.org/post/seal-team (accessed on 22 November 2022).
- Neely, B. This Seal Hits the Spot. Available online: https://www.dnazoo.org/post/this-seal-hits-the-spot (accessed on 22 November 2022).
- Neely, B. Sealing the Deal on Our 250th Genome Assembly. Available online: https://www.dnazoo.org/post/sealing-the-deal-on-our-250th-genome-assembly (accessed on 22 November 2022).
- Park, J.Y.; Kim, K.; Sohn, H.; Kim, H.W.; An, Y.-R.; Kang, J.-H.; Kim, E.-M.; Kwak, W.; Lee, C.; Yoo, D.; et al. Deciphering the Evolutionary Signatures of Pinnipeds Using Novel Genome Sequences: The First Genomes of Phoca Largha, Callorhinus Ursinus, and Eumetopias Jubatus. Sci. Rep. 2018, 8, 16877. [Google Scholar] [CrossRef] [PubMed] [Green Version]
- Manni, M.; Berkeley, M.R.; Seppey, M.; Zdobnov, E.M. BUSCO: Assessing Genomic Data Quality and Beyond. Curr. Protoc. 2021, 1, e323. [Google Scholar] [CrossRef] [PubMed]
- Benson, G. Tandem Repeats Finder: A Program to Analyze DNA Sequences. Nucleic Acids Res. 1999, 27, 573–580. [Google Scholar] [CrossRef] [Green Version]
- Morgulis, A.; Gertz, E.M.; Schäffer, A.A.; Agarwala, R. WindowMasker: Window-Based Masker for Sequenced Genomes. Bioinformatics 2006, 22, 134–141. [Google Scholar] [CrossRef] [PubMed] [Green Version]
- Smit, A.; Hubley, R.; Green, P. RepeatMasker Open-4.0 2013. Available online: http://www.repeatmasker.org/ (accessed on 21 December 2022).
- Armstrong, J.; Hickey, G.; Diekhans, M.; Fiddes, I.T.; Novak, A.M.; Deran, A.; Fang, Q.; Xie, D.; Feng, S.; Stiller, J.; et al. Progressive Cactus Is a Multiple-Genome Aligner for the Thousand-Genome Era. Nature 2020, 587, 246–251. [Google Scholar] [CrossRef] [PubMed]
- Krasheninnikova, K.; Diekhans, M.; Armstrong, J.; Dievskii, A.; Paten, B.; O’Brien, S. HalSynteny: A Fast, Easy-to-Use Conserved Synteny Block Construction Method for Multiple Whole-Genome Alignments. GigaScience 2020, 9, giaa047. [Google Scholar] [CrossRef]
- Arnason, U. Comparative Chromosome Studies in Pinnipedia. Hereditas 1974, 76, 179–226. [Google Scholar] [CrossRef]
- Beklemisheva, V.R.; Perelman, P.L.; Lemskaya, N.A.; Proskuryakova, A.A.; Serdyukova, N.A.; Burkanov, V.N.; Gorshunov, M.B.; Ryder, O.; Thompson, M.; Lento, G.; et al. Karyotype Evolution in 10 Pinniped Species: Variability of Heterochromatin versus High Conservatism of Euchromatin as Revealed by Comparative Molecular Cytogenetics. Genes 2020, 11, 1485. [Google Scholar] [CrossRef]
- Frönicke, L.; Müller-Navia, J.; Romanakis, K.; Scherthan, H. Chromosomal Homeologies between Human, Harbor Seal (Phoca Vitulina) and the Putative Ancestral Carnivore Karyotype Revealed by Zoo-FISH. Chromosoma 1997, 106, 108–113. [Google Scholar] [CrossRef] [PubMed]
- Graphodatsky, A.; Perelman, P.; OBrien, S.J. (Eds.) Atlas of Mammalian Chromosomes, 2nd ed.; John Wiley & Sons, Inc.: Hoboken, NJ, USA, 2020; ISBN 978-1-119-41803-0. [Google Scholar]
- Li, H.; Durbin, R. Fast and Accurate Short Read Alignment with Burrows–Wheeler Transform. Bioinformatics 2009, 25, 1754–1760. [Google Scholar] [CrossRef] [Green Version]
- Li, H.; Handsaker, B.; Wysoker, A.; Fennell, T.; Ruan, J.; Homer, N.; Marth, G.; Abecasis, G.; Durbin, R. 1000 Genome Project Data Processing Subgroup The Sequence Alignment/Map Format and SAMtools. Bioinformatics 2009, 25, 2078–2079. [Google Scholar] [CrossRef] [Green Version]
- Pedersen, B.S.; Quinlan, A.R. Mosdepth: Quick Coverage Calculation for Genomes and Exomes. Bioinformatics 2018, 34, 867–868. [Google Scholar] [CrossRef] [Green Version]
- Li, H.; Durbin, R. Inference of Human Population History from Individual Whole-Genome Sequences. Nature 2011, 475, 493–496. [Google Scholar] [CrossRef] [Green Version]
- Cleary, A.C.; Hoffman, J.I.; Forcada, J.; Lydersen, C.; Lowther, A.D.; Kovacs, K.M. 50,000 Years of Ice and Seals: Impacts of the Last Glacial Maximum on Antarctic Fur Seals. Ecol. Evol. 2021, 11, 14003–14011. [Google Scholar] [CrossRef]
- Nikolic, N.; Thompson, P.; de Bruyn, M.; Macé, M.; Chevalet, C. Evolutionary History of a Scottish Harbour Seal Population. PeerJ 2020, 8, e9167. [Google Scholar] [CrossRef]
- Nyman, T.; Valtonen, M.; Aspi, J.; Ruokonen, M.; Kunnasranta, M.; Palo, J.U. Demographic Histories and Genetic Diversities of Fennoscandian Marine and Landlocked Ringed Seal Subspecies. Ecol. Evol. 2014, 4, 3420–3434. [Google Scholar] [CrossRef] [PubMed]
- Paijmans, A.J.; Stoffel, M.A.; Bester, M.N.; Cleary, A.C.; De Bruyn, P.J.N.; Forcada, J.; Goebel, M.E.; Goldsworthy, S.D.; Guinet, C.; Lydersen, C.; et al. The Genetic Legacy of Extreme Exploitation in a Polar Vertebrate. Sci. Rep. 2020, 10, 5089. [Google Scholar] [CrossRef] [PubMed] [Green Version]
- Palo, J.U.; Mäkinen, H.S.; Helle, E.; Stenman, O.; Väinölä, R. Microsatellite Variation in Ringed Seals (Phoca Hispida): Genetic Structure and History of the Baltic Sea Population. Heredity 2001, 86, 609–617. [Google Scholar] [CrossRef] [PubMed] [Green Version]
- Hoffman, J.I.; Chen, R.S.; Vendrami, D.L.J.; Paijmans, A.J.; Dasmahapatra, K.K.; Forcada, J. Demographic Reconstruction of Antarctic Fur Seals Supports the Krill Surplus Hypothesis. Genes 2022, 13, 541. [Google Scholar] [CrossRef]
- Peart, C.R.; Tusso, S.; Pophaly, S.D.; Botero-Castro, F.; Wu, C.-C.; Aurioles-Gamboa, D.; Baird, A.B.; Bickham, J.W.; Forcada, J.; Galimberti, F.; et al. Determinants of Genetic Variation across Eco-Evolutionary Scales in Pinnipeds. Nat. Ecol. Evol. 2020, 4, 1095–1104. [Google Scholar] [CrossRef]
- Zappes, I.A.; Fabiani, A.; Sbordoni, V.; Rakaj, A.; Palozzi, R.; Allegrucci, G. New Data on Weddell Seal (Leptonychotes Weddellii) Colonies: A Genetic Analysis of a Top Predator from the Ross Sea, Antarctica. PLoS ONE 2017, 12, e0182922. [Google Scholar] [CrossRef] [Green Version]
- Bowen, D. IUCN Red List of Threatened Species: Halichoerus Grypus. 2016. Available online: https://dx.doi.org/10.2305/IUCN.UK.2016-1.RLTS.T9660A45226042.en (accessed on 21 December 2022).
- Lowry, L. IUCN Red List of Threatened Species: Phoca Vitulina. 2016. Available online: https://dx.doi.org/10.2305/IUCN.UK.2016-1.RLTS.T17013A45229114.en (accessed on 21 December 2022).
- Lowry, L. IUCN Red List of Threatened Species: Pusa Hispida. 2016. Available online: https://dx.doi.org/10.2305/IUCN.UK.2016-1.RLTS.T41672A45231341.en (accessed on 21 December 2022).
- Dobrynin, P.; Liu, S.; Tamazian, G.; Xiong, Z.; Yurchenko, A.A.; Krasheninnikova, K.; Kliver, S.; Schmidt-Küntzel, A.; Koepfli, K.-P.; Johnson, W.; et al. Genomic Legacy of the African Cheetah, Acinonyx Jubatus. Genome Biol. 2015, 16, 277. [Google Scholar] [CrossRef] [Green Version]
- Puma Concolor Isolate SC36_Marlon, Whole Genome Shotgun Sequencing Project 2018. Available online: https://www.ncbi.nlm.nih.gov/bioproject/PRJNA437459/ (accessed on 21 December 2022).
- Dudchenko, O. A Study in Scarlet. Available online: https://www.dnazoo.org/post/a-study-in-scarlet (accessed on 4 November 2022).
- Taylor, G.A.; Kirk, H.; Coombe, L.; Jackman, S.D.; Chu, J.; Tse, K.; Cheng, D.; Chuah, E.; Pandoh, P.; Carlsen, R.; et al. The Genome of the North American Brown Bear or Grizzly: Ursus Arctos Ssp. Horribilis. Genes 2018, 9, 598. [Google Scholar] [CrossRef] [Green Version]
- Hu, Y.; Wu, Q.; Ma, S.; Ma, T.; Shan, L.; Wang, X.; Nie, Y.; Ning, Z.; Yan, L.; Xiu, Y.; et al. Comparative Genomics Reveals Convergent Evolution between the Bamboo-Eating Giant and Red Pandas. Proc. Natl. Acad. Sci. USA 2017, 114, 1081–1086. [Google Scholar] [CrossRef] [PubMed] [Green Version]
- Foote, A.D.; Liu, Y.; Thomas, G.W.C.; Vinař, T.; Alföldi, J.; Deng, J.; Dugan, S.; van Elk, C.E.; Hunter, M.E.; Joshi, V.; et al. Convergent Evolution of the Genomes of Marine Mammals. Nat. Genet. 2015, 47, 272–275. [Google Scholar] [CrossRef] [PubMed] [Green Version]
- Clavijo, B.J.; Venturini, L.; Schudoma, C.; Accinelli, G.G.; Kaithakottil, G.; Wright, J.; Borrill, P.; Kettleborough, G.; Heavens, D.; Chapman, H.; et al. An Improved Assembly and Annotation of the Allohexaploid Wheat Genome Identifies Complete Families of Agronomic Genes and Provides Genomic Evidence for Chromosomal Translocations. Genome Res. 2017, 27, 885–896. [Google Scholar] [CrossRef] [Green Version]
- Phoca Vitulina Isolate PV1807, Whole Genome Shotgun Sequencing Project 2019. Available online: https://www.ncbi.nlm.nih.gov/bioproject/494181 (accessed on 21 December 2022).
- Löytynoja, A.; Goldman, N. Phylogeny-Aware Gap Placement Prevents Errors in Sequence Alignment and Evolutionary Analysis. Science 2008, 320, 1632–1635. [Google Scholar] [CrossRef] [Green Version]
- Castresana, J. Selection of Conserved Blocks from Multiple Alignments for Their Use in Phylogenetic Analysis. Mol. Biol. Evol. 2000, 17, 540–552. [Google Scholar] [CrossRef] [PubMed] [Green Version]
- Nguyen, L.-T.; Schmidt, H.A.; von Haeseler, A.; Minh, B.Q. IQ-TREE: A Fast and Effective Stochastic Algorithm for Estimating Maximum-Likelihood Phylogenies. Mol. Biol. Evol. 2015, 32, 268–274. [Google Scholar] [CrossRef]
- Kalyaanamoorthy, S.; Minh, B.Q.; Wong, T.K.F.; von Haeseler, A.; Jermiin, L.S. ModelFinder: Fast Model Selection for Accurate Phylogenetic Estimates. Nat. Methods 2017, 14, 587–589. [Google Scholar] [CrossRef] [Green Version]
- Yang, Z. PAML 4: Phylogenetic Analysis by Maximum Likelihood. Mol. Biol. Evol. 2007, 24, 1586–1591. [Google Scholar] [CrossRef] [Green Version]
- Brashear, W.A.; Bredemeyer, K.R.; Murphy, W.J. Genomic Architecture Constrained Placental Mammal X Chromosome Evolution. Genome Res. 2021, 31, 1353–1365. [Google Scholar] [CrossRef]
- Lewin, H.A.; Graves, J.A.M.; Ryder, O.A.; Graphodatsky, A.S.; O’Brien, S.J. Precision Nomenclature for the New Genomics. GigaScience 2019, 8, giz086. [Google Scholar] [CrossRef]
- Dyomin, A.G.; Koshel, E.I.; Kiselev, A.M.; Saifitdinova, A.F.; Galkina, S.A.; Fukagawa, T.; Kostareva, A.A.; Gaginskaya, E.R. Chicken RRNA Gene Cluster Structure. PLoS ONE 2016, 11, e0157464. [Google Scholar] [CrossRef] [PubMed] [Green Version]
- Levan, A.; Fredga, K.; Sandberg, A.A. Nomenclature for Centromeric Position on Chromosomes. Hereditas 1964, 52, 201–220. [Google Scholar] [CrossRef]
- McGowan-Jordan, J.; Hastings, R.J.; Moore, S. ISCN 2020: An International System for Human Cytogenomic Nomenclature (2020), 1st ed.; S. Karger: Basel, Switzerland, 2020; ISBN 978-3-318-06706-4. [Google Scholar]
- Huynh, L.Y.; Maney, D.L.; Thomas, J.W. Chromosome-Wide Linkage Disequilibrium Caused by an Inversion Polymorphism in the White-Throated Sparrow (Zonotrichia Albicollis). Heredity 2011, 106, 537–546. [Google Scholar] [CrossRef] [PubMed] [Green Version]
- Kennington, W.J.; Partridge, L.; Hoffmann, A.A. Patterns of Diversity and Linkage Disequilibrium Within the Cosmopolitan Inversion In(3R)Payne in Drosophila Melanogaster Are Indicative of Coadaptation. Genetics 2006, 172, 1655–1663. [Google Scholar] [CrossRef] [Green Version]
- Ayala, D.; Guerrero, R.F.; Kirkpatrick, M. Reproductive isolation and local adaptation quantified for a chromosome inversion in a malaria mosquito. Evolution 2013, 67, 946–958. [Google Scholar] [CrossRef]
- Cursino, M.S.; Salviano, M.B.; Abril, V.V.; dos Santos Zanetti, E.; Duarte, J.M.B. The Role of Chromosome Variation in the Speciation of the Red Brocket Deer Complex: The Study of Reproductive Isolation in Females. BMC Evol. Biol. 2014, 14, 40. [Google Scholar] [CrossRef] [Green Version]
- Kemppainen, P.; Knight, C.G.; Sarma, D.K.; Hlaing, T.; Prakash, A.; Maung Maung, Y.N.; Somboon, P.; Mahanta, J.; Walton, C. Linkage Disequilibrium Network Analysis (LDna) Gives a Global View of Chromosomal Inversions, Local Adaptation and Geographic Structure. Mol. Ecol. Resour. 2015, 15, 1031–1045. [Google Scholar] [CrossRef]
- Noor, M.A.F.; Grams, K.L.; Bertucci, L.A.; Reiland, J. Chromosomal Inversions and the Reproductive Isolation of Species. Proc. Natl. Acad. Sci. USA 2001, 98, 12084–12088. [Google Scholar] [CrossRef] [Green Version]
- Marquès-Bonet, T.; Cáceres, M.; Bertranpetit, J.; Preuss, T.M.; Thomas, J.W.; Navarro, A. Chromosomal Rearrangements and the Genomic Distribution of Gene-Expression Divergence in Humans and Chimpanzees. Trends Genet. TIG 2004, 20, 524–529. [Google Scholar] [CrossRef]
- Arnason, U.; Gullberg, A.; Janke, A.; Kullberg, M.; Lehman, N.; Petrov, E.A.; Väinölä, R. Pinniped Phylogeny and a New Hypothesis for Their Origin and Dispersal. Mol. Phylogenet. Evol. 2006, 41, 345–354. [Google Scholar] [CrossRef] [PubMed]
- Stoffel, M.A.; Humble, E.; Paijmans, A.J.; Acevedo-Whitehouse, K.; Chilvers, B.L.; Dickerson, B.; Galimberti, F.; Gemmell, N.J.; Goldsworthy, S.D.; Nichols, H.J.; et al. Demographic Histories and Genetic Diversity across Pinnipeds Are Shaped by Human Exploitation, Ecology and Life-History. Nat. Commun. 2018, 9, 4836. [Google Scholar] [CrossRef] [PubMed] [Green Version]
- Willi, Y.; Kristensen, T.N.; Sgrò, C.M.; Weeks, A.R.; Ørsted, M.; Hoffmann, A.A. Conservation Genetics as a Management Tool: The Five Best-Supported Paradigms to Assist the Management of Threatened Species. Proc. Natl. Acad. Sci. USA 2022, 119, e2105076119. [Google Scholar] [CrossRef] [PubMed]
- Venn, O.; Turner, I.; Mathieson, I.; de Groot, N.; Bontrop, R.; McVean, G. Nonhuman Genetics. Strong Male Bias Drives Germline Mutation in Chimpanzees. Science 2014, 344, 1272–1275. [Google Scholar] [CrossRef] [PubMed] [Green Version]
- Pacifici, M.; Santini, L.; Marco, M.D.; Baisero, D.; Francucci, L.; Marasini, G.G.; Visconti, P.; Rondinini, C. Generation Length for Mammals. Nat. Conserv. 2013, 5, 89–94. [Google Scholar] [CrossRef] [Green Version]
- Mclaren, I. On the Origin of the Caspian and Baikal Seals and the Paleoclimatological Implication. Am. J. Sci. 1960, 258, 47–65. [Google Scholar] [CrossRef]
- Fisheries, N. Ringed Seal | NOAA Fisheries. Available online: https://www.fisheries.noaa.gov/species/ringed-seal (accessed on 30 January 2023).
- Clark, P.U.; Archer, D.; Pollard, D.; Blum, J.D.; Rial, J.A.; Brovkin, V.; Mix, A.C.; Pisias, N.G.; Roy, M. The Middle Pleistocene Transition: Characteristics, Mechanisms, and Implications for Long-Term Changes in Atmospheric PCO2. Crit. Quat. Stratigr. 2006, 25, 3150–3184. [Google Scholar] [CrossRef] [Green Version]
- Pisias, N.G.; Moore, T.C. The Evolution of Pleistocene Climate: A Time Series Approach. Earth Planet. Sci. Lett. 1981, 52, 450–458. [Google Scholar] [CrossRef]
- Bajo, P.; Drysdale, R.N.; Woodhead, J.D.; Hellstrom, J.C.; Hodell, D.; Ferretti, P.; Voelker, A.H.L.; Zanchetta, G.; Rodrigues, T.; Wolff, E.; et al. Persistent Influence of Obliquity on Ice Age Terminations since the Middle Pleistocene Transition. Science 2020, 367, 1235–1239. [Google Scholar] [CrossRef] [Green Version]
- Elderfield, H.; Ferretti, P.; Greaves, M.; Crowhurst, S.; McCave, I.N.; Hodell, D.; Piotrowski, A.M. Evolution of Ocean Temperature and Ice Volume Through the Mid-Pleistocene Climate Transition. Science 2012, 337, 704–709. [Google Scholar] [CrossRef]
- Clotten, C.; Stein, R.; Fahl, K.; Schreck, M.; Risebrobakken, B.; De Schepper, S. On the Causes of Arctic Sea Ice in the Warm Early Pliocene. Sci. Rep. 2019, 9, 989. [Google Scholar] [CrossRef] [Green Version]
- Dolan, A.M.; Haywood, A.M.; Hunter, S.J.; Tindall, J.C.; Dowsett, H.J.; Hill, D.J.; Pickering, S.J. Modelling the Enigmatic Late Pliocene Glacial Event—Marine Isotope Stage M2. Glob. Planet. Chang. 2015, 128, 47–60. [Google Scholar] [CrossRef] [Green Version]
- Knies, J.; Matthiessen, J.; Vogt, C.; Laberg, J.S.; Hjelstuen, B.O.; Smelror, M.; Larsen, E.; Andreassen, K.; Eidvin, T.; Vorren, T.O. The Plio-Pleistocene Glaciation of the Barents Sea–Svalbard Region: A New Model Based on Revised Chronostratigraphy. Quat. Sci. Rev. 2009, 28, 812–829. [Google Scholar] [CrossRef]
- Butt, F.A.; Elverhøi, A.; Solheim, A.; Forsberg, C. Deciphering Late Cenozoic Development of the Western Svalbard Margin from ODP Site 986 Results. Mar. Geol. 2000, 169, 373–390. [Google Scholar] [CrossRef]
- Sejrup, H.P.; Hjelstuen, B.O.; Torbjørn Dahlgren, K.I.; Haflidason, H.; Kuijpers, A.; Nygård, A.; Praeg, D.; Stoker, M.S.; Vorren, T.O. Pleistocene Glacial History of the NW European Continental Margin. Mar. Pet. Geol. 2005, 22, 1111–1129. [Google Scholar] [CrossRef]
- Solheim, A.; Faleide, J.I.; Andersen, E.S.; Elverhøi, A.; Forsberg, C.F.; Vanneste, K.; Uenzelmann-neben, G.; Channell, J.E.T. Late cenozoic seismic stratigraphy and glacial geological development of the east greenland and svalbard–barents sea continental margins. Quat. Sci. Rev. 1998, 17, 155–184. [Google Scholar] [CrossRef]
- Solheim, A.; Andersen, E.S.; Elverhøi, A.; Fiedler, A. Late Cenozoic Depositional History of the Western Svalbard Continental Shelf, Controlled by Subsidence and Climate. Glob. Planet. Chang. 1996, 12, 135–148. [Google Scholar] [CrossRef]
- Björck, S. A Review of the History of the Baltic Sea, 13.0-8.0 Ka BP. Quat. Int. 1995, 27, 19–40. [Google Scholar] [CrossRef]
- Tokarev, I.V.; Borodulina, G.S.; Subetto, D.A.; Voronyuk, G.Y.; Zobkov, M.B. Fingerprint of the Geographic and Climate Evolution of the Baltic–White Sea Region in the Late Pleistocene-Holocene in Groundwater Stable Isotopes (2H, 18O). Quat. Int. 2019, 524, 76–85. [Google Scholar] [CrossRef]
- Näslund, J.-O.; Moren, L.; Bogren, J.; Gustavsson, T.; Moberg, A.; Alexandersson, H.; Jansson, P.; Whitehouse, P.; Hartikainen, J.; Wallroth, T.; et al. Climate and Climate Related Issues for the Safety Assessment SR-Can; Svensk Kärnbränslehantering AB: Stockholm, Sweden, 2006. [Google Scholar]
- Krinner, G.; Mangerud, J.; Jakobsson, M.; Crucifix, M.; Ritz, C.; Svendsen, J.I. Enhanced Ice Sheet Growth in Eurasia Owing to Adjacent Ice-Dammed Lakes. Nature 2004, 427, 429–432. [Google Scholar] [CrossRef]
- Dahl-Jensen, D.; Albert, M.R.; Aldahan, A.; Azuma, N.; Balslev-Clausen, D.; Baumgartner, M.; Berggren, A.-M.; Bigler, M.; Binder, T.; Blunier, T.; et al. Eemian Interglacial Reconstructed from a Greenland Folded Ice Core. Nature 2013, 493, 489–494. [Google Scholar] [CrossRef] [Green Version]
- Lambeck, K.; Nakada, M. Constraints on the Age and Duration of the Last Interglacial Period and on Sea-Level Variations. Nature 1992, 357, 125–128. [Google Scholar] [CrossRef]
- Severinghaus, J.P.; Brook, E.J. Abrupt Climate Change at the End of the Last Glacial Period Inferred from Trapped Air in Polar Ice. Science 1999, 286, 930–934. [Google Scholar] [CrossRef] [PubMed] [Green Version]


| Baikal Seal (PSIB) | Gray Seal (HGRY) | Spotted Seal (PLAR) | Harbor Seal (PVIT) | |
|---|---|---|---|---|
| IUCN Red List Category 1 | LC | LC | LC | LC |
| Gender | male | male | female | female |
| Assembly source | DNAzoo | DNAzoo | DNAzoo | DNAzoo |
| Assembly accession/reference | - | Halichoerus_grypus_HiC | Phoca_largha_HiC | GSC_HSeal_1.0_HiC |
| Sequencing/assembly approach | MP + HiC | Overlapping PE + HiC | Overlapping PE + HiC | Linked reads + HiC |
| 2n | 32 | 32 | 32 | 32 |
| C-scaffolds | 16 | 16 | 16 | 16 |
| Scaffold N50, Mbp | 151.5 | 141.6 | 142.1 | 152 |
| Number of scaffolds | 146,408 | 388,387 | 249,399 | 5311 |
| Total genome length, Gbp | 2.35 | 2.4 | 2.36 | 2.36 |
| C-scaffolds length, Gbp | 2.29 | 2.16 | 2.16 | 2.32 |
| Species/BUSCOs | Complete Single-Copy | Complete Duplicated | Fragmented | Missing |
|---|---|---|---|---|
| P. sibirica | 7981 (86.5%) | 140 (1.5%) | 444 (4.8%) | 661 (7.2%) |
| H. grypus | 8352 (90.5%) | 190 (2.1%) | 242 (2.6%) | 442 (4.8%) |
| Ph. largha | 8434 (91.4%) | 178 (1.9%) | 215 (2.3%) | 399 (4.4%) |
| Ph. vitulina | 8651 (93.8%) | 198 (2.1%) | 90 (1.0%) | 287 (3.1%) |
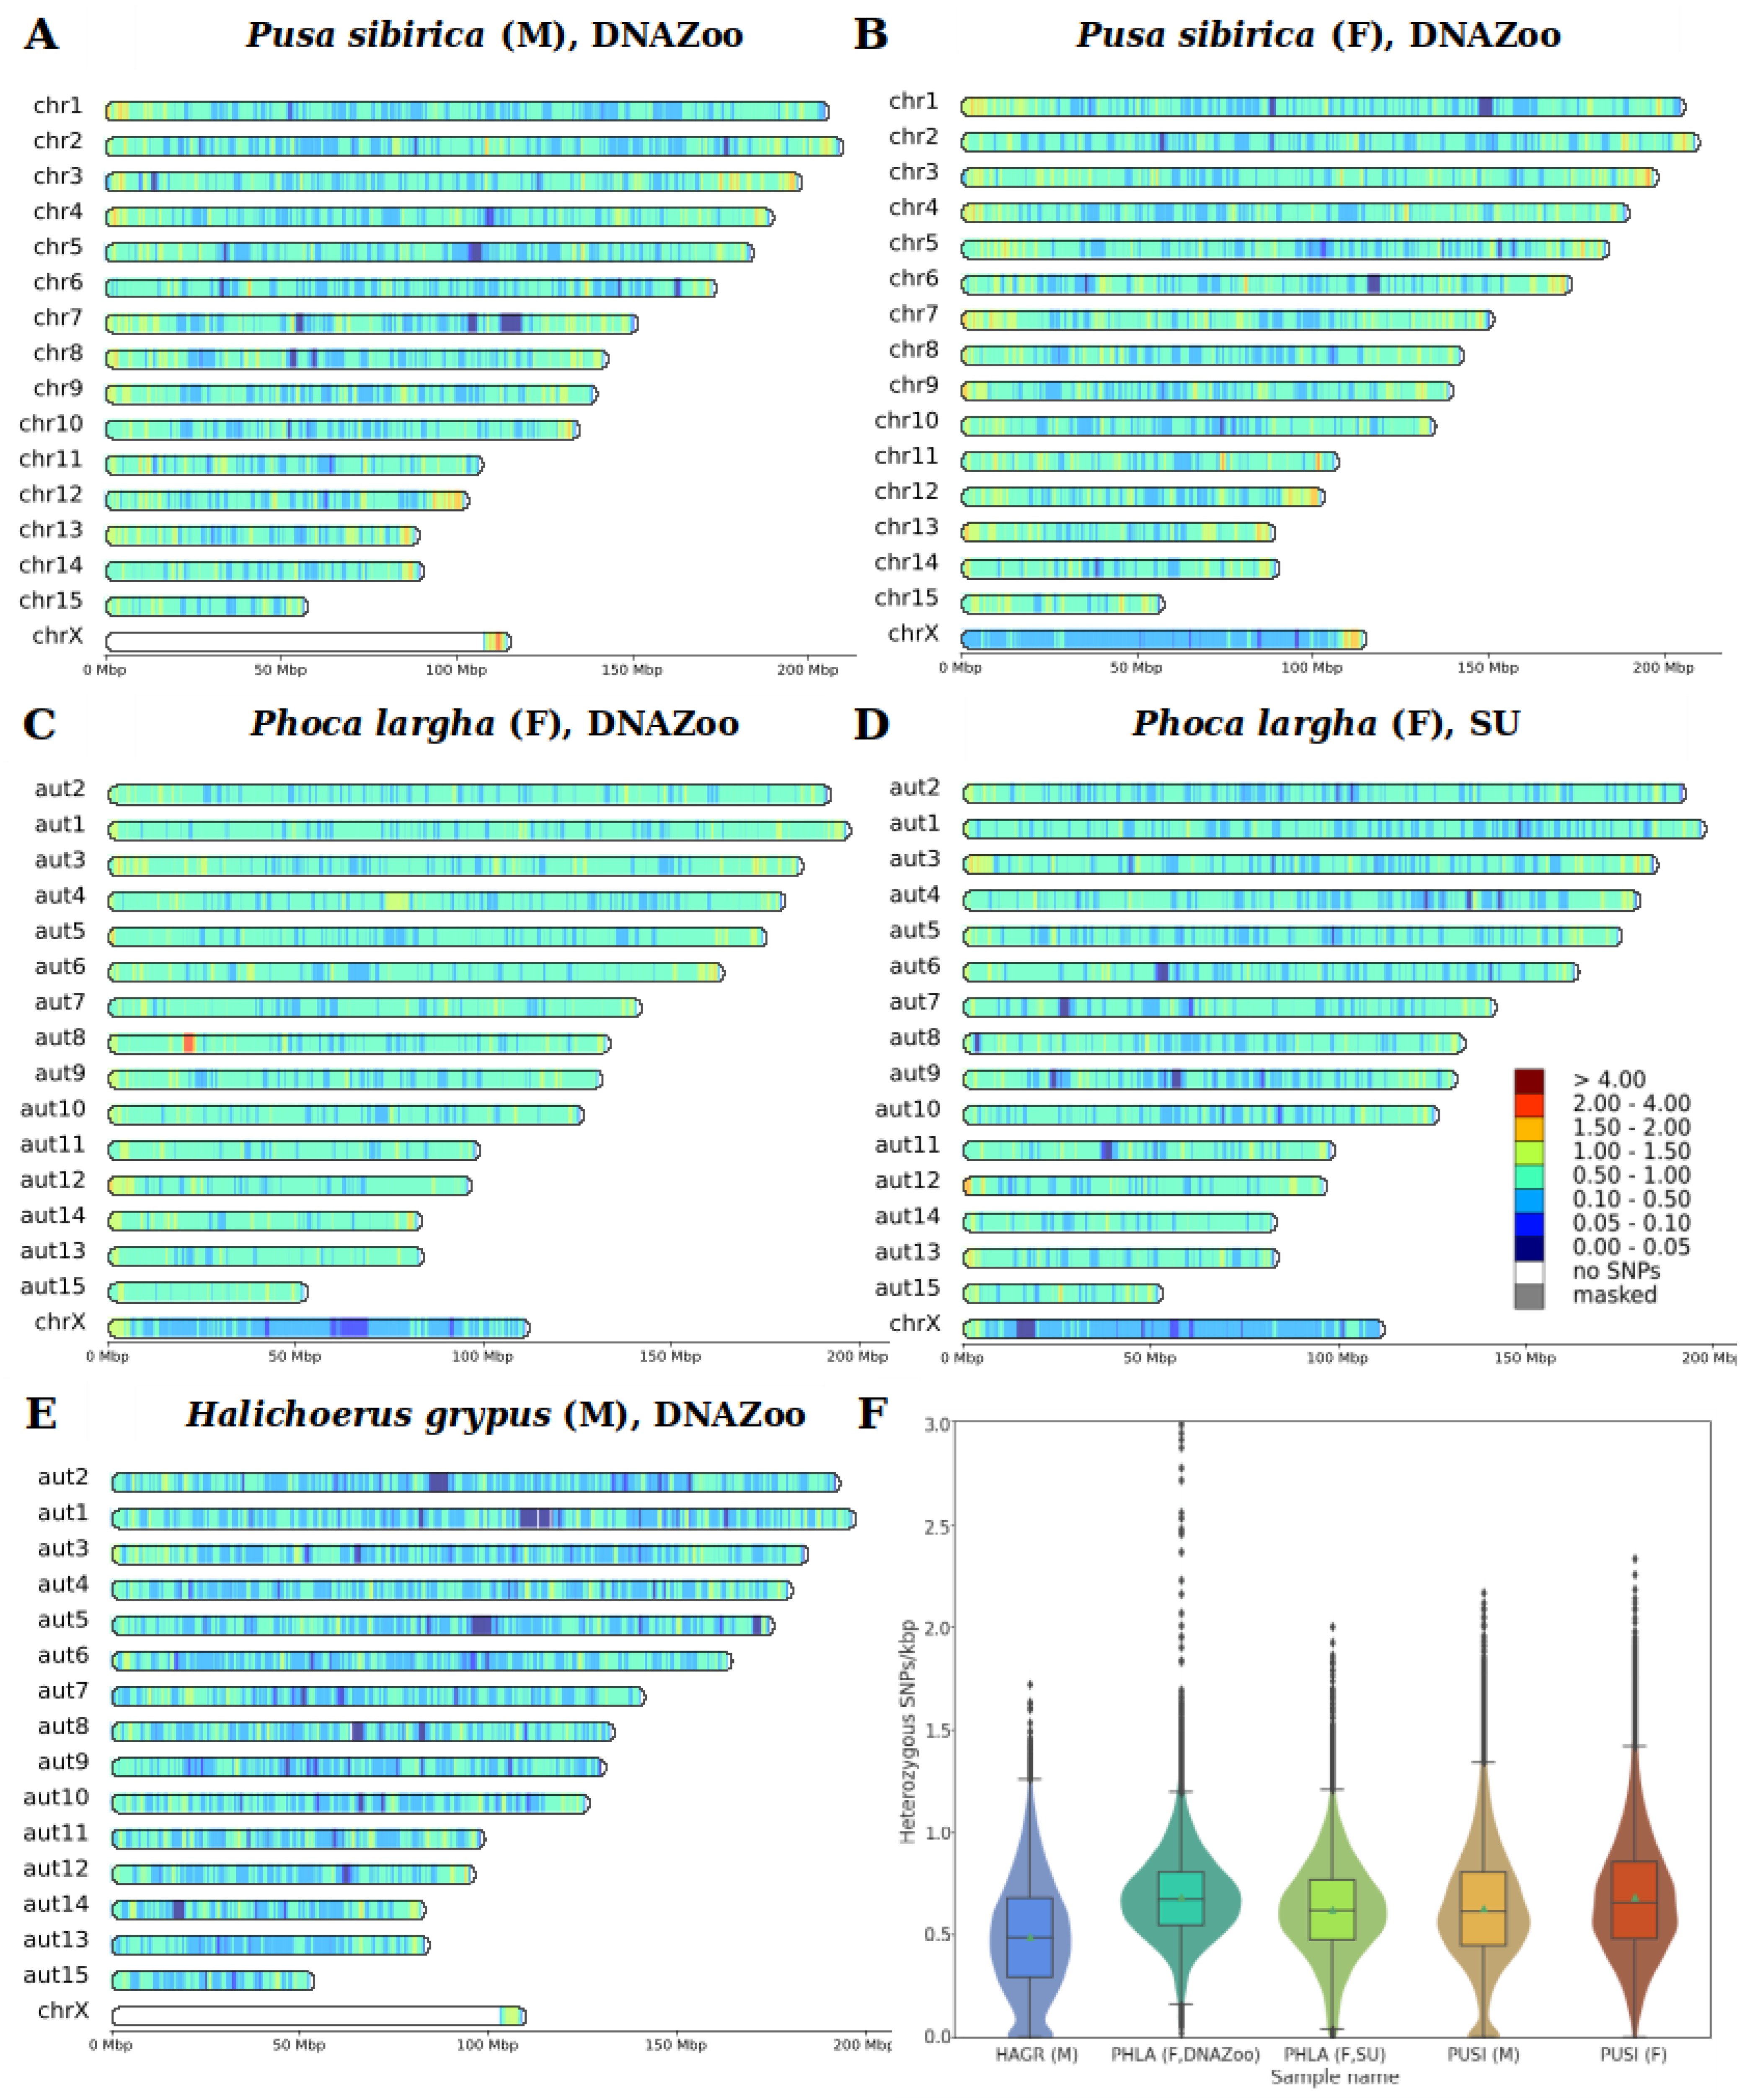
| Species | Min | Median | Mean | Mode | Max |
|---|---|---|---|---|---|
| H. grypus, male | 0 | 0.48 | 0.49 | 0.48 1 | 1.72 |
| Ph. largha, female (DNAZoo) | 0 | 0.67 | 0.68 | 0.66 | 3.23 |
| Ph. largha, female (Seoul University) | 0 | 0.62 | 0.62 | 0.60 | 2 |
| P. sibirica, male | 0 | 0.61 | 0.63 | 0.56 1 | 2.17 |
| P. sibirica, female | 0 | 0.66 | 0.68 | 0.56 | 2.34 |
Disclaimer/Publisher’s Note: The statements, opinions and data contained in all publications are solely those of the individual author(s) and contributor(s) and not of MDPI and/or the editor(s). MDPI and/or the editor(s) disclaim responsibility for any injury to people or property resulting from any ideas, methods, instructions or products referred to in the content. |
© 2023 by the authors. Licensee MDPI, Basel, Switzerland. This article is an open access article distributed under the terms and conditions of the Creative Commons Attribution (CC BY) license (https://creativecommons.org/licenses/by/4.0/).
Share and Cite
Yakupova, A.; Tomarovsky, A.; Totikov, A.; Beklemisheva, V.; Logacheva, M.; Perelman, P.L.; Komissarov, A.; Dobrynin, P.; Krasheninnikova, K.; Tamazian, G.; et al. Chromosome-Length Assembly of the Baikal Seal (Pusa sibirica) Genome Reveals a Historically Large Population Prior to Isolation in Lake Baikal. Genes 2023, 14, 619. https://doi.org/10.3390/genes14030619
Yakupova A, Tomarovsky A, Totikov A, Beklemisheva V, Logacheva M, Perelman PL, Komissarov A, Dobrynin P, Krasheninnikova K, Tamazian G, et al. Chromosome-Length Assembly of the Baikal Seal (Pusa sibirica) Genome Reveals a Historically Large Population Prior to Isolation in Lake Baikal. Genes. 2023; 14(3):619. https://doi.org/10.3390/genes14030619
Chicago/Turabian StyleYakupova, Aliya, Andrey Tomarovsky, Azamat Totikov, Violetta Beklemisheva, Maria Logacheva, Polina L. Perelman, Aleksey Komissarov, Pavel Dobrynin, Ksenia Krasheninnikova, Gaik Tamazian, and et al. 2023. "Chromosome-Length Assembly of the Baikal Seal (Pusa sibirica) Genome Reveals a Historically Large Population Prior to Isolation in Lake Baikal" Genes 14, no. 3: 619. https://doi.org/10.3390/genes14030619