1. Introduction
The studies on the neurological mechanisms of aggression along with the depression state attract specific attention in psychiatry. Aggression is coupled with an addiction-like state associated with a withdrawal (deprivation) phenomenon [
1,
2,
3,
4].
Alternative splicing (AS) has been proven to be the most abundant in the brain [
5], which features the largest arsenal of neurospecific splicing factors that influence thousands of AS exons in neurospecific genes, accommodating or abrogating their inclusion into the processed transcript [
5]. Consequently, many AS-mediated diseases associated with nervous tissues are reported, including spinal muscular atrophy (SMA), resulting from
Smn2 missplicing [
5]; autism spectral disorder (ASD), determined by a low expression of
nSR100 (
Srrm4) splicing factor; and many others [
5].
The dorsal striatum (DS) controls the motor activity and stereotypical behaviors. It is also involved in cognitive, reward, and social hierarchy maintenance and learning [
6]. In particular, the DS is proven to supervise the consolidation of the new response to learning process [
6]. Hence, this brain region is inherently involved in addictive, depressive, and aggressive behaviors [
7,
8] when regularly exposed to a stressful environment or substance abuse.
The major body of the DS comprises GABAergic medium spiny neurons (MSNs), acting synchronously in the response to phasic dopamine [
9]. In particular, we have earlier used RNA-seq transcriptome data sampled from the DS of mice in experiments with chronic social conflicts and showed distinct coordinately expressed gene cluster profiles corresponding to D1- and D2-MSNs in different phases [
4,
10]. The major mechanism of MSN cellular signal processing is the cAMP-mediated (de)phosphorylation signaling cascades incorporating multiple phosphoproteins [
7,
11,
12]. We may name the range of alternatively spliced genes, such as
Darpp-32,
Grin1,
Ptpn5,
Ppp3ca,
Pde10a,
Prkaca,
Adora1, etc., maintaining cAMP cascade pathways in the DS, previously reported [
10] (Figure 5 therein).
Notably, phosphorylation signaling and AS are interconnected, in particular, in the cAMP-related cascades [
13]. Namely, the activity of both the core spliceosomal components and accessory splicing factors is modulated by their reversible phosphorylation [
14]. In turn, the subunits of protein kinases and phosphatases themselves undergo extensive AS at a transcript processing level followed by (de)phosphorylation markup, rendering the highly tuned interaction of both processes in phosphorylation-mediated signal transduction cascades [
15].
Another factor affecting AS at the transcriptional level is the chromatin environment of a gene. Both the histone acetylation/methylation marks and 3D chromatin architecture of the gene region affect the splicing outcome, in particular, in neurons [
16]. For example, one of the key neuronal genes,
Cacna1b, mediates its exon inclusion by a
ctcf factor bound in its vicinity [
17]. Note that
ctcf mediates chromatin conformation and thus changes the splicing pattern [
18]. The
PolII transcription rate is greatly affected by the chromatin environment following the
PolII-coupled splicing decisions [
19].
AS in mammals is mostly manifested by the genes of neurons along with muscle-specific genes, but to a lesser extent [
20]. A range of AS events manifested by exon skipping/insertion leads to the premature emergence of a stop codon [
21] and is subject to nonsense-mediated decay (NMD) [
22], serving as an additional means of the prompt expression abrogation upon the local compartment dynamics of protein turnover. It is employed in the maintenance of homeostasis of multicomponent complex subunits, such as the ribosome, spliceosome, and chromatin remodeling machinery specifically in the brain cells, where NMD regulatory splicing events were prevalent [
23].
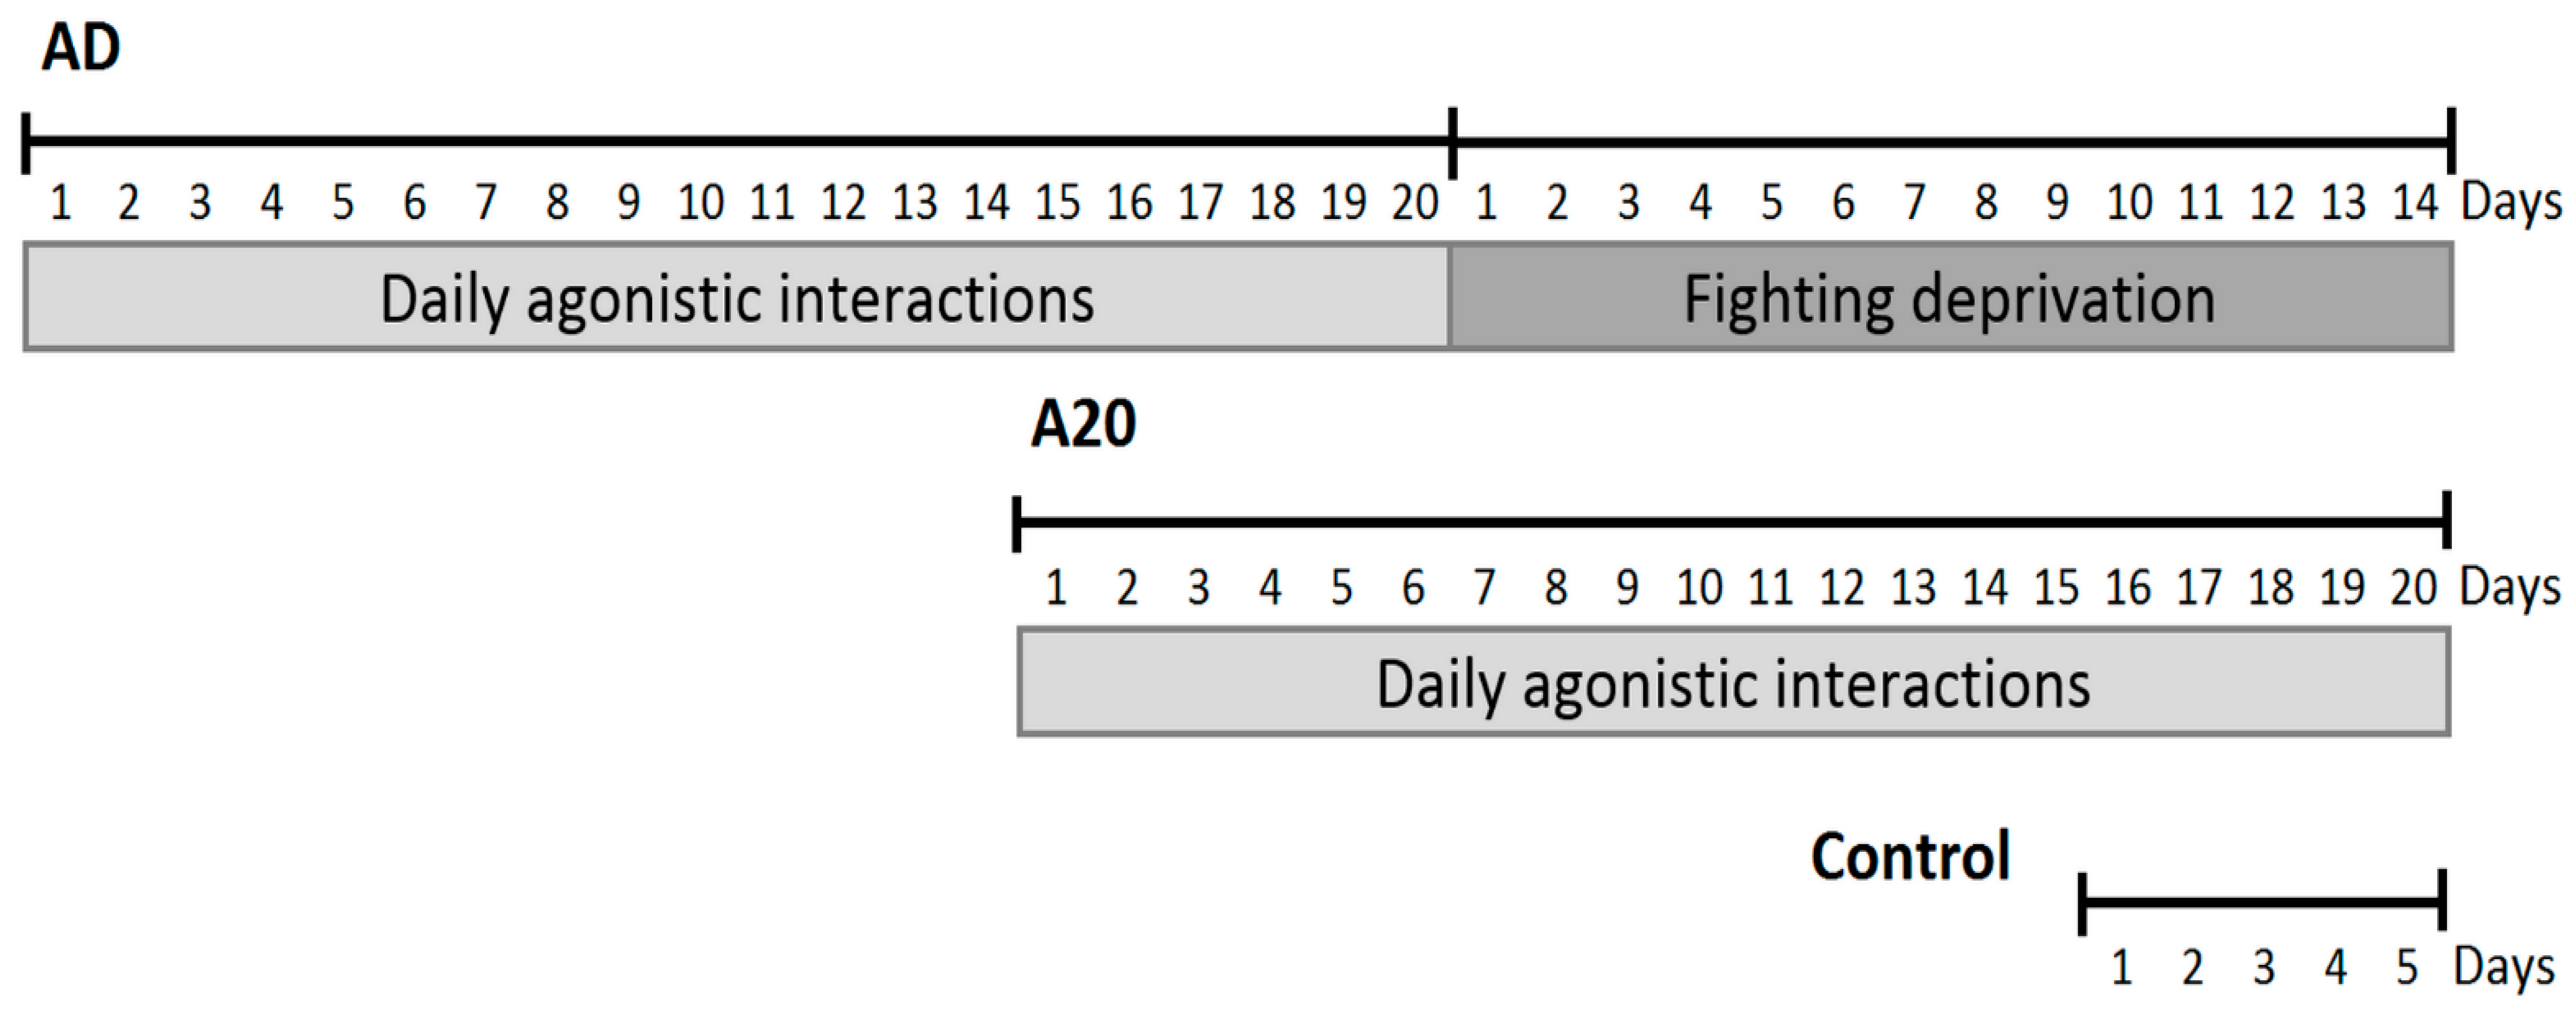
Using the same data on the social conflict model of repeated aggression-exposed mice with positive (winning) experience (A20), consequent aggression deprived (AD) mice, and control groups (see Methods), we recently assessed the differentially expressed genes (DEGs [
4]) emphasizing the expression profile specifics of each group. The unexpected straight outcome of the study shows that while the A20 group differed from the control by over 1000 DEGs, the AD group (14 days of deprivation span after A20 group protocol) expression profile was quite similar to that of the control (62 DEGs [
4]). The control vs. AD group DEGs manifested an expression network of the circadian rhythm genes that significantly deviated from the control in both the A20 and AD groups.
The ultimate goal of this work was to assess the differentially alternatively spliced (DAS) genes in the involved groups and to gain an insight into the overall AS-mediated transcriptional diversity landscape features within the DS with outlining of the major AS-enriched gene networks.
3. Results
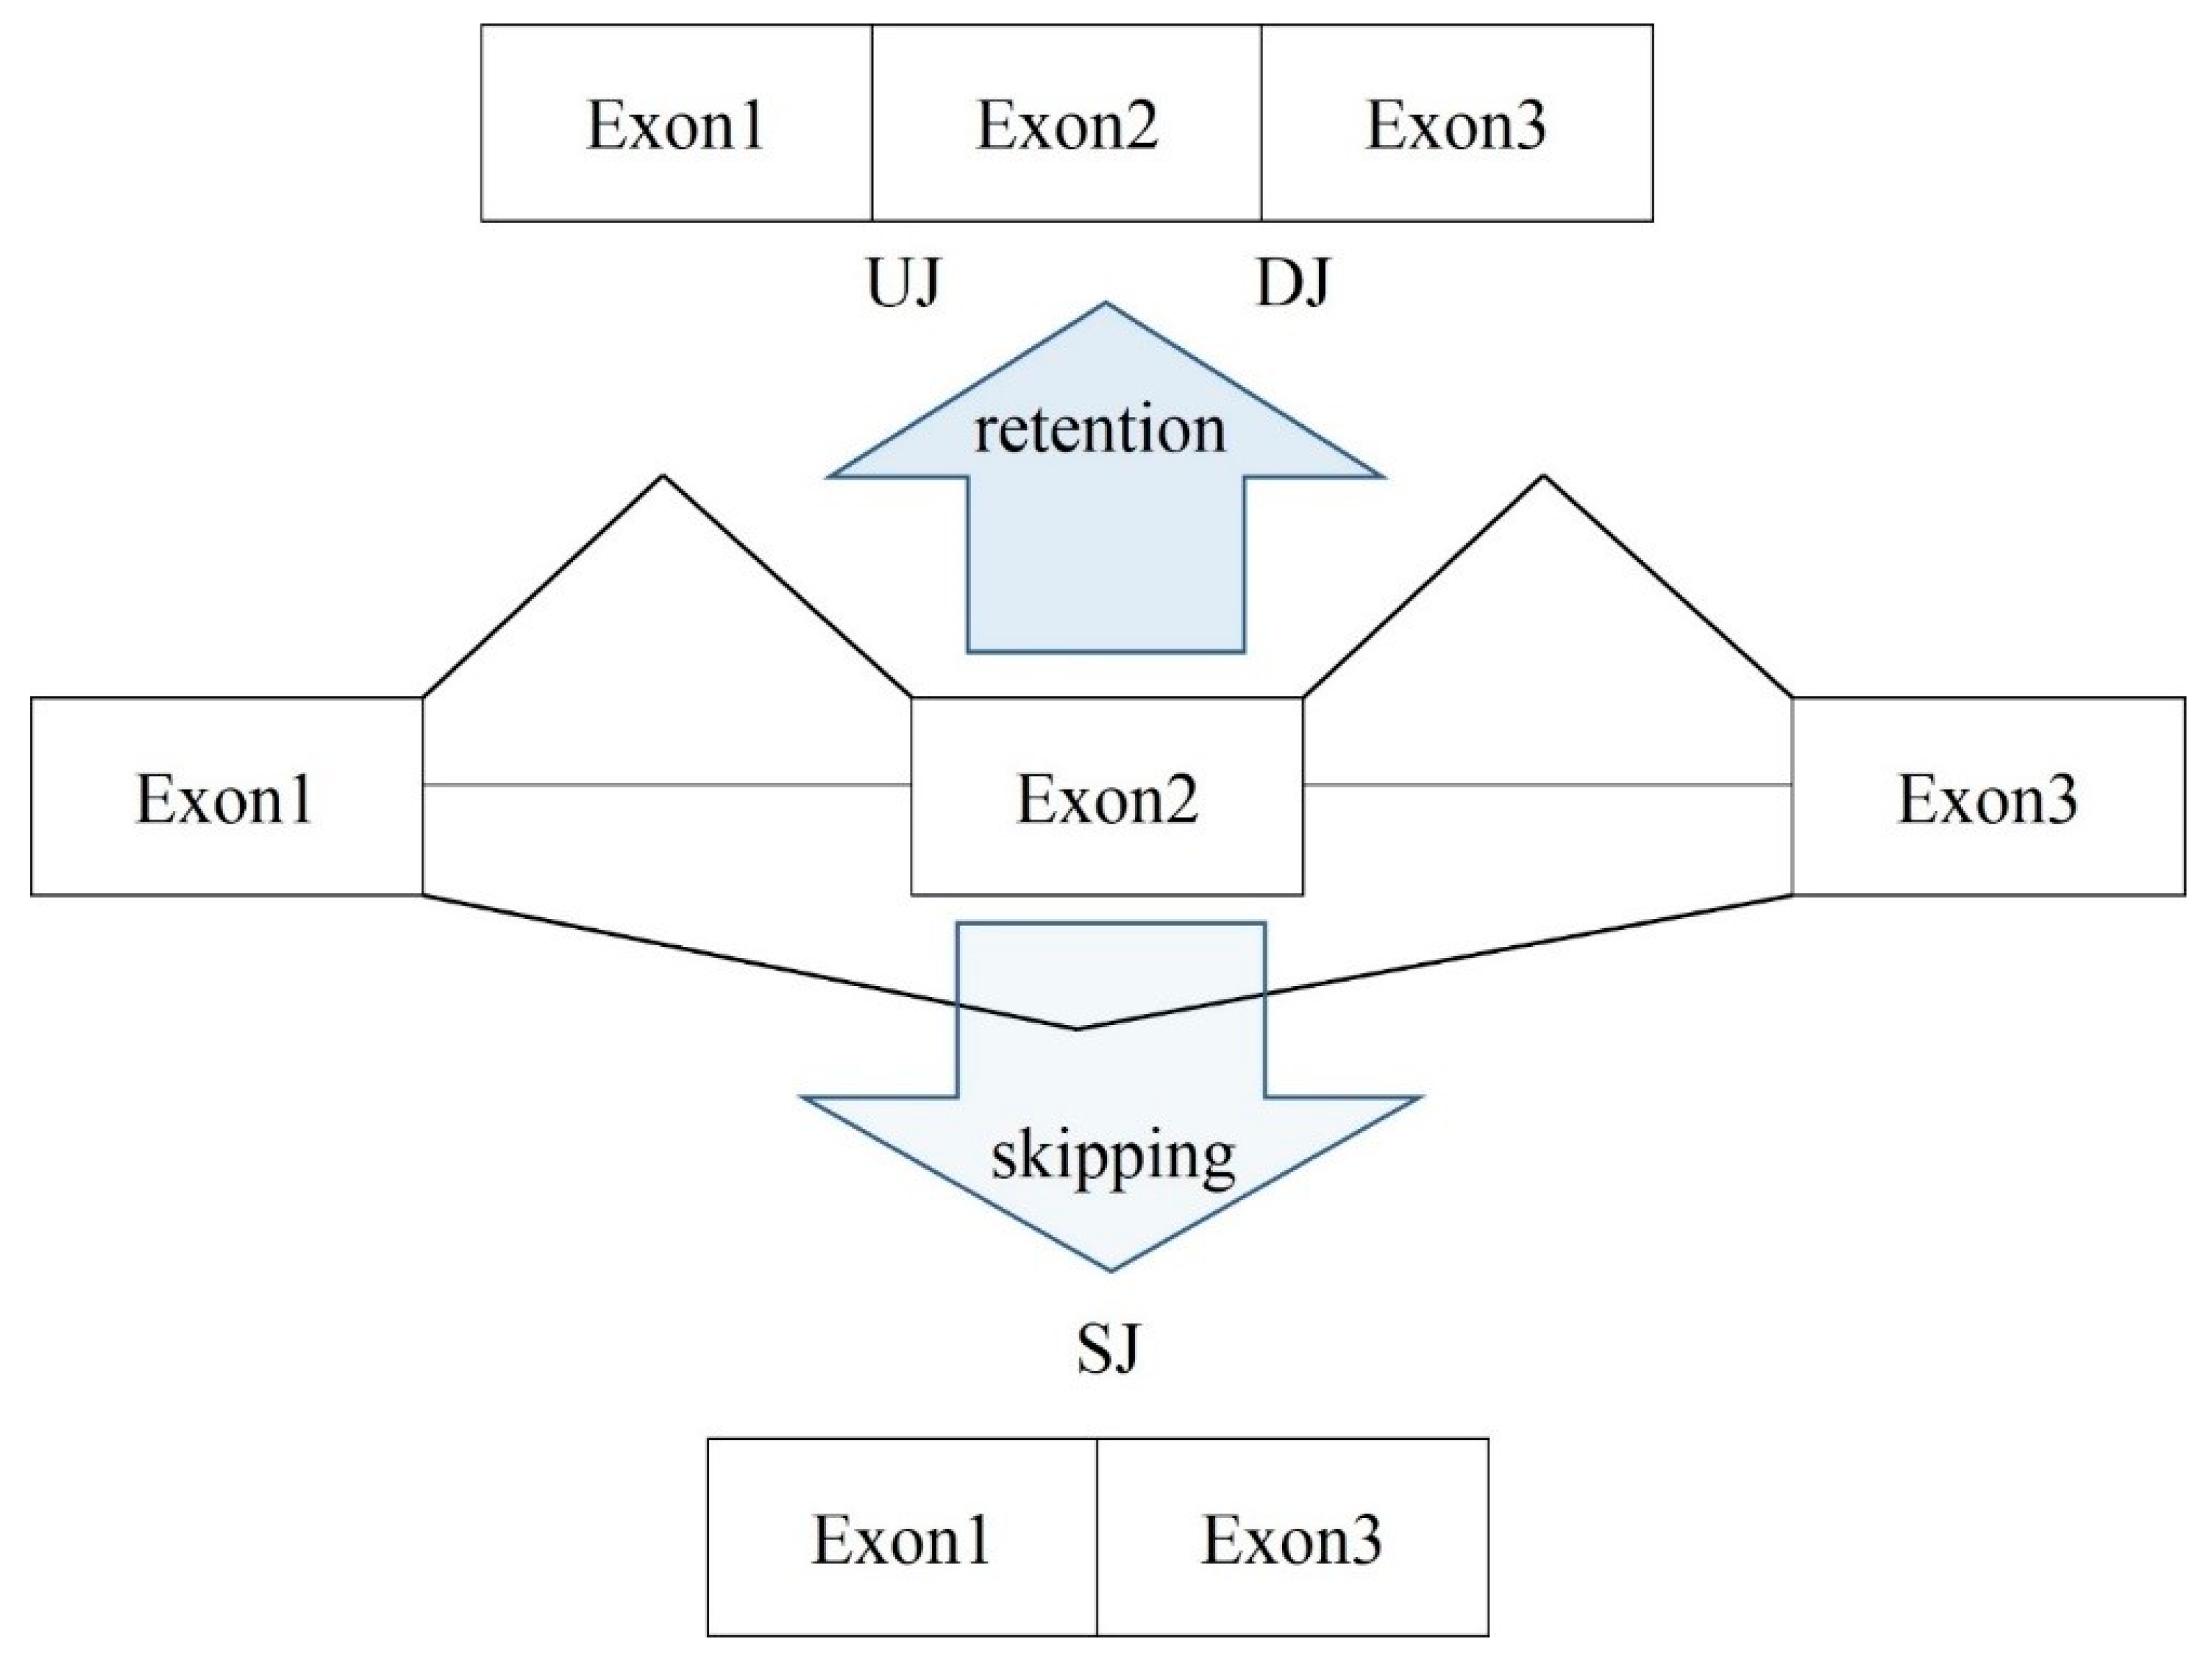
After identifying the AS exon skipping (ES) events in RNA-seq data with rMATs software [
33], we revealed that the assayed DS samples contained somewhat equal number of the total ES events, which was around 7000 (
Table 1). Along with the ES events, there were approximately 3700 alternative 5′/3′ exon boundaries and 420–450 mutually exclusive ES events (MXEs), depending on the sample. Note that the alteration of 5′/3′ exon boundaries was the major source of the poison exons (with a shifted coding frame) that emerged in our data. The vast majority of them was quite rare (one to three ES events per sample) and were filtered out in the further analysis if the total ES instances (number of confirmed overlapping junction reads;
Figure 2) were less than 10 across the set of total samples.
All identified ES events were checked up against the annotated ones in the
knownAlt table of mm10 genome database (
https://hgdownload.soe.ucsc.edu/goldenPath/mm10/database/knownAlt.txt.gz (assessed on 15 November 2021). This revealed an excellent consistency of the annotated exons: only 14–17 exons of each comparison (comprising in total approximately 7000;
Table 1) were not annotated as the ‘
cassetteExon’ class in ‘
knownAlt’ table (genome.ucsc.edu) for each pairwise comparison.
We assigned the statistically significant DAS ES events with an FDR < 0.11 threshold in three pairwise comparisons of the groups by means of rMATs software (
Table S2a). More than a third of DAS ES events proved to be outside of the coding part (5′/3′UTR,
Table S2a). Further on, we separately assessed both the overall DAS events (see the statistics in
Table 1, first column, and the full info on DAS genes in
Table S2) and the ones that resided in CDS only (
Table 1, third column), and annotated by the corresponding ENSEMBL protein IDs (
Table S3a).
3.1. Annotation of DAS ES Genes
We then proceeded with the GO annotation in each group.
Table S2b–d contains three corresponding GO annotations for three pairwise comparisons.
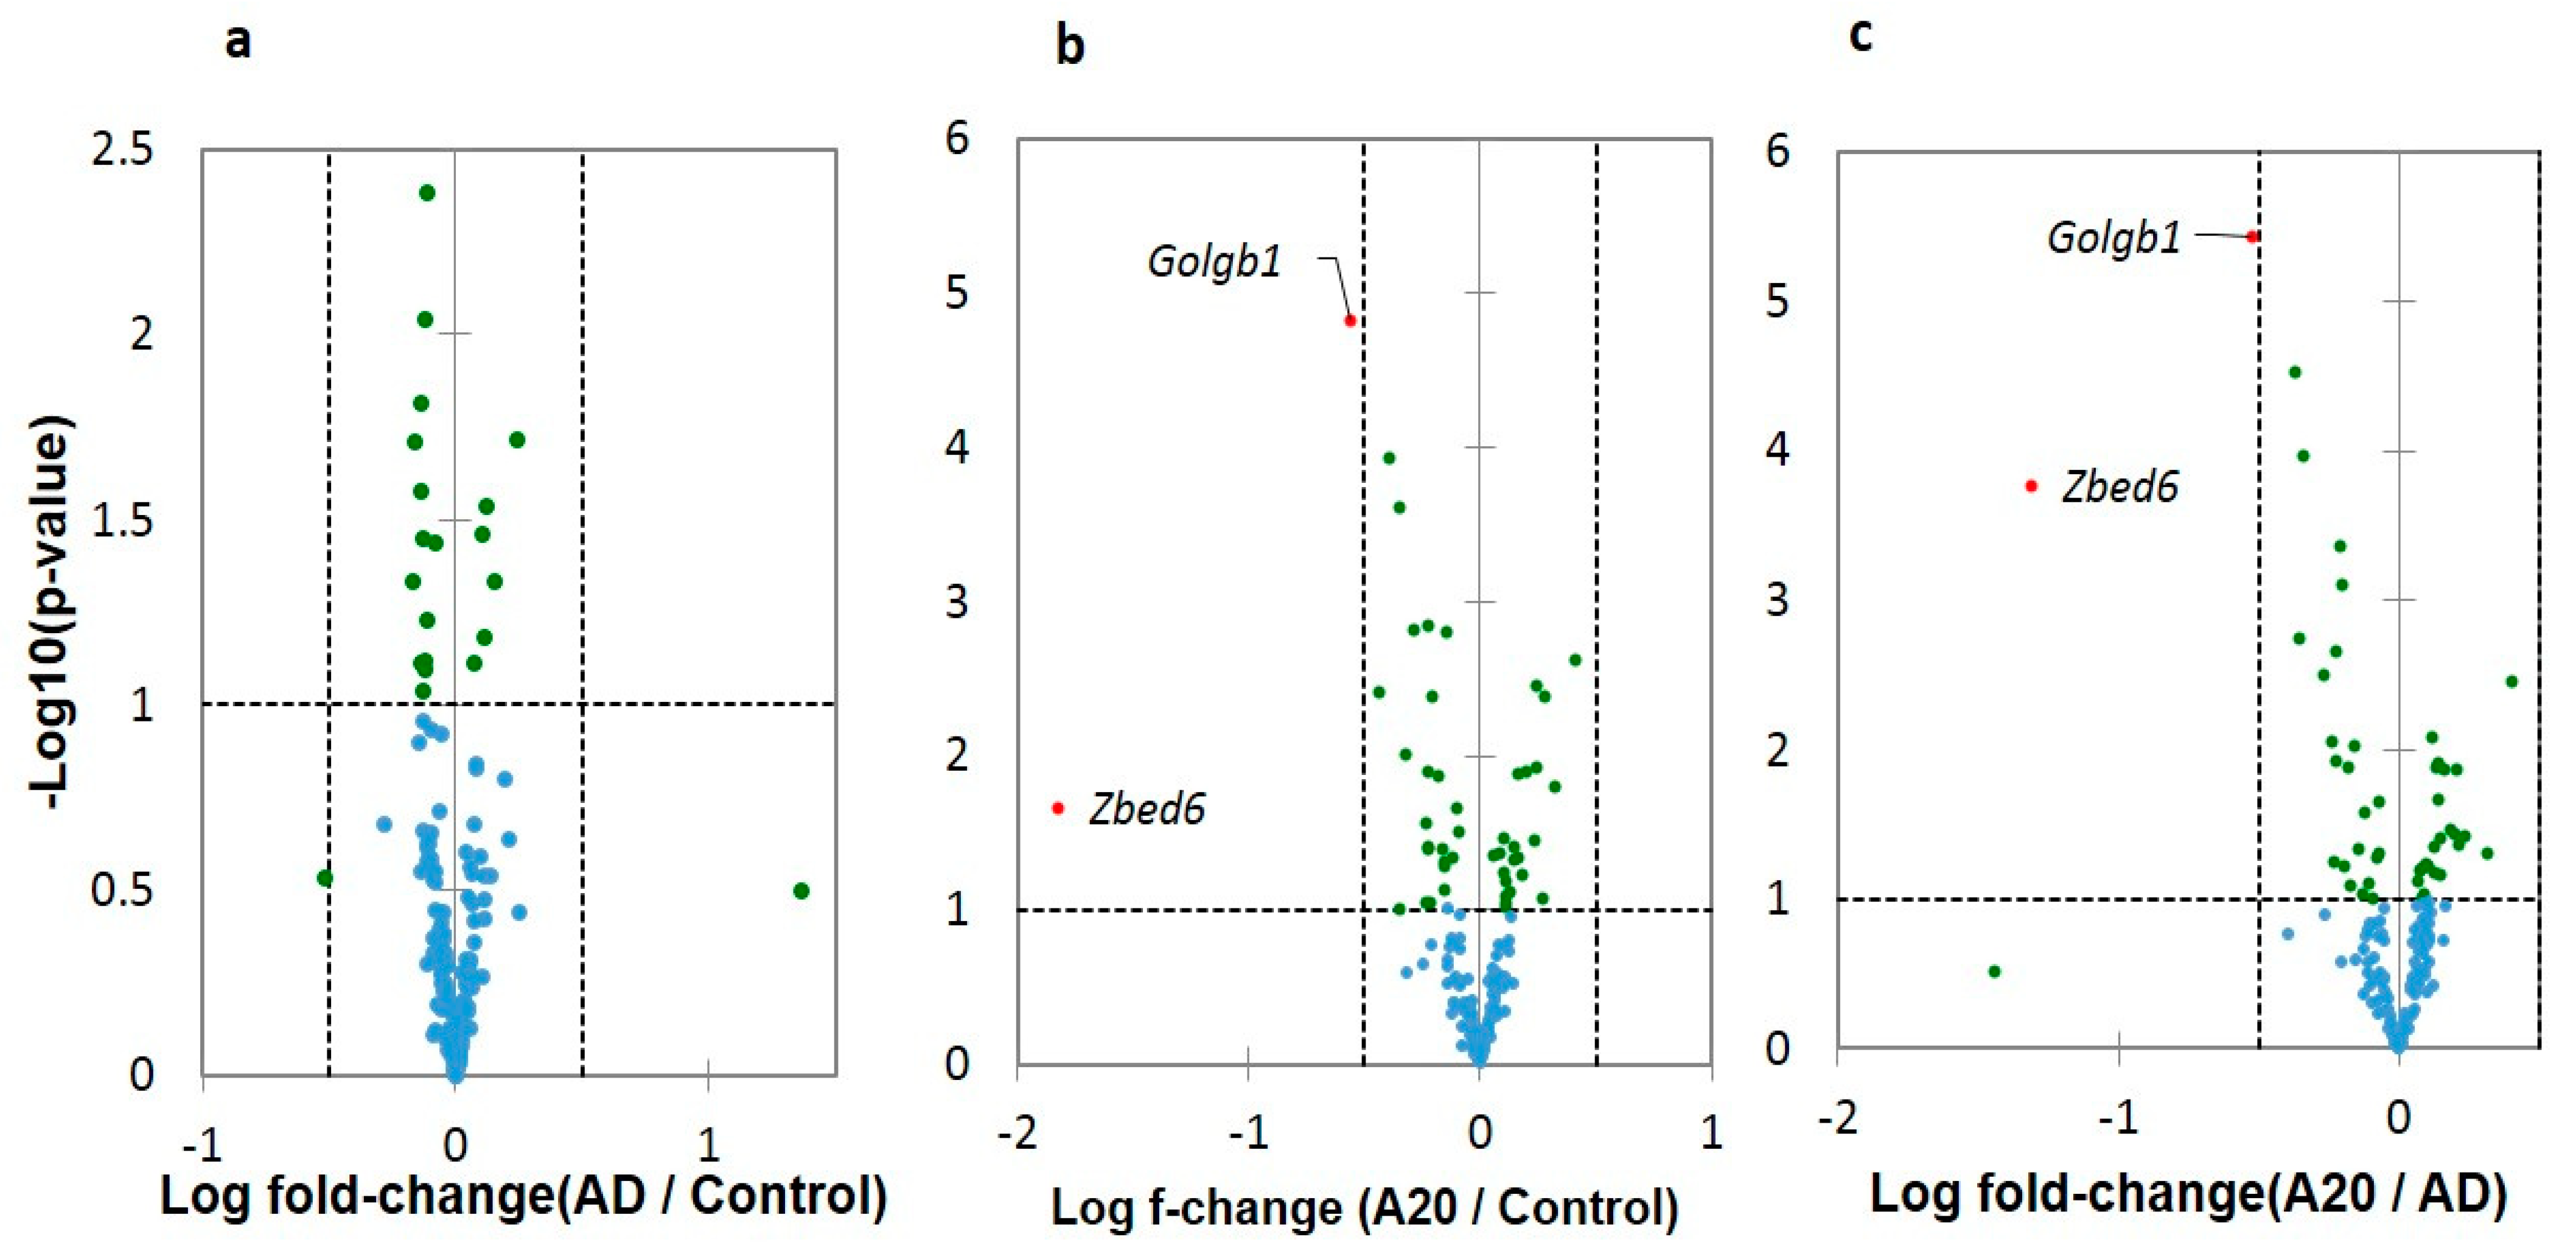
We checked for the differential expression of three DAS ES genes by pairwise comparisons using Volcano plots (
Figure 4). As is evident, the vast majority of DAS ES genes do not essentially differ in a log fold change, while a distinct and significant isoform ratio is observed (
Table S2a). Two DAS DEGs shown in
Figure 4 relate to the overall metabolism intensity.
Zbed6 DEG is involved in the mRNA export from nucleus (GO: 0006406), and
Golgb1 in Golgi maintenance, including protein transport (GO: CL:21133). Both genes co-vary (
R = 0.745; df = 17;
p < 0.001) and their downturn specifically in A20 may reflect metabolism alteration [
4] (Figure 10 therein).
Zbed6 further proved to be a single exon gene located within the intron of
Zc3h11a, thus was not suitable for further analysis as a DAS gene.
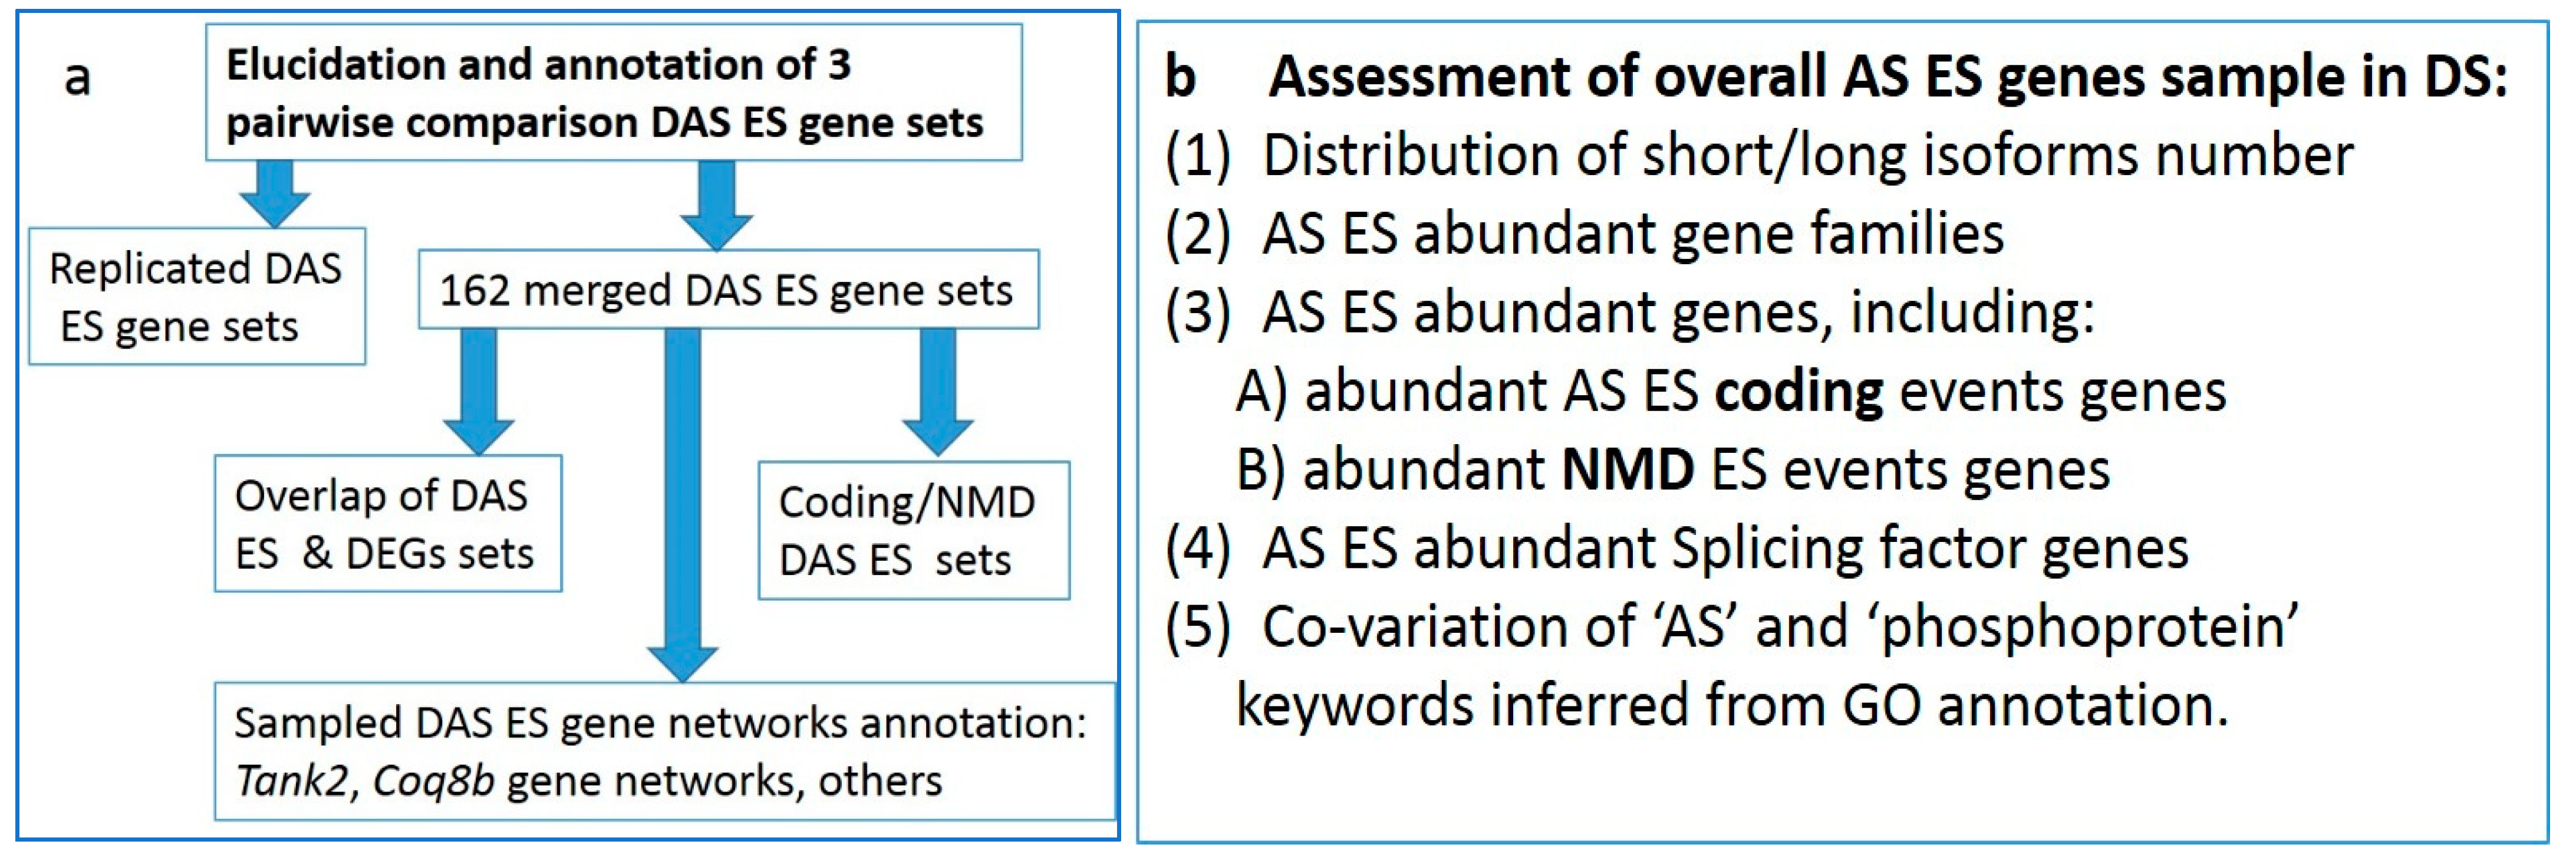
3.2. The 163 Merged DAS Genes
3.2.1. GO Annotation
We performed a GO annotation for the DAS genes in each comparison (
Figure 4). While separate pairwise GO annotations yielded no essential results (
Tables S2b–d), we compiled a list of merged DAS genes (163 unique entries) from all comparisons and annotated it (
Table S2e). Herein, we report on several selected GO categories shown in
Figure 5 (see full annotation in
Table S2f).
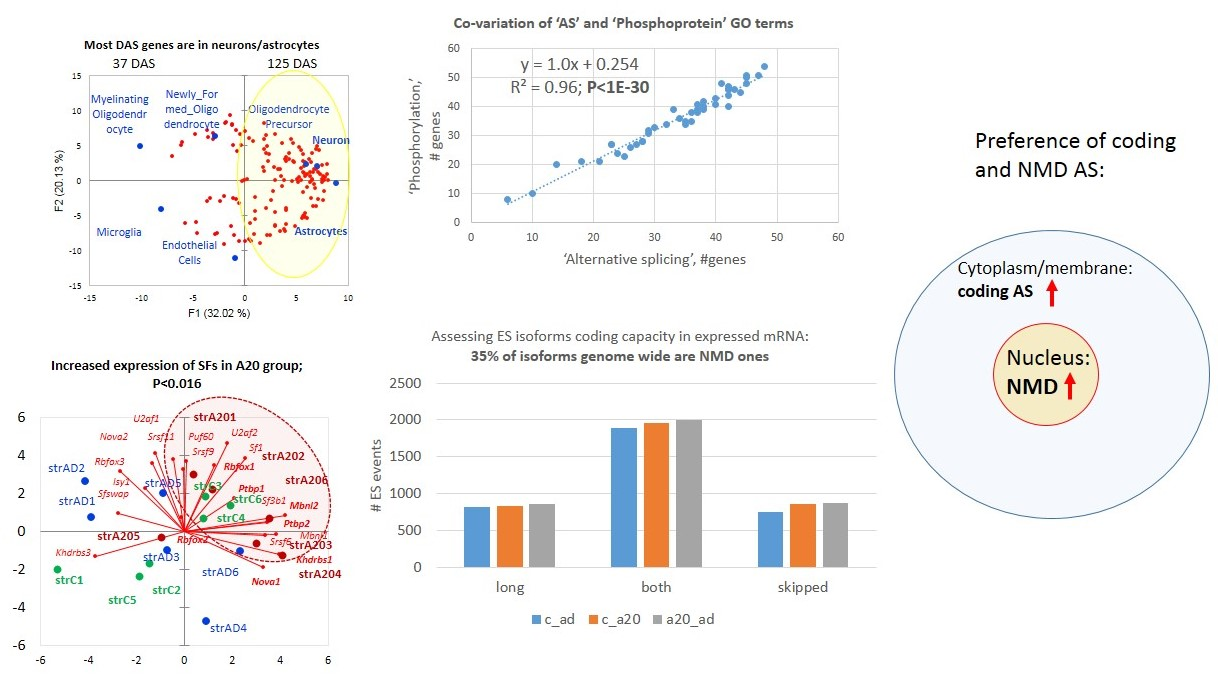
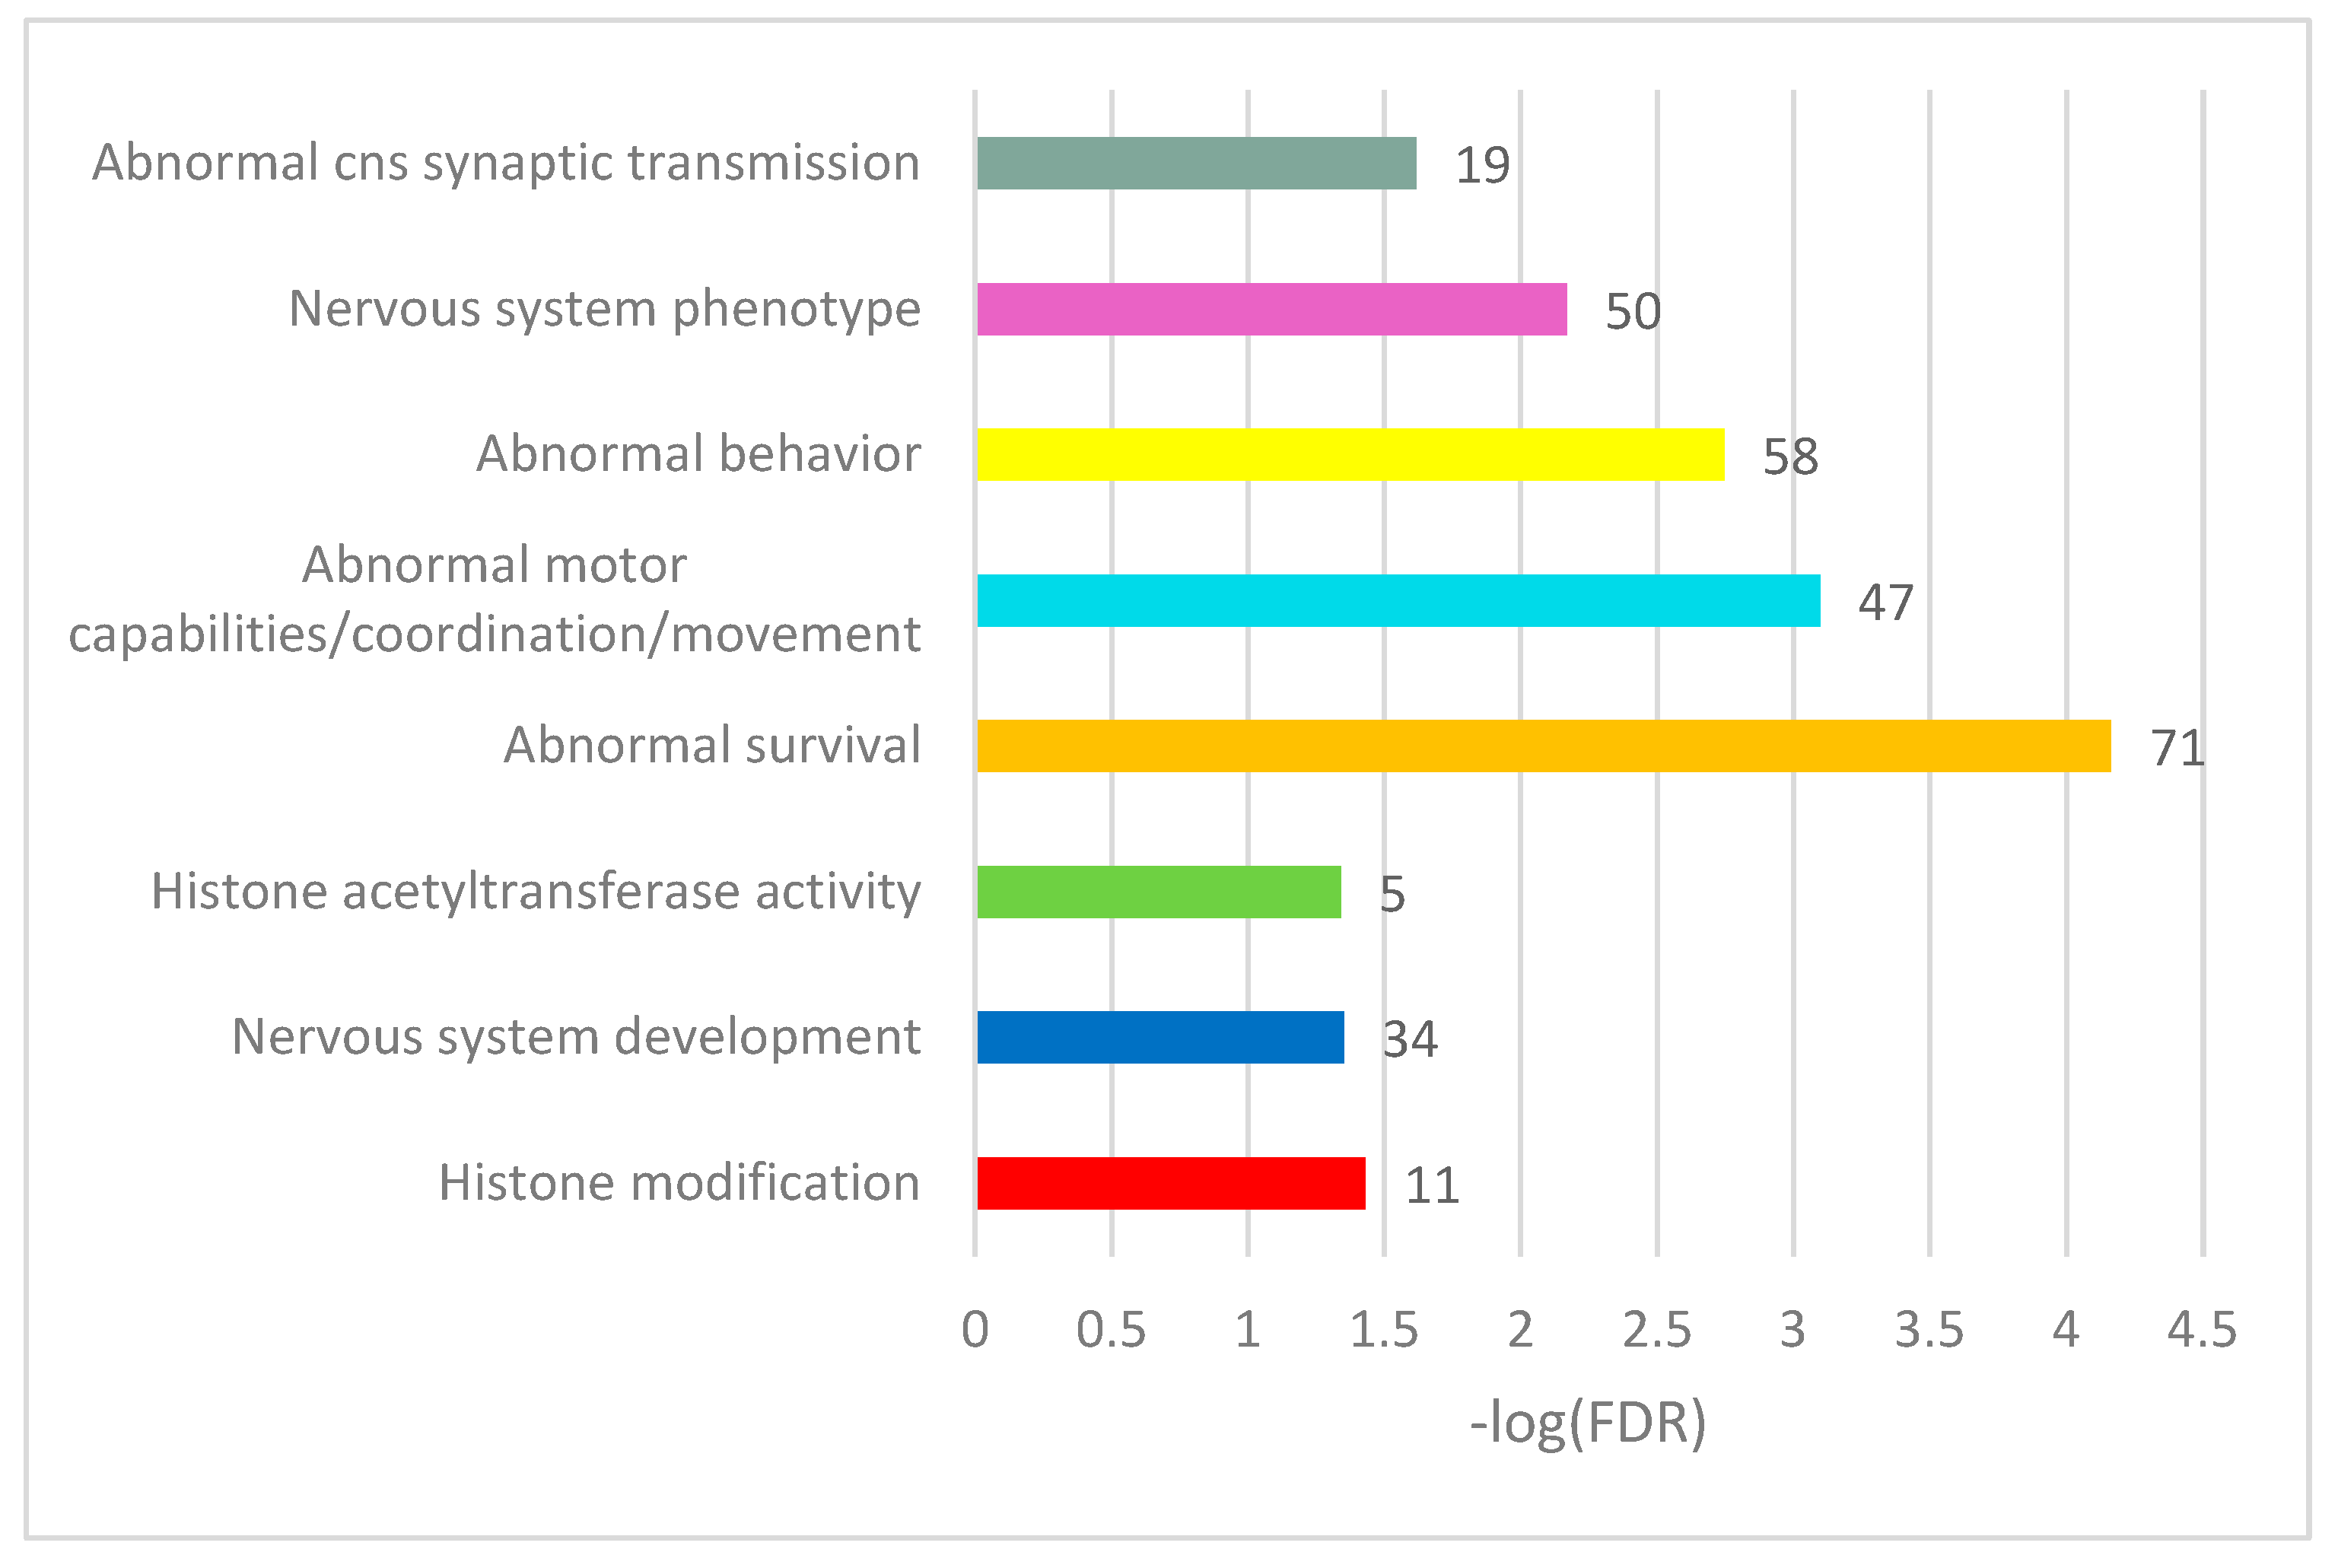
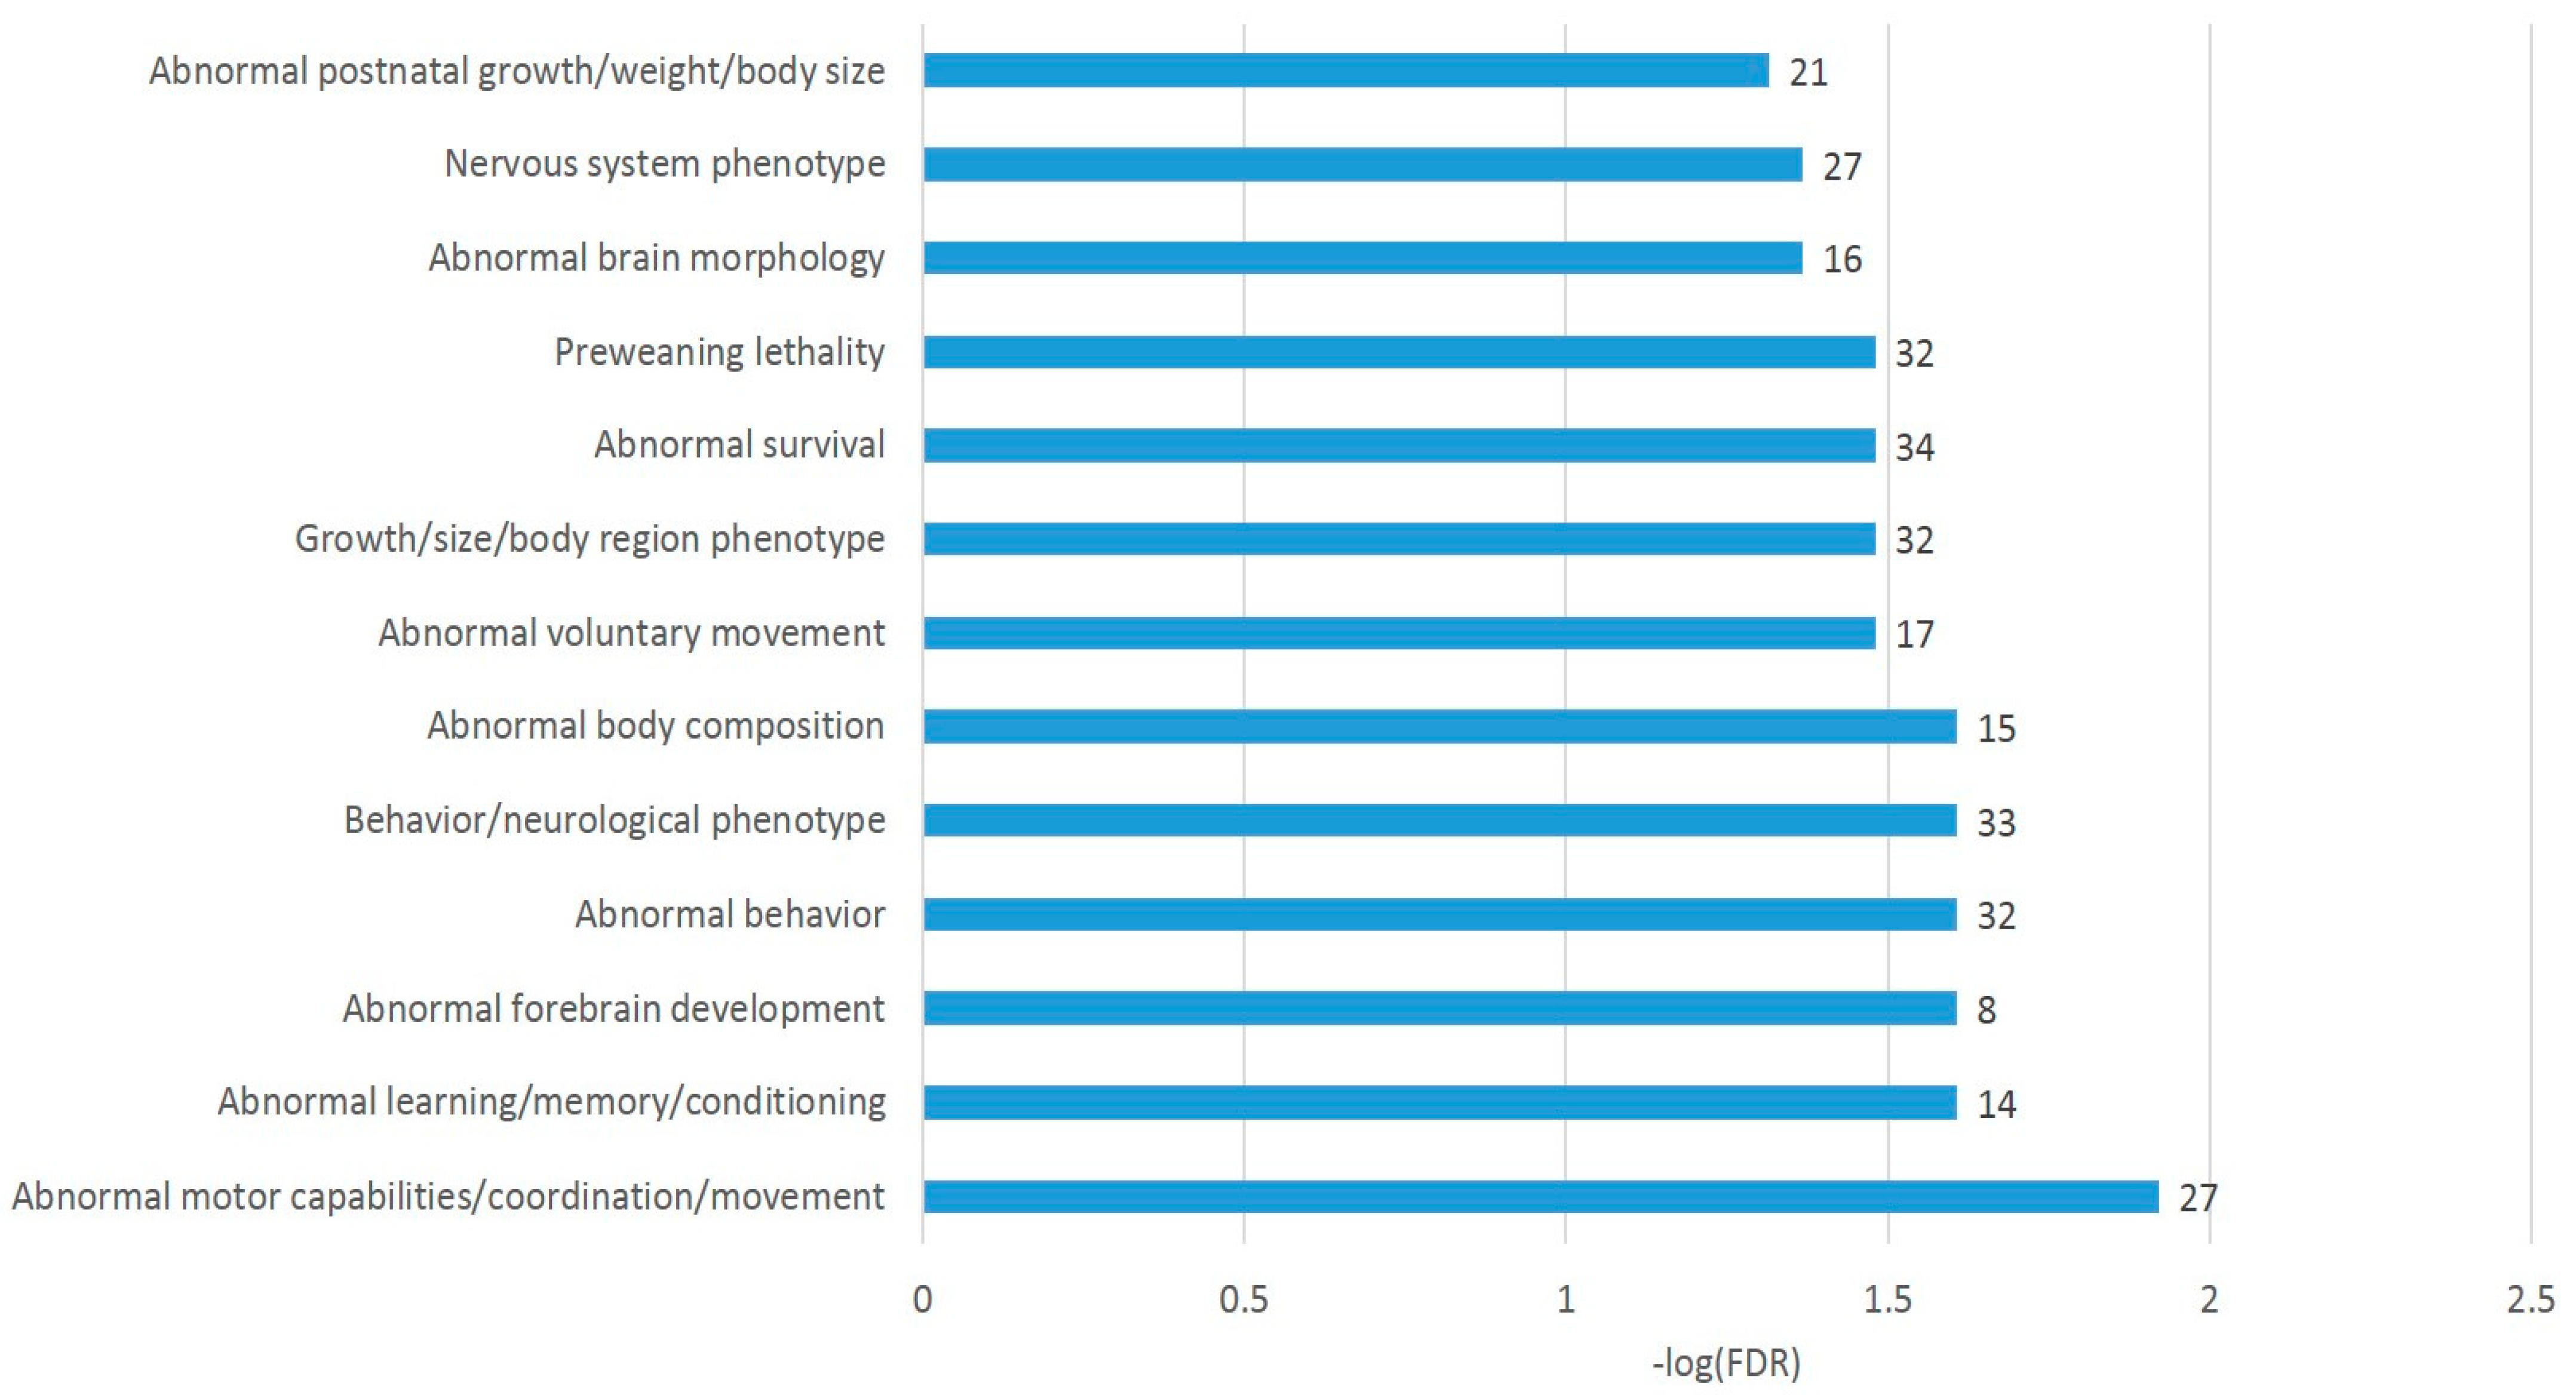
Overall, we observed the consistent DAS ES events enriched in chromatin (histone) rearrangement GO categories (
Tables S2a and S3b,c). Note that 71 of the 163 DAS ES genes were annotated as an enrichment with ‘abnormal survival’ genes (
Figure 5), meaning ‘deviation from the expected viability or life span of an organism’ (MP:0002206; Monarch nomenclature; [
34]), implying the genes are essential for an organism’s maintenance.
3.2.2. Distribution of A20-Specific DAS ES Genes
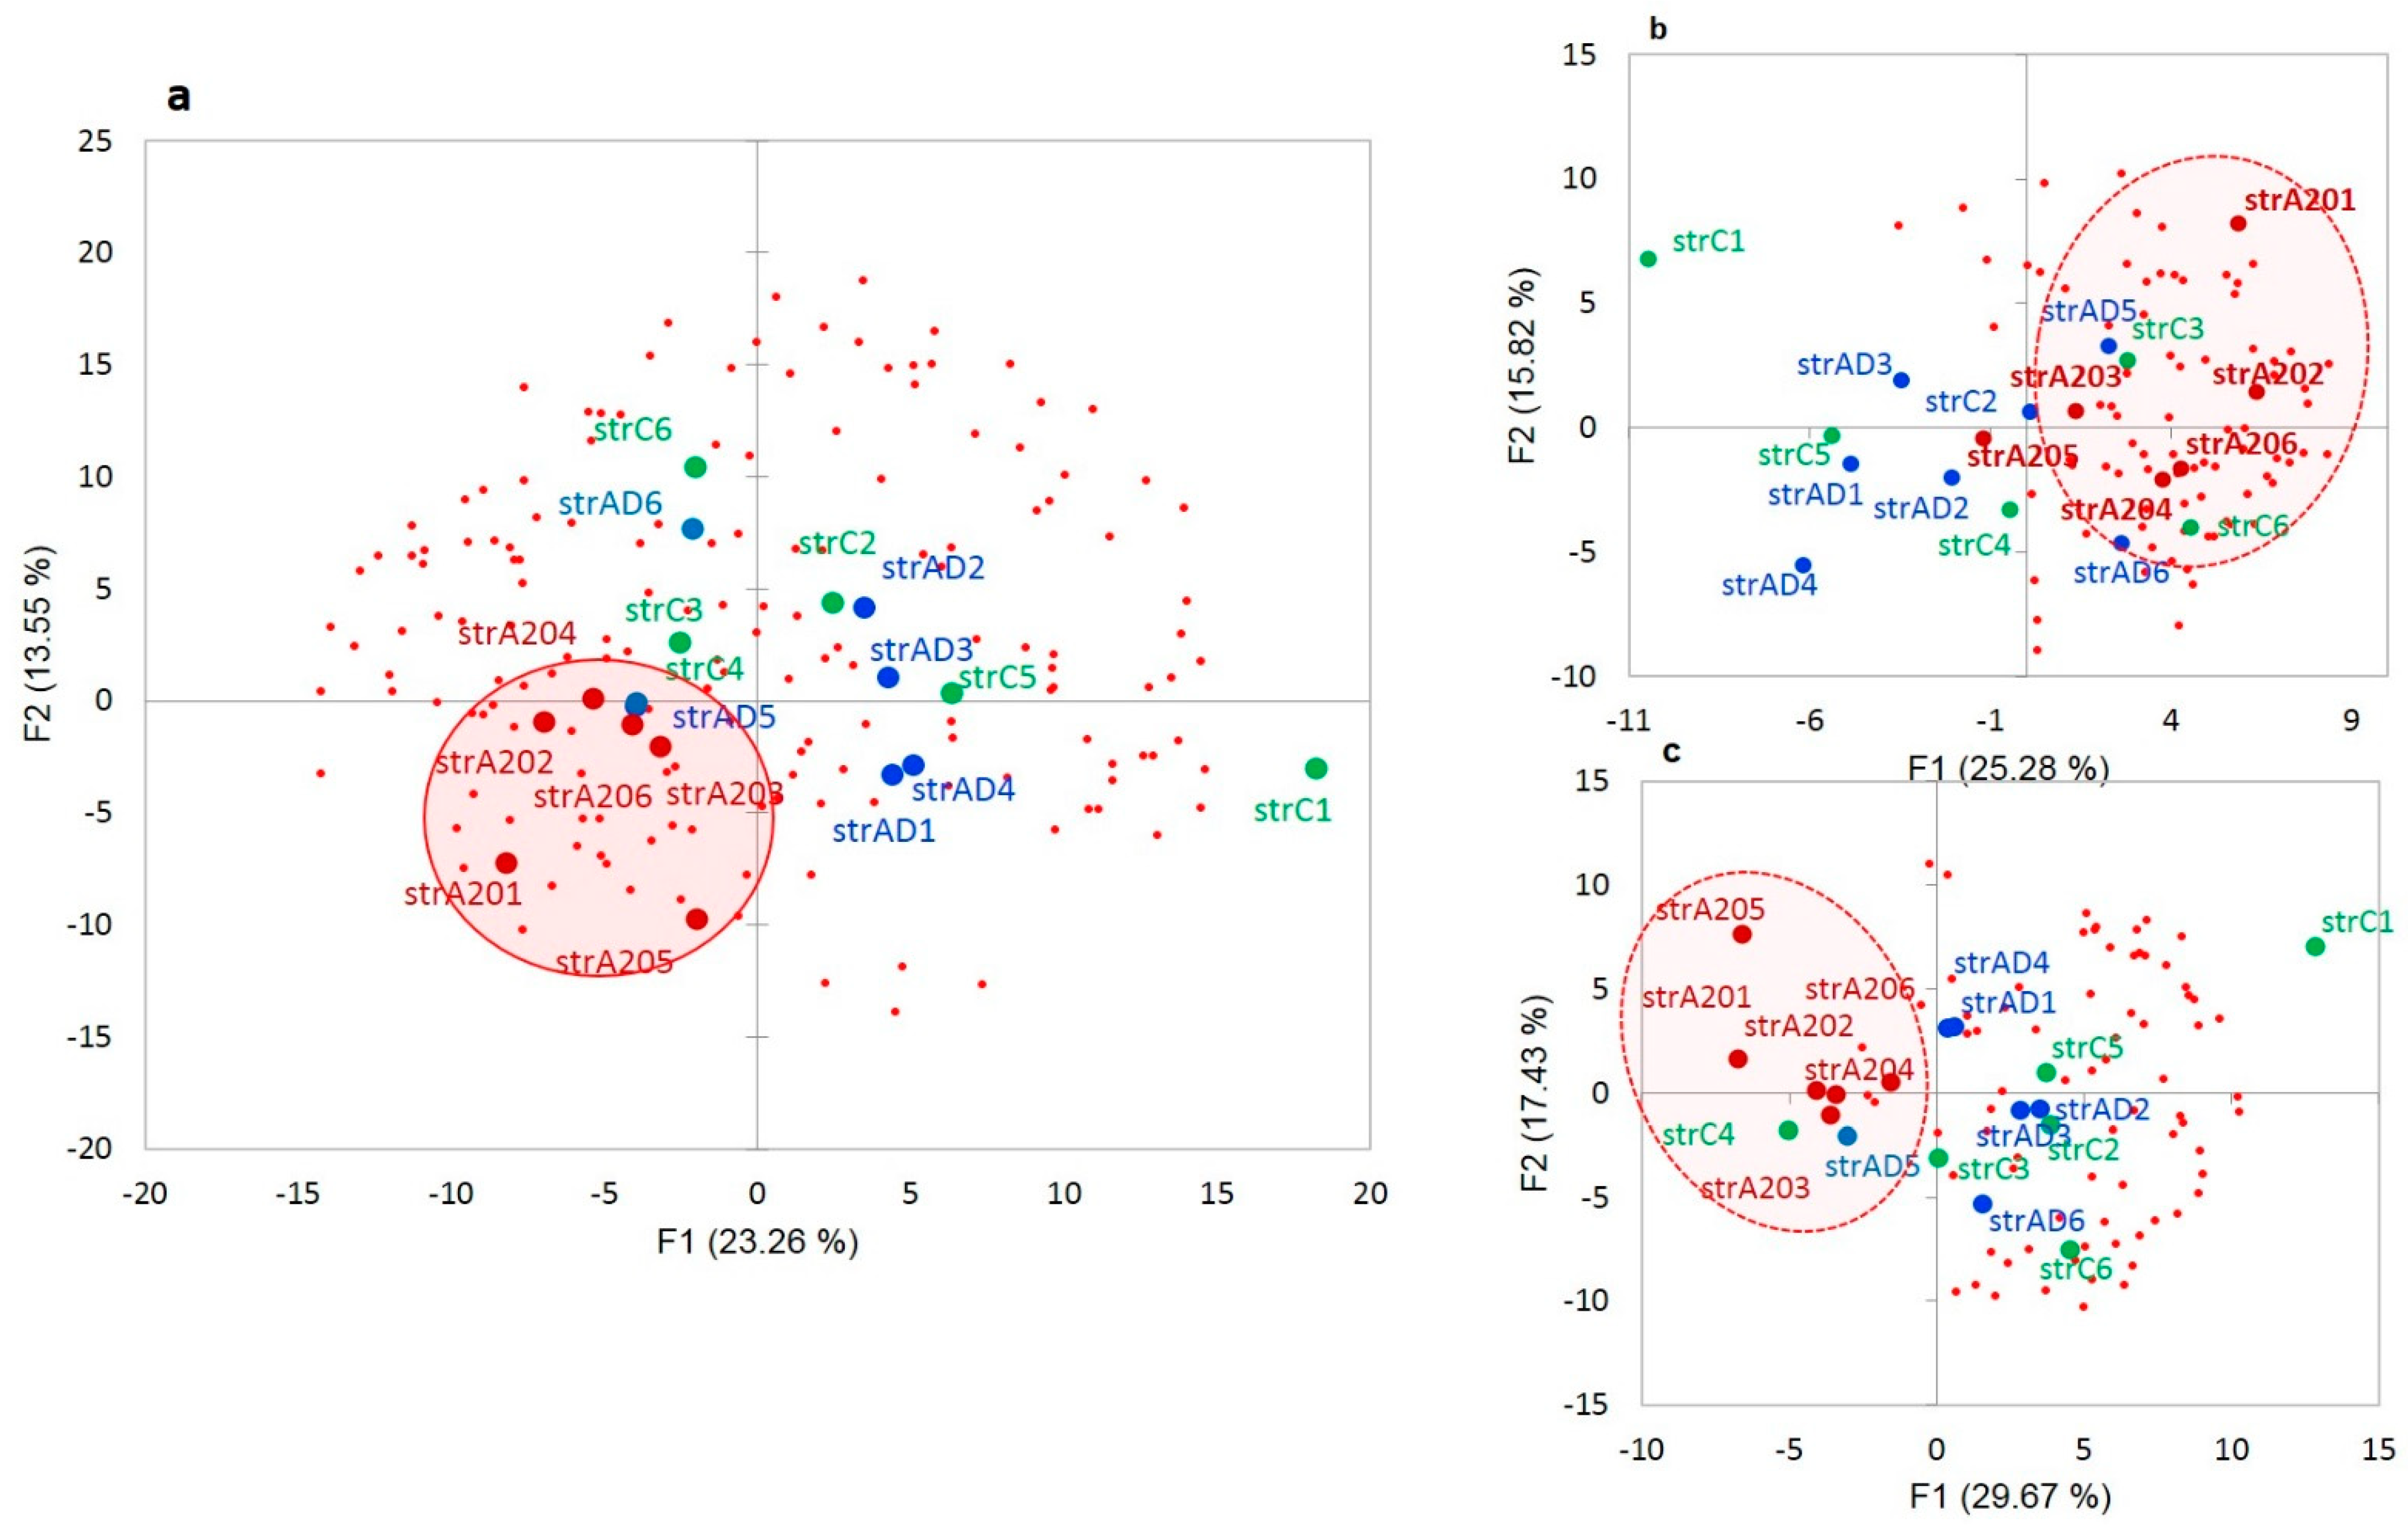
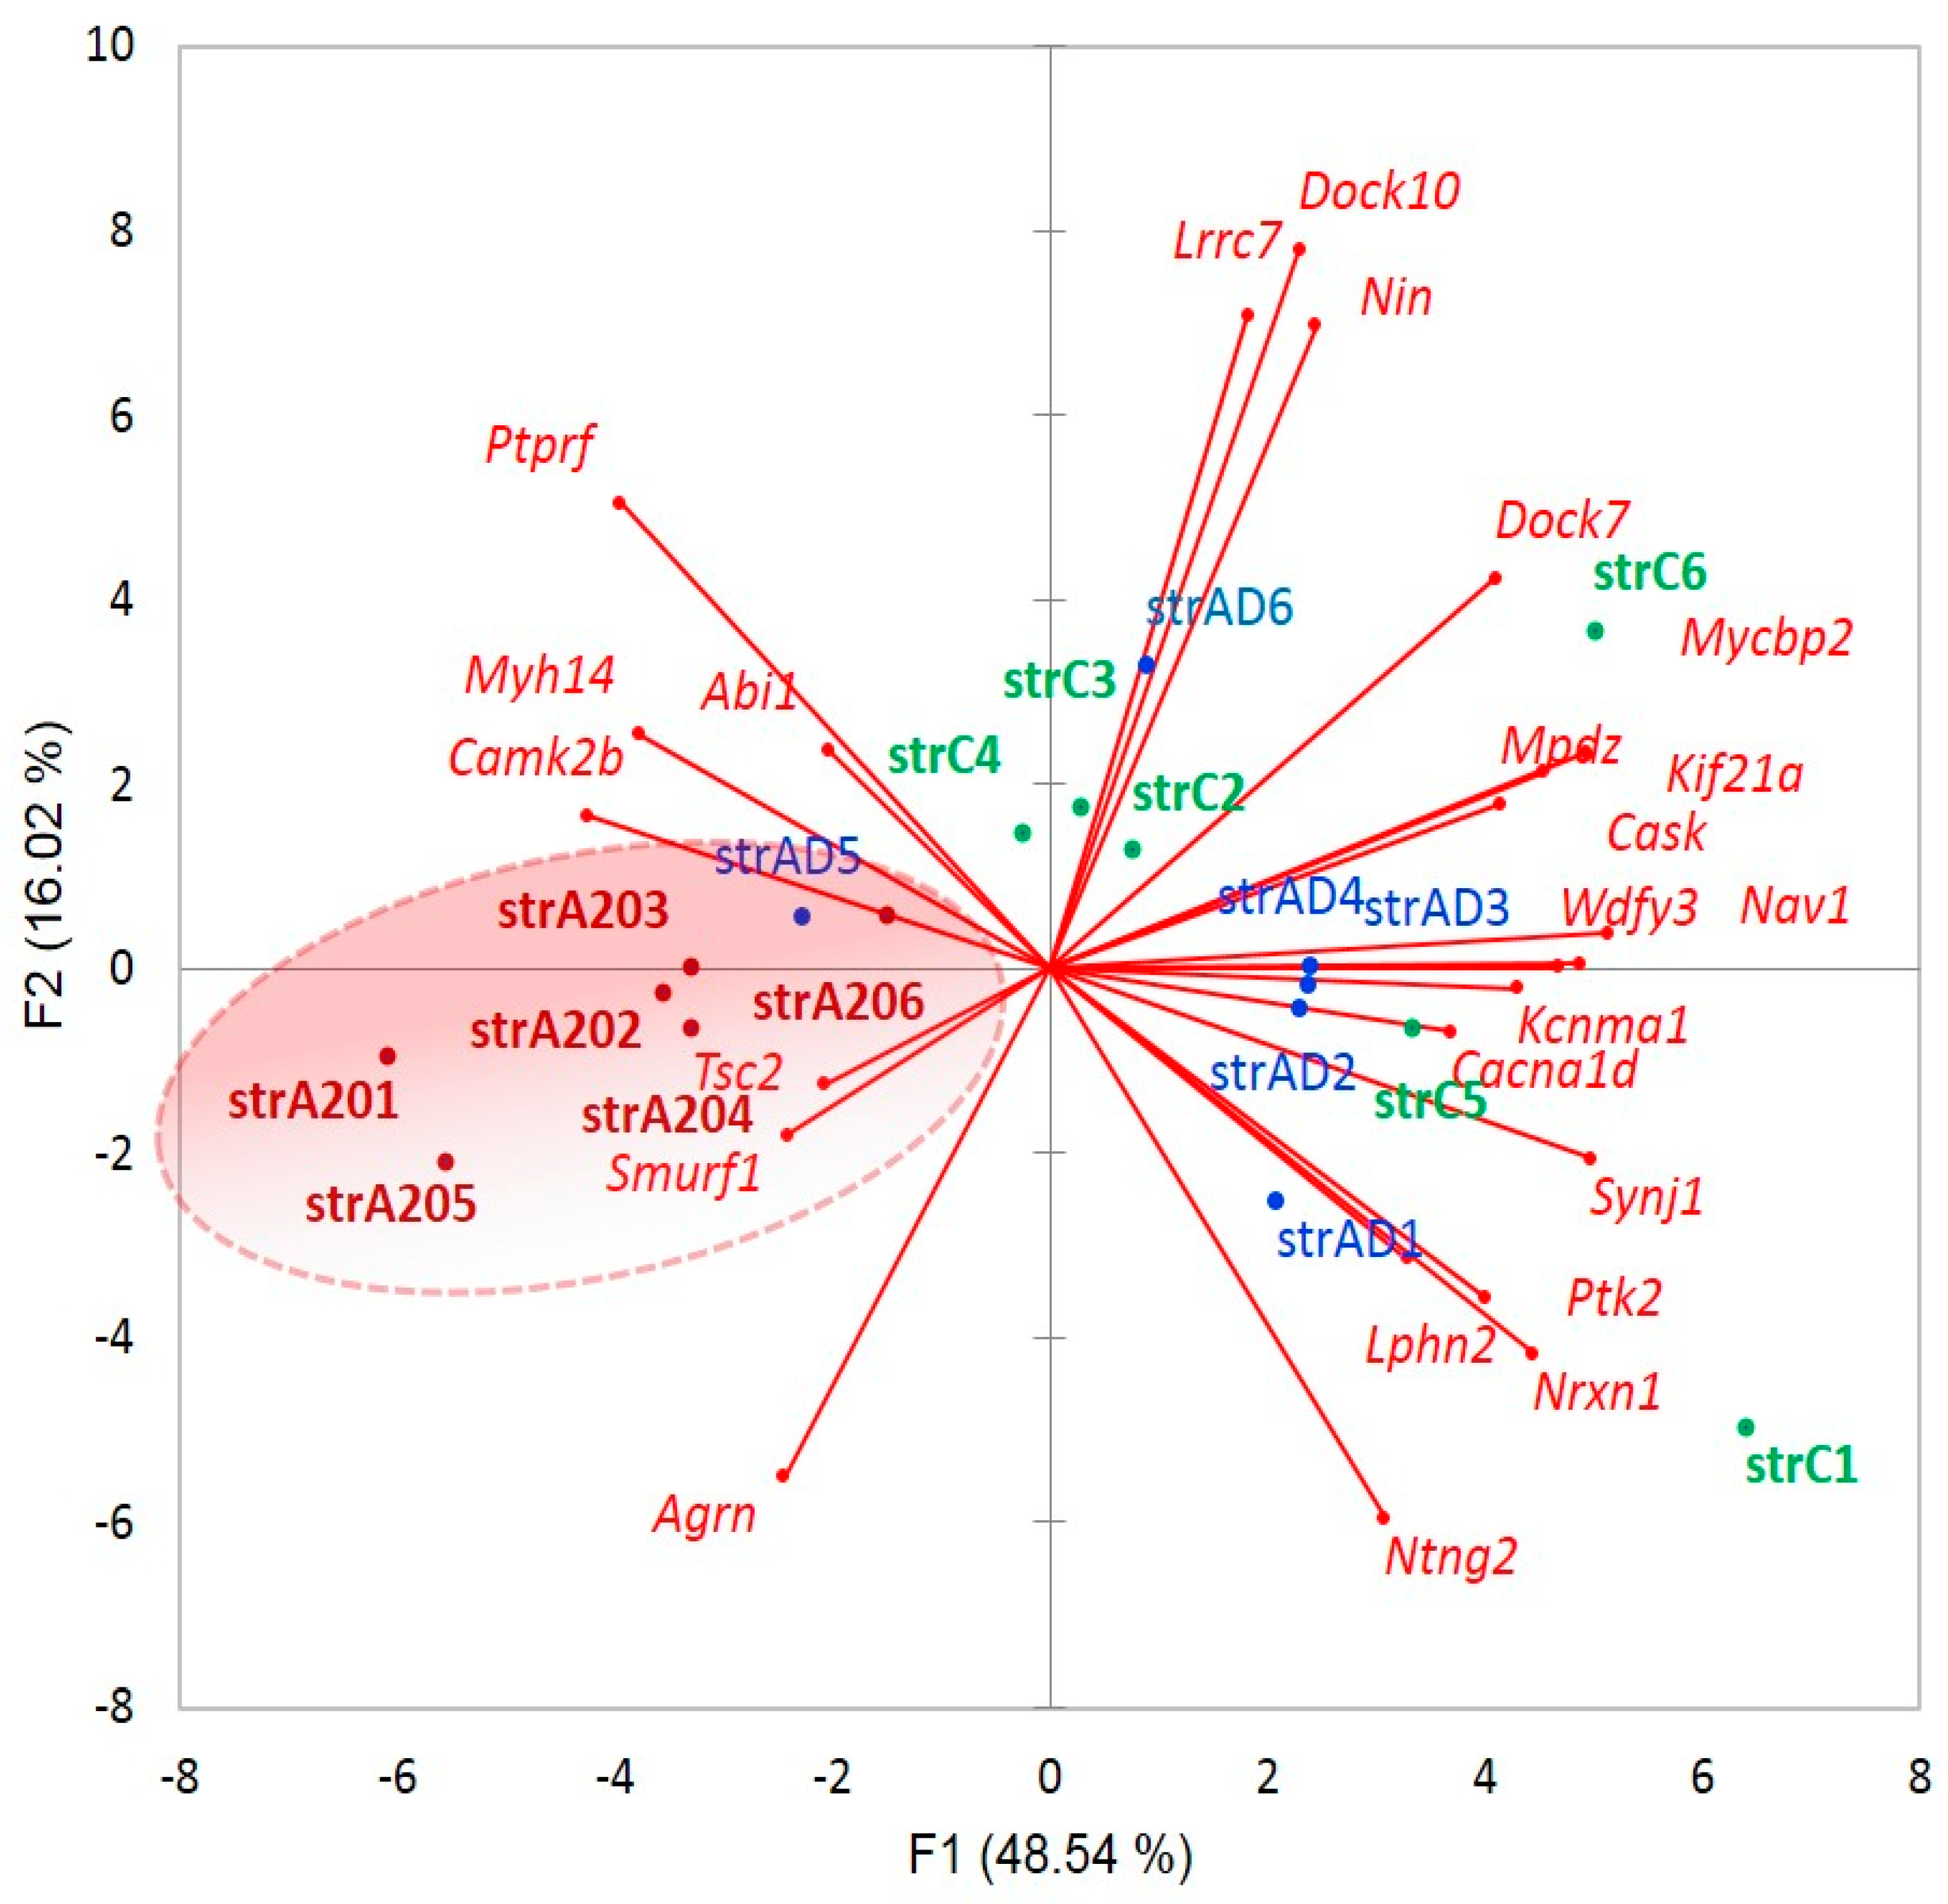
We plotted the PCA distribution of DAS genes across the samples based on their expression profiles (
Figure 3a). Consistent with our earlier work on the same data [
4], the A20 group manifested a distinct clustering through the landscape of the gradient gene expression (
Figure 6a). We further performed agglomerative hierarchical clustering (AHC) of 163 DAS ES genes, leading to two major clusters of A20 enhanced genes (81 entries;
Figure 6b and
Table S2g) and A20 downregulated genes (76 entries;
Figure 6c and
Table S2j).
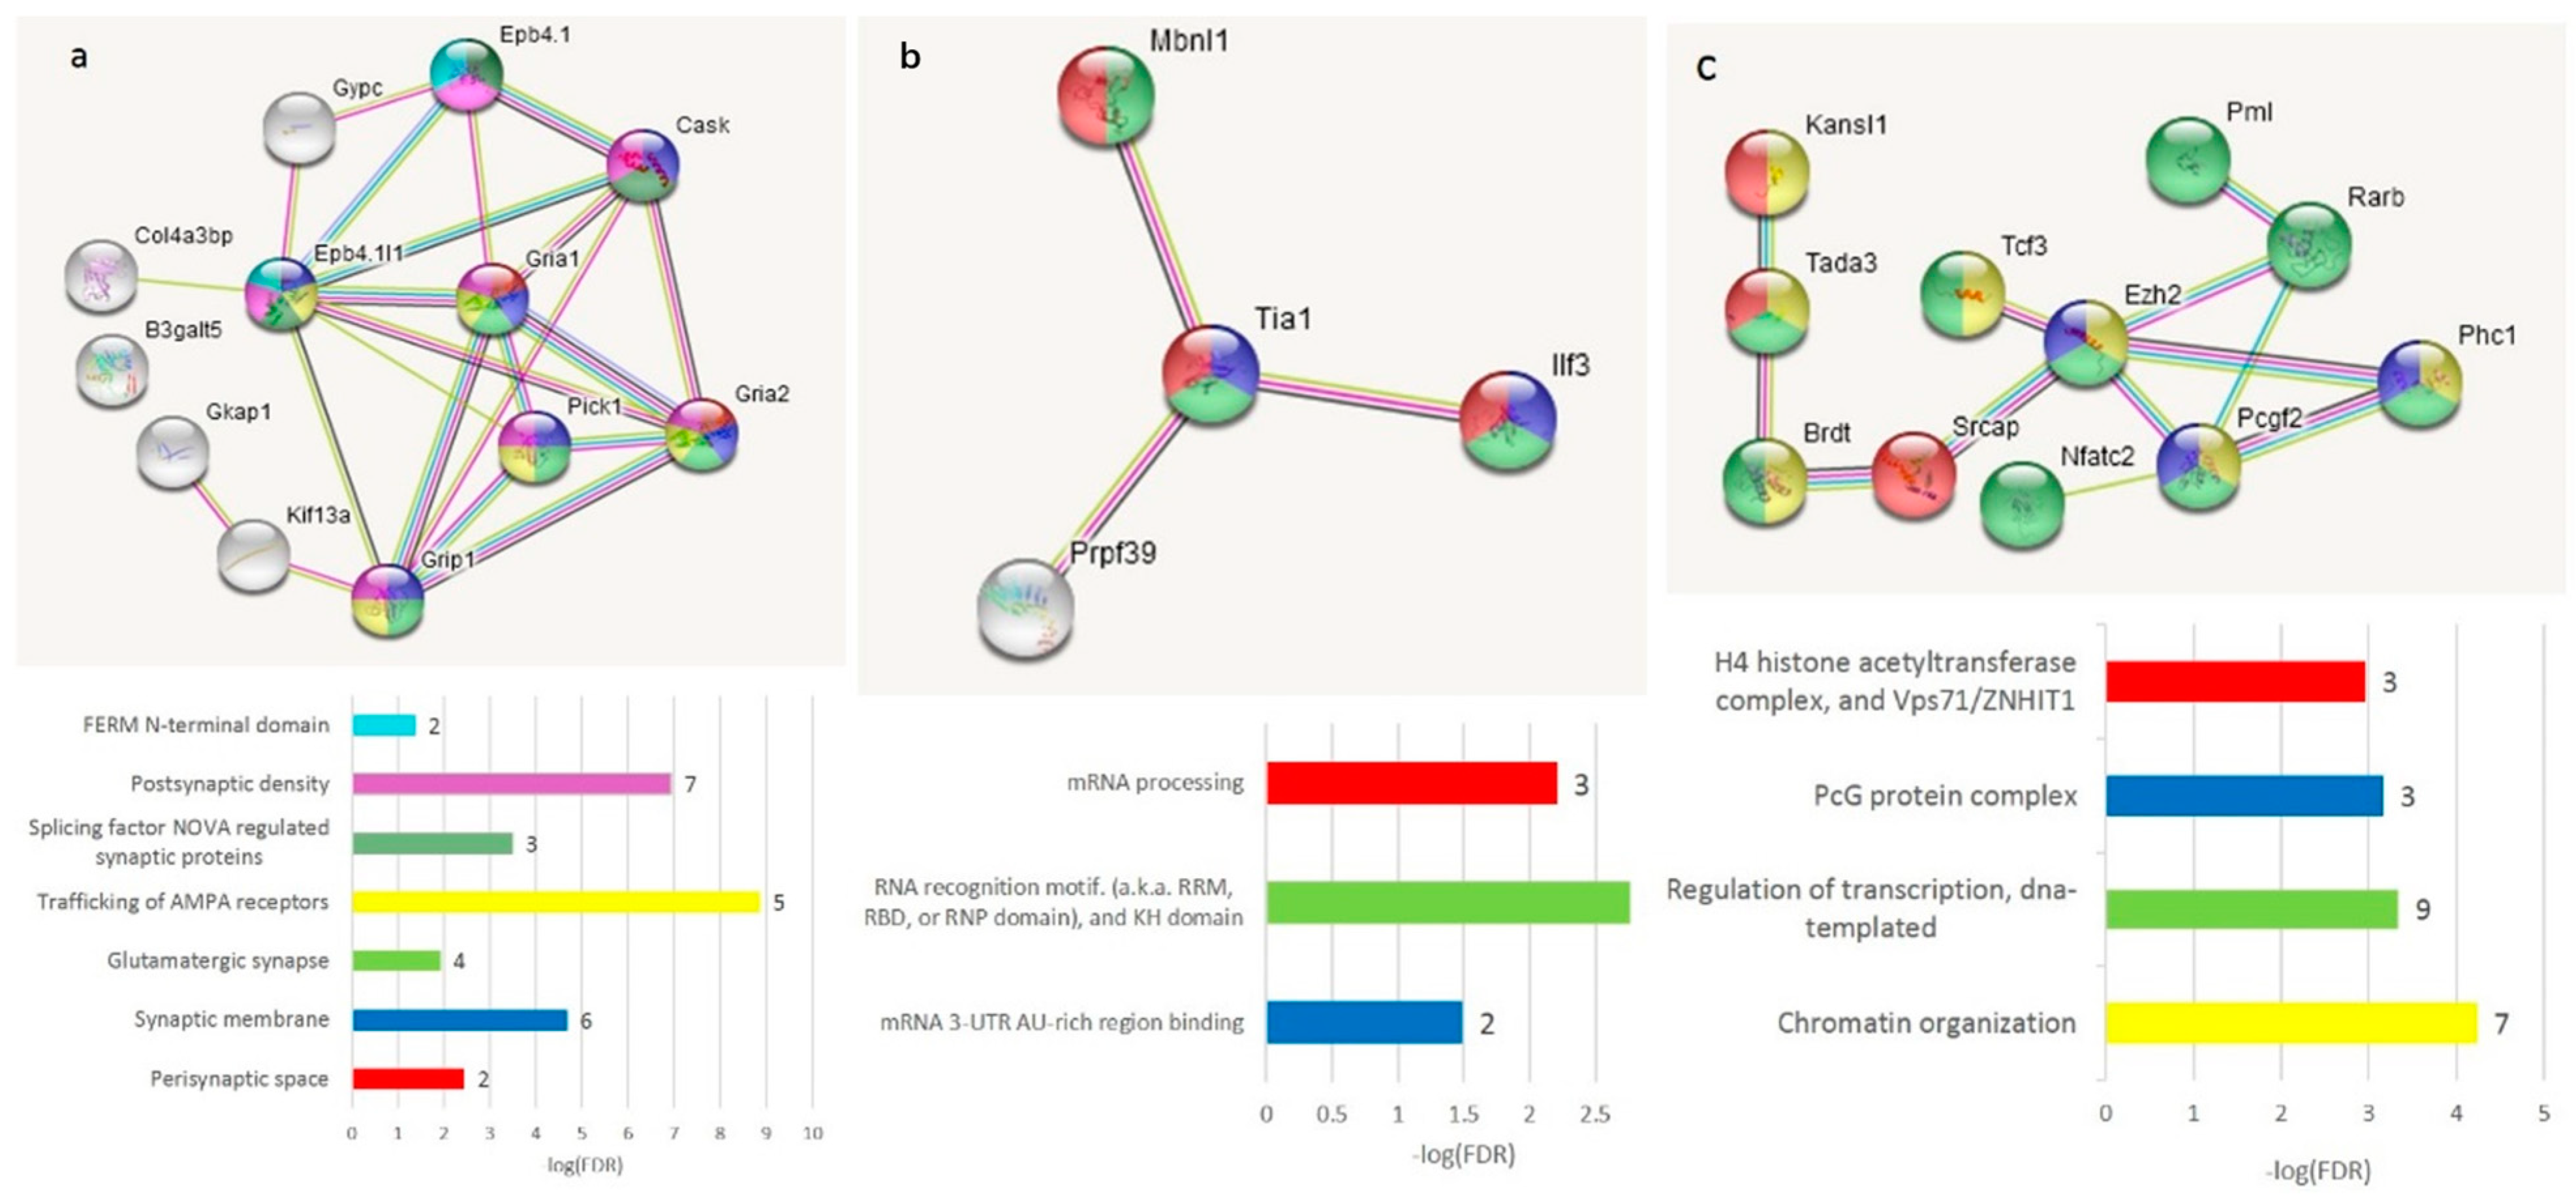
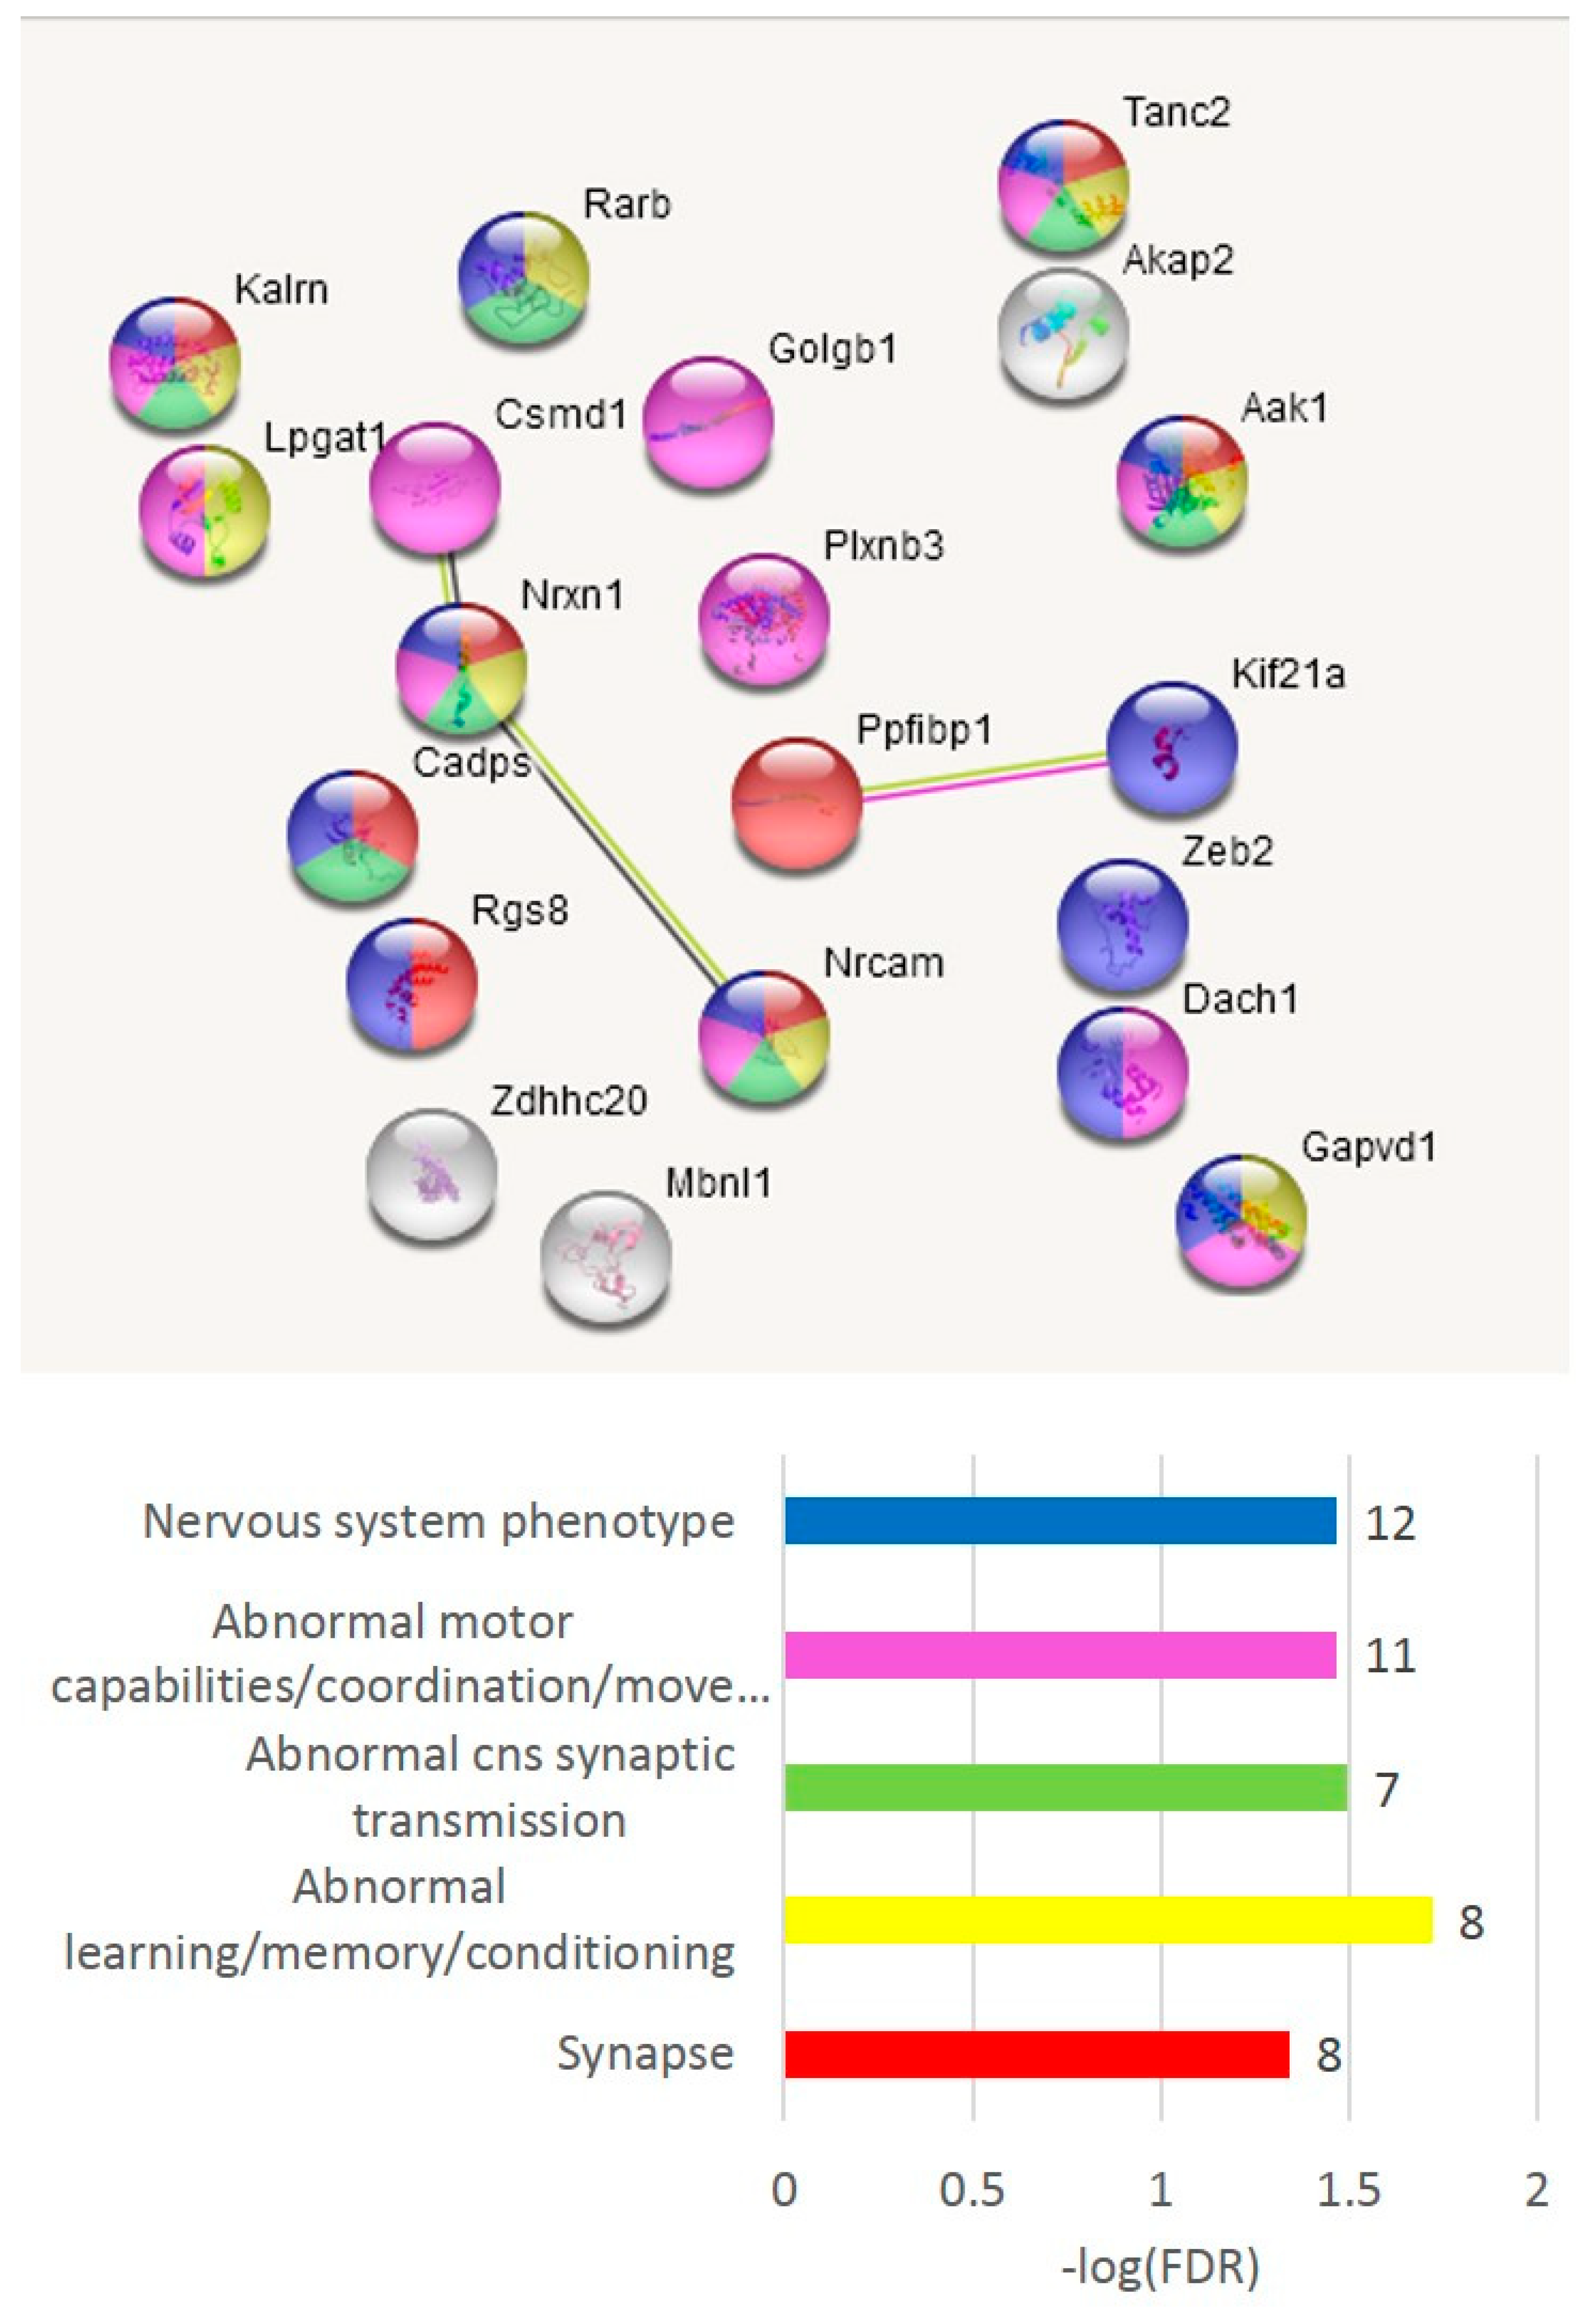
The GO annotation in the A20-associated cluster (
Figure 6b) revealed the lack of nontrivial GO enrichment categories (
Table S2h); correspondingly, we expanded several gene networks involved by applying the string-db.org genes set expanding option. The results are shown in
Figure 7.
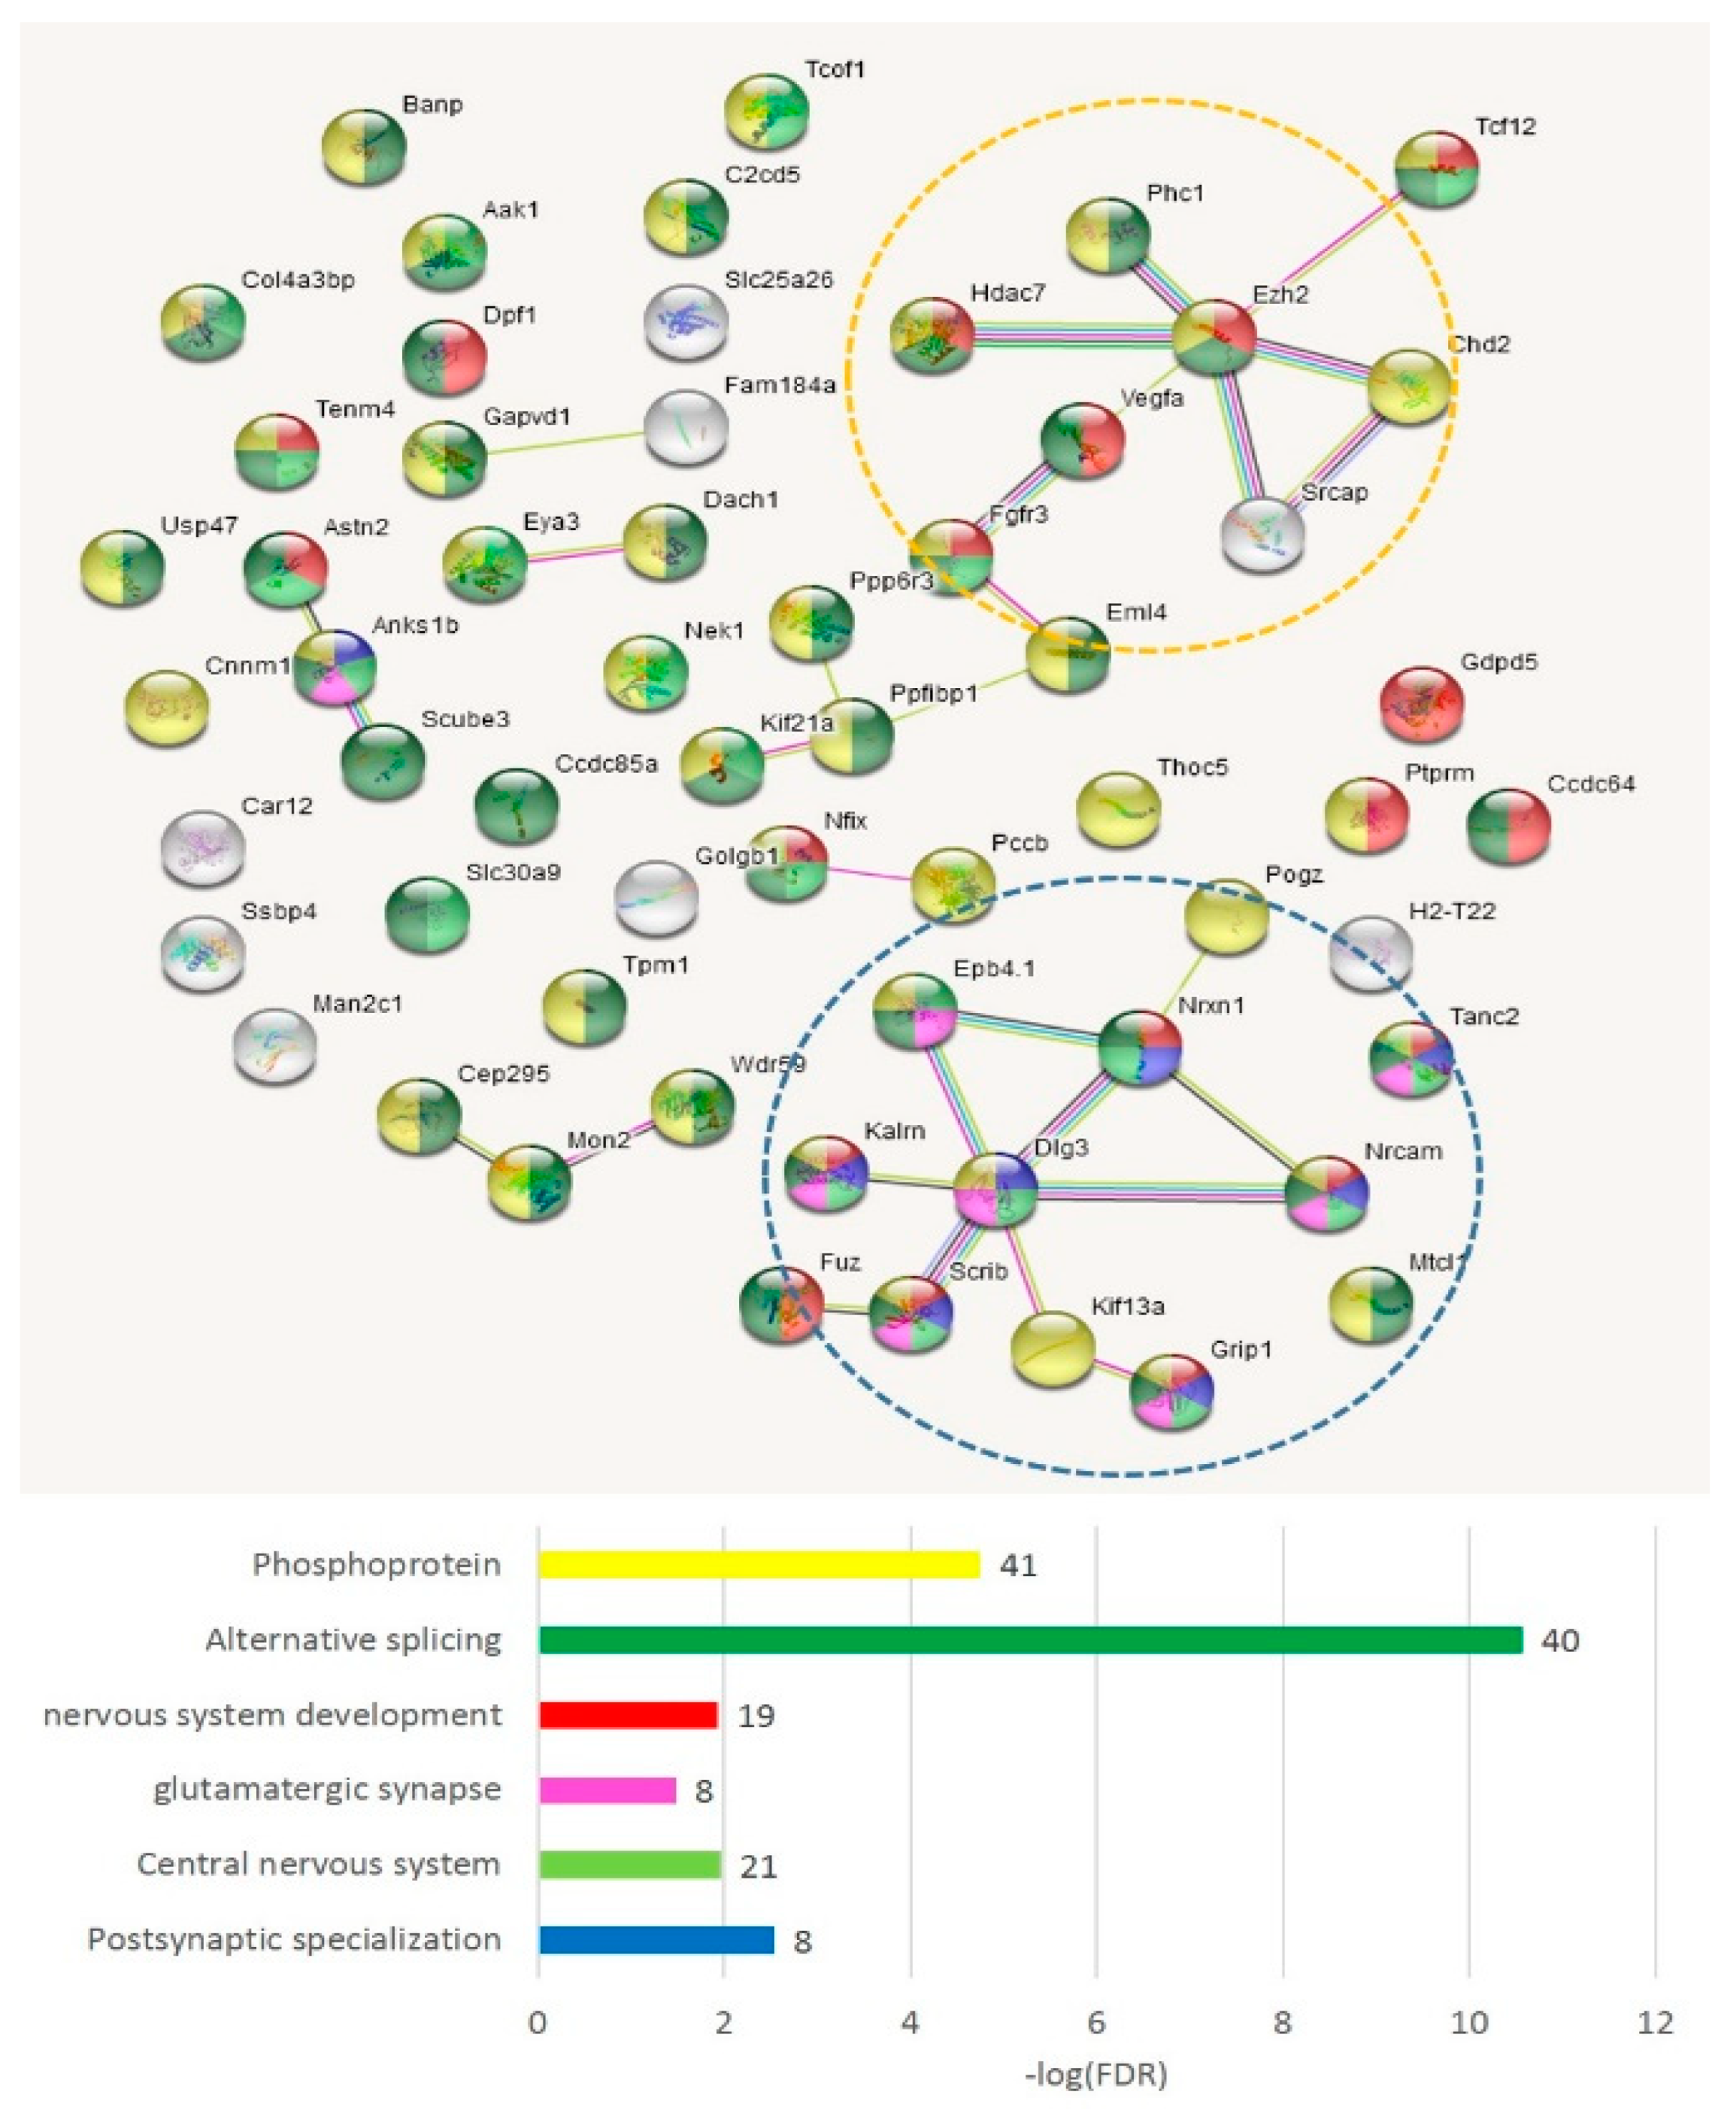
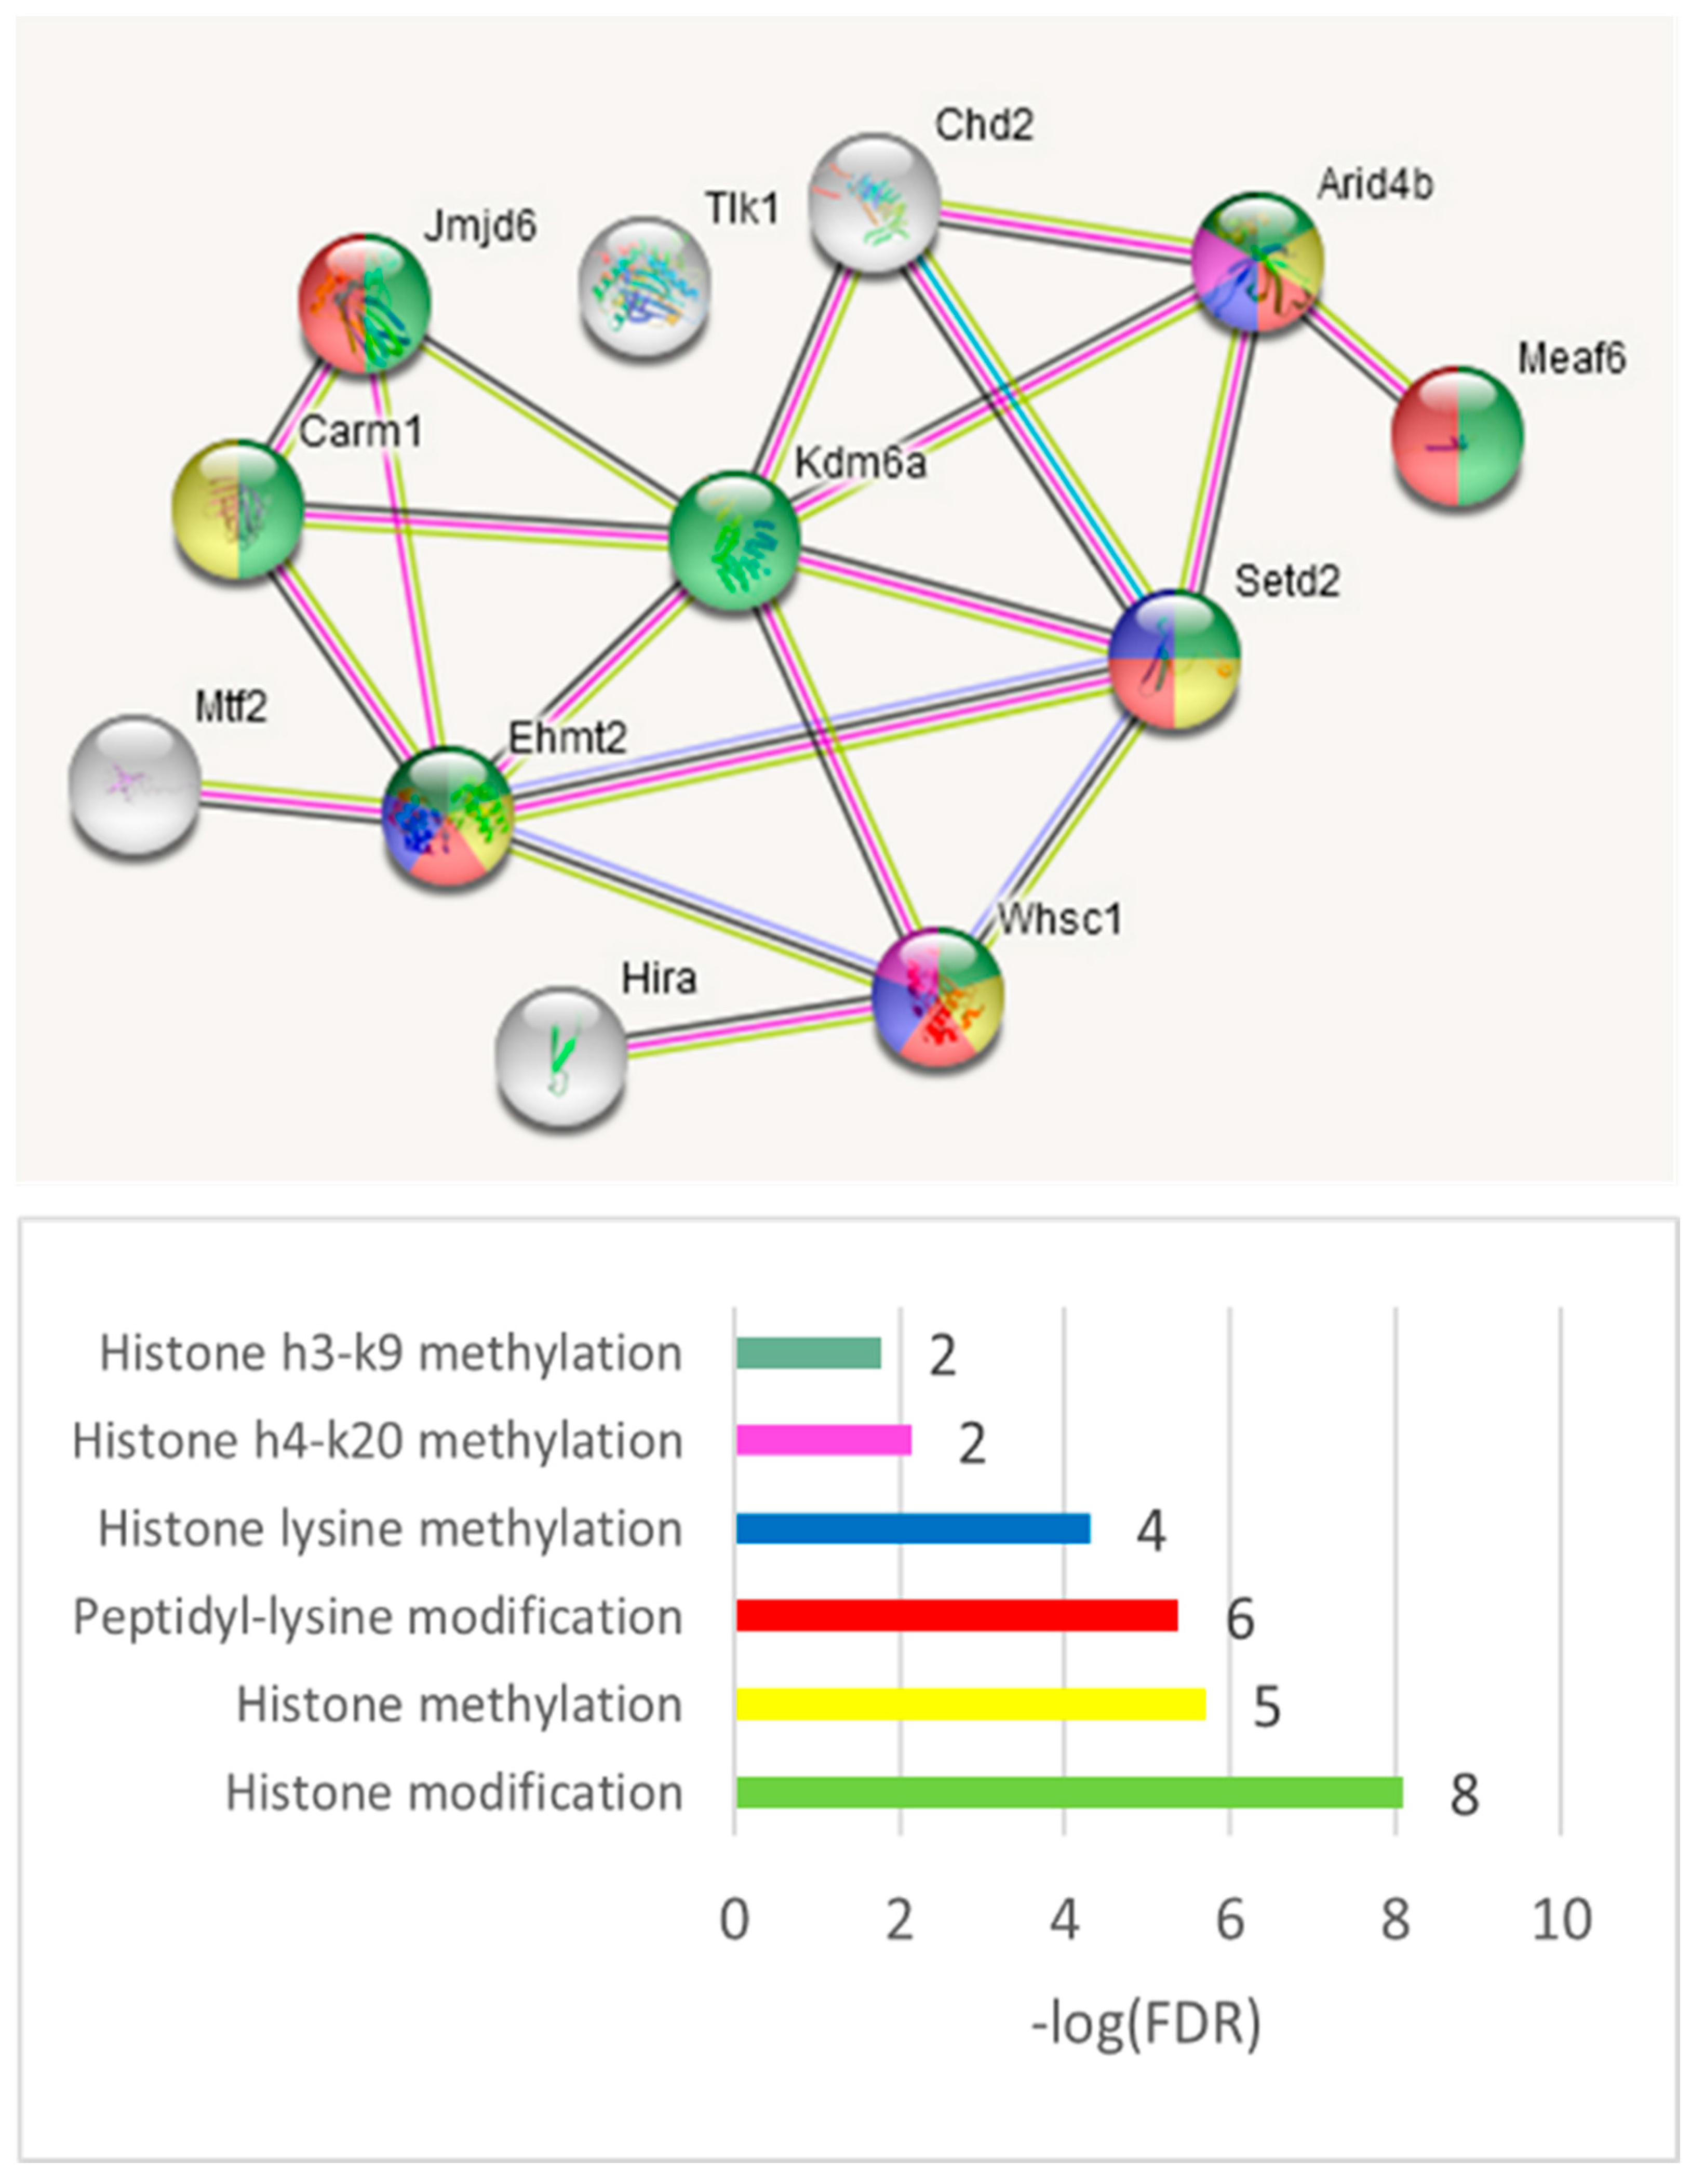
The A20 attenuated group of DAS ES genes, outlined in
Figure 6c, demonstrates the enrichment of the gene networks related to the DS brain region (
Figure 8). Most of the terms were retrieved from the Monarch phenotypic database [
34] (
Table S2j), incorporated in string-db.org.
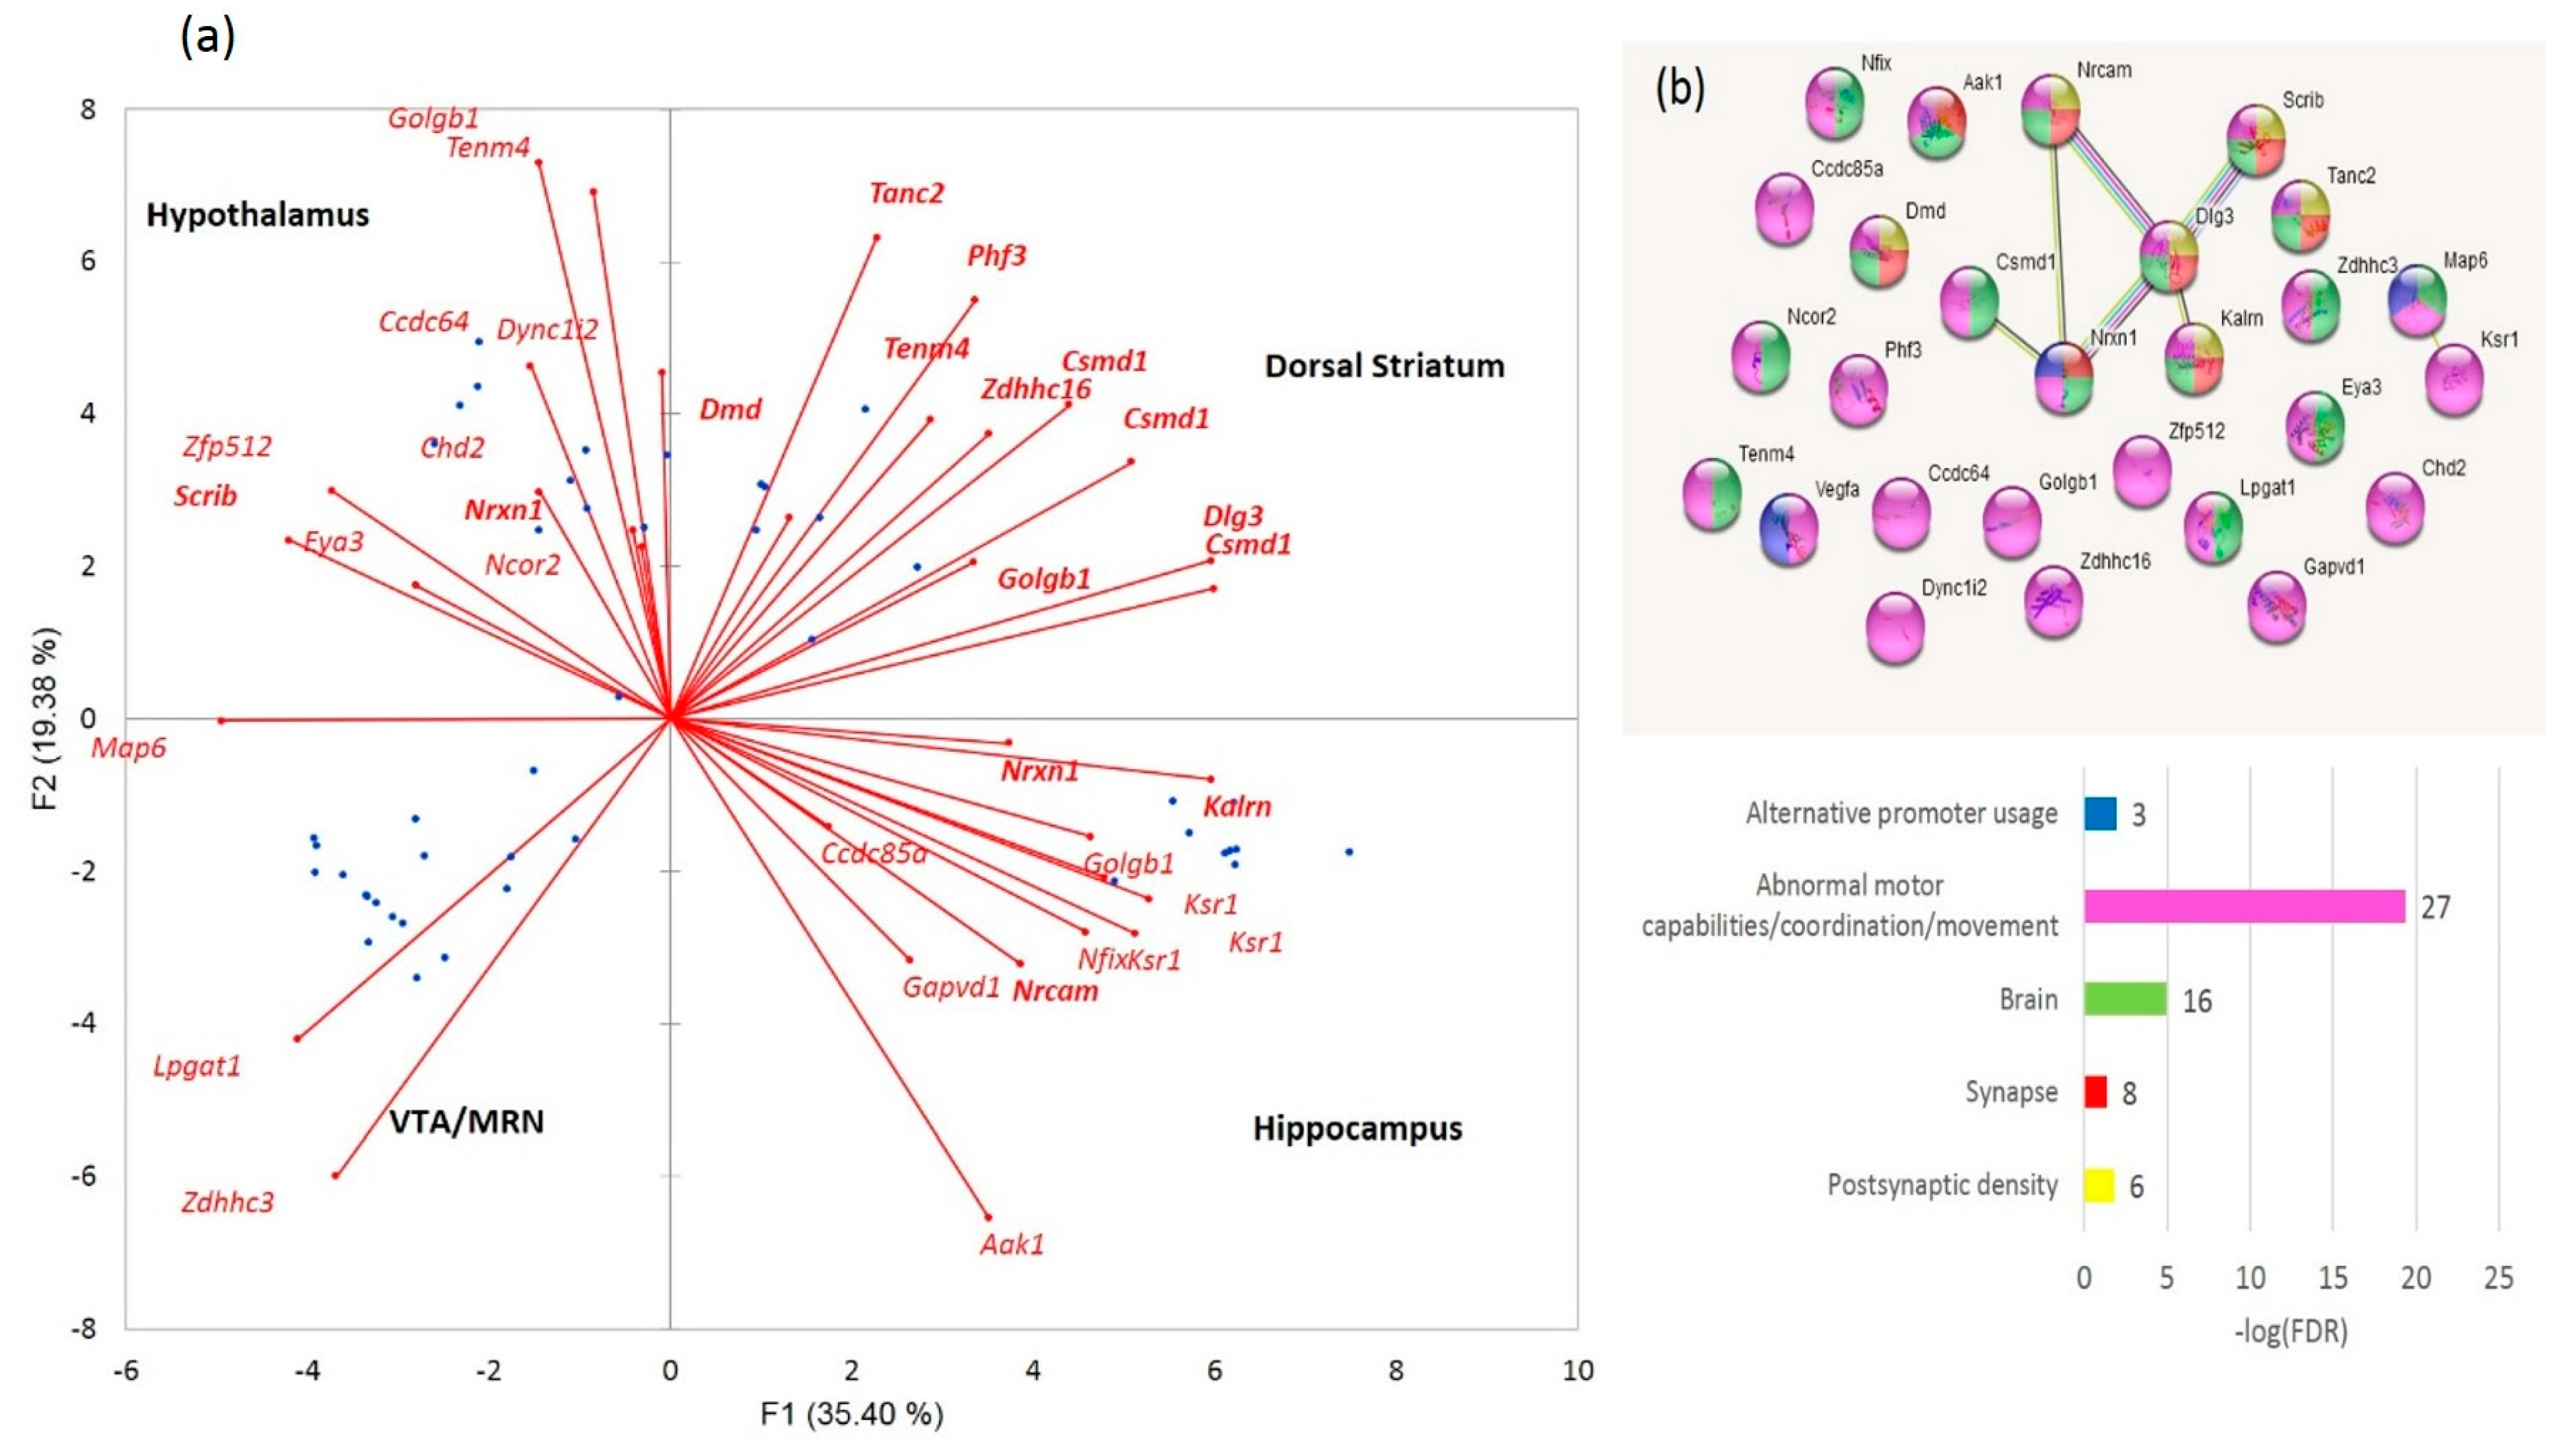
For gaining a more comprehensive insight into these DAS genes, we selected the DAS ES genes of the largest category in
Figure 8 (GO: MP:0002066; ‘Abnormal motor capabilities/coordination/movement’; FDR < 0.012; 27 genes;
Table S2j), which overlap other GO categories of gene sets in
Figure 8 as well, for a detailed analysis, as shown in
Figure 9. We found out that the set contains postsynaptic density genes, particularly referring to the DS (eight DAS genes;
Figure 9a,b). In addition, the ES events observed within the connected network (
Figure 7b, green/red shaded nodes) may imply that the splicing occurs coordinately within this network. This confirms the previous statements on essential structural synaptic density contraction in the aggressive/addictive subjects [
4,
6].
3.2.3. DAS Genes vs. DEGs
It has been over 10 years since the links between the chromatin, PolII elongation rate, and splicing outcome were reported [
19,
35,
36,
37,
38,
39]. When transcription starts, it produces a pool of mRNAs that is stored unprocessed [
40]. The quick homeostasis balancing challenges are addressed with the corresponding splicing processing response mediated by splicing factors (SFs), inducing the NMD cascade and abrogating effective translation of a particular gene.
Note that NMD-mediated splicing is reported to provide the feedback for attenuating/augmenting its transcription rate [
41]. Thus, NMD-related events do provide association with the transcription rate along with effective translation attenuation but the overall RNA isoform entity can hinder a downturn effect at the overall transcription level.
Therefore, although there is usually no direct overlap of DAS genes and transcription-mediated DEGs because of different timescales/phases of the processes, the network of the corresponding DAS ES NMD-related genes features the changes in its overall expression rate underscored by the altered ratio of coding/noncoding isoforms with the subsequent transcription rate modulation. Based on this, we would emphasize that the time scaling of splicing and expression phases makes it particularly crucial to assess both stages in the course of transcriptome evaluation.
Another point hampering RNA-seq analysis is a burst-like pulsating mode of gene expression, which was reported recently [
42,
43]. This mode is widespread in genes and is often accompanied by ES NMD AS and chromatin maintenance, including the activity-inducible neuronal genes [
44,
45].
We elucidated 20 DAS genes from the total of 163 merged (
Table S2e) that overlap DEGs reported in earlier work [
4] (
Table S3a).
Figure 10 outlines the specific GO chosen terms.
Most of the genes shown in
Figure 10 are the DEGs altered particularly in the A20 group against the two other groups (
Table S2k), except for
Zeb2, which displays the DAS effect in the AD group as compared to two others (
Table S3c). The 5′UTR ES target exon, not reported in public databases among multiple
Zeb2 ES isoforms as of now, overlaps the first exon of
Zeb2os but does not fully match it in size. It was located between 5′UTR exons 2 and 3 by rMATs software.
Zeb2 is reported to be involved in astrogliosis and accommodates the CNS recovery after an injury [
46], performing also as an inhibitor of histone acetylation. It has increased expression in the AD group more than two-fold as compared with the two other groups (
Table S9c).
Notably, the majority of the considered DAS genes/DEGs manifest the highest possible expression differences relative to the accuracy range (1 × 10
−5,
Table S3c), implying rather drastic expression level alterations in these genes following/preceding the ratio alteration in their significant isoforms.
For a better appreciation of the splicing alteration, we show the plots of DAS/DEG group alternative splicing genes in
Table S3d. Correspondingly, this suggests that
Csmt1 has altered its major isoform in AD, while
Zeb2 maintains the major isoform with the skipped 5′UTR ES exon.
Thus, the analysis of the DAS plots (
Table S3d) suggests that the majority of DAS events in the DAS/DEG group (and, in general, in the DAS gene pool as well) arise owing to the nonlinear ratio alteration of isoforms upon a change in the gene expression, which can be used as an auxiliary indicator of an expression rate impact.
3.2.4. Coding/NMD DAS Events
We assessed the DAS ES events in the coding part of the genes.
Table S4a comprises the corresponding protein ENSEMBL IDs for each isoform, where available. We ascertained that while 59 genes maintain both AS ES isoforms as coding (long and short ones), termed AS2 events (
Table 2), there were 32 AS ES events maintaining only one of the isoforms as a coding one (NMD events).
3.2.5. Replicated DAS Genes in Comparisons
To address the consistency of DAS ES events, we compiled the cross-comparison of the AS2 DAS ES common events in three pairwise comparisons, as listed in
Table 3 below.
We found that 23 DAS ES events in 21 genes are replicated in at least two different comparisons (
Table S4b,c), implying some consistent DAS dynamics across the whole set of the samples. We performed GO annotation in these sets.
We observed two consistent GO categories emerging across the three merged DAS sets. The replicable DAS genes in three comparisons (
Table S4c) feature the chromatin remodeling enzymes (
Hdac7,
Ezh2,
Rarb,
Chd2,
Brdt, and
Scrap;
Table S4c).
Hdac7, the most altered DAS gene, manifests the ratio alteration of isoforms in both the A20 and AD groups (
Table S4a).
The endocytosis/clathrin-coated gene network was apparently relevant in DAS genes manifestation (
Table S4c).
We also utilized the string-db.org-mediated targeted gene network expansion option to increase the associated network to 31 genes (
Table S4d). Four GO categories have been distinctly outlined: ‘Neural crest formation’, three genes (FDR < 0.009); ‘Chromatin organization’, seven genes (FDR < 0.016); ‘Histone h3-k27 trimethylation’, two genes (FDR < 0.034); and ‘EGFR1 signaling pathway’, four genes (FDR < 0.02;
Table S4d).
Note that the chromatin-related NMD evolutionary conserved ES events for the mammalian brain were reported earlier [
47]. Here, we observed both coding and NMD events across this group of genes (
Table S4c).
3.2.6. GO Annotation of AS2/NMD DAS ES-Related Genes
We compiled the merged non-overlapping AS2/NMD DAS gene lists (
Table S5a) and checked them against the GO annotations. We have found that the AS2 events represent mainly synaptic and neural development genes (
Figure 11); 59 merged AS2 genes (
Table S5a) maintain 30 edges against the expected 13 (PPI enrichment value
p < 2.24 × 10
−5).
As is evident from
Figure 11, there are two basic machineries featuring proteins capable of differential AS: (a) chromatin remodeling in the nuclear compartment and (b) synaptic plasticity (membrane compartment) in glutamate-related and other receptors.
3.2.7. NMD-Related DAS Genes
When we assessed the GO enrichment for the list of NMD-related 32-fold DAS genes (
Table S5a) with the string-db.org tool, we did not observe any significant enrichment with the GO categories/networks, except for trivial ones (AS and phosphoprotein,
Table S5d). We proceeded to assess several DAS ES genes by recovering the gene network using the string-db.org resource.
3.3. Postsynaptic Plasticity of Standalone DAS Gene-Related Receptors
While two confident gene networks were outlined with significant enrichment (
Figure 8), we undertook an effort to elaborate on other single DAS genes from
Figure 8 using string-db.org for recovering the context.
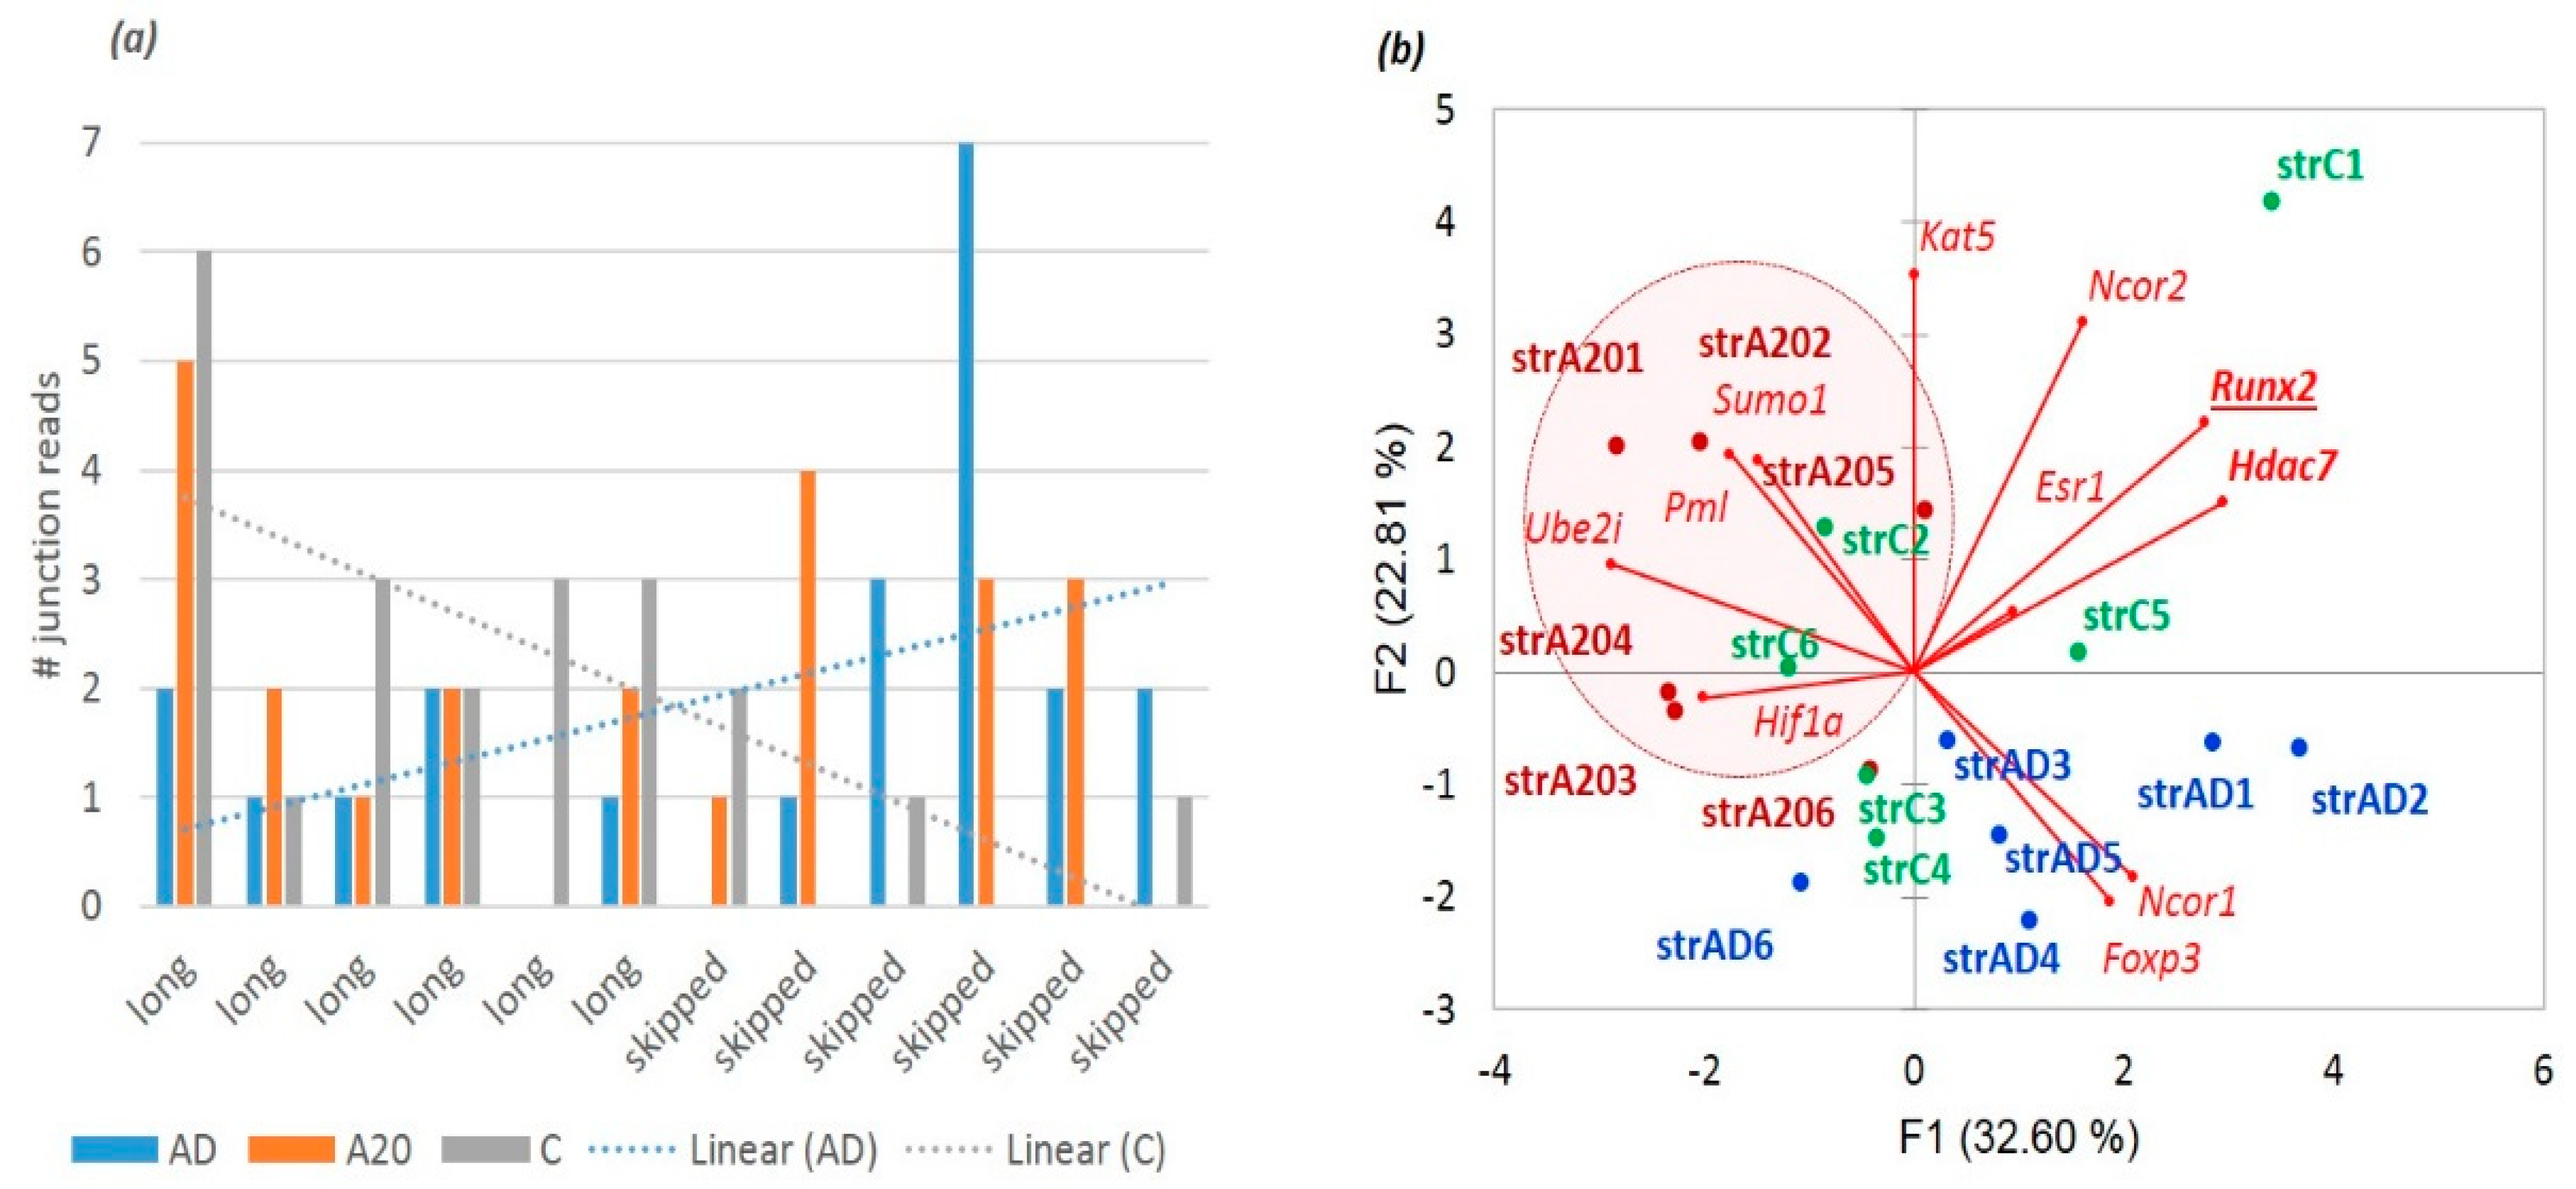
3.3.1. Tanc2 Splicing Specifics
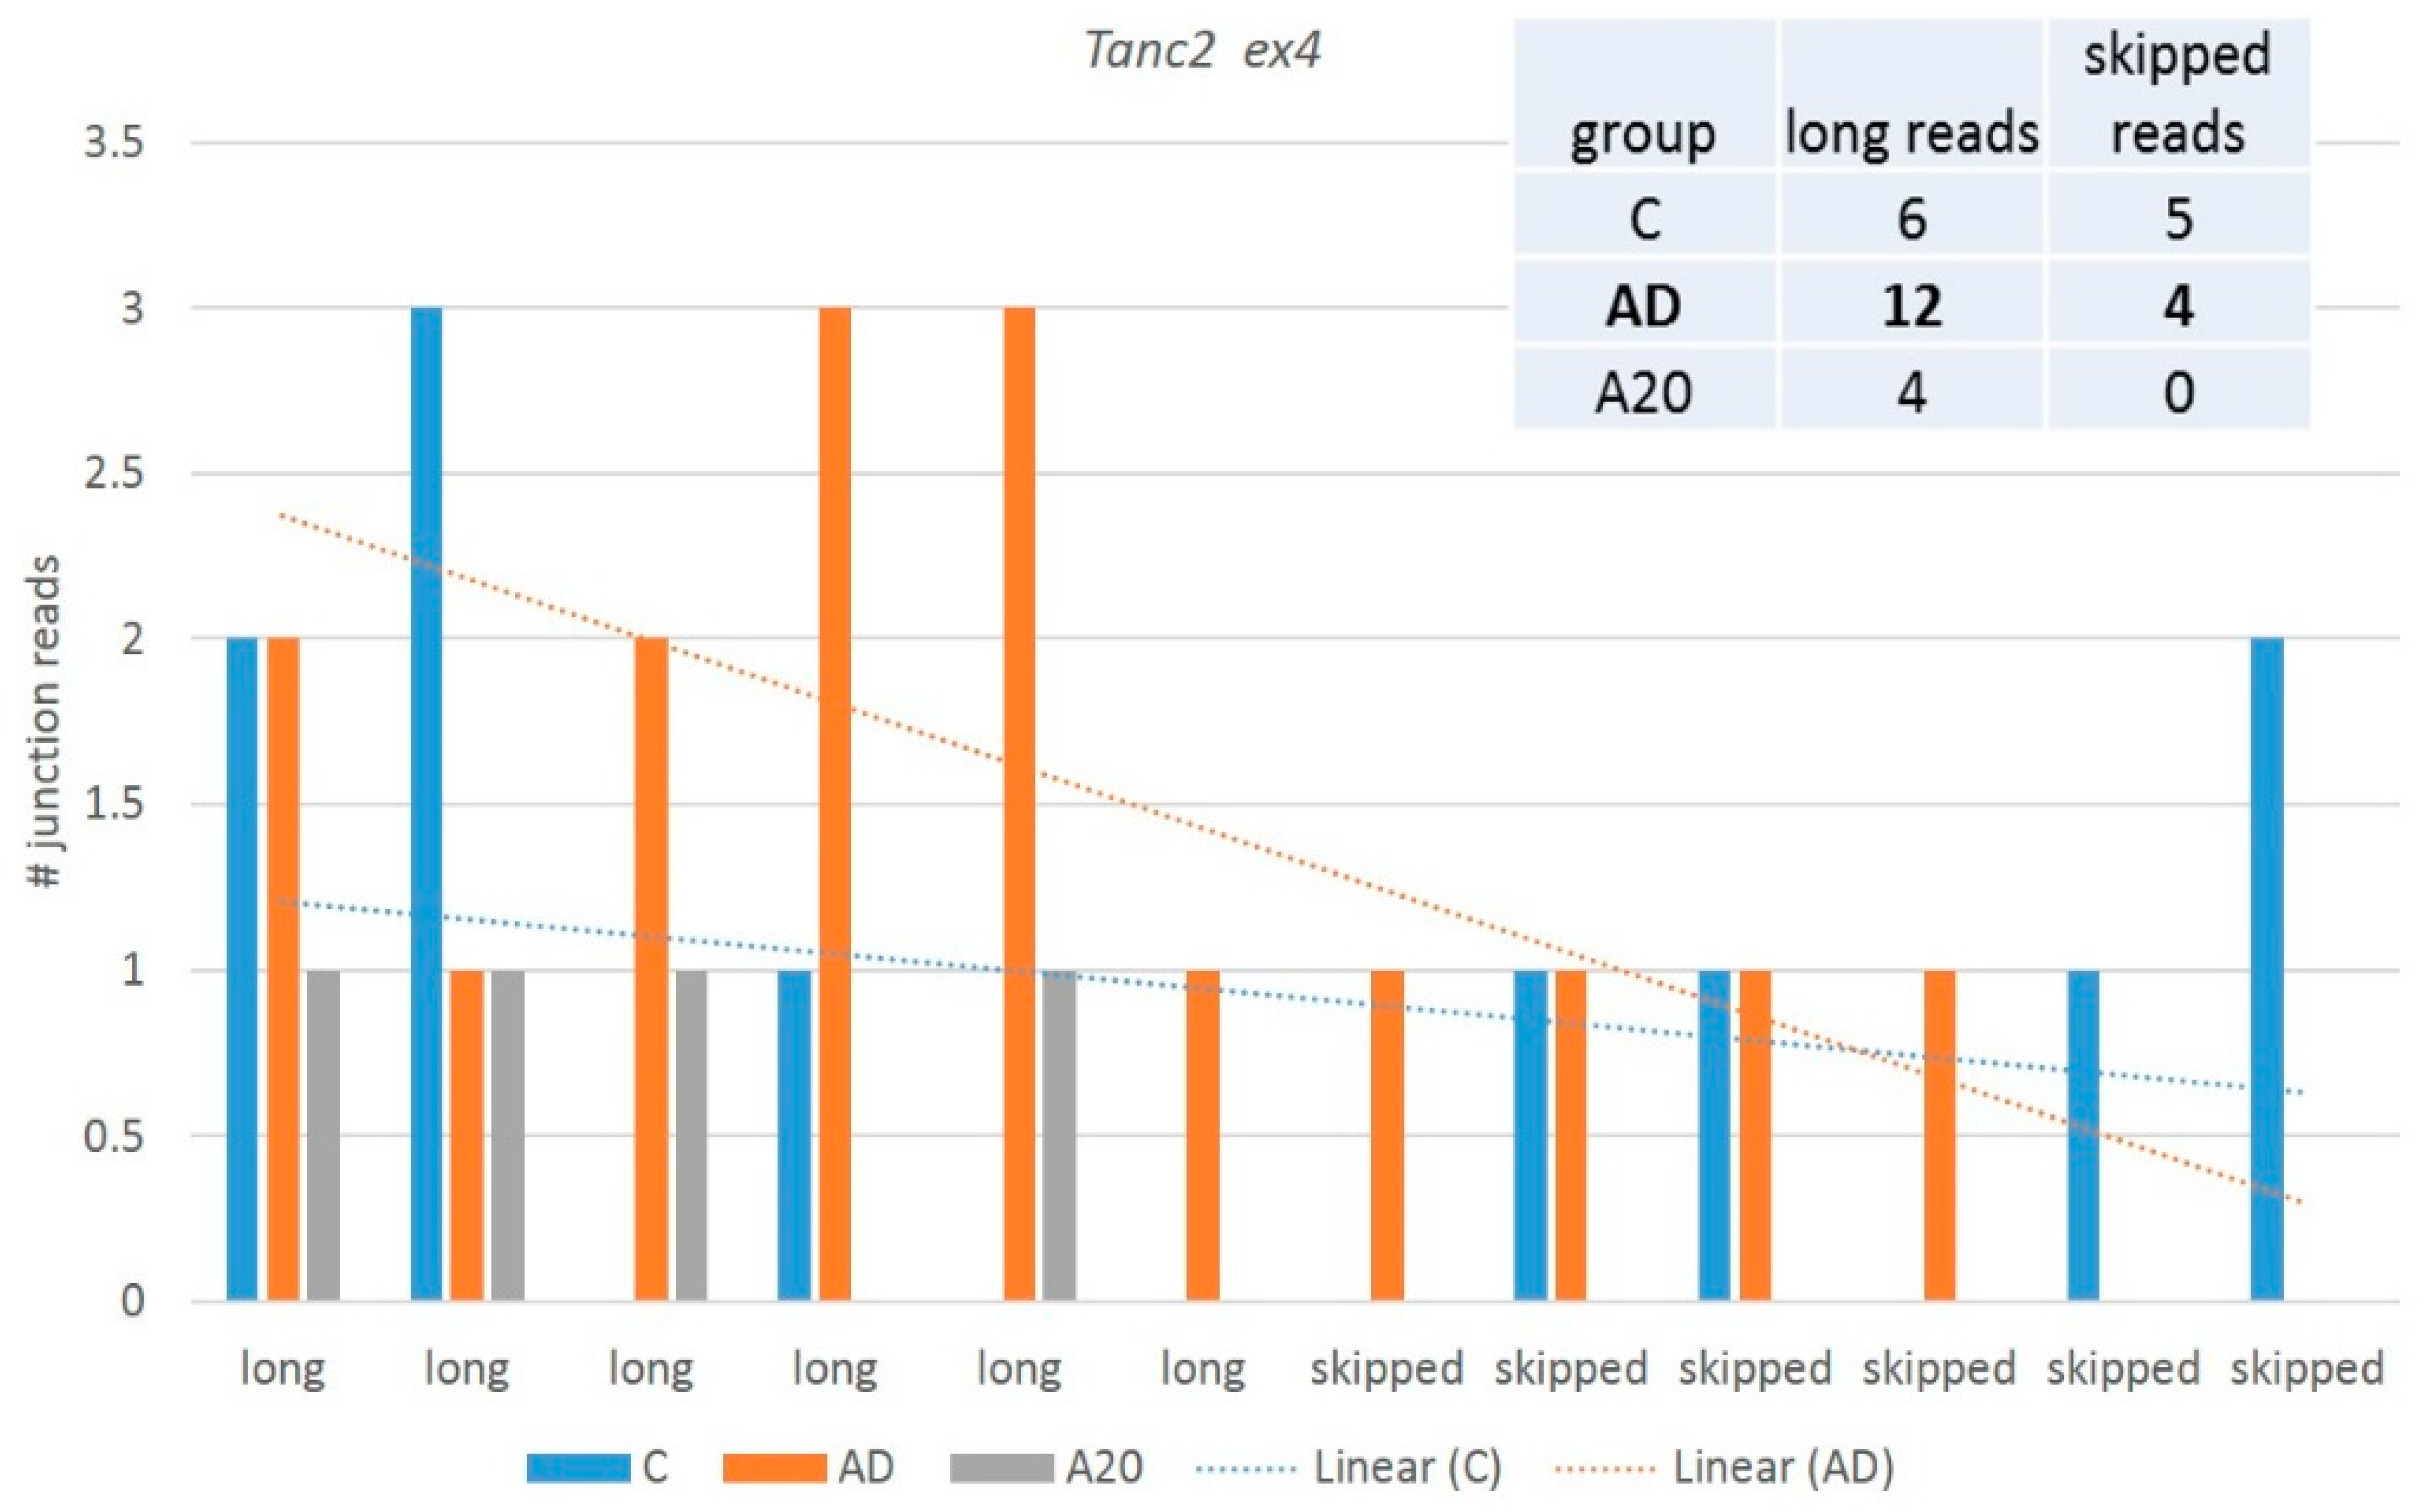
We observed the
Tanc2 ex4 skipped aberrant isoform with consistent emergence in all groups. It contains 26 exons (full set) and maintains nine ES prone exons (
http://ascot.cs.jhu.edu/ (accessed on 10 June 2022)). We observed both coding (ES ex8) and noncoding (ES ex4) ES DAS variants, but the former was rather rare (PSI < 0.1), so we disregarded it.
Tanc2 codes for a synaptic scaffold protein that interacts and co-localizes with multiple postsynaptic density proteins in dendrites to regulate the dendritic spines and excitatory synapse formation [
48].
Figure 12 shows the plots of the distribution of junction reads across the samples inferred by rMATs software.
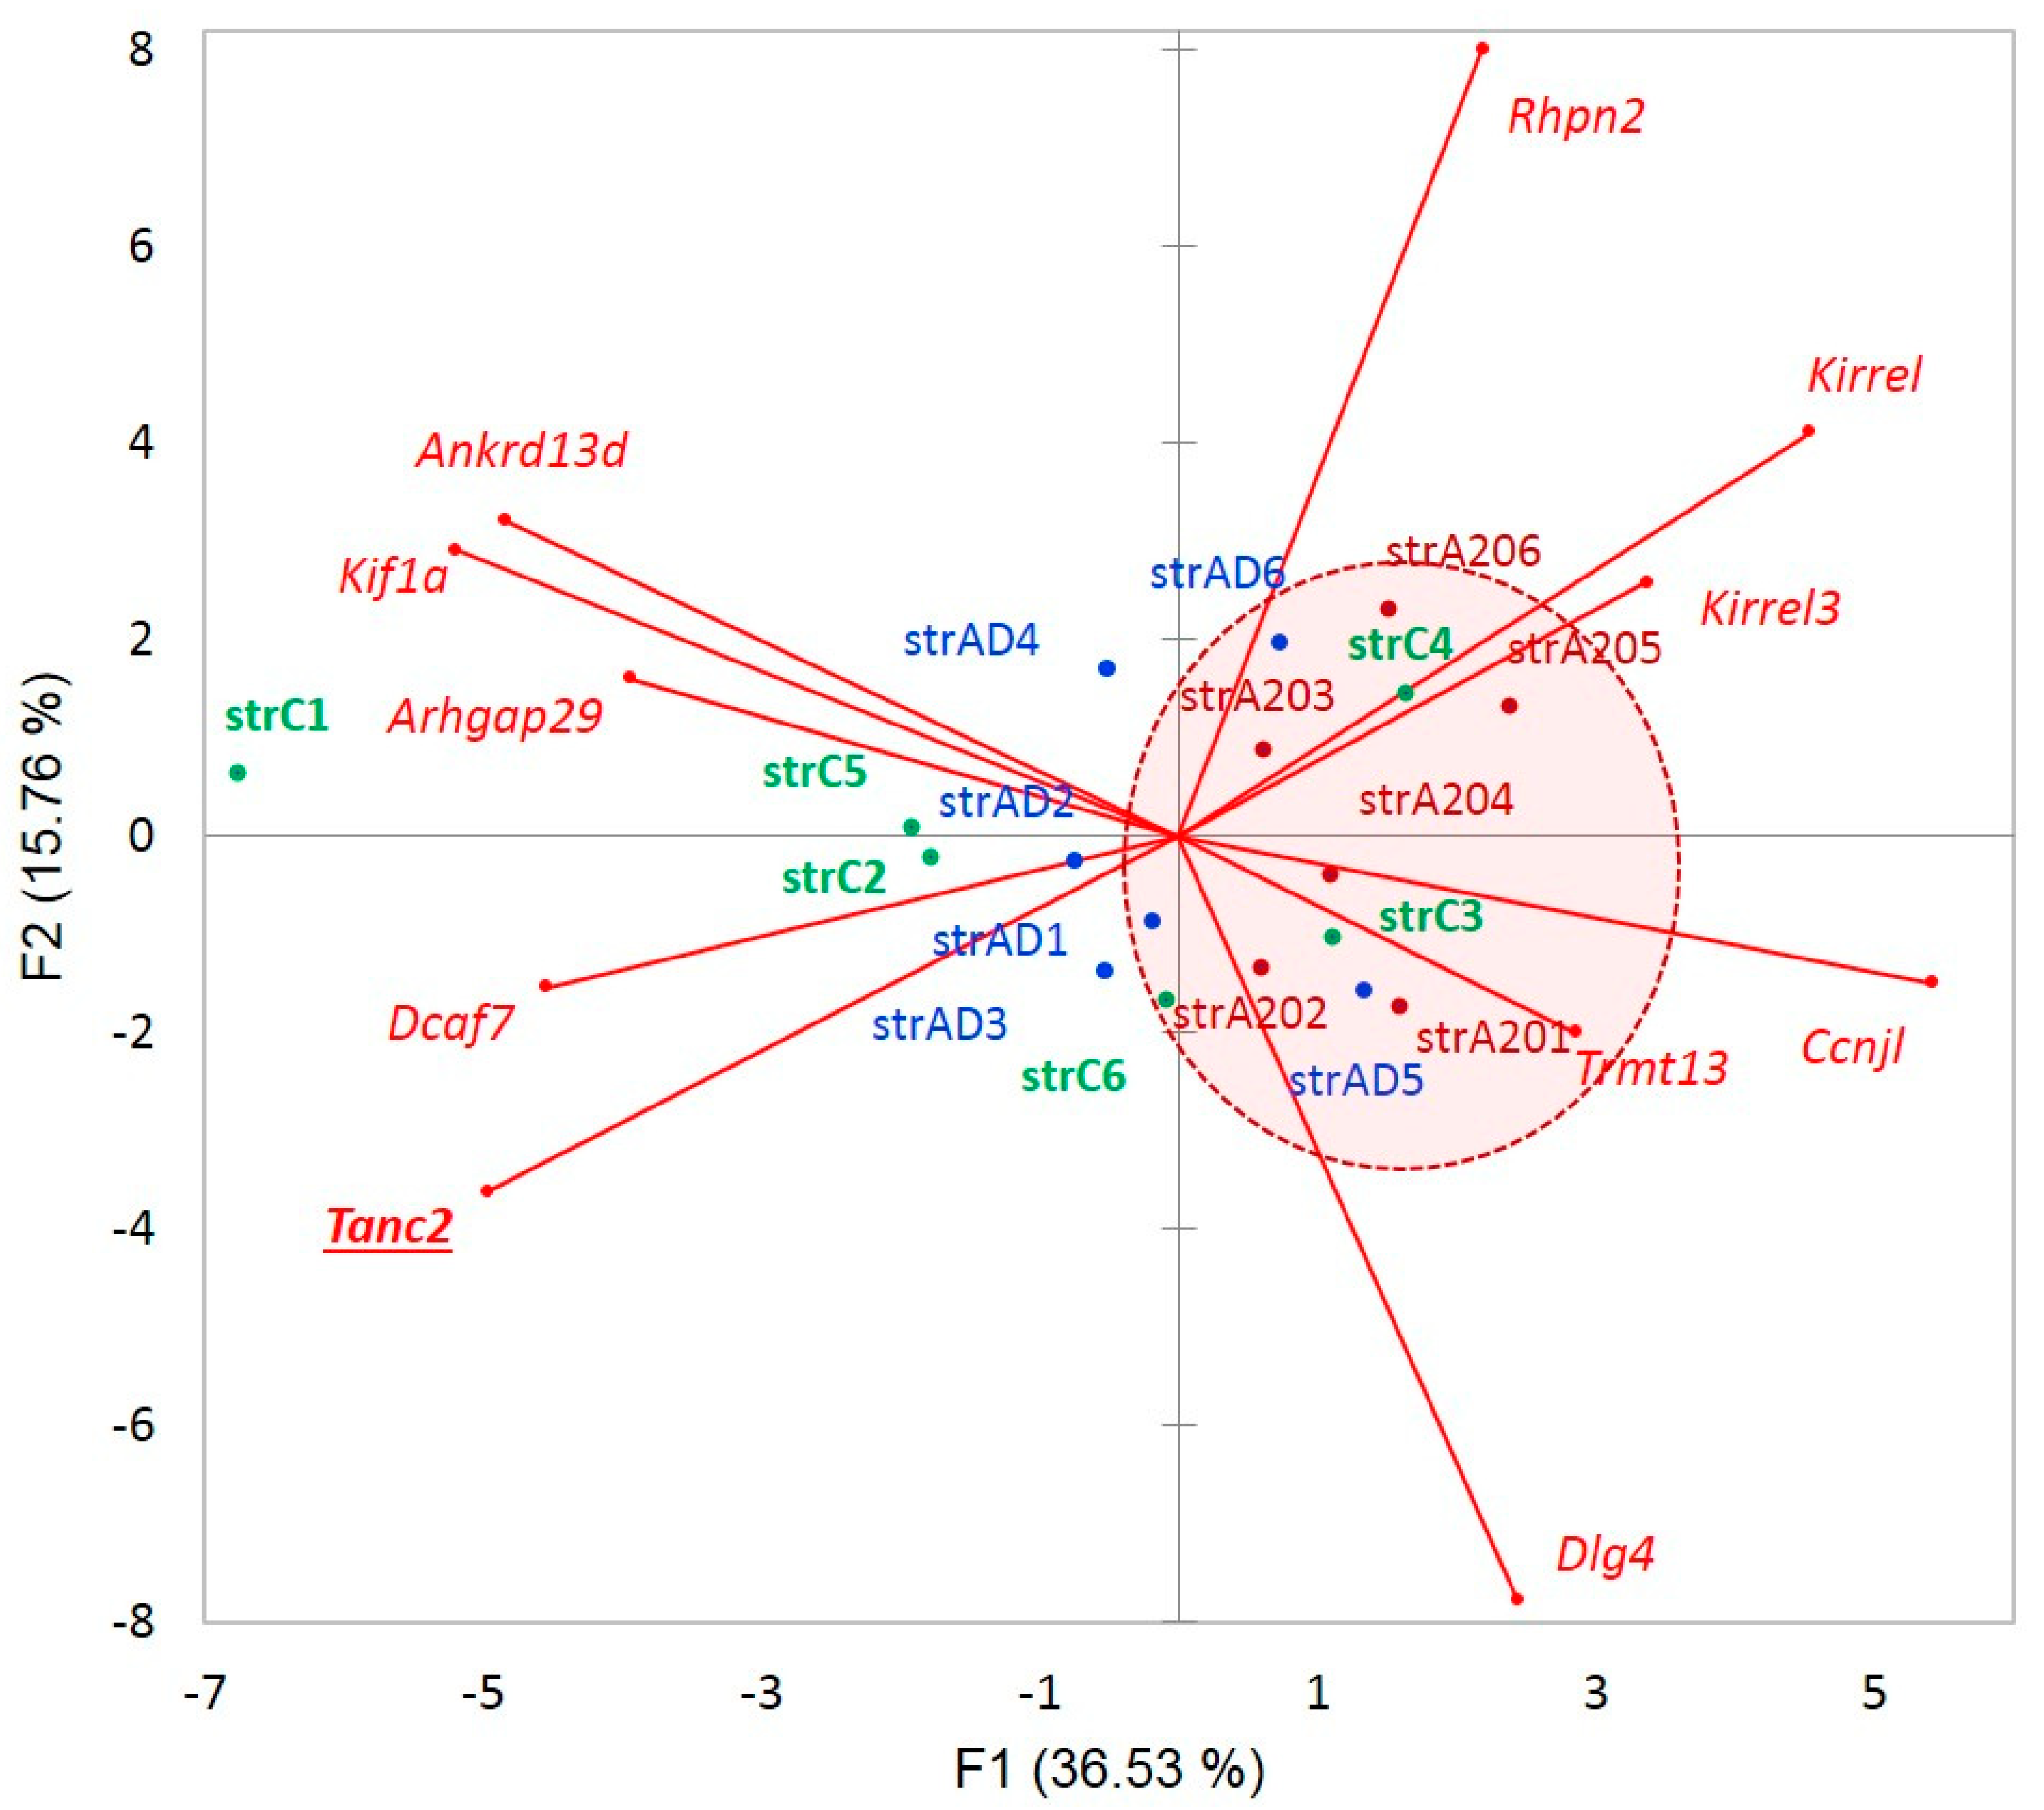
Figure 13 shows the context of expression gradients in the network expansion of
Tanc2 gene with regard to the samples. We may see nonrandom clustering of the aggressive mice abandoning
Tanc2 expression, implying the specific dendrite contraction in the aggressive mice, which complies with the structural rearrangement of synapses in aggressive mice, earlier reported in our analysis [
4]. On the contrary, we see a certain elevation in
Tanc2 expression in the AD mice, implying intensive regeneration of the synaptic architecture dynamics. Note that the apparently dopaminoceptive synaptic genes in A20 manifest a robust performance featured by
Dlg4,
Kirrel, and
Kirrel3 genes [
4].
Figure 12 and
Figure 13 suggest that although the skipped isoform expression is apparently rather background and homeostasis-mediated across the samples (
Figure 12), the expression augments in AD/attenuates in A20 and the minor skipped isoform abrogates in both, leading to a significant alteration in the splicing pattern. It points to the altered overall gene network expression, seen in
Figure 13. Thus, certain NMD-mediated DAS events may hint that the corresponding particular gene networks are affected.
Thus, we can infer that the synapse structural plasticity and chromatin remodeling system (
Figure 11) are the most AS-enhanced in the brain-related maintenance mechanisms among the DAS ES genes.
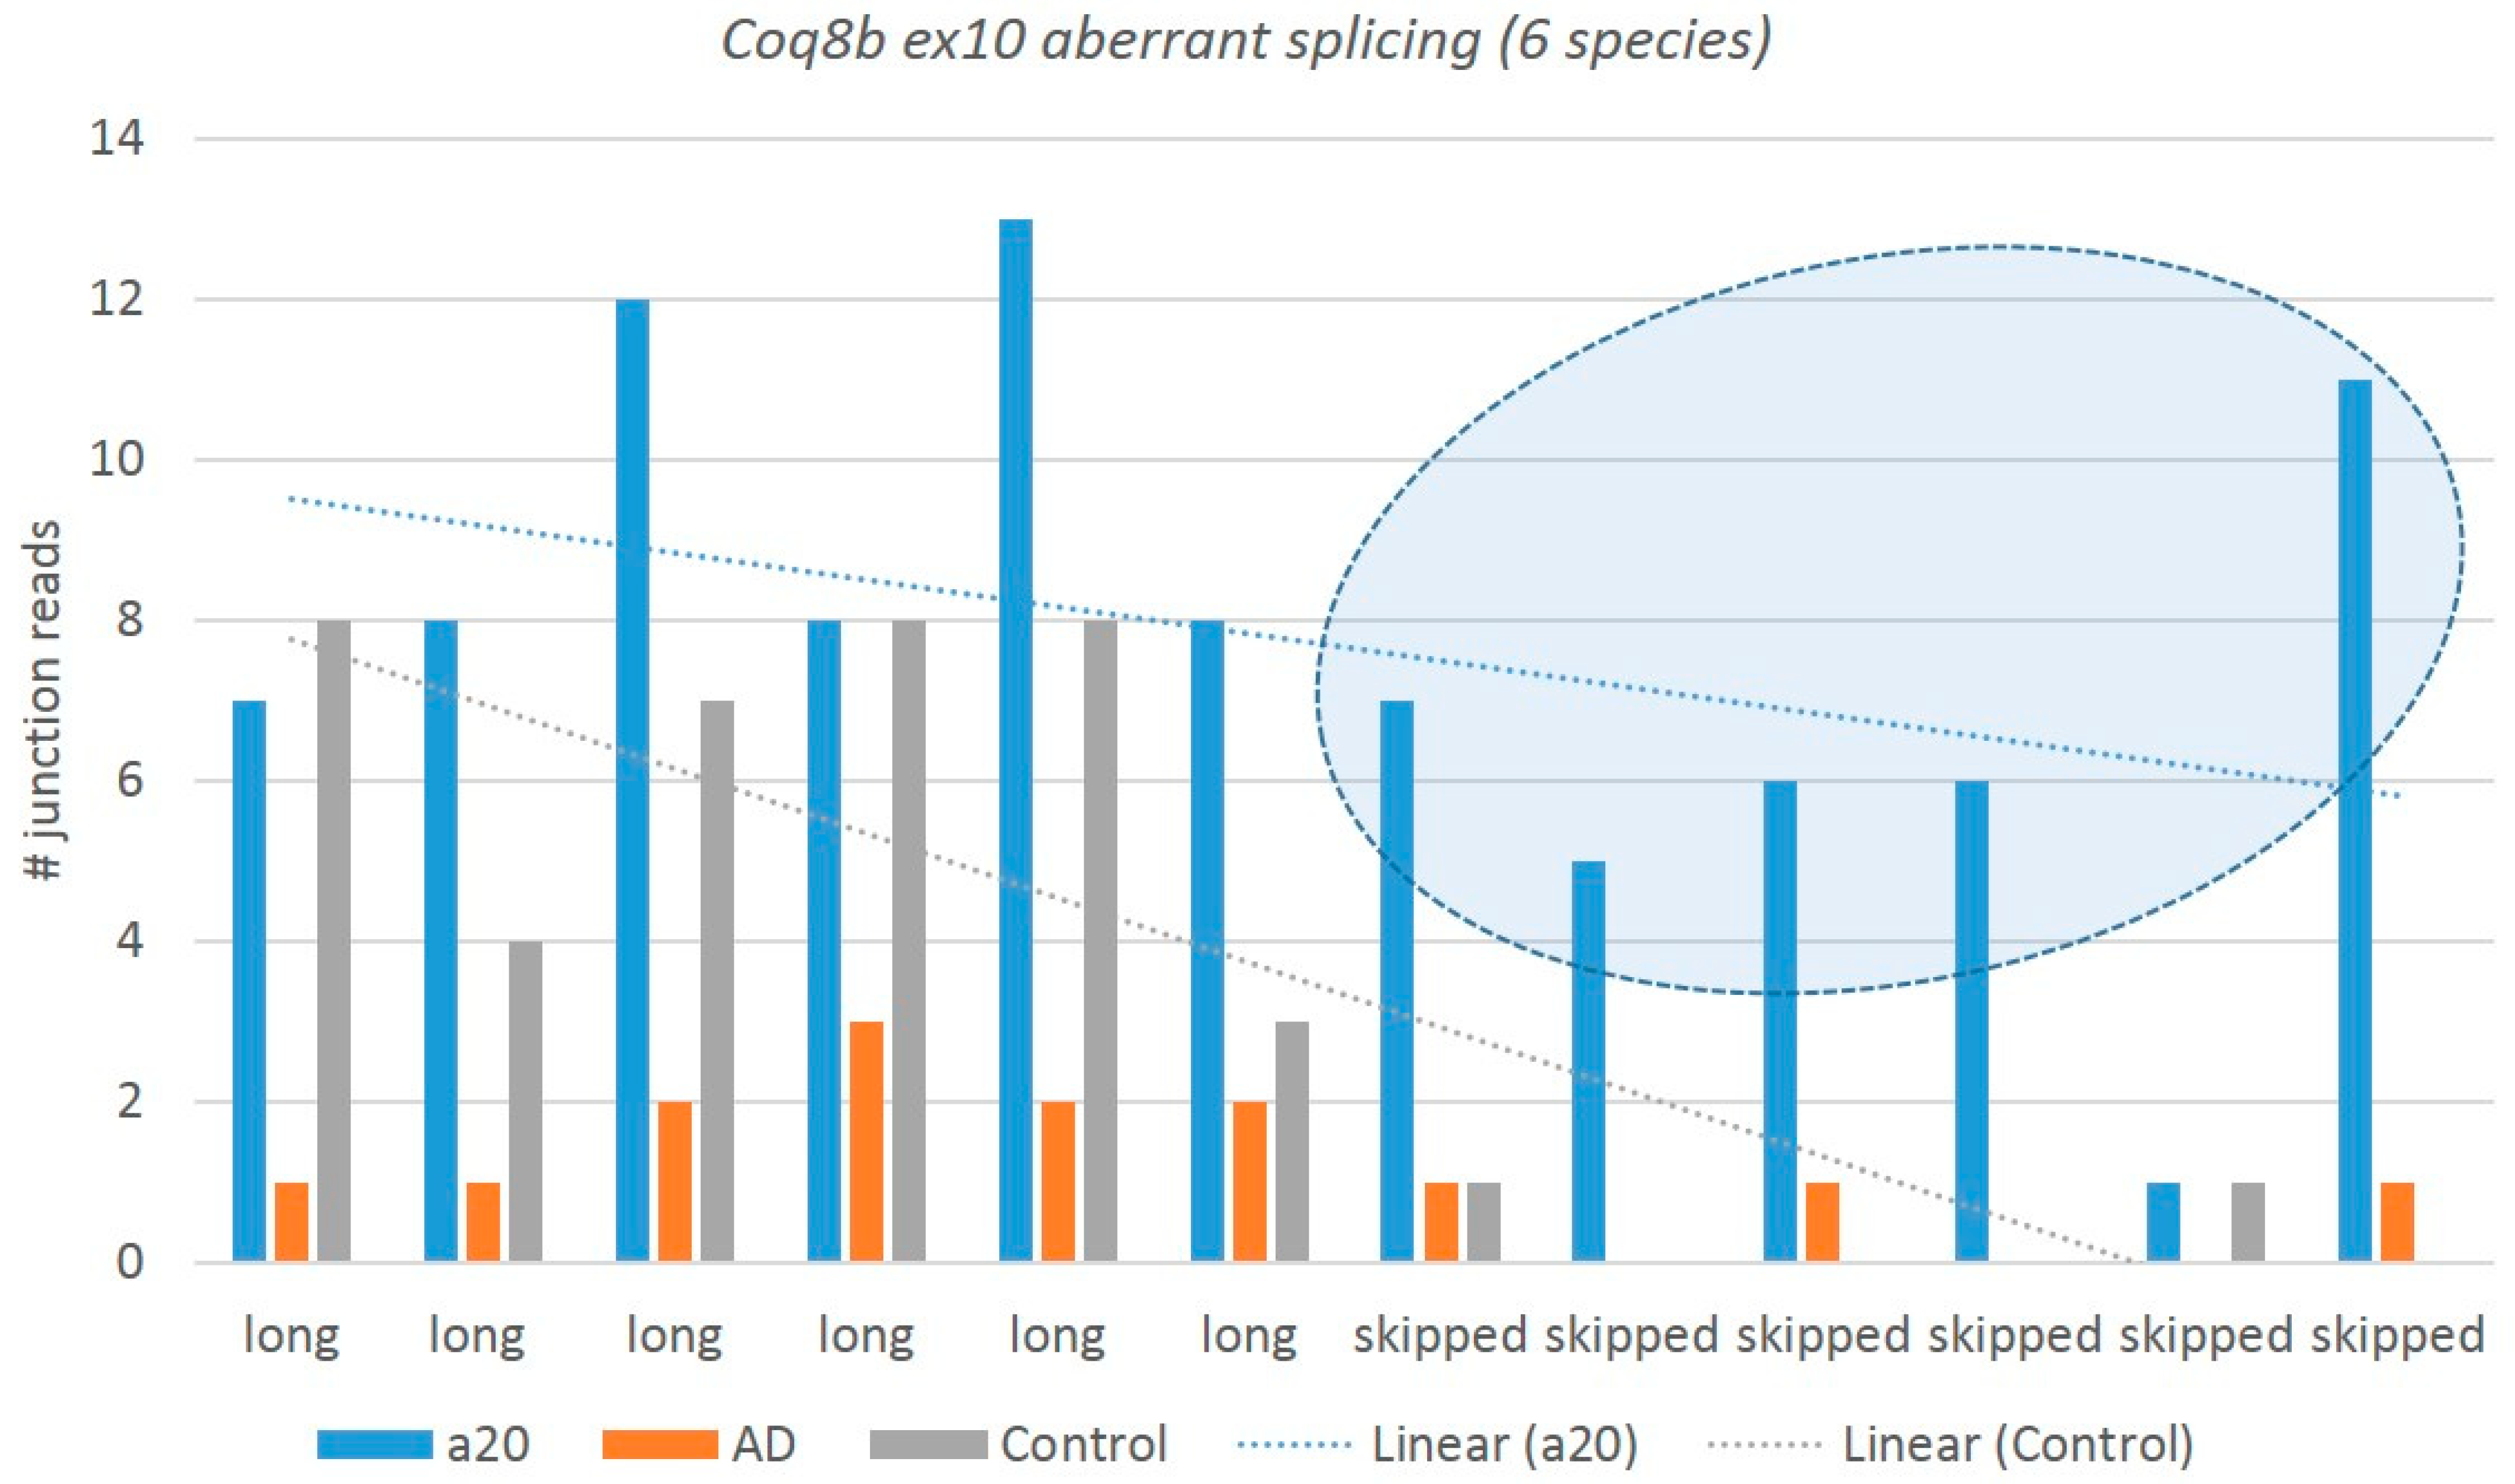
3.3.2. Nonproductive Splicing of Mitochondrial Kinase Coq8b in Aggressive Mice
We observed a dramatic elevation in the aberrant coding exon 10 skipping (94 nt) in an evolutionary conserved
Coq8b (
Adck4) gene (atypical kinase COQ8B, mitochondria; 25 kbp locus length), not previously annotated in any public databases, expressed specifically in the aggressive mice (
Figure 14). It follows the overall increase in the
Adck4 expression in the aggressive group (9 FPKM) as compared with the AD/control (8.7 FPKM), not reaching a statistical DEG level. The exon 10 skipping leads to a premature termination codon (PTC) following an NMD. The expression of aberrant isoforms is vanishingly small in the control mice as compared with the aggressive ones: two junctions vs. 36 in the A20 mice (
Figure 14). It may be a consequence of the
Coq8b overexpression in A20. Note that this exon comprises at least three conserved missense variants: rs3388875016, rs3388890121, and rs13460395 (European Variant Archive (EVA) release 3).
Along with the
Coq10a and
Coq10b genes, the
Coq8b gene facilitates the biosynthesis of coenzyme Q10 (ubiquinone-10), an essential lipid-soluble electron transporter for aerobic cellular respiration [
49]. In mitochondria, coenzyme Q10 plays a key role in oxidative phosphorylation. Coenzyme Q10 is also involved in pyrimidine synthesis and ATP and GTP production in the cell [
49]. In the cell membranes, coenzyme Q10 acts as an antioxidant, protecting cells from the damage caused by unstable oxygen-containing molecules (free radicals), which are known to cause disorders due to primary coenzyme Q10 deficiency [
49].
In mammals, the respiratory complex I (NADH: ubiquinone oxidoreductase) of the mitochondrial respiratory chain has 38 subunits; the NMD mechanism maintains the homeostatic balance along with a wide range of coding isoforms [
50,
51]. It catalyzes the transfer of electrons from NADH to coenzyme Q10 (
Coq10), which translocates protons across the inner mitochondrial membrane.
Herein, we report a new
Coq8b noncoding isoform with skipped exon 10 as a highly consistent NMD event in the DS of the aggressive group (
Figure 14). Two redox multisubunit complexes, namely, complex I (
CoI) and coenzyme Q substrate synthesis (
Coq10), feature highly dynamic RNA SFs at the stage of RNA processing [
51].
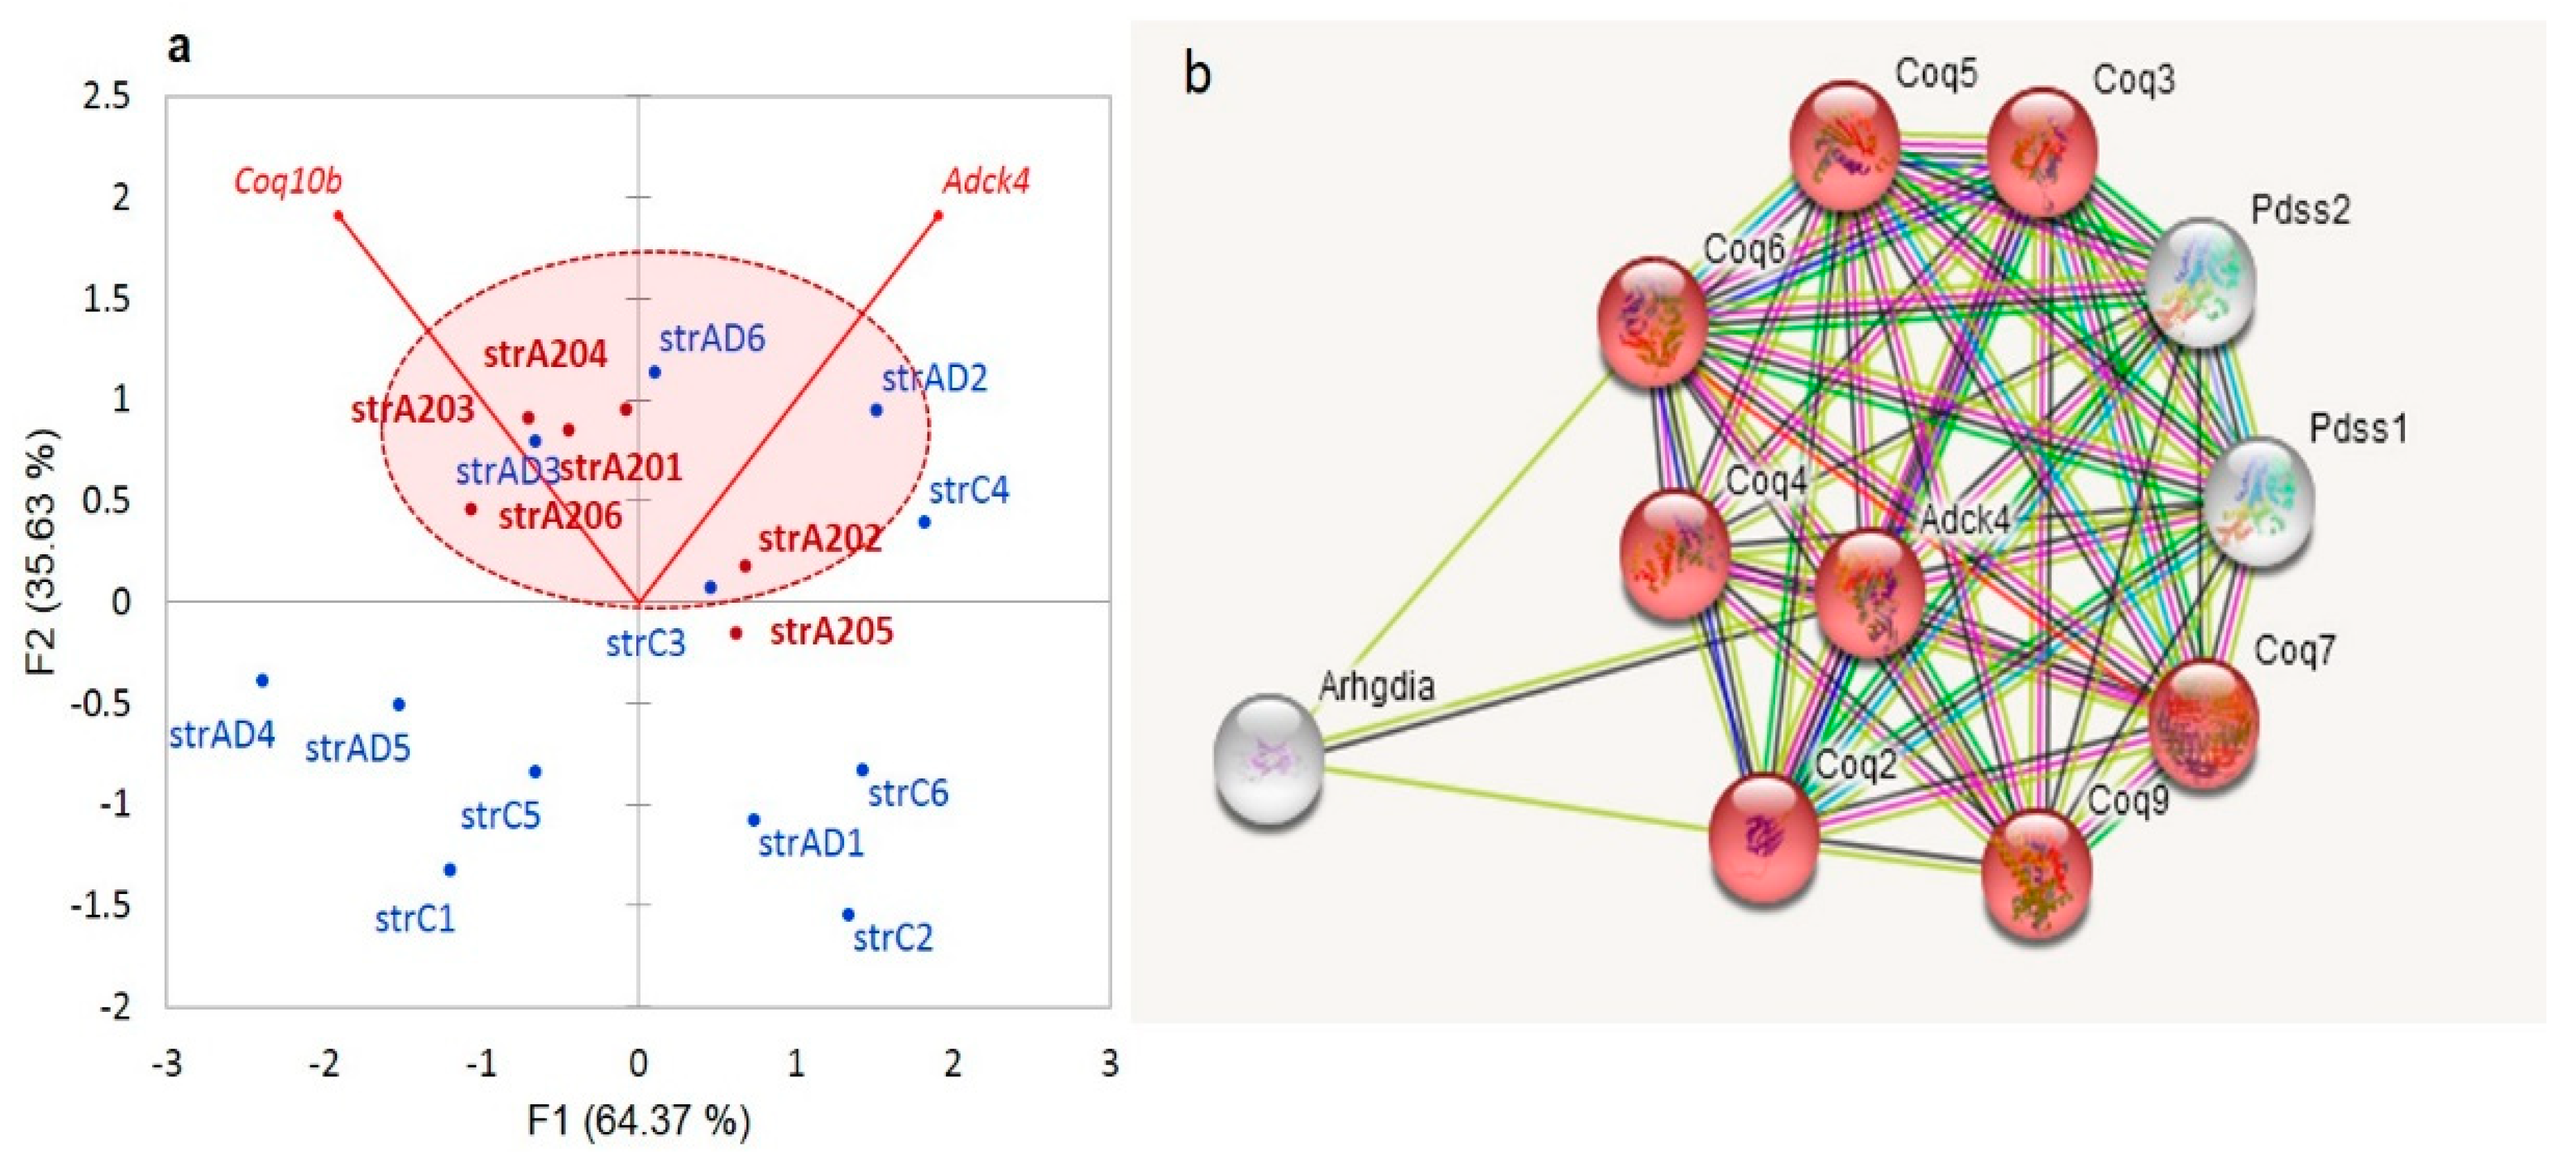
We observe an elevation in the redox-related genes in the A20 mice, as is shown in
Figure 15a. Apart from the
Coq10 genes, the synthesis of ubiquinone requires a set of other mitochondrial genes (
Figure 15b).
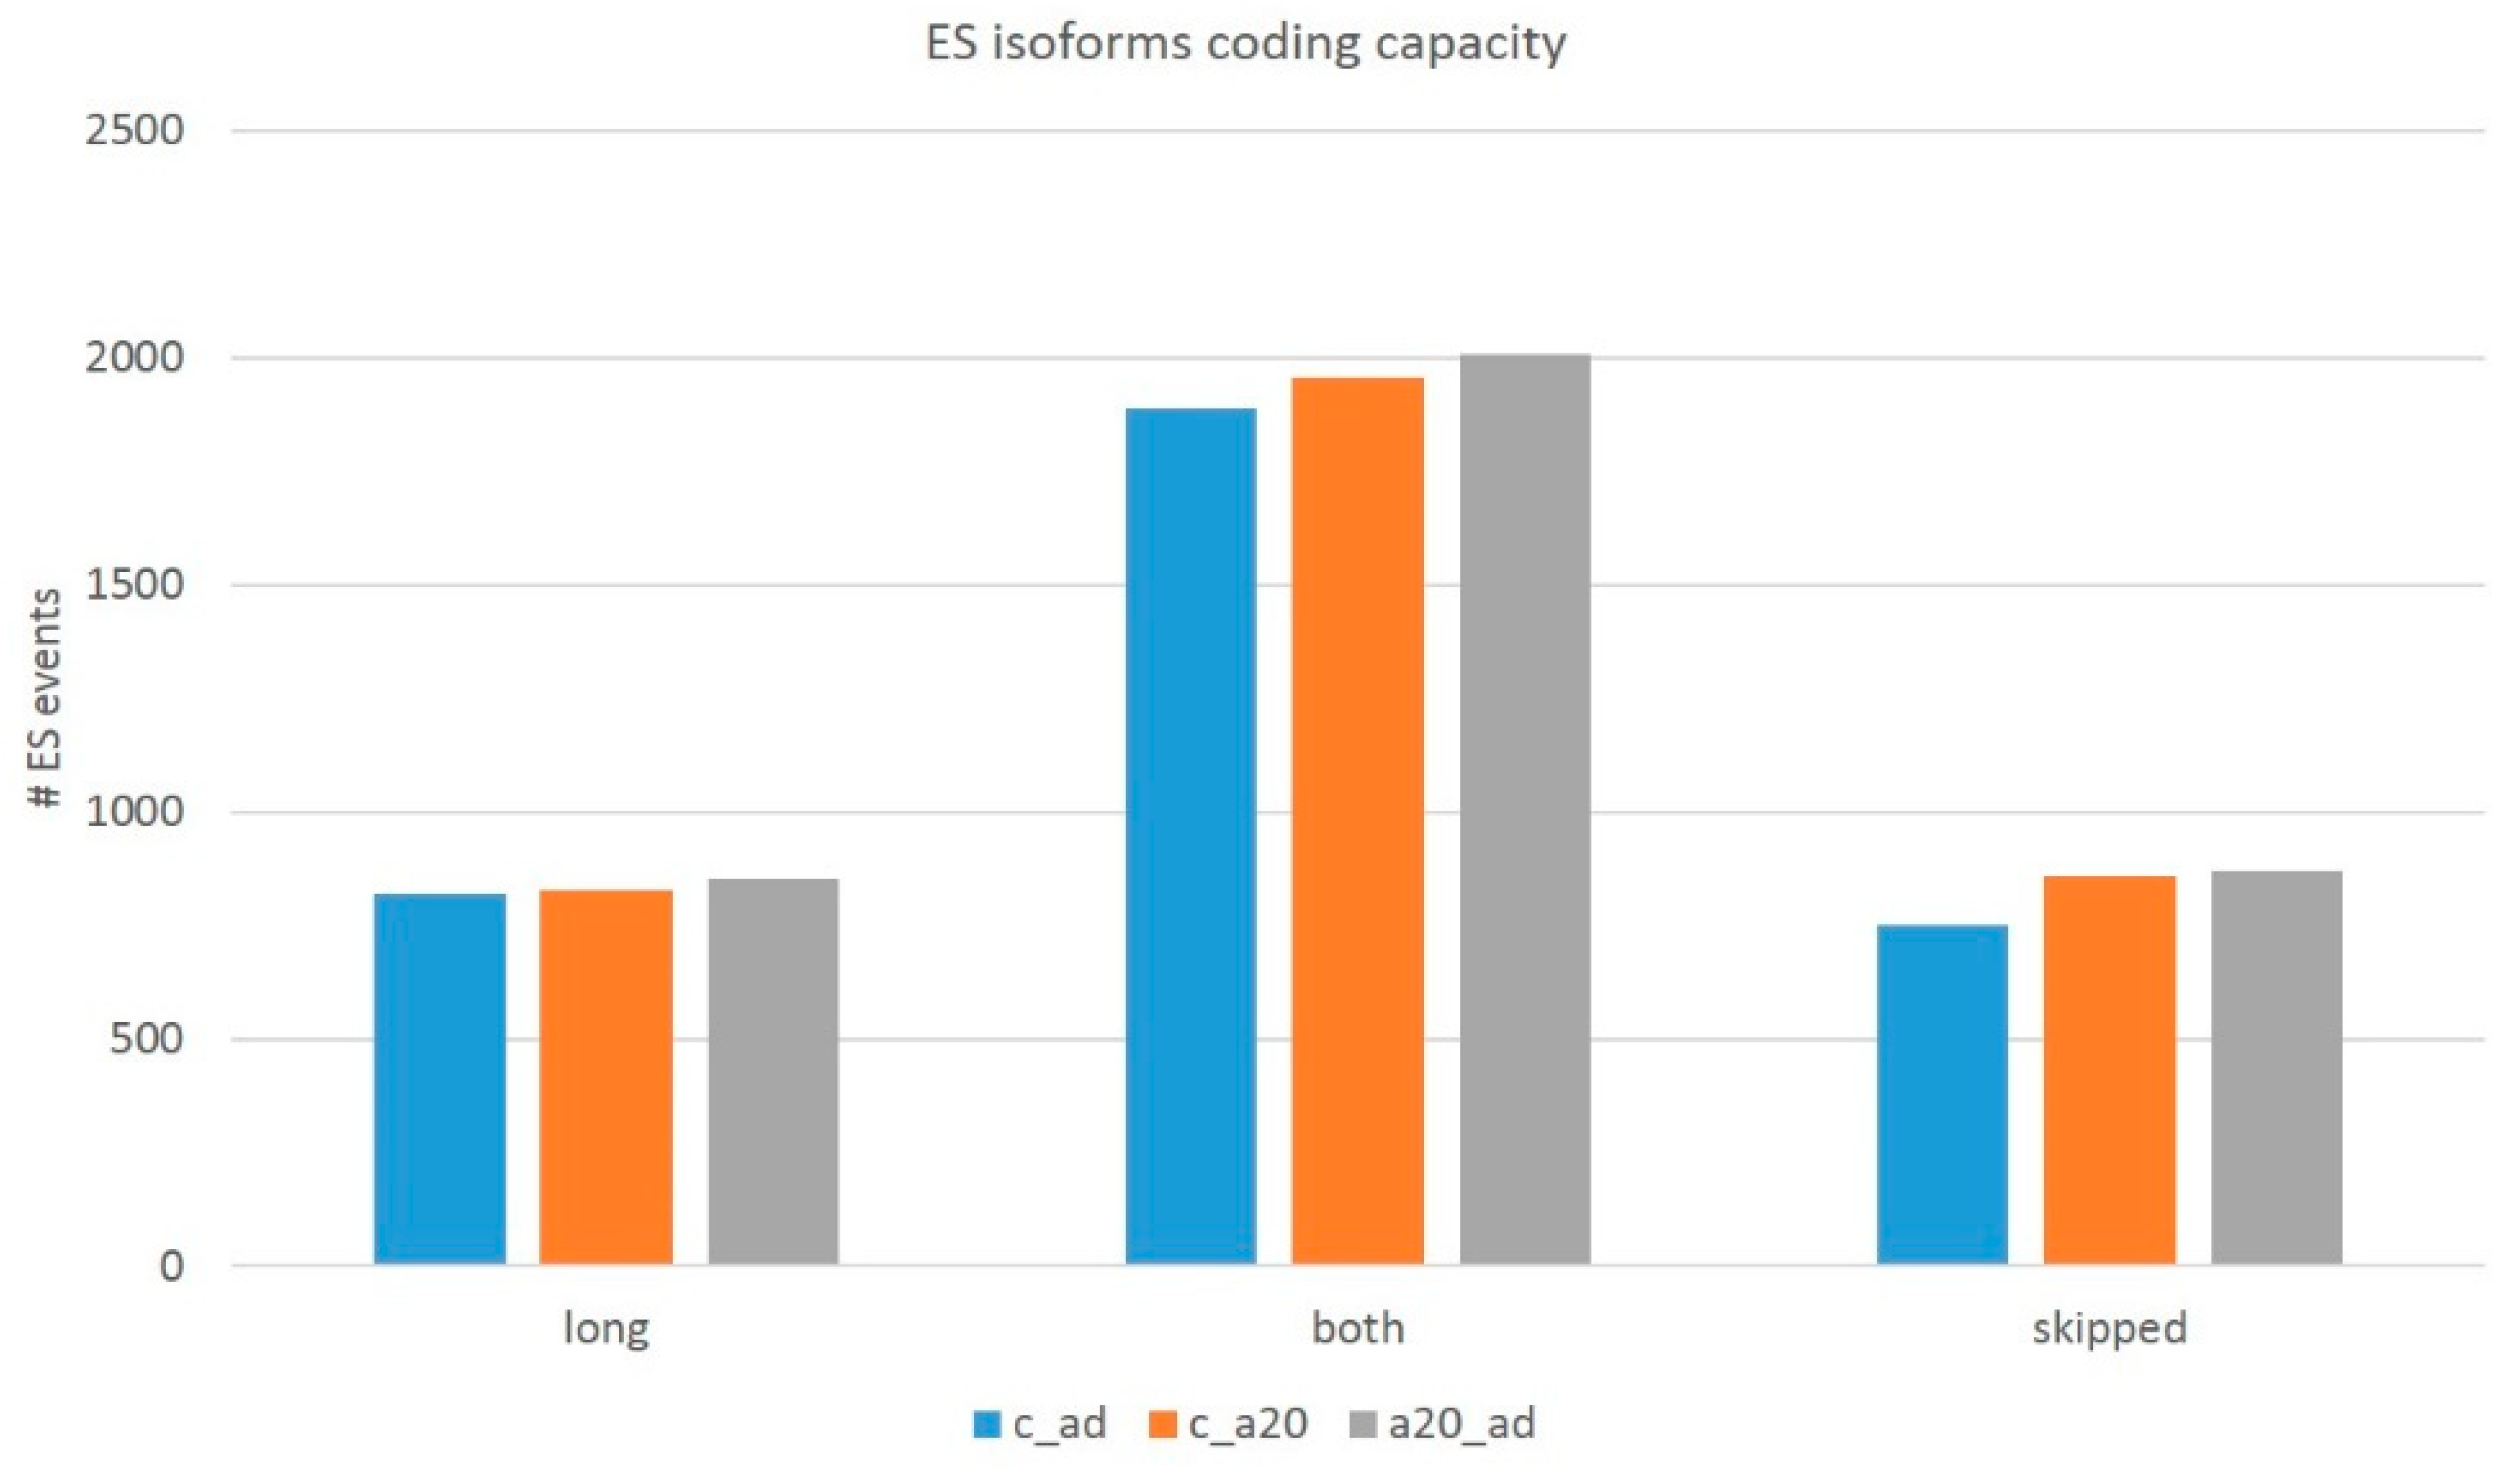
3.4. Assessment of the Overall AS-Mediated Proteome Plasticity in the DS
Notwithstanding a small number of DAS genes (in total, 91 DAS;
Table S4d), we addressed the overall pool of AS ES coding/NMD events (about 7000 per comparison) by filtering (see Methods) to assess the protein-coding competent events. We performed the procedure for both the exon triplets (long isoform) and the exon duplets (skipped isoform). When assessing the coding events, we found out that the number of ES events with either/both coding isoforms account for approximately a half (
Table 2 and
Table 3) of the total ES events listed in
Table 1 due to the UTR ES exons. We also observed a range of three-set exons employed in multiple tandem splice sites (TASS; ‘bleeding’ 3′/5′ exon flanks; [
52]; the mode is three overlapping reads per sample), which, as a rule, display a low isoform ratio and disrupt ORF.
We filtered those out by a threshold on the ES junction coverage to be more than five reads per ES event. Finally, we computed the corrected number of the whole transcriptome coding AS ES events, listed in
Table 4.
In this way, we ascertained the transcriptome-wise distribution of two basic types of ES events (
Table 4 and
Figure 16): (a) AS2 genuine alternative coding isoforms (category of ‘both’ isoforms) and (b) NMD-associated regulatory ES events, when either isoform (long/skipped) is noncoding. Further, we will pursue to ascertain the functional categories of the genes with AS2-coding ES events and NMD-associated ones.
3.4.1. Assessing the Distribution of the Major Splicing Isoforms in the Gene Pool
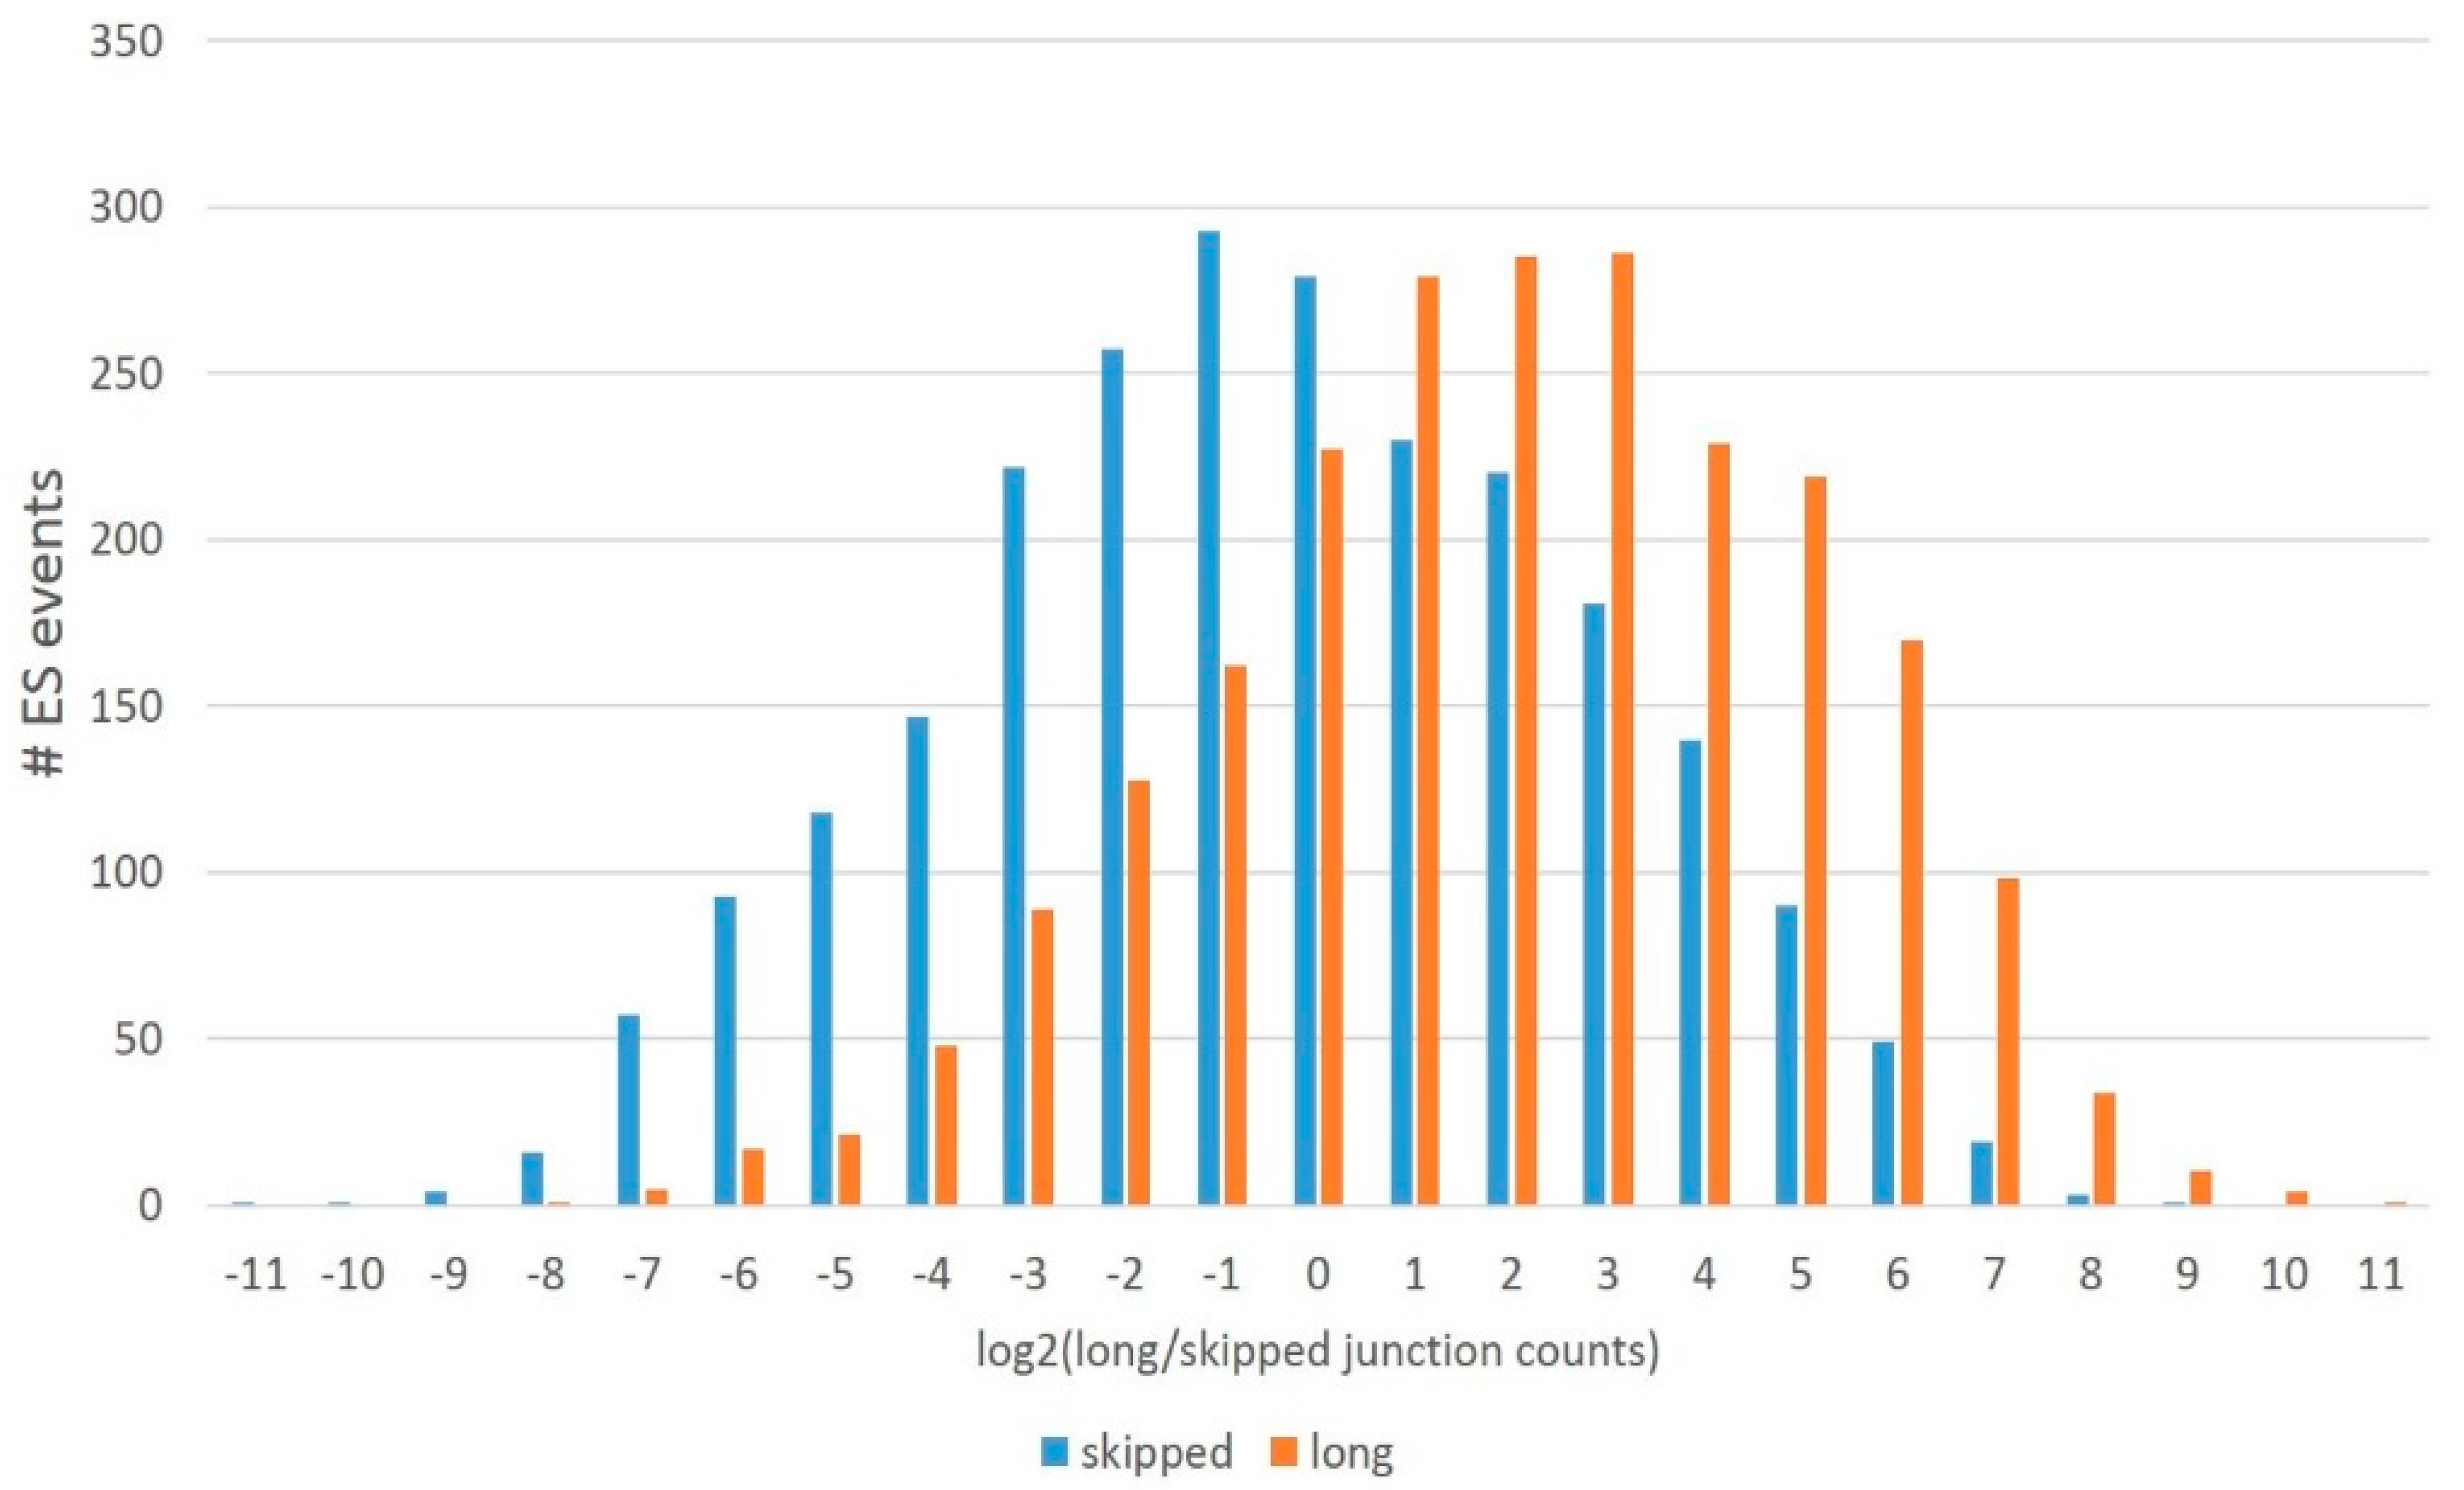
Based on the protein-competent isoforms, we assessed their expression throughout the ES skipping data across all sets. We found out that a long isoform is generally preferable in the DS proteome (
Figure 17) since a skipped isoform average/mode is approximately log2 = –1, while a long isoform maintains the mode around log2 = 2 (
Figure 2), implying a threefold higher long isoform expression average.
3.4.2. Assessment of Gene Families for Coding AS Events
We also assessed the statistics of most ES events across the abundant gene families listed in
Table 5.
While the SLC family is the top by the number of genes, we may see that the highest ES skipping rate families (number of ES events per gene) are Ank, Cam, Kid, and Myo.
Another statistic of interest is the replicability of the ES events across the C_A20 and C_AD compared groups (
Table 6). We observed rather consistent numbers of the coding ES events per family therein.
While the AS plasticity analysis of the overall gene families in the transcriptome is beyond the scope of our paper on the analysis of DAS genes, it emphasizes the excess of ES events prevalent in the neuron-specific genes.
3.4.3. Gene-Wise Comparison of the Overall AS Rate
Based on three pairwise comparisons, we outlined the genes that manifested the maximum protein coding variation starting from at least four AS ES events (AS2, both isoforms coding;
Table S6a) and those that manifested the most NMD-related ES events (either isoform is coding;
Table S7a) yielding at least two NMD isoforms per gene. We termed the lists of these genes as ‘AS2/NMD ES enriched genes’.
There were no NMD abundant genes with more than five NMD ES events per gene (
Table S7a), while AS2 abundant genes displayed the top 12 coding isoforms per gene (
Table S6a). Therefore, we used a lower threshold of four isoforms per gene for the AS2 samples and two isoforms for the NMD samples.
Note that all three lists of comparisons (C_A20, C_AD, and AD_A20) are 82% identical, reflecting that the selected top-ranking genes maintain AS as a key plasticity factor in their working routine (
Table S5a).
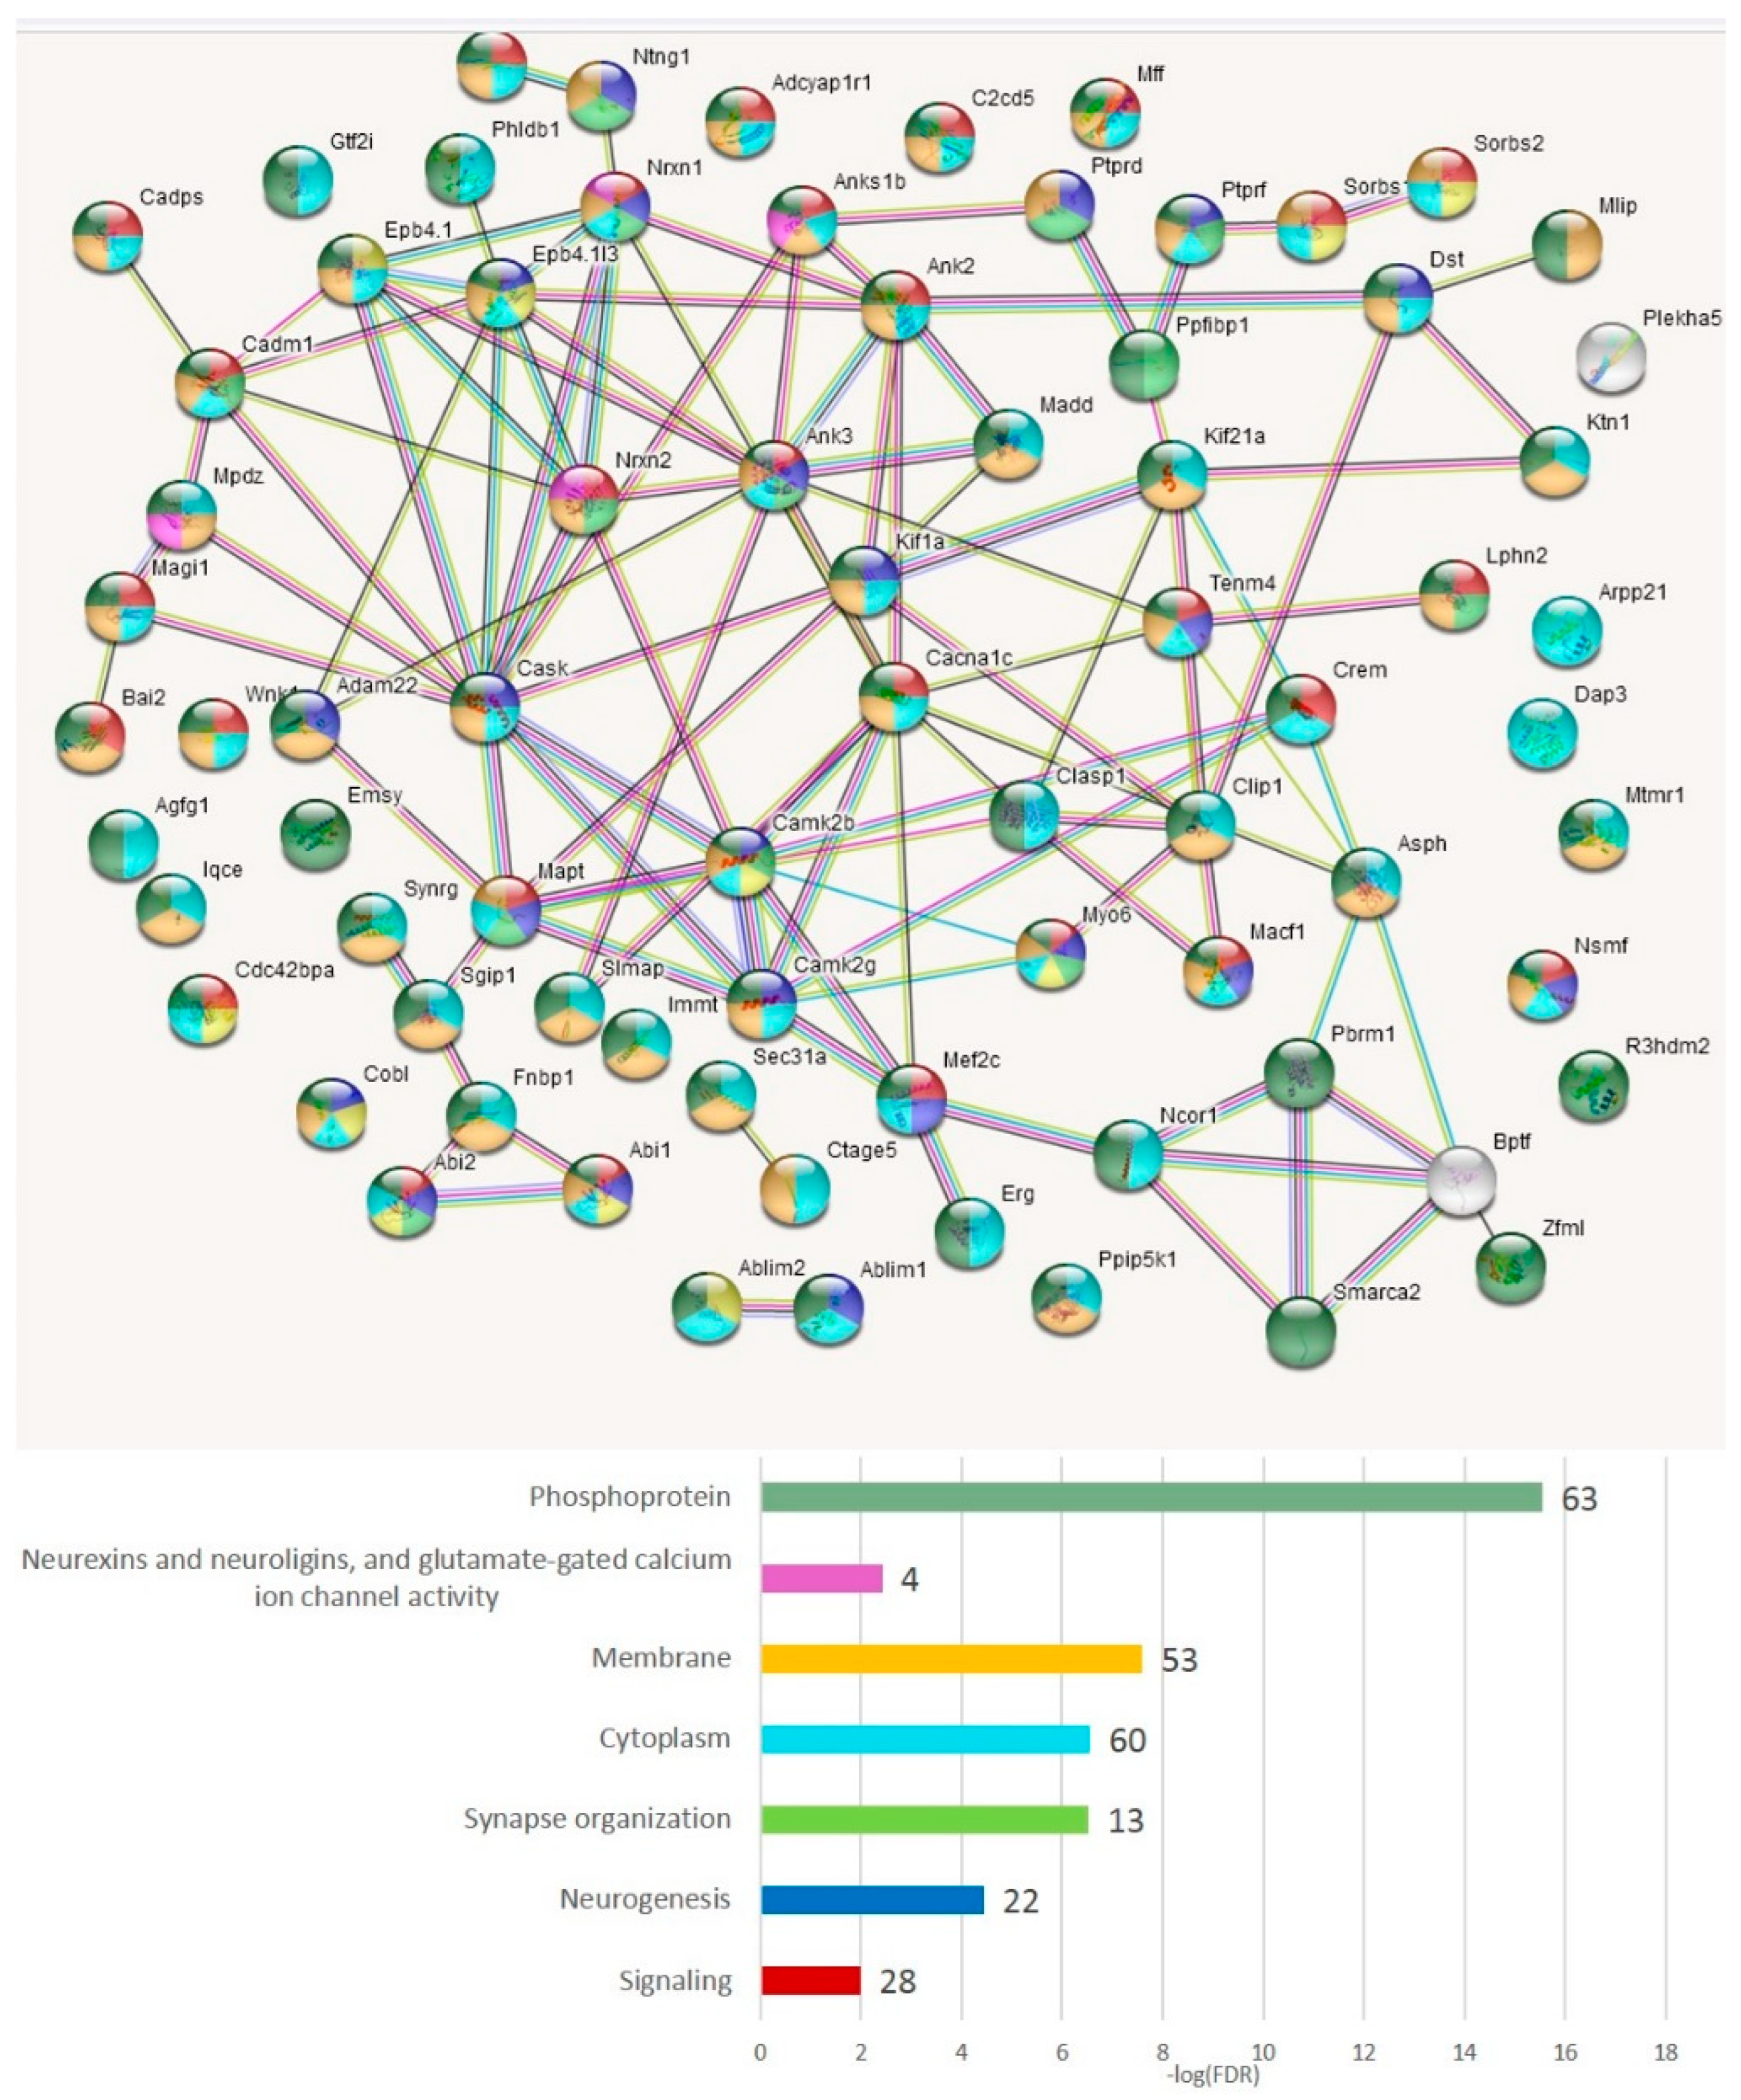
3.4.4. AS2 Genes Top Enriched with ES Events (Both Isoforms)
Table S6a–d show the lists of genes and annotation of the GO terms per comparison for readers to scan, but we chose the merged gene list as the main target. In total, 75 genes (
Table S6e and
Figure 18) manifest the maximum protein coding AS2 ES events per gene (from ten to four,
Table S6a). We applied the GO enrichment annotation routine (string-db.org) to elucidate the enrichment of the major functions in this pool (
Table S6f). We obtained a highly interconnected network (
Figure 18) by string-db.org suite with the number of edges of 20 vs. the expected 7 ones (
p < 1 × 10
−16). Note that 63 genes were annotated as ‘phosphoprotein’ (FDR < 1.7 × 10
−14;
Figure 18). The ‘synapse’ termed genes comprised 35 genes (FDR < 5.3 × 10
−18;
Table S6f).
As is evident from
Figure 18, the most connected are the synaptic and other membrane-associated genes, including NOVA SFs regulated ones (
Table S6f). Inferring from the GO annotation, the vast majority of AS2 ES-rich genes are related to the membrane/cytoskeleton (
Table S6f).
3.4.5. Genes with the NMD-Related Top Abundant ES Events
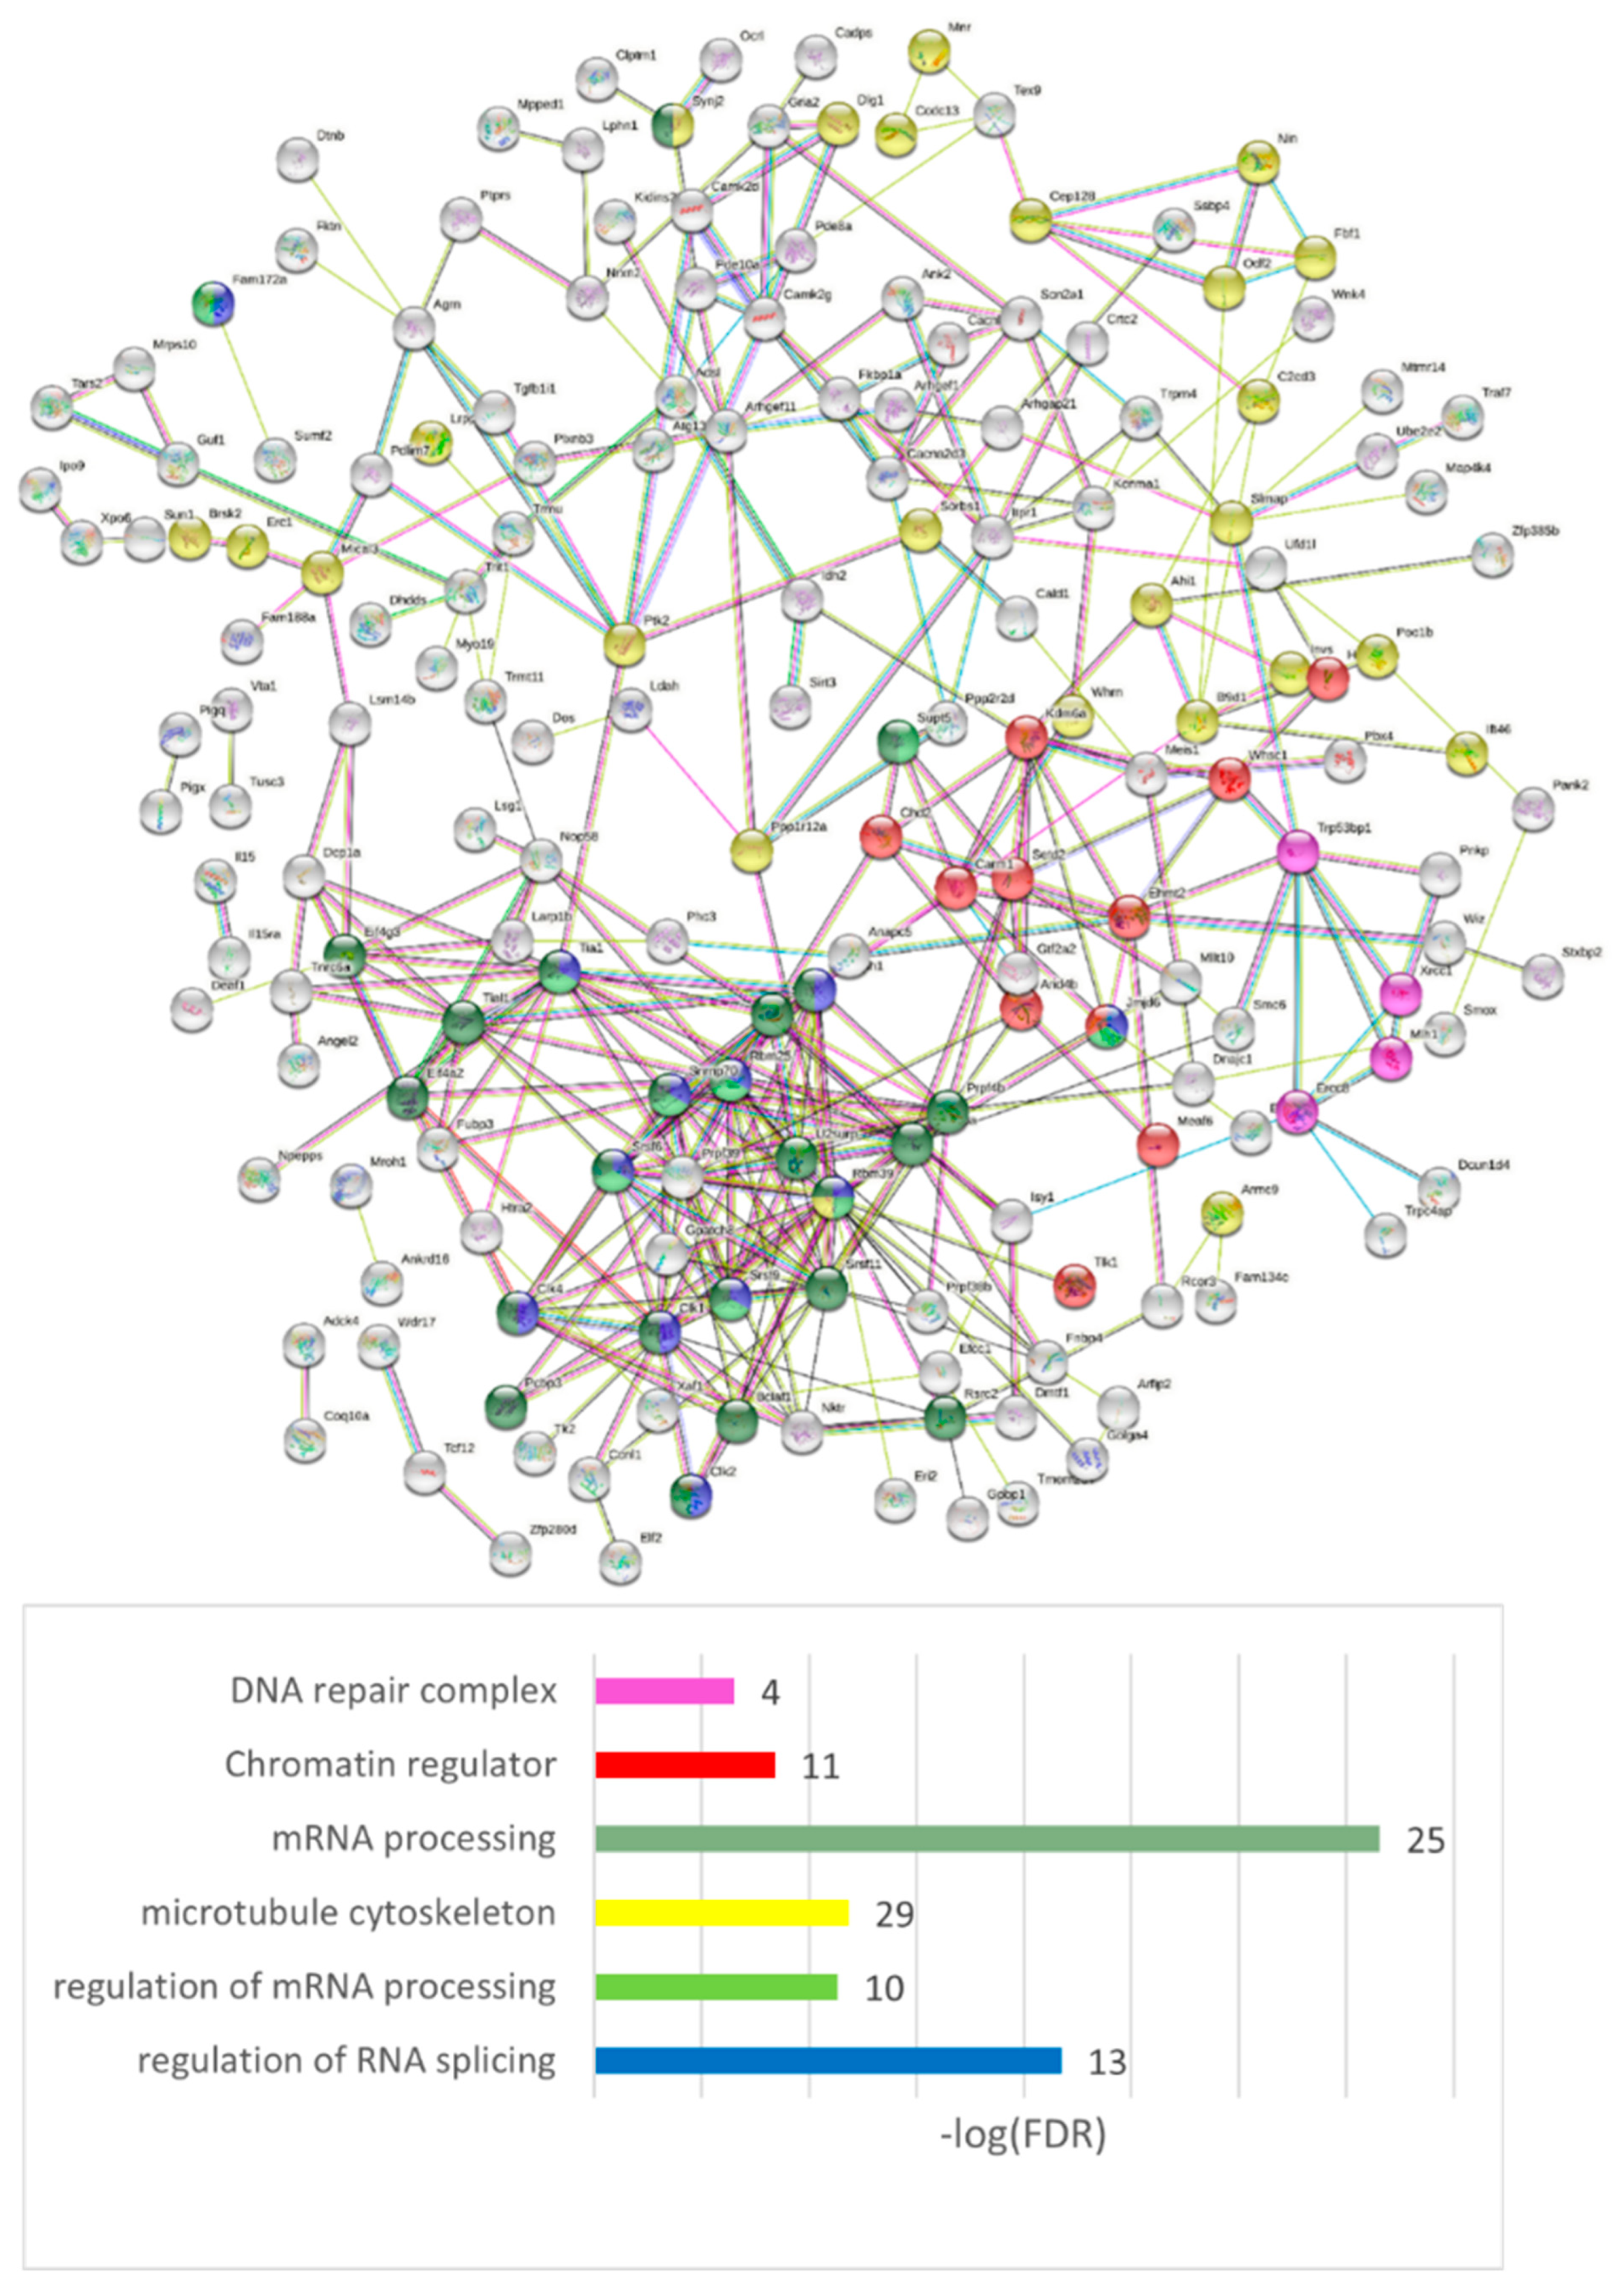
Several ES NMD exons present in a single gene may imply the instantiation of NMD events by certain SFs, pointing at multilayer gene regulation in various environments. Alternatively, several synchronically manifested NMD-associated joint ES events may lead to an overlapping protein product but, as our preliminary analysis showed, we observed no ORF coding compensation shift within a vicinity of an NMD event; as a rule, it disrupts the ORF by stop codons within a single exon following an ES NMD event. Moreover, multiple NMD exon-containing genes are not abundant; we found only approximately 50 genes with the number of ES NMD > 2 (however, 221 genes with the number of ES NMD = 2) in our three comparisons (
Table S7a). Still, the point of several gene maintaining conservative/consistent NMD exons requires further investigation.
We performed the GO annotation of 271 NMD ES abundant genes merged across three comparisons (
Table S7a), listed in
Table S7b (
Figure 19 shows the connected network), and found a striking discrepancy with the AS2 type ES abundant genes: most of them were nuclear genes.
Our analysis suggests that the NMD-related events are predominantly associated with DNA/RNA processing events. We observed the NMD ES abundant events in the nuclear genes to be highly nonrandom (GO term: ‘Nucleus’, 92 genes; FDR < 9.2 × 10
−9 vs. ‘Cytoplasm’, 117 genes; FDR < 3.4 × 10
−4;
Table S7c, ‘Compartment’), while the AS2-related splicing mode is the most represented in cytoplasmic/membrane/synapse genes (GO term: ‘Nucleus’ insignificant enrichment (FDR > 0.05); ‘Cytoplasm’, 46 genes; FDR < 1.8 × 10
−6;
Table S6f, ‘Compartment’). We assert that a significant part of the genes uses both the AS2/NMD means of regulation in both compartments, but the distinct compartment priority is statistically significant.
We observed many coding events in the chromatin regulators (see DAS genes in
Figure 11). As for the NMD ES events, we found that the histone methyl/acetyltransferases particularly intensely utilize NMD, implying a tight homeostatic coordination between the histone modification complex subunits.
Figure 20 shows 11 genes from the ‘chromatin regulator’ GO category (
Figure 19, ‘Chromatin regulator’;
Table S7c) gene network enriched in ES NMD events.
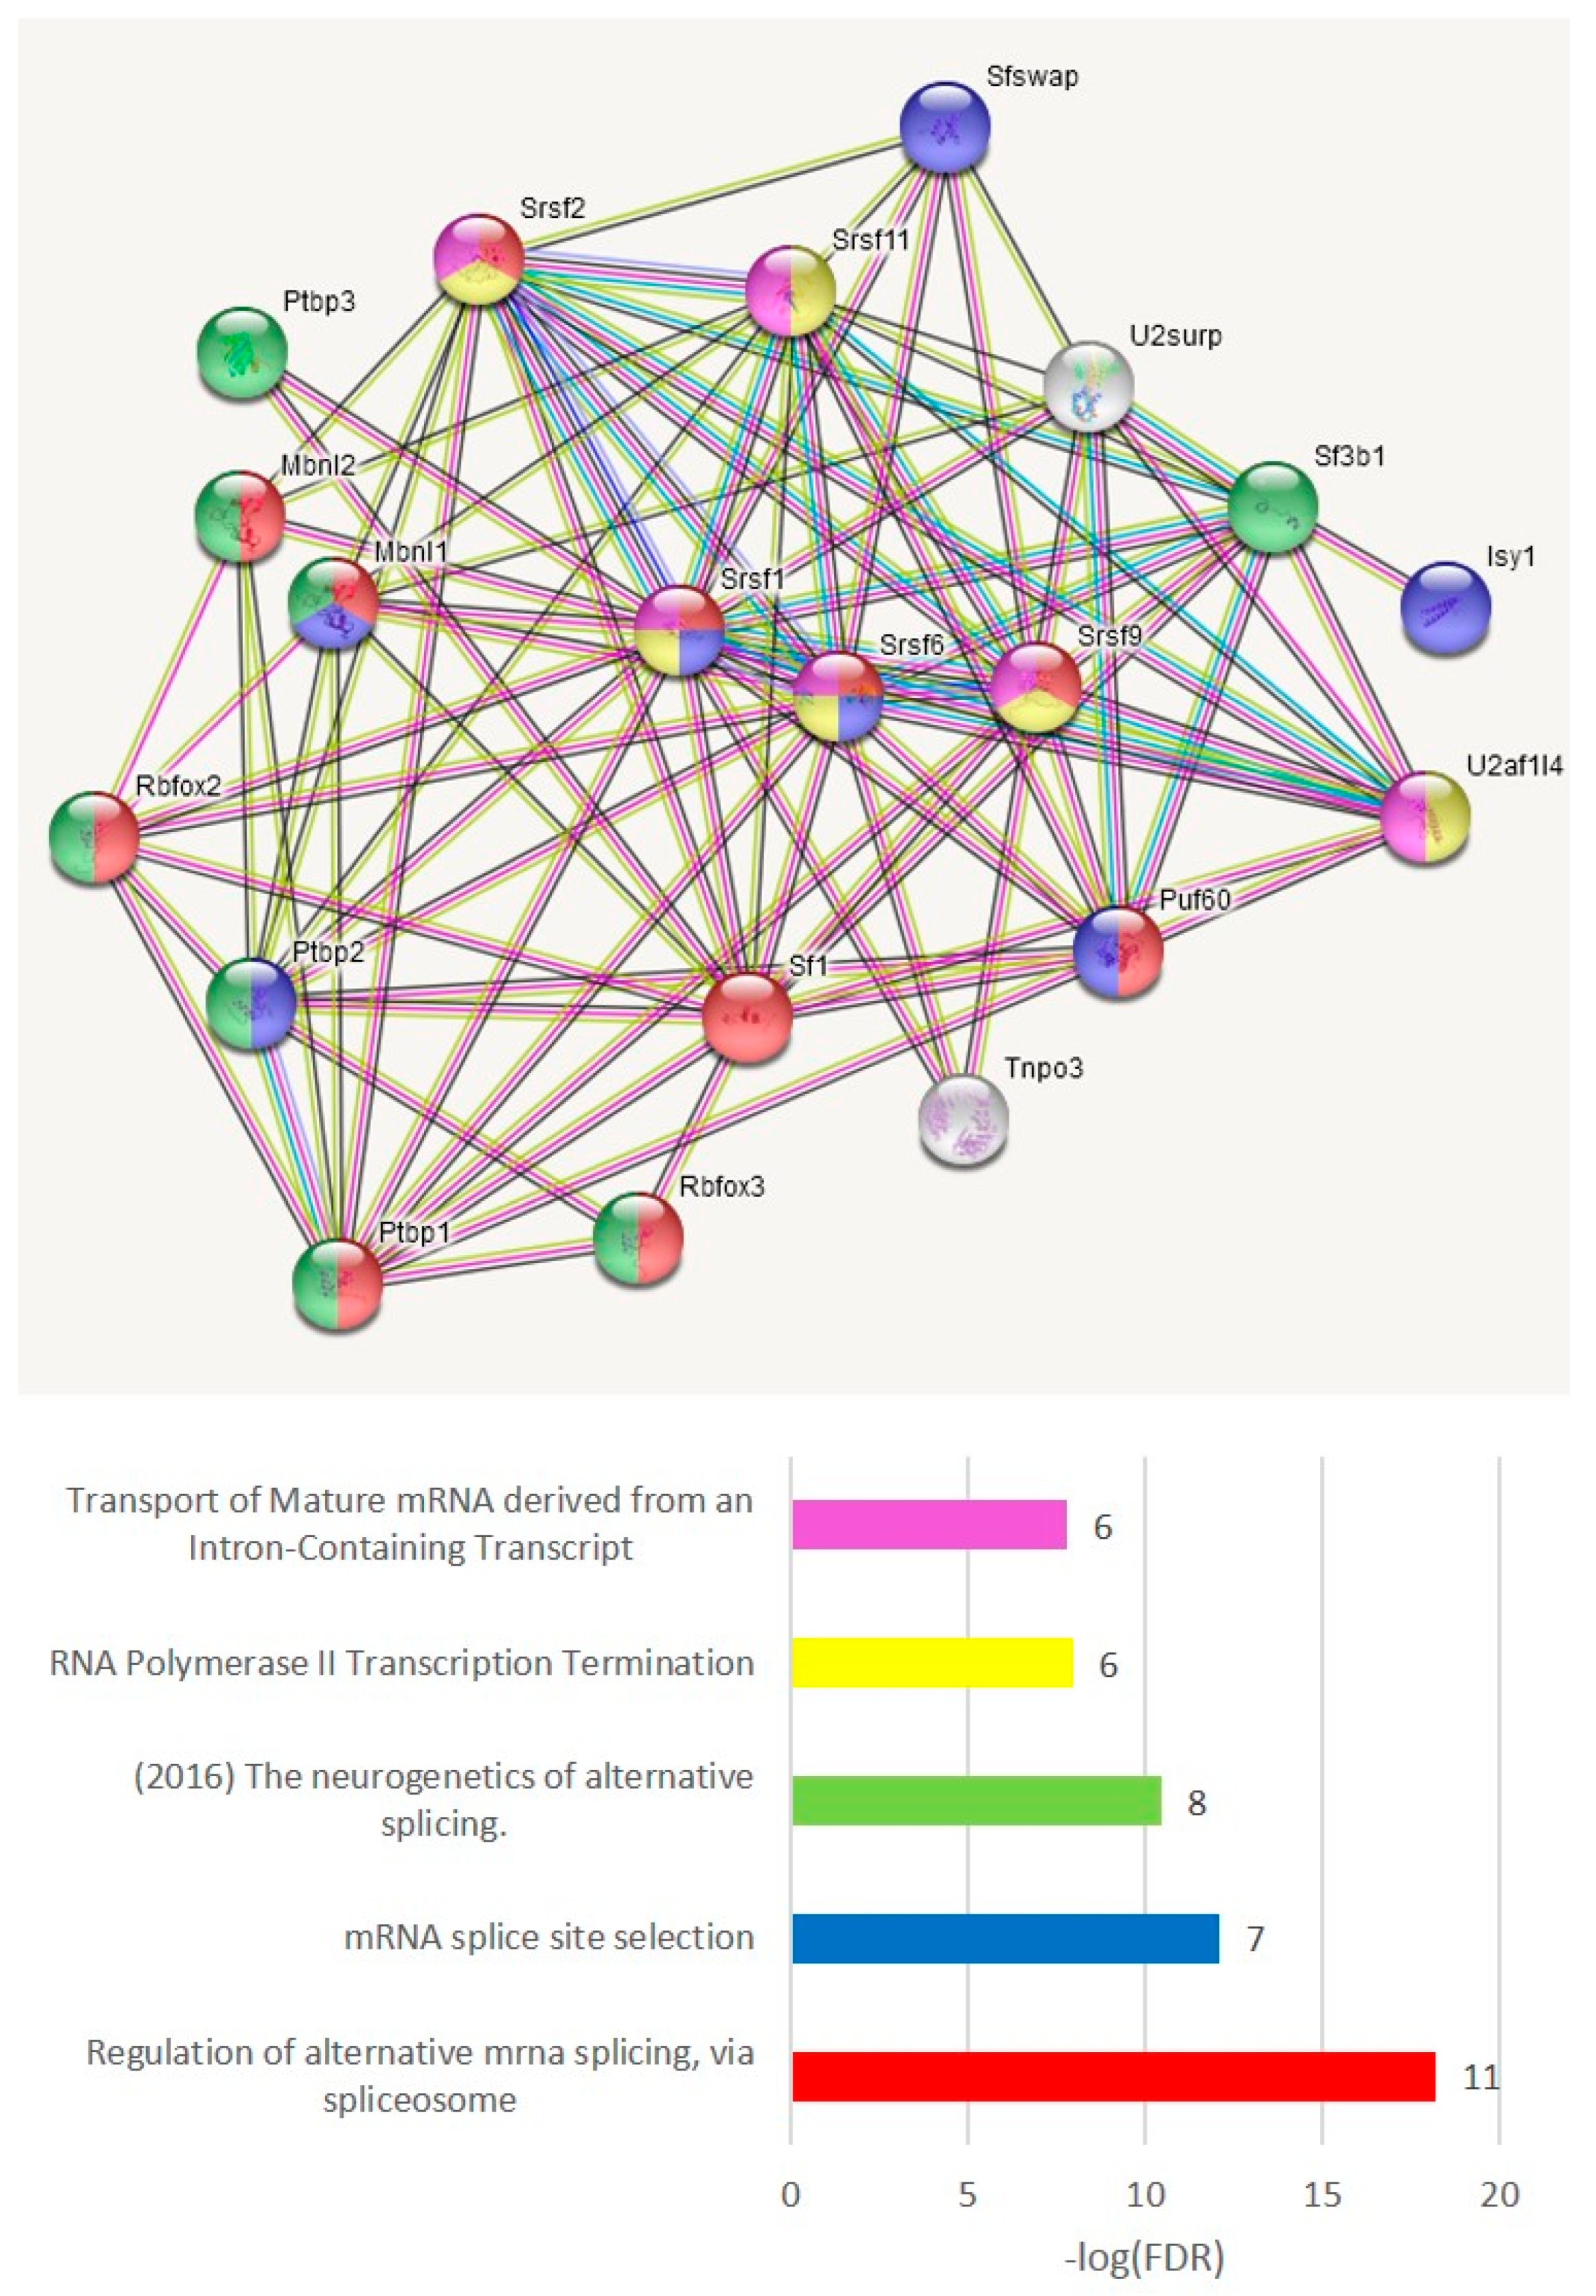
3.4.6. ES Abundant Genes Splicing Factor (SF) Network
To grasp a view of the SF specific preference across the groups, we elucidated the SF network of the ES abundant genes (
Tables S6a and S7a), shown in
Figure 21. This suggests a tight auto- and cross-regulation of SFs and RBMs, as is earlier described [
53,
54,
55,
56,
57]. From notable examples, polypyrimidine tract binding proteins (PTBP1–3) are reported for intricate self- and cross-regulation during the neurogenesis and neuronal differentiation [
56,
58] along with microglial/endothelial immunogenic competence [
56,
57,
59].
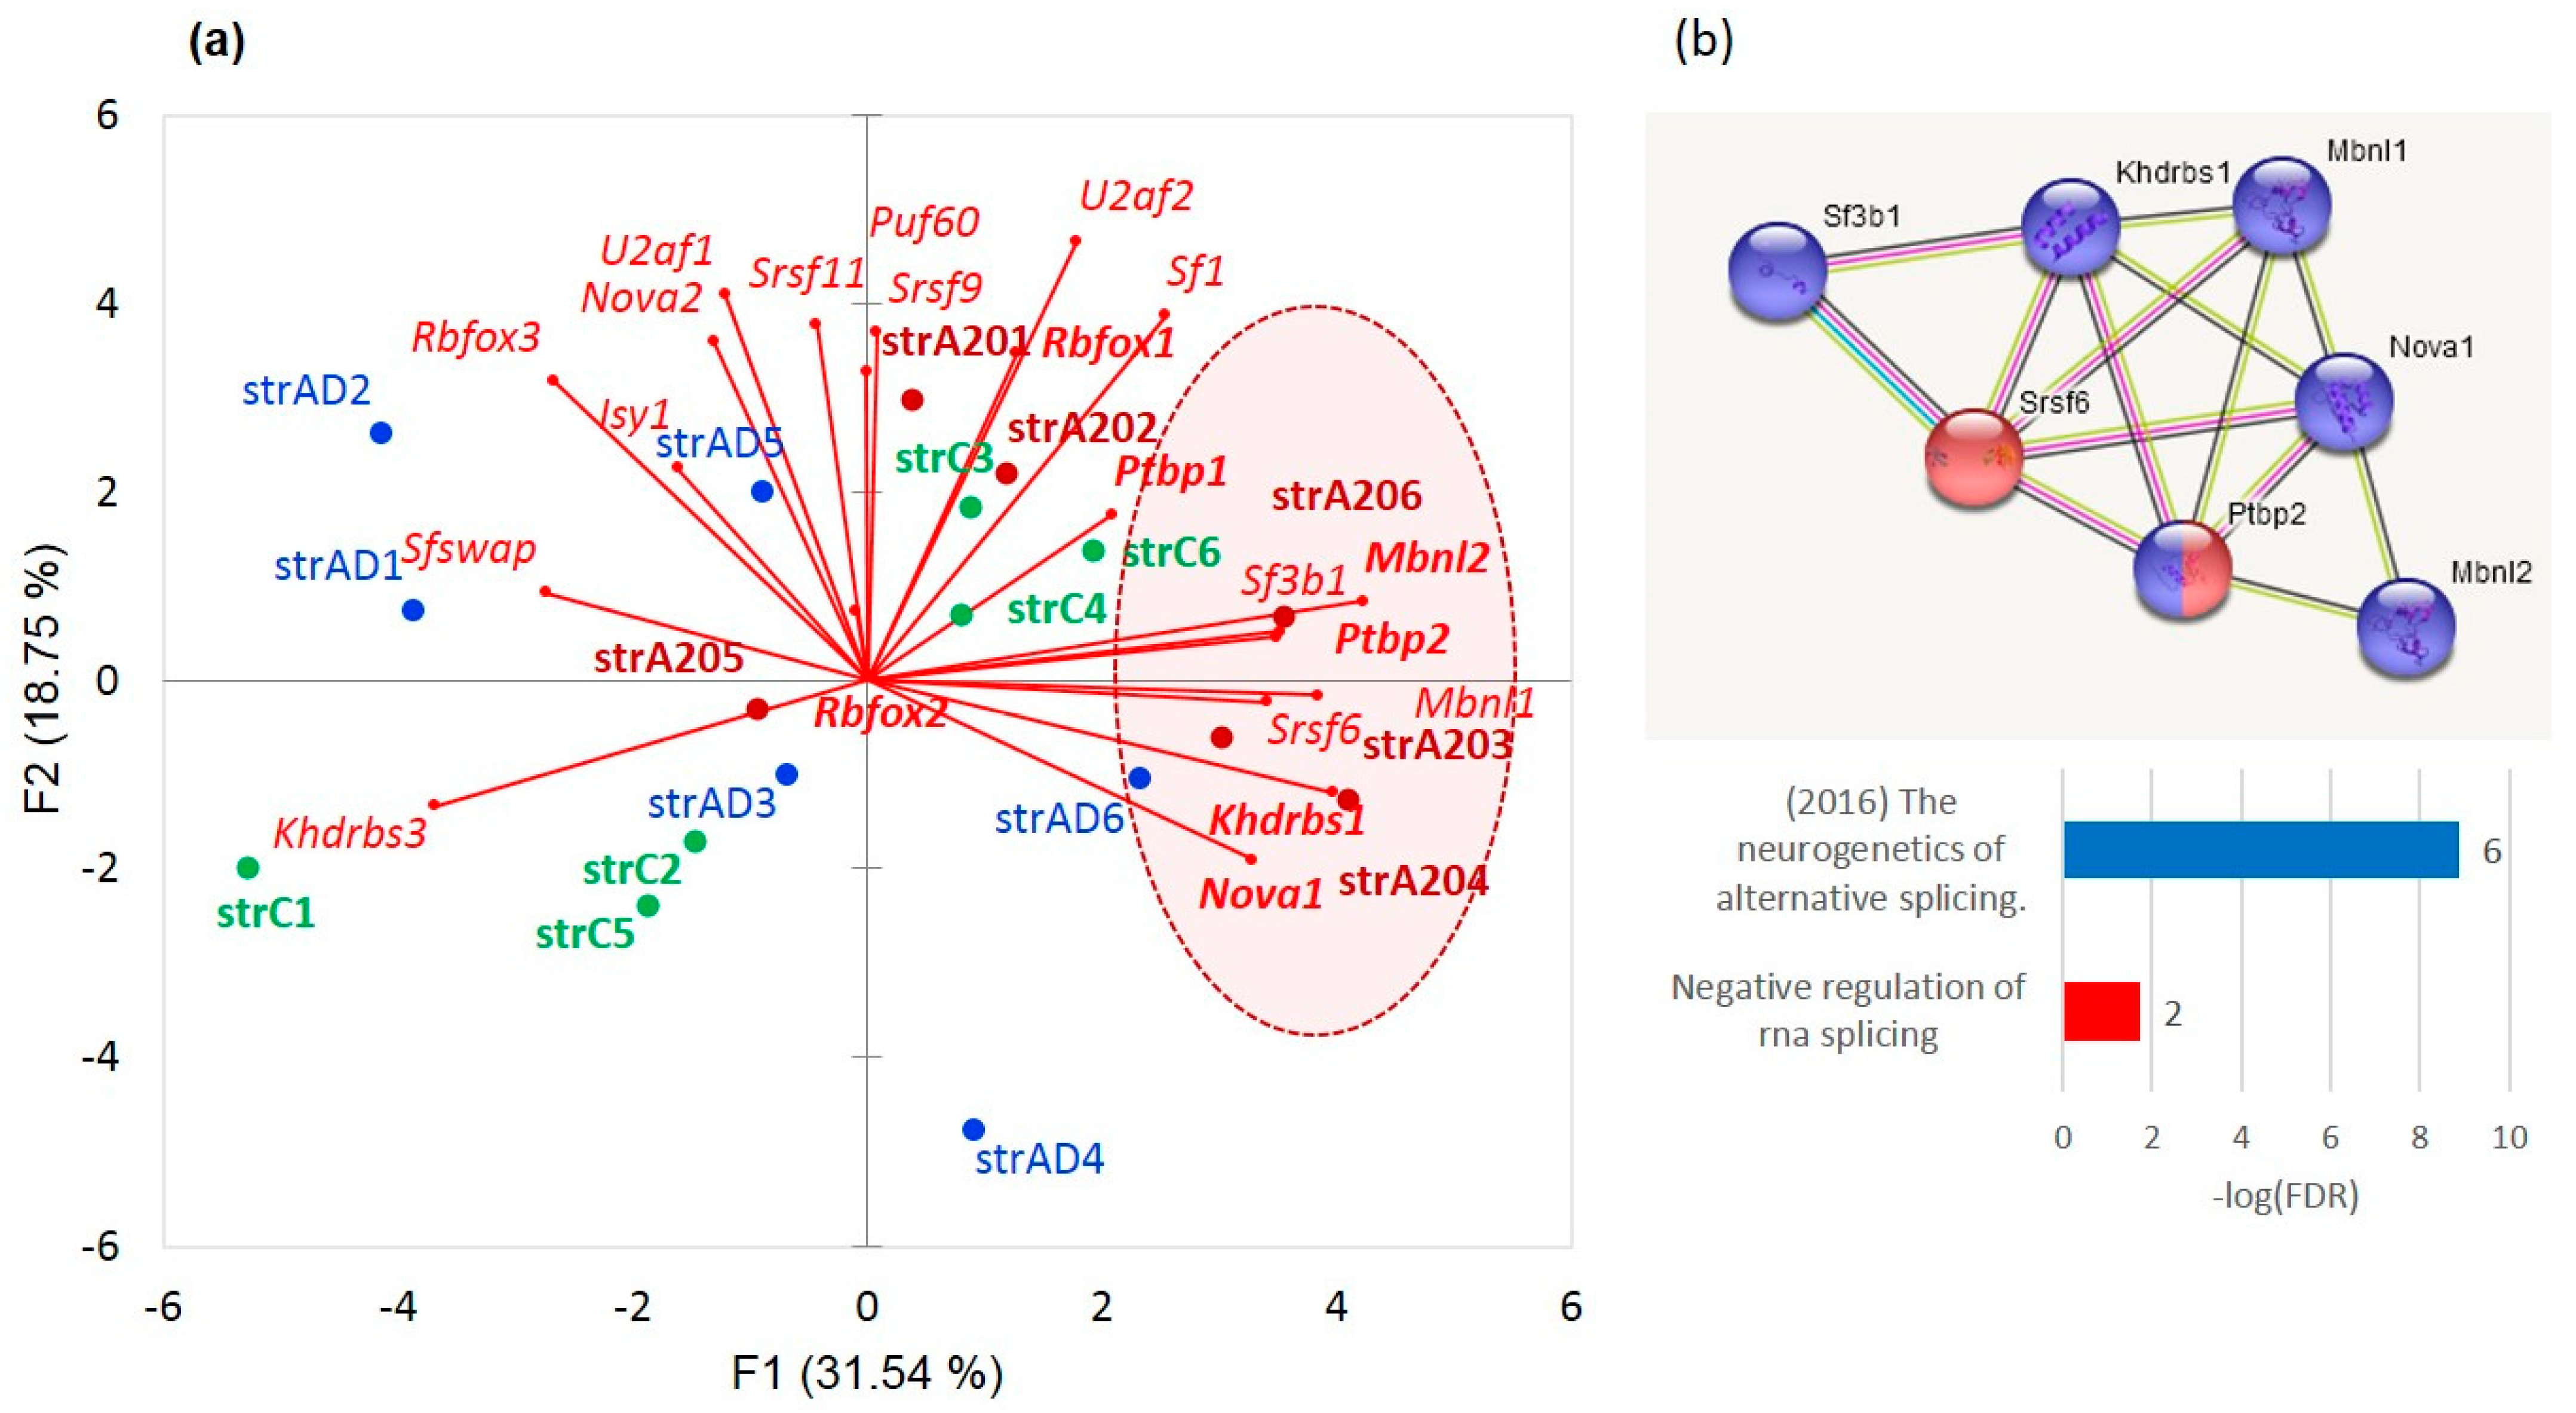
As is evident from
Figure 22, 21 splicing factors (
Table S8b) are distributed in a group-specific manner: AD subjects (blue) tended to locate in the left part of the plot, while aggressive ones clustered in the right side (red). The control mice (green) split into two subgroups (states), one with elevated Khdrbs3 (SLM2) and the other with elevated expression of
U2af2,
Sf1,
Rbfox1, and
Ptbp1 SF clusters.
Srsf9,
Srsf11, and
Puf60 (poly-U binding factor) expression is nonspecifically relative to A20 (right plot part), while AD (left plot part) gradient lines are located close to the ordinate. The expression of
Rbfox2 is nonspecific with regard to the distribution of the groups.
We delineated the cluster of seven encircled genes (
Sf3b1m,
Khdrbs1 (
Sam68),
Srsf6,
Nova1,
Mbnl1,
Mbnl2, and
Nova1), in
Figure 22a, featuring the aggressive mice, and separately shown in
Figure 22b, using the string-db.org suite. Based on the report [
56] describing these genes, we speculate that they maintain intense AS tune-up of postsynaptic
Grin1 and
Psd95 (
Dlg4) genes of the medium spiny neurons (MSNs). We have earlier ascertained that these gene isoforms tune up, playing a pivotal role in cAMP-mediated D1/D2 dopamine signaling pathways, which are the most intensive in the MSNs of aggressive mice [
10]. Both genes maintain an elevated expression, specifically in aggressive mice although in a statistically insignificant manner (
p < 0.1, binomial model). Moreover, the
Grin1 and
Psd95 expression is significantly correlated in our samples (
r = 0.741;
p < 0.0004; df = 17).
Note that while [
56] addressed the cortical neurons in their study, they reported that the skipping of
Psd95 exon 18 was subject to NMD. We also observed nonproductive skipping of the same exon but with a low frequency (PSI < 0.1). In addition, they also emphasize that the SFs analyzed herein actively interact with the other RNA binding proteins, as was shown in our earlier publication on the same data ([
4], Figure 12 therein).
As was earlier reported [
60,
61], all the ES events in
Grin1 are coding, with three basic isoforms (sorted in a descending order by the transcription rate in DS [
10]): NM_001177656, NM_008169, and NM_001177657. We observed that these isoforms were expressed phase-specifically in the cAMP-mediated cascade of D1 MSNs, as noted in an earlier publication [
10].
4. Discussion
We performed RNA-seq analysis of aggressive (A20), aggression-deprived (AD), and control groups evaluating their relationships. After the previous elucidation of the networks of DEGs [
4], we concluded that a high dopamine uptake accompanied by endogenous opioid genesis in A20 resulted in a profound alteration in the DS metabolome leading to over 1000 DEGs in A20 as compared with two other groups. Accordingly, the comparison of the AD vs. control group yielded only 62 DEGs [
4], implying considerable recovery of the DS transcriptome after 2 weeks of fighting deprivation in the AD group. Thus, most of the DEG changes are related to many gene circuits outlined for the AD_A20 GO annotation.
This was not the same for the DAS analysis because of an intensive AS ES revealed in both affected groups. The most significant DAS genes were observed in the AD group (vs. control):
Ppp1r12b,
Nfix,
Thoc5,
Hdac7, and
Rnf144a maintain the top significant DAS FDR < 1 × 10
−5 (
Table S2a). The A20 vs. AD group displayed the smallest number of highly significant DAS events (
Table S2a), implying that the stress-mediated DAS genes were common in both (e.g.,
Hdac7). Still, the most extended DAS ES list is characteristic of C_A20, implying distinct features of the A20 performance state reported in [
4]. In particular, the expression profiles of the corresponding DAS-related networks (the PCA plots throughout the text) show that DAS genes simultaneously decreased their expression in the A20 group cluster (
Figure 8,
Figure 9 and
Figure 11, etc.). It implies the AS events association/mediation with expression downturn of many gene networks in the A20 group, as previously reported [
4].
An intensive chromatin rearrangement in the amygdala, in particular, histone (de)acetylation, was reported in connection with alcoholism and anxiety behavior upon withdrawal [
62]. Specific significant DAS ES events are observed in chromatin factor
Hdac7 (FDR < 2.3 × 10
−5 in C_AD,
Table S2a) in both A20 and AD relative to the control. Furthermore, we observed four other linked chromatin remodeling factors (
Ezh2,
Rarb,
Chd2,
Brdt, and
Scrap;
Table S3b) manifested selectively by both affected groups (
Tables S2a and S3c). While we would expect chromatin rearrangement machinery being employed as a mean of the silencing/activation of stress responsive gene networks, we herein underscore that chromatin machinery widely employs the AS ES switching as a mean for performing the corresponding histone/chromatin modifications upon a consistent stress response specifically in the brain/DS, which has not been explicitly reported before, as far as we know. Another point is that HDACs, in particular, may interact with spliceosomal and ribonucleoprotein complexes and affect the acetylation states of the splicing-associated histone marks and splicing factors, thereby modulating the splicing outcome, as recently proposed [
63].
Figure 23a illustrates the fact that
Hdac7 maintains a significantly elevated minor isoform both in the A20 and AD samples, implying attenuation of the
Hdac7 catalytic activity, which is also supported by
Figure 23b, and implies the attainment of active an chromatin state for the neuron structure recovery gene networks in AD mice [
4].
Other highly significant and repeatedly confirmed (
Table S4b) DAS ES genes are ankyrin
Anks1b (FDR < 2.3 × 10
−4) and
Ppfibp1 (
Znt9, FDR < 2.8 × 10
−4;
Table S2a). A string-db.org analysis confirmed three particular gene networks, shown in
Figure 7. Note that active chromatin regulation (observed in A20-mice; Figs.19, 20) NMD instantiation in the neuronal cell types was first reported in [
47] and has been proven to be conserved across the mammalian clade therein. We report that besides the NMD-associated ES events in chromatin regulation, we observed the chromatin rearrangement complex (SWI/SNF) contains coding ES events for the histone modification enzymes, implying the active chromatin rearrangement in aggressive mice (
Figure 18 and
Table 5b).
Thus, the DAS analysis of the coding ES events suggests that the glutamatergic synapse and chromatin rearrangement gene networks actively exploit the AS machinery, providing the means of plasticity to these complexes (
Figure 4). We also observed the employment of PKA-associated
Grin1 isoforms, reported earlier in our paper [
10].
We selected 24 genes with abundant protein-coding AS ES events for assessing the ‘neuron projection’ GO category (
Tables S6 and S7). We found that the overall architecture of the AS synapse genes with intensive expression in A20 vs. AD and C significantly differs between the groups (
Figure 24).
By assessing the overall proteome variation, we infer that at least half of the AS ES coding events are capable of maintaining both isoforms as coding. In addition, this revealed that half of the coding events (~1800 genes,
Table 5) manifest an NMD-related AS event, leading to ORF disruption and subsequent mRNA degradation.
We found out that the AS2 (both coding isoforms) ES abundant genes are mostly related to the membrane/cytoplasm-associated genes (
Figure 24 and
Table S6a–c), which was also earlier reported [
64]; therefore, the authors used the ribosome-engaged transcripts to ensure the RNA coding competence.
The SWI/SNF superfamily-type complex of chromatin modifying/remodeling enzymes
Bptf,
Smarca2, and
Pbrm1 (
Table S6a–c) also use a dynamically altering ratio of coding isoforms, namely, at least four distinct AS2 ES events are observable in
Smarca2 and six AS2 events in
Pbrm1, closely associate with it (
Table S6a and
Figure 18).
Pbrm1 (syn:
Baf180,
Hpb1,
Smarch1, and
Brg1) was shown to modify AS by interactions altering the RNA binding factors with nascent RNA [
65], as well as
Smarca2 itself [
66], making the SWI/SNF complex an auxiliary splicing machine actively involved in the splicing outcome while being regulated by AS itself, specifically in the neurons [
67]. We have not seen many publications on the SWI/SNF AS competence yet; however, we have regularly observed that it maintains coding AS ES events in our samples, in particular, in hippocampus samples (personal observation). In this study, we observed multiple coding isoforms of both genes (
Table S6).
The NMD-associated transcripts have been long reported in auto- and cross-regulation of the SFs in a range of the papers describing complex cascade relationships between these factors [
53,
54,
55,
58,
68,
69]. Our method of elucidating the NMD-related ES events have allowed us to assess the properties of the genes maintaining the multiple (more than one) variants of these events (
Table S8). Strikingly, we have observed that the major NMD events are related to nuclear genes (full GO annotation charts for the NMD ES abundant genes are shown in
Table S7), which was also reported in [
47]. The RNA processing proteins, including spliceosomal components, were nonrandomly enriched. In addition, ubiquitin-like (
Ubl) conjugation (
E2S) genes were also enriched in NMD ES events.
The analysis of the GO annotation of ES AS abundant genes (
Tables S6 and S7) allows us to state that the majority of alternatively spliced proteins are phosphoproteins (see, e.g.,
Figure 18), underscoring AS coupling with reversible phosphorylation. The latter is the major signal transduction means in the DS, including the core signaling of cAMP-mediated dopaminoceptive response [
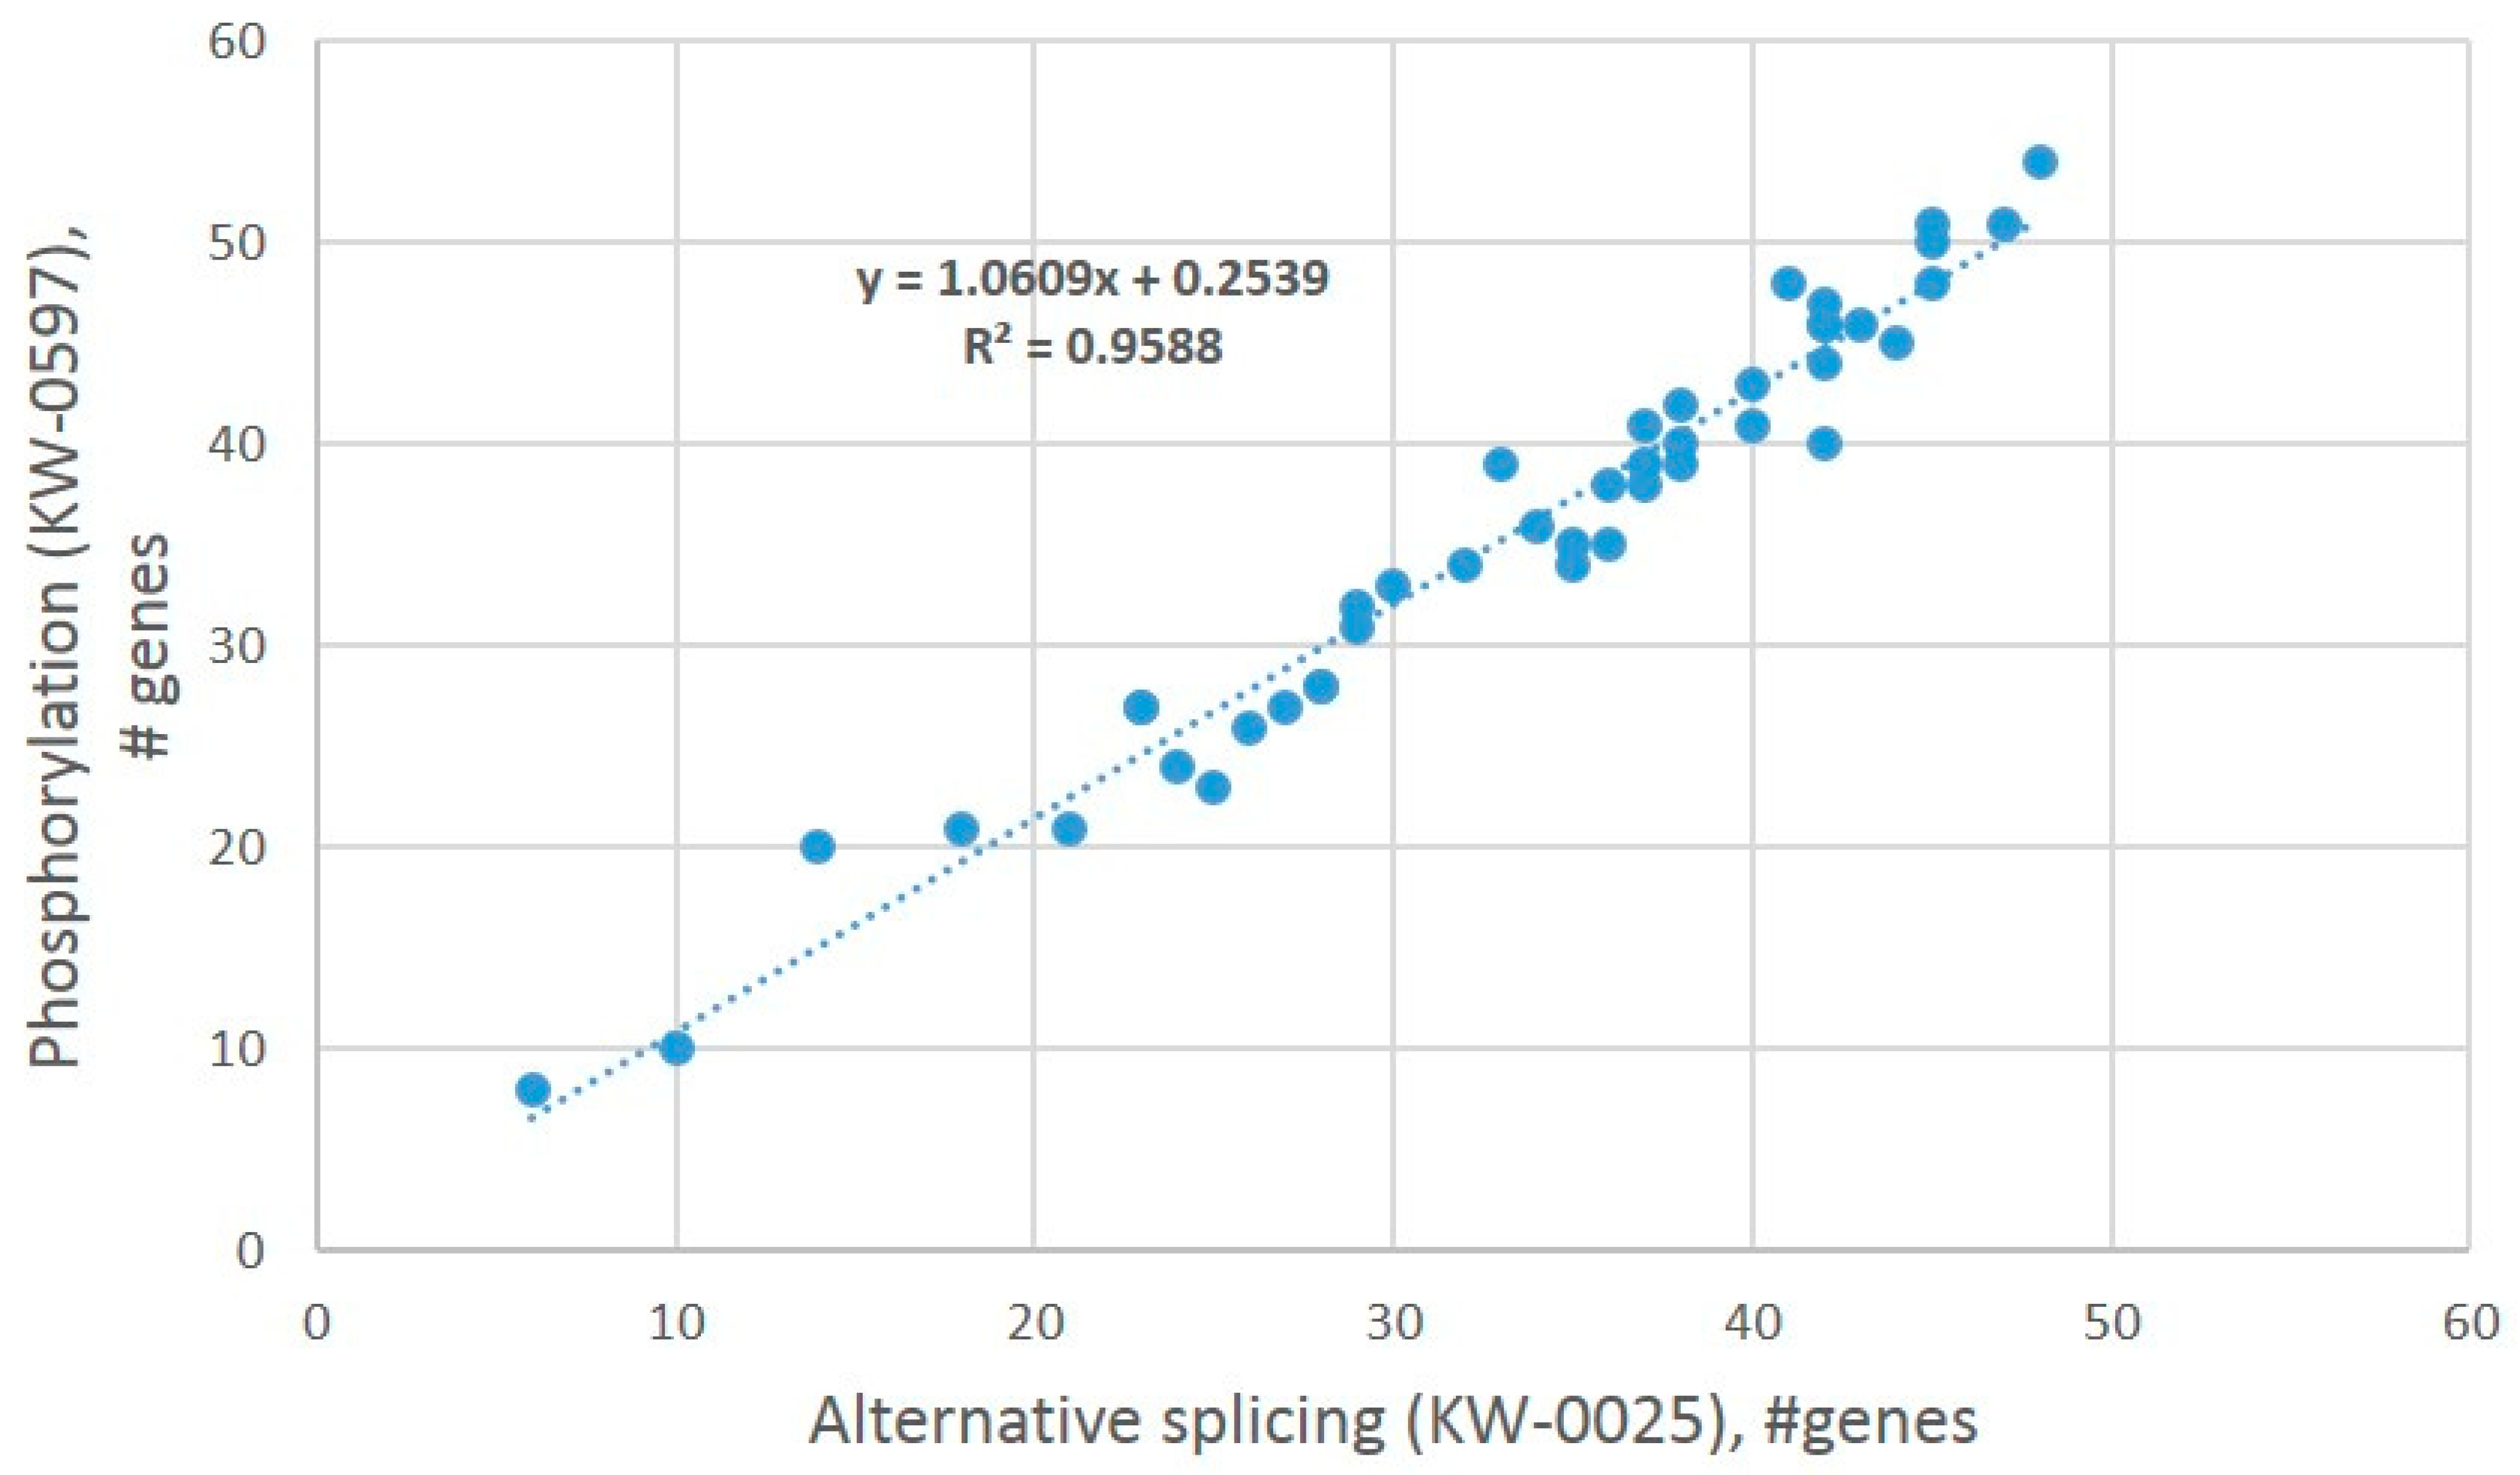
4]. By random sampling of AS-rich gene subgroups and annotating them for ‘AS’/’phosphoprotein’ GO terms, we confirm that ES AS abundant genes, as a rule, also maintain reversible phosphorylation, as suggested by regression analysis (
Figure 25).
Energy homeostasis also widely employs ES NMD AS in mitochondria [
51]. The ADCK4 (COQ8) kinase protein resides within the inner membrane of the mitochondria and is associated with ATP binding. Notably, we have observed abundant ES NMD-related instances in mitochondrial
Coq8 exon 10 skipping not reported before, featured in aggressive subjects along with the overall elevation in
Coq8 expression (
Figure 9). This underscores the NMD machinery being effective even in a very optimal evolutionary conserved energy metabolism (oxidative phosphorylation) pathway, yet may be aberrant according to a recent report [
70]. The energy issues due to mitochondrial dysfunction in stress related abnormalities consistently reported previously imply the unproductive splicing in
Coq8 observed in our study may affect energy homeostasis.
These facts suggest a certain preference in the NMD-associated vs. AS2 events in a compartment-specific manner. As for the functional consequences of our work on the DS of mice in the social stress model, we emphasize the importance of the interplay between dopamine and glutamate receptors in MSNs [
4,
71]. Glutamate receptors are the most AS-effective neural genes in terms of (a) the lack of NMD-related events and (b) the presence of two major isoforms in the NMDA subunit gene
Grin1, mainly differing in the glycine affinity in the N-terminal domain (ex5 skipping). Notably,
Grin1 functional splicing activity has been widely discussed since 1992 [
72,
73,
74,
75].
5. Conclusions
Several publications emphasized the exon-centered AS program as a way of gene complexity evolutionary expansion in mammals by both the exon shuffling and exon splicing variations [
30,
76]. This highlights the most intensive splicing rate in the brain transcriptome [
69] upon the emergence of a brain-specific arsenal of SFs regulating the in/out splicing of specific exons [
5]. Thus, a special exon splicing machinery has emerged in the course of rapid animal evolution in the form of brain-specific SFs maintaining the neurospecific gene regulation in temporal and spatial manners, often employing cross- and self-regulation by means of NMD as well as providing an additional coding neuroplasticity layer [
5].
We assessed the global splicing AS ES specifics in the dorsal striatum transcriptome. Our genome-wide transcriptome AS ES analysis outlined that a half of the ES events are located in the 5′/3′UTR (
Table 4), while the associated coding ES variants maintain half of the alternative isoforms containing premature stop codons subject to NMD. We also observe that the majority of ES events are related to housekeeping regulatory machineries affecting the transcription rate, including the spliceosome, RNA processing, chromatin rearrangement, mRNA export, transcription factors, and many others. In addition to nuclear-associated genes, the membrane/synapse/cytoskeleton-associated genes manifest another group that are highly enriched with ES events genes. Splicing is intensively employed in the brain-specific gene families, such as
Slc and
Fam (
Table 6).
We found that NMD-mediated splicing is prevalently characteristic of nuclear genes, including the spliceosome. Another machinery that intensively utilizes splicing specifically in the brain is the chromatin remodeling system, as reported earlier [
16]. The key components of the chromatin rearrangement complex, including SMARCA and ACD7, intensively use alternative coding isoforms, as is confirmed by our study. We have also shown that the TF programs are actively switched in the course of aggressive adaptation [
4] by means of intensive chromatin remodeling. We would also like to assert that numerous AS2 coding alterations are often related to the expression rate and the metabolic activity/binding strength, as it follows from the DAS vs. DEGs comparison, thus also addressing quick homeostasis adjustments/transitions.
The majority of coding AS2 ES dynamics takes place in the membrane proteins, including synaptic genes. The AS2 genes subject to ES events are also significantly overrepresented by phosphoproteins. We thus witness the AS ES-rich genes undergoing posttranslational modification by the (de)phosphorylation machine, implying a high flexibility of these genes with respect to both phosphorylation and splicing encoding systems employed in their temporal/spatial tune-up. It is especially evident for the genes involved in the cAMP-mediated signaling cascade in the DS MSNs, which actively utilize both phosphorylation machinery (DARPP-32 and others, switching phosphorylation marks), as well as D1 MSNs phase-dependent AS switching of major
Grin1 isoforms to enable agent-specific (D1/PKA) switching [
4,
10]. We hypothesize that the linkage of AS to phosphoproteins may also imply that some of the phosphorylation sites can be excised by AS ES, which is the case of the DARPP-32 protein truncated isoform t-DARPP with exclusion of the key PKA phosphorylation target position 34 [
4].
As a key finding, we report significant elevation of SF expression activity in the A20 group, which is apparently linked to the enhanced performance on the cAMP cascade.


 ,
, 


