Article

Characterization of Glycosyltransferase Family 1 (GT1) and Their Potential Roles in Anthocyanin Biosynthesis in Maize

1
Research Institute of Biology and Agriculture, Shunde Innovation School, University of Science and Technology Beijing, Beijing 100083, China
2
Industry Research Institute of Biotechnology Breeding, Yili Normal University, Yining 835000, China
3
Beijing Engineering Laboratory of Main Crop Bio-Tech Breeding, Beijing International Science and Technology Cooperation Base of Bio-Tech Breeding, Zhongzhi International Institute of Agricultural Biosciences, Beijing 100192, China
*
Author to whom correspondence should be addressed.
These authors contributed equally to this work.
Genes 2023, 14(11), 2099; https://doi.org/10.3390/genes14112099
Submission received: 8 October 2023 / Revised: 13 November 2023 / Accepted: 13 November 2023 / Published: 18 November 2023
(This article belongs to the Special Issue Maize Molecular Genetics and Functional Genomics)

Abstract

:
Glycosyltransferase family 1 (GT1) is a large group of proteins that play critical roles in secondary metabolite biosynthesis in plants. However, the GT1 family is not well studied in maize. In this study, 107 GT1 unigenes were identified in the maize reference genome and classified into 16 groups according to their phylogenetic relationship. GT1s are unevenly distributed across all ten maize chromosomes, occurring as gene clusters in some chromosomes. Collinearity analysis revealed that gene duplication events, whole-genome or segmental duplication, and tandem duplication occurred at a similar frequency, indicating that both types of gene duplication play notable roles in the expansion of the GT1 gene family. Expression analysis showed GT1s expressing in all tissues with specific expression patterns of each GT1, suggesting that they might participate in multiple biological processes during the whole growth and development stages. Furthermore, 16 GT1s were identified to have similar expression patterns to those of anthocyanidin synthase (ANS), the critical enzyme in anthocyanin biosynthesis. Molecular docking was carried out to examine the affinity of GT1s with substrates in anthocyanin biosynthesis. This study provides valuable information on the GT1s of maize and will promote the development of research on their biological functions in the biosynthesis of other secondary metabolites.

1. Introduction

Glycosylation is one of the most abundant and significant modifications in plant cells [1], which plays a vital role in multiple biological processes like plant growth [2], the biosynthesis of a significant amount of secondary metabolites [3,4,5,6], the precise regulation of the contents of various hormones [7,8,9,10,11], and the defense response to biotic/abiotic stresses [12,13,14]. Glycosylation reactions are mainly catalyzed by glycosyltransferases (GTs, EC 2.4.x.y), which mediate the transfer of sugar moieties from activated donors onto various acceptors, for example, sugars, proteins, nucleic acids, antibiotics, lipids, and other small chemical molecules, to form glycosidic bonds [15,16]. In plants, uridine diphosphate (UDP)-glucose (UDP-Glc) is the most favored sugar donor in glycosylation reactions. In addition, UDP-arabinose (UDP-Ara), UDP-galactose (UDP-Gal), UDP-glucuronic acid (UDP-GlcUA), UDP-rhamnose (UDP-Rha), and UDP-xylose (UDP-Xyl) can also serve as glycosyl donors for GTs [5,17]. According to the different types of glycosidic bonds formed, GTs can be divided into O-, S-, N-, and C-glycosyltransferases, with O-glycosides being the most widely distributed and well-known glycosylation products [18].
Glycosyltransferases available from the Carbohydrate-Active enZyme (CAZy, http://www.cazy.org/, accessed on 3 September 2023) database are classified into 116 families according to protein sequence similarity, the stereochemical structure of glycosidic bonds, and substrate specificity, and the vast majority of GTs belong to the family 1 (GT1). The common sugar donor of GT1s is UDP-Glc; thus, they are also called UGTs [19]. In Arabidopsis, about 120 genes were predicted to encode GT1s, which were phylogenetically classified into 14 distinct groups [20]. Most of the GTs are reported to be associated with the biosynthesis of secondary metabolites of lignin and flavonoid, which fall into the GT1 family [21,22,23]. Some GT1s, referred to as UDP flavonoid glycosyltransferase (UFGT) or 3-O-glucosyltransferase (3GT), catalyze the last step in the biosynthesis of anthocyanins, and anthocyanidin synthase (ANS) mediates the penultimate processing step. The glycosylation process of anthocyanins can improve the solubility and stability of anthocyanins in plants [24]. Due to the importance of secondary metabolites in biology, pharmacology, and agronomy, researchers have continuously focused on the study of GT1s in recent decades.
The structural information of GT1s is of great significance for discovering the glycosylation catalytic mechanisms. Most plant GT1s have a conserved motif consisting of 44 amino acid residues at their C-terminus, namely the plant secondary product glycosyltransferase (PSPG) box, which is believed to function in the binding of glycosyl donors [3]. Except for the PSPG box, GTs have relatively low sequence similarity and the N-terminal is significantly variable among sequences, suggesting their diversity in the substrate binding of receptors [16].
Maize is an important and widely distributed cereal crop. It serves as human food, livestock feed, biofuel, and raw industrial materials. Based on the universal uses, it is worth characterizing maize GT1s and better understanding their functions in critical biological processes. Bioinformatics has been widely used to characterize gene families in maize and other plant species [20,25,26,27,28,29,30]. In the present study, we identified 107 GT1 members, which were then subjected to a series of bioinformatics analyses to show their phylogenetic relationship, chromosomal location, conserved motifs and domains, gene structure, and gene duplication events of GT1s in the whole genome as well as expression profiles to predict the candidate genes involved in the biosynthesis of anthocyanin. Molecular docking analysis was further conducted to test the affinities of GT1s with the substrates. This study may provide a comprehensive insight into characterizing the maize GT1s, thus promoting the functional elucidation of GT1s in the biosynthesis of important chemicals of interest.

2. Materials and Methods

2.1. Identification of Maize GT1s

The GT1 proteins of maize with accession numbers were retrieved from the CAZy Database (http://www.cazy.org/, accessed on 3 September 2023) [31]. The corresponding protein sequences were obtained from the National Center for Biotechnology Information (NCBI, https://www.ncbi.nlm.nih.gov, accessed on 5 September 2023) and blasted against the amino acid sequences of the maize reference genome (Zm-B73-REFERENCE-NAM-5.0) [32] deposited on EnsemblPlants Database (https://plants.ensembl.org/index.html, accessed on 5 September 2023). Redundant sequences were removed manually.

2.2. Multiple Sequence Alignment of GT1s

The alignments of GT1 protein sequences were performed using ClustalW program implemented in MEGA11, and then visualized graphically using ESPript 3.0 (https://espript.ibcp.fr/ESPript/cgi-bin/ESPript.cgi, accessed on 12 September 2023) [33].

2.3. Phylogenetic Analysis of GT1s

The Arabidopsis GT1 protein sequences were downloaded from the EnsemblPlants Database (https://plants.ensembl.org/index.html, accessed on 13 September 2023). The phylogenetic trees of GT1 proteins from maize and Arabidopsis were constructed according to the maximum likelihood (ML) method using One Step Build a ML Tree program implemented in TBtools v2.003 [34]. The topology of each phylogenetic tree was assessed through a bootstrap resampling analysis with 5000 replicates. The tree was visualized and modified using the online Evolview tool (http://www.evolgenius.info/evolview/, accessed on 13 September 2023) [35]. All GT1s were classified based on their phylogenetic relationship with GT1s previously identified in Arabidopsis and maize [25,36].

2.4. Gene Structure and Conserved Motif Analysis

Prediction of conserved motif was performed using the MEME (http://meme-suite.org/, accessed on 13 September 2023) with the parameter of number of unique motifs = 10. Conserved domains were identified using the Web CD-Search Tool on NCBI (https://www.ncbi.nlm.nih.gov/Structure/bwrpsb/bwrpsb.cgi, accessed on 13 September 2023). Gene structures were predicted according to the gene annotation file downloaded from EnsemblPlants Database (https://plants.ensembl.org/index.html, accessed on 2 August 2023). Finally, the phylogenetic analysis, conserved motifs and domains, and gene structure analysis were merged using TBtools [34].

2.5. Chromosomal Localization and Collinearity Analysis for Duplicated Genes

All the GT1 genes were mapped on maize chromosomes and visualized using TBtools [34] according to their physical positions in the annotation file from EnsemblPlants (https://plants.ensembl.org/index.html, accessed on 2 August 2023). The collinearity analysis was carried out using the One Step MCScan Program in TBtools (e-value ≤  1 × 10⁻¹⁰) to identify the tandem, whole-genome duplications (WGDs), or segmental duplicated genes. The WGD or segmental duplicated GT1 genes were further marked on the genomes using Advanced Circos program of TBtools [34].

2.6. Expression Profile Analysis

The gene expression patterns were measured using the RNA-sequencing data published previously [37], which were downloaded from the qTeller platform of MaizeGDB (https://qteller.maizegdb.org, accessed on 16 Septermber 2023). Subsequently, the heatmap of GT1 expression was generated using TBtools [34].

2.7. Molecular Docking of GT1s

The structural formulae (SDF format) of UDP-Glc, pelargonidin, cyanidin, and delphinidin were downloaded from the PubChem database (https://pubchem.ncbi.nlm.nih.gov, accessed on 19 July 2023), and subsequently imported into Chem3D software (v18.0) for optimization and energy minimization using the MM2 module. The energy-minimized molecules were further served as ligand input during the docking simulation. The crystal structures of GT1 receptors were obtained from the MaizeGDB database (https://maizegdb.org/, accessed on 11 July 2023) and processed using Pymol v2.5.5 to remove all small and ligand molecules. Next, the PDBQT files for the receptors and ligands were generated using AutoDockTools v1.5.6 [38]. The GT1 receptors were processed by adding hydrogen and charges, and the ligands were prepared by adding atomic charges and assigning atom types. The docking pocket was determined using AutoGrid [38], and molecular docking was carried out using AutoDock Vina [39,40] to search for the best docked conformation. The conformations with the lowest binding energy were selected to analyze the interactions between receptor and ligand. The docking simulations were visualized using LigPlot (2D) [41].

3. Results

3.1. Identification and Phylogenetic Analysis of Maize GT1s

A total of 316 GT1 protein sequences of different maize lines were collected from the CAZy database [31], 145 of which were isolated from inbred line B73; 29 were from 12 other lines including McC, W22, Mo17, I137TN, Coroico, CML258, NalTel, RP4Htn1, Ngo dim Dak Lak, CI 31 A, maxicana, and A188; and the other 142 were submitted without source information. Through sequence similarity searching in the maize reference genome (Zm-B73-REFERENCE-NAM-5.0) [32], 107 unigenes were identified as encoding the above GT1 proteins (Table 1). The 107 GT1s encoded products with a variable length between 427 and 525 amino acids (average 480 amino acids) and each proved to contain the conserved PSPG motif (Table 1 and Figure S1).
To assess the evolutionary relationship between GT1s, we conducted a phylogenetic tree of maize GT1s. The 107 GT1s were clearly categorized into 16 groups (Groups A, C–Q), consistent with the GT1 phylogenetic classification established previously in Arabidopsis and maize [25,36] (Figure 1). Group E comprised the most GT1 members (n = 25), followed by Group L (n = 17) and Group G (n = 11), while Groups C, K, and P each contained only one member. However, no GT1s identified in this study were classified as members of Group B.

3.2. Motif Composition, Conserved Domain, and Gene Structure Analyses of GT1 Genes

To better understand the structural features of GT1 proteins, the phylogenetic tree, motif identification, conserved domains, and gene structure analyses of 107 GT1s were merged together. The phylogenetic relationship of GT1s of maize only was consistent with that constructed together with GT1s of Arabidopsis (Figure 1 and Figure 2A). We further examined 10 highly conserved motifs within each GT1 using the MEME tool. The results showed that most GT1 proteins of the same group exhibited similar motif compositions, suggesting functional similarities in the glycosyltransferase family. The number of motifs in each protein ranged from 8 to 11. About 65% (n = 70) of GT1 members contained all ten motifs, while the others (n = 30) lacked one or two (Figure 2B). The conserved PSPG motif sequence was detected in motif 1, which was present in all GT1 proteins (Figure 2B and Table S1). In addition, we also found the presence of duplication of the motifs in some GT1 members, 26 of which had one duplicated motif and 2 contained two duplicated motifs (Figure 2B). Furthermore, the conserved domains of GT1 proteins were also investigated. As expected, all of the GT1 proteins harbored glycosyltransferase-related conserved domains, including the Glycosyltransferase_GTB-type superfamily, GT1-Gtf-like, PLN02448, and PLN00164 (Figure 2C).
To analyze the gene structure of the GT1s, we examined the composition of introns and exons using the annotation file. Over 97.2% of GT1 family members (n = 104) contained a small number of introns. Among these GT1 genes, 61 GT1s had no introns, 34 had only one intron, and 9 had two introns (Table 1). Most of the introns in these GT1s were located within coding sequence (CDS) regions but rarely in untranslated regions (UTRs). However, Zm00001eb135190, Zm00001eb154000, and Zm00001eb234750 had more introns with 4, 9, and 4, respectively, and these introns distributed within 5′ and 3′ UTRs (Figure 2D and Table 1). The structural divergences in GT1s may lead to functional differentiation in substrate identification and enzyme activity.

3.3. Chromosomal Distribution and Gene Duplication of GT1 Genes

All of the GT1 genes were mapped onto the ten maize chromosomes to visualize their chromosomal distribution. The GT1 genes were unevenly distributed across all ten maize chromosomes and chromosomes 2 and 10 contained the highest (n = 20) and lowest (n = 4) numbers, respectively (Figure 3A and Table 1). Interestingly, GT1 genes often tended to form small gene clusters on the chromosomes (Figure 3A). Based on the chromosomal distribution, we identified 25 GT1 gene clusters, each harboring two or more GT1 gene family members. The numbers of GT1 gene clusters on each chromosome were as follows: 2 on Chr1, 4 on Chr2, 3 on Chr3, 5 on Chr4, 1 on Chr5, 4 on Chr6, 4 on Chr7, 1 on Chr8, 0 on Chr9, and 1 on Chr10. In general, GT1 genes in the same cluster fell into the same phylogenetic group, with few exceptions, such as GT1 clusters 4, 8, and 10 (Table S2).
Gene duplications of the 107 GT1 genes were investigated using MCScanX and TBtools. The analysis results revealed that 25 gene pairs from 29 GT1 genes, belonging to 11 groups including A, D, E, G-L, N, and Q, appeared to have arisen from WGD or segmental duplications (Figure 3B, Table 1 and Table S3). These gene pairs were distributed on nine maize chromosomes and most frequently on Chr2, similar to the GT1 distribution (Figure 3). Meanwhile, 29 GT1 genes were likely to be tandem duplicates (Table 1), suggesting that WSD or segmental duplication and tandem duplication played comparably important roles in the evolution of the GT1 gene family.

3.4. Expression Analysis of GT1 Genes

The expression patterns of GT1 genes were analyzed according to the published transcriptomic data [37]. The GT1 genes accumulated in all maize tissues, suggesting their contributions to the growth and development of maize. The GT1 genes were further clustered based on their tissue specificity in gene expression, and divergent expression patterns were found across different phylogenetic groups. It is universal that the GT1 genes from the same group may have different expression patterns, such as Zm00001eb051070 and Zm00001eb146840 in Group A, Zm00001eb150460 and Zm00001eb291420 in Group J, and Zm00001eb056990 and Zm00001eb158880 in Group Q (Figure 4). The expression patterns also varied among duplicated gene pairs. The duplicated gene pair of Zm00001eb170440 and Zm00001eb113190 showed similar expression patterns with the highest expression in mature leaf, whereas the gene pairs Zm00001eb194070 and Zm0001eb279380 were highly expressed in pericarp and silk, respectively (Figure 4).

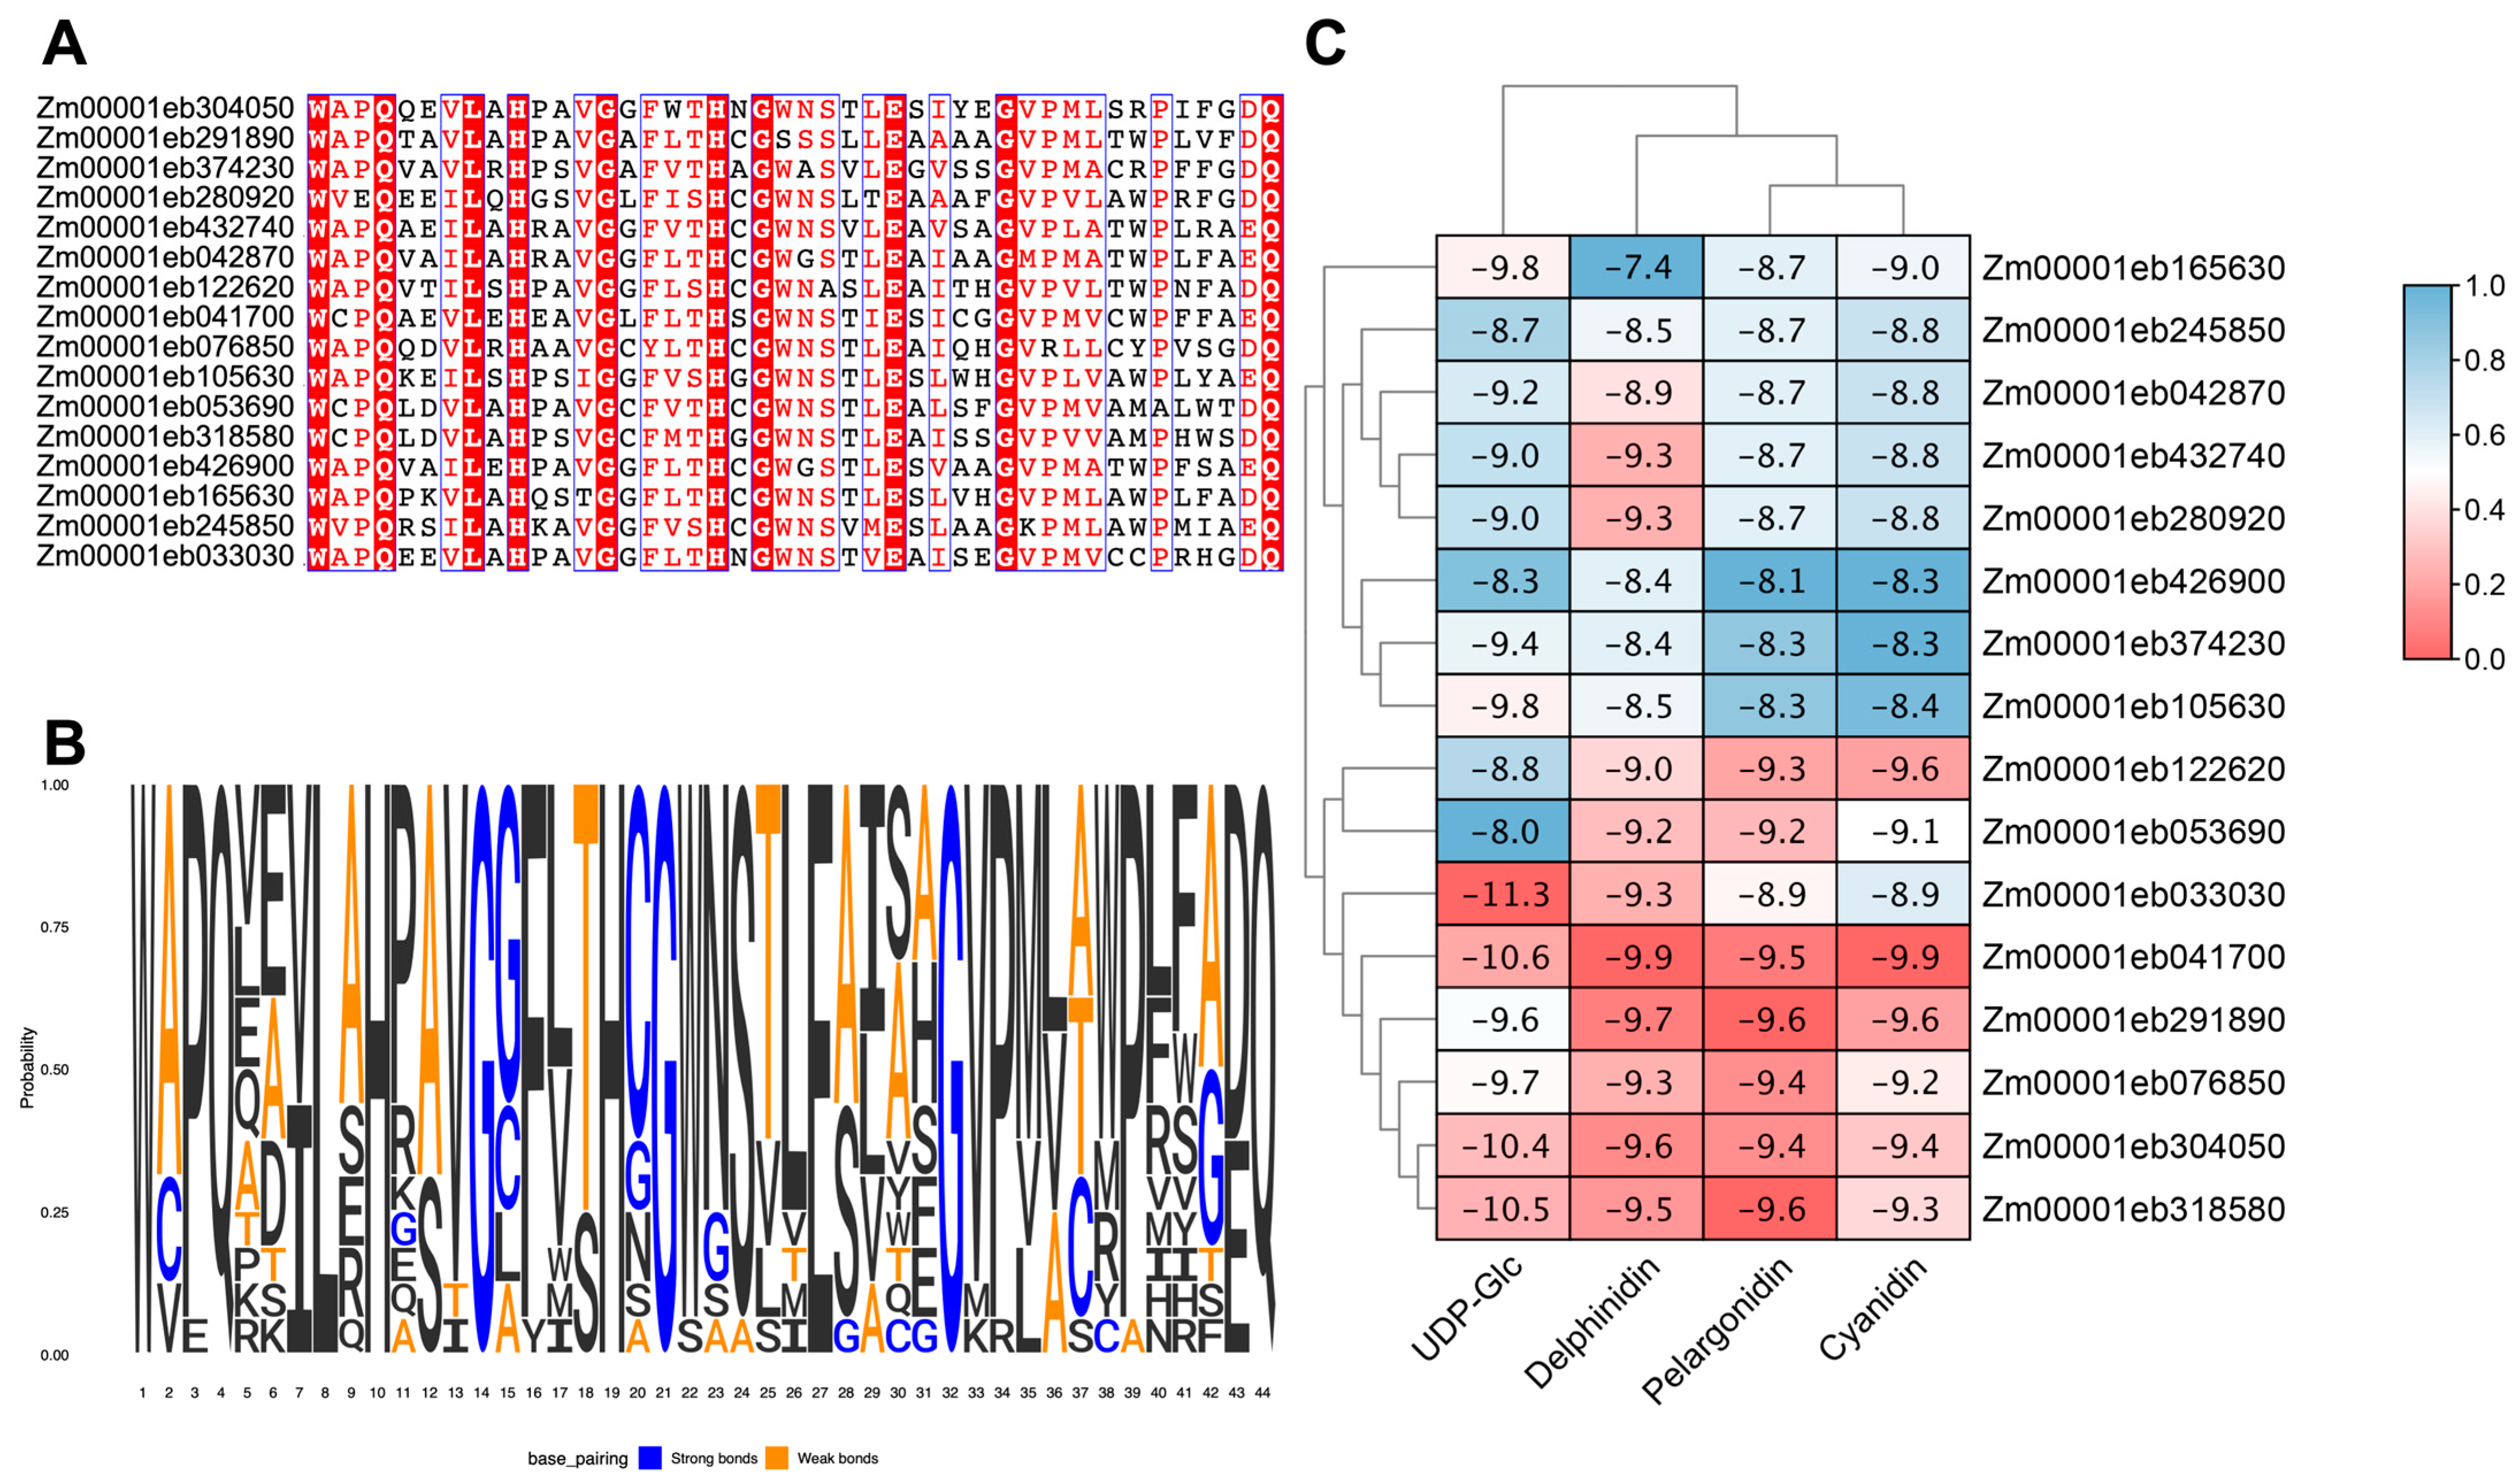
3.5. Candidate GT1 Genes in Anthocyanin Biosynthesis

Theoretically, genes involved in the same metabolic pathway can be highly co-expressed in plant tissues [42]. The last two steps of the biosynthetic pathways of anthocyanins are catalyzed by ANS and GT1 (Figure S2). Thus, to identify the GT1 involved in anthocyanin biosynthesis, we conducted gene expression profiling with ANS genes. A set of 14 ANS genes were identified in maize by searching for ANS orthologs of Arabidopsis (Table S4). The results showed that 16 GT1s exhibited similar expression patterns to those of ANSs and clustered well with ANSs (Figure 4), which might serve as candidate genes contributing to glycosylation in anthocyanin biosynthesis. Of these GT1s, only Zm00001eb374230 has been announced as putative anthocyanidin 3GT involved in anthocyanin biosynthesis [43].
These 16 GT1 candidates belonged to nine phylogenetic groups, including three members in Groups D and E; two members each in Groups H, L, and Q; and one each in Groups C, F, G, and N. Multiple sequence analysis showed that the majority of the residues in the PSPG motif were highly conserved with consistent amino acids in positions 1 (W), 4 (Q), 8 (L), 10 (H), 14 (G), 19 (H), 21 (G), 27 (E), 32 (G), and 44 (Q) (Figure 5A,B). The results suggested that these 16 GT1s might participate in similar biological pathways.

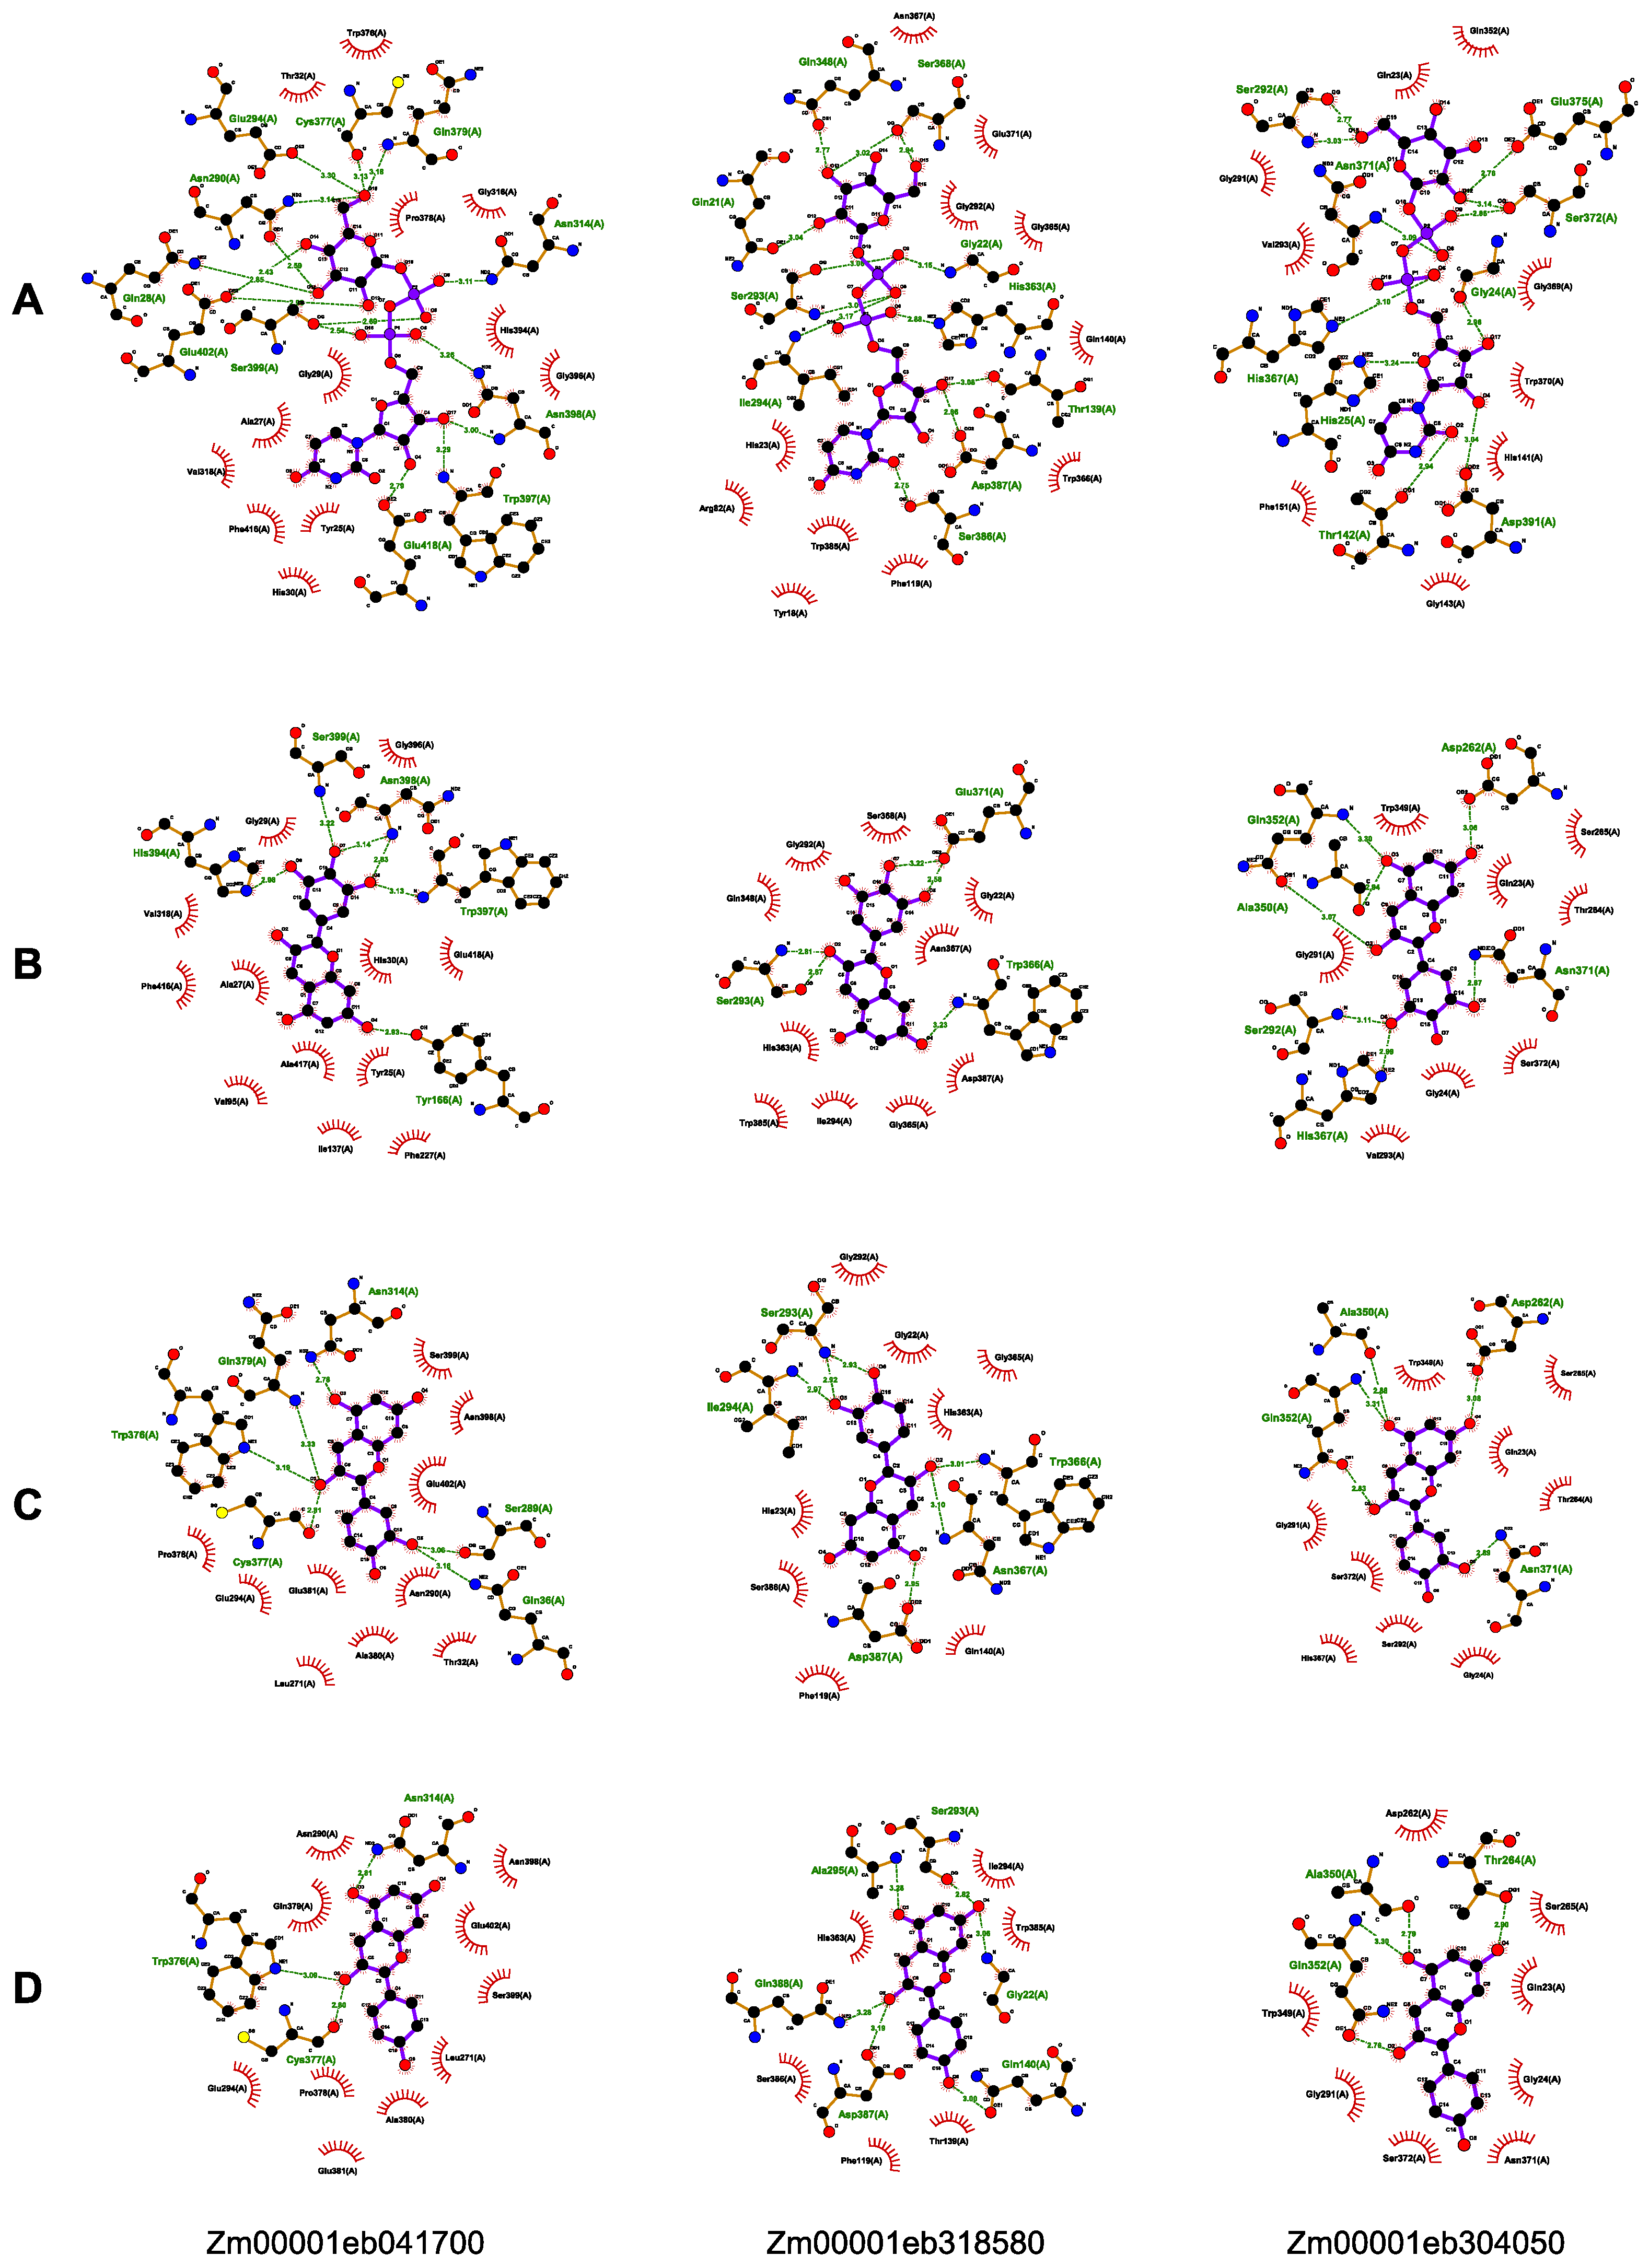
3.6. Molecular Docking of GT1s

The molecular docking study was carried out to examine the binding interactions of GT1s with the substrates, UDP-Glc, delphinidin, pelargonidin, and cyanidin, associated with anthocyanin glycosylation. All the 16 GT1s exhibited high affinity with the tested substrates, displaying minimum binding energies ranging from −8.0 to −11.3 kcal/mol with UDP-Glc, −7.4 to −9.9 kcal/mol with delphinidin, −8.1 to −9.6 kcal/mol with pelargonidin, and −8.3 to −9.9 kcal/mol with cyanidin. Zm00001eb033030 demonstrated the strongest binding to UDP-Glc (−11.3 kcal/mol), Zm00001eb041700 bound strongly to delphinidin (−9.9 kcal/mol) and cyanidin (−9.9 kcal/mol), and Zm00001eb291800 and Zm00001eb318580 had a comparable higher binding affinity to pelargonidin (−9.6 kcal/mol). Furthermore, three GT1s, Zm00001eb041700, Zm00001eb304050, and Zm00001eb318500, showed a better docking efficiency with all four substrates (Figure 5C). The molecular docking simulation indicated that GT1s might interact with the four substrates by forming several hydrogen bonds and hydrophobic interactions (Figure 6). UDP-Glc mainly interacted with GT1s around amino acid residues of the PSPG motif (Figure 6A).

4. Discussion

GT1 is the largest family of glycosyltransferase. To date, the CAZy database collected over 43,000 proteins of GT1s from nearly 8000 species, including bacteria, animals, plants, fungi, and viruses. Approximately one third of the GT1 members were from plants. A total of 316 GT1s have been identified from different maize lines, and only 107 unigenes were retrieved from the B73 reference genome through sequence blasts of each GT1. Some GT1 proteins from the CAZy database might be aligned to the same reference gene. However, sequence differences in these GT1s might lead to a divergence in substrate recognition and catalyzation.
Phylogenetic analysis revealed that Groups E and L have the most GT1 members, consistent with previous studies in Arabidopsis, maize, sorghum, and grape [20] [25]. Group B always contains limited gene members [20]. Group B has a relatively close relationship with Group Q and all the GT1s close to Group B were precisely divided into Group Q, which might be why no GT1 belonging to Group B was identified in this study. Conserved motif analysis showed that the C-terminus of GT1s had more conserved motifs including PSPG motifs, which is related to the recognition and catalyzation of UDP-Glc. Similarly, GT1 had a higher affinity with the donor sugar UDP-Glc but not with the receptor molecules in molecular docking analysis. Interestingly, even if some GT1 genes contained a close phylogenetic relationship and were classified into the same group, they might have different conserved motif distributions and gene structures, leading to the development of new biological functions.
Gene duplication is one of the main forces acting on gene expansion and finally promoting the evolution of organisms [44]. A total of 58 GT1s were evolved from either WSD or segmental duplication, or tandem duplication. Both types of gene duplication equally contributed to the expansion of GT1s, whereas the GT1 family might primarily evolve through tandem duplication in Arabidopsis [45]. We also found motif duplication in some GT1 members, which might be another manner to expand GT1 members with novel functions.
For the GT1 gene members, we were specifically interested in those that might play roles in anthocyanin biosynthesis. Zm00001eb374230 (BZ1) is predicted to encode a 3GT, and a mutation of BZ1 resulted in reduced anthocyanin accumulation in the seed aleurone layer, the seeding coleoptile, and the stem of maize plants [43]. Expression profiles and molecular docking analysis suggested that some GT1s play an important role in anthocyanin biosynthesis. Three GT1s, Zm00001eb033030, Zm00001eb304050, and Zm00001eb318580, have stronger binding to the donor and receptors than BZ1, indicating their potential functions in the production of higher anthocyanins. This speculation also needs to be further validated through experimental analysis.
In conclusion, a total of 107 GT1s were obtained from the whole-genome identification of the reference genome and systemically analyzed. All GT1s were highly conserved, containing the PSPG motif and glycosyltransferase-related domain. Gene duplication and motif duplication expanded GT1 members at the whole-genome level and provided new gene births during the evolution of maize. Candidate GT1s in anthocyanin biosynthesis were predicted through expression analysis with ANS and testified through molecular docking. The results are beneficial for the functional study of GT1s and will promote the production of anthocyanin biosynthesis in synthetic biology.

Supplementary Materials

The following supporting information can be downloaded at https://www.mdpi.com/article/10.3390/genes14112099/s1, Figure S1: Multiple sequence alignment of 107 GT1 proteins; Figure S2: Expression profiles of ANS genes involved in anthocyanin biosynthesis; Table S1: Conserved motif features of GT1s; Table S2: Summary of gene clusters of GT1s in all maize chromosomes; Table S3: Summary of duplicated gene pairs of GT1s; Table S4: Putative ANS genes of maize.

Author Contributions

Conceptualization, H.L., W.Z. and Y.L. (Yan Long); methodology, H.L., Y.L. (Yiping Li) and Z.J.; software, H.L. and Y.L. (Yiping Li); validation, H.L. and Y.L. (Yan Long); formal analysis, Y.L. (Yiping Li) and X.W.; data curation, H.L., Y.L. (Yiping Li) and Y.L. (Yan Long); writing—original draft preparation, H.L. and Y.L. (Yiping Li); writing—review and editing, W.Z. and Y.L. (Yan Long); supervision, Y.L. (Yan Long); project administration, Y.L. (Yan Long); funding acquisition, Y.L. (Yan Long). All authors have read and agreed to the published version of the manuscript.

Funding

This research was funded by the National Key Research and Development Program of China, grant number (2022YFF1100501).

Institutional Review Board Statement

Not applicable.

Informed Consent Statement

Not applicable.

Data Availability Statement

Data are contained within the article.

Conflicts of Interest

The authors declare no conflict of interest.

References

  1. Strasser, R. Plant protein glycosylation. Glycobiology 2016, 26, 926–939. [Google Scholar] [CrossRef] [PubMed]
  2. Zhang, G.Z.; Jin, S.H.; Jiang, X.Y.; Dong, R.R.; Li, P.; Li, Y.J.; Hou, B.K. Ectopic expression of UGT75D1, a glycosyltransferase preferring indole-3-butyric acid, modulates cotyledon development and stress tolerance in seed germination of Arabidopsis thaliana. Plant Mol. Biol. 2016, 90, 77–93. [Google Scholar] [CrossRef] [PubMed]
  3. Wang, J.; Hou, B. Glycosyltransferases: Key players involved in the modification of plant secondary metabolites. Front. Biol. China 2009, 4, 39–46. [Google Scholar] [CrossRef]
  4. Jones, P.; Messner, B.; Nakajima, J.; Schäffner, A.R.; Saito, K. UGT73C6 and UGT78D1, glycosyltransferases involved in flavonol glycoside biosynthesis in Arabidopsis thaliana. J. Biol. Chem. 2003, 278, 43910–43918. [Google Scholar] [CrossRef] [PubMed]
  5. Yin, R.; Han, K.; Heller, W.; Albert, A.; Dobrev, P.I.; Zažímalová, E.; Schäffner, A.R. Kaempferol 3-O-rhamnoside-7-O-rhamnoside is an endogenous flavonol inhibitor of polar auxin transport in Arabidopsis shoots. New Phytol. 2014, 201, 466–475. [Google Scholar] [CrossRef]
  6. Hofer, B. Recent developments in the enzymatic O-glycosylation of flavonoids. Appl. Microbiol. Biotechnol. 2016, 100, 4269–4281. [Google Scholar] [CrossRef]
  7. Liu, Z.; Yan, J.P.; Li, D.K.; Luo, Q.; Yan, Q.; Liu, Z.B.; Ye, L.M.; Wang, J.M.; Li, X.F.; Yang, Y. UDP-glucosyltransferase71c5, a major glucosyltransferase, mediates abscisic acid homeostasis in Arabidopsis. Plant Physiol. 2015, 167, 1659–1670. [Google Scholar] [CrossRef]
  8. Poppenberger, B.; Fujioka, S.; Soeno, K.; George, G.L.; Vaistij, F.E.; Hiranuma, S.; Seto, H.; Takatsuto, S.; Adam, G.; Yoshida, S.; et al. The UGT73C5 of Arabidopsis thaliana glucosylates brassinosteroids. Proc. Natl. Acad. Sci. USA 2005, 102, 15253–15258. [Google Scholar] [CrossRef]
  9. Tanaka, K.; Hayashi, K.; Natsume, M.; Kamiya, Y.; Sakakibara, H.; Kawaide, H.; Kasahara, H. UGT74D1 catalyzes the glucosylation of 2-oxindole-3-acetic acid in the auxin metabolic pathway in Arabidopsis. Plant Cell Physiol. 2014, 55, 218–228. [Google Scholar] [CrossRef]
  10. Wang, J.; Ma, X.M.; Kojima, M.; Sakakibara, H.; Hou, B.K. Glucosyltransferase UGT76C1 finely modulates cytokinin responses via cytokinin N-glucosylation in Arabidopsis thaliana. Plant Physiol. Biochem. 2013, 65, 9–16. [Google Scholar] [CrossRef]
  11. George Thompson, A.M.; Iancu, C.V.; Neet, K.E.; Dean, J.V.; Choe, J.Y. Differences in salicylic acid glucose conjugations by UGT74F1 and UGT74F2 from Arabidopsis thaliana. Sci. Rep. 2017, 7, 46629. [Google Scholar] [CrossRef]
  12. Tognetti, V.B.; Van Aken, O.; Morreel, K.; Vandenbroucke, K.; van de Cotte, B.; De Clercq, I.; Chiwocha, S.; Fenske, R.; Prinsen, E.; Boerjan, W.; et al. Perturbation of indole-3-butyric acid homeostasis by the UDP-glucosyltransferase UGT74E2 modulates Arabidopsis architecture and water stress tolerance. Plant Cell 2010, 22, 2660–2679. [Google Scholar] [CrossRef]
  13. Von Saint Paul, V.; Zhang, W.; Kanawati, B.; Geist, B.; Faus-Kessler, T.; Schmitt-Kopplin, P.; Schäffner, A.R. The Arabidopsis glucosyltransferase UGT76B1 conjugates isoleucic acid and modulates plant defense and senescence. Plant Cell 2011, 23, 4124–4145. [Google Scholar] [CrossRef]
  14. Gharabli, H.; Della Gala, V.; Welner, D.H. The function of UDP-glycosyltransferases in plants and their possible use in crop protection. Biotechnol. Adv. 2023, 67, 108182. [Google Scholar] [CrossRef]
  15. Lairson, L.L.; Henrissat, B.; Davies, G.J.; Withers, S.G. Glycosyltransferases: Structures, functions, and mechanisms. Annu. Rev. Biochem. 2008, 77, 521–555. [Google Scholar] [CrossRef]
  16. Yonekura-Sakakibara, K.; Hanada, K. An evolutionary view of functional diversity in family 1 glycosyltransferases. Plant J. 2011, 66, 182–193. [Google Scholar] [CrossRef] [PubMed]
  17. Bowles, D.; Lim, E.K.; Poppenberger, B.; Vaistij, F.E. Glycosyltransferases of lipophilic small molecules. Annu. Rev. Plant Biol. 2006, 57, 567–597. [Google Scholar] [CrossRef]
  18. Liang, D.M.; Liu, J.H.; Wu, H.; Wang, B.B.; Zhu, H.J.; Qiao, J.J. Glycosyltransferases: Mechanisms and applications in natural product development. Chem. Soc. Rev. 2015, 44, 8350–8374. [Google Scholar] [CrossRef]
  19. Zhang, P.; Zhang, Z.; Zhang, L.; Wang, J.; Wu, C. Glycosyltransferase GT1 family: Phylogenetic distribution, substrates coverage, and representative structural features. Comput. Struct. Biotechnol. J. 2020, 18, 1383–1390. [Google Scholar] [CrossRef]
  20. Caputi, L.; Malnoy, M.; Goremykin, V.; Nikiforova, S.; Martens, S. A genome-wide phylogenetic reconstruction of family 1 UDP-glycosyltransferases revealed the expansion of the family during the adaptation of plants to life on land. Plant J. 2012, 69, 1030–1042. [Google Scholar] [CrossRef]
  21. Sun, G.; Liao, J.; Kurze, E.; Hoffmann, T.D.; Steinchen, W.; McGraphery, K.; Habegger, R.; Marek, L.; Catici, D.A.M.; Ludwig, C.; et al. Apocarotenoids are allosteric effectors of a dimeric plant glycosyltransferase involved in defense and lignin formation. New Phytol. 2023, 238, 2080–2098. [Google Scholar] [CrossRef]
  22. Wang, Y.W.; Wang, W.C.; Jin, S.H.; Wang, J.; Wang, B.; Hou, B.K. Over-expression of a putative poplar glycosyltransferase gene, PtGT1, in tobacco increases lignin content and causes early flowering. J. Exp. Bot. 2012, 63, 2799–2808. [Google Scholar] [CrossRef] [PubMed]
  23. Sun, X.; Xue, X.; Wang, X.; Zhang, C.; Zheng, D.; Song, W.; Zhao, J.; Wei, J.; Wu, Z.; Zhang, Z. Natural variation of ZmCGT1 is responsible for isoorientin accumulation in maize silk. Plant J. 2022, 109, 64–76. [Google Scholar] [CrossRef] [PubMed]
  24. Vogt, T.; Jones, P. Glycosyltransferases in plant natural product synthesis: Characterization of a supergene family. Trends Plant Sci. 2000, 5, 380–386. [Google Scholar] [CrossRef]
  25. Li, Y.; Li, P.; Wang, Y.; Dong, R.; Yu, H.; Hou, B. Genome-wide identification and phylogenetic analysis of Family-1 UDP glycosyltransferases in maize (Zea mays). Planta 2014, 239, 1265–1279. [Google Scholar] [CrossRef]
  26. Lu, L.; Hou, Q.; Wang, L.; Zhang, T.; Zhao, W.; Yan, T.; Zhao, L.; Li, J.; Wan, X. Genome-Wide Identification and Characterization of Polygalacturonase Gene Family in Maize (Zea mays L.). Int. J. Mol. Sci. 2021, 22, 722. [Google Scholar] [CrossRef]
  27. Zhu, T.; Wu, S.; Zhang, D.; Li, Z.; Xie, K.; An, X.; Ma, B.; Hou, Q.; Dong, Z.; Tian, Y.; et al. Genome-wide analysis of maize GPAT gene family and cytological characterization and breeding application of ZmMs33/ZmGPAT6 gene. Theor. Appl. Genet. 2019, 132, 2137–2154. [Google Scholar] [CrossRef]
  28. Zhang, Y.; Li, Z.; Ma, B.; Hou, Q.; Wan, X. Phylogeny and Functions of LOB Domain Proteins in Plants. Int. J. Mol. Sci. 2020, 21, 2278. [Google Scholar] [CrossRef]
  29. Hou, Q.; Wang, L.; Qi, Y.; Yan, T.; Zhang, F.; Zhao, W.; Wan, X. A systematic analysis of the subtilase gene family and expression and subcellular localization investigation of anther-specific members in maize. Plant Physiol. Biochem. 2023, 203, 108041. [Google Scholar] [CrossRef]
  30. Fang, C.; Wu, S.; Li, Z.; Pan, S.; Wu, Y.; An, X.; Long, Y.; Wei, X.; Wan, X. A Systematic Investigation of Lipid Transfer Proteins Involved in Male Fertility and Other Biological Processes in Maize. Int. J. Mol. Sci. 2023, 24, 1660. [Google Scholar] [CrossRef]
  31. Drula, E.; Garron, M.L.; Dogan, S.; Lombard, V.; Henrissat, B.; Terrapon, N. The carbohydrate-active enzyme database: Functions and literature. Nucleic Acids Res. 2022, 50, D571–D577. [Google Scholar] [CrossRef]
  32. Hufford, M.B.; Seetharam, A.S.; Woodhouse, M.R.; Chougule, K.M.; Ou, S.; Liu, J.; Ricci, W.A.; Guo, T.; Olson, A.; Qiu, Y.; et al. De novo assembly, annotation, and comparative analysis of 26 diverse maize genomes. Science 2021, 373, 655–662. [Google Scholar] [CrossRef] [PubMed]
  33. Robert, X.; Gouet, P. Deciphering key features in protein structures with the new ENDscript server. Nucleic Acids Res 2014, 42, W320–W324. [Google Scholar] [CrossRef] [PubMed]
  34. Chen, C.; Chen, H.; Zhang, Y.; Thomas, H.R.; Frank, M.H.; He, Y.; Xia, R. TBtools: An integrative toolkit developed for interactive analyses of big biological data. Mol. Plant 2020, 13, 1194–1202. [Google Scholar] [CrossRef] [PubMed]
  35. Subramanian, B.; Gao, S.; Lercher, M.J.; Hu, S.; Chen, W.H. Evolview v3: A webserver for visualization, annotation, and management of phylogenetic trees. Nucleic Acids Res. 2019, 47, W270–W275. [Google Scholar] [CrossRef]
  36. Li, Y.; Baldauf, S.; Lim, E.K.; Bowles, D.J. Phylogenetic analysis of the UDP-glycosyltransferase multigene family of Arabidopsis thaliana. J. Biol. Chem. 2001, 276, 4338–4343. [Google Scholar] [CrossRef]
  37. Walley, J.W.; Sartor, R.C.; Shen, Z.; Schmitz, R.J.; Wu, K.J.; Urich, M.A.; Nery, J.R.; Smith, L.G.; Schnable, J.C.; Ecker, J.R.; et al. Integration of omic networks in a developmental atlas of maize. Science 2016, 353, 814–818. [Google Scholar] [CrossRef]
  38. Morris, G.M.; Huey, R.; Lindstrom, W.; Sanner, M.F.; Belew, R.K.; Goodsell, D.S.; Olson, A.J. AutoDock4 and AutoDockTools4: Automated docking with selective receptor flexibility. J. Comput. Chem. 2009, 30, 2785–2791. [Google Scholar] [CrossRef]
  39. Eberhardt, J.; Santos-Martins, D.; Tillack, A.F.; Forli, S. AutoDock Vina 1.2.0: New Docking Methods, Expanded Force Field, and Python Bindings. J. Chem. Inf. Model. 2021, 61, 3891–3898. [Google Scholar] [CrossRef]
  40. Trott, O.; Olson, A.J. AutoDock Vina: Improving the speed and accuracy of docking with a new scoring function, efficient optimization, and multithreading. J. Comput. Chem. 2010, 31, 455–461. [Google Scholar] [CrossRef]
  41. Laskowski, R.A.; Swindells, M.B. LigPlot+: Multiple ligand-protein interaction diagrams for drug discovery. J. Chem. Inf. Model. 2011, 51, 2778–2786. [Google Scholar] [CrossRef] [PubMed]
  42. Saito, K.; Hirai, M.Y.; Yonekura-Sakakibara, K. Decoding genes with coexpression networks and metabolomics-‘majority report by precogs’. Trends Plant Sci. 2008, 13, 36–43. [Google Scholar] [CrossRef] [PubMed]
  43. Wang, J.; Li, D.; Peng, Y.; Cai, M.; Liang, Z.; Yuan, Z.; Du, X.; Wang, J.; Schnable, P.S.; Gu, R.; et al. The anthocyanin accumulation related ZmBZ1, facilitates seedling salinity stress tolerance via ROS scavenging. Int. J. Mol. Sci. 2022, 23, 16123. [Google Scholar] [CrossRef]
  44. Magadum, S.; Banerjee, U.; Murugan, P.; Gangapur, D.; Ravikesavan, R. Gene duplication as a major force in evolution. J. Genet. 2013, 92, 155–161. [Google Scholar] [CrossRef] [PubMed]
  45. Cannon, S.B.; Mitra, A.; Baumgarten, A.; Young, N.D.; May, G. The roles of segmental and tandem gene duplication in the evolution of large gene families in Arabidopsis thaliana. BMC Plant Biol. 2004, 4, 10. [Google Scholar] [CrossRef]
Figure 1. Phylogenetic analysis of GT1 family members from maize and Arabidopsis. Phylogenetic tree of GT1 genes constructed using the maximum likelihood (ML) method using TBtools. The Bootstrap value was 5000 replicates. The colored background represents the different groups of GT1s.
Genes 14 02099 g001
Figure 2. Conserved motifs, domains, and gene structures of maize GT1s. (A) Phylogenetic relationship of GT1 members. (B) Motif compositions of GT1s. Ten different motifs are shown using variously colored boxes. (C) Conserved domains were predicted using MEME. (D) Gene structure of GT1s.
Genes 14 02099 g002
Figure 3. Chromosomal distribution and collinearity analysis of maize GT1s. (A) Distribution of GT1 gene family on ten maize chromosomes. (B) Collinearity analysis of maize GT1s. Gray lines indicate syntenic blocks within the maize genome, and red lines represent duplicated GT1 gene pairs.
Genes 14 02099 g003
Figure 4. Heat map of GT1 and ANS gene expression in multiple maize plant tissues. The relative expression levels are depicted according to the color scale, where a change from green to red indicates transcript abundance from low to high. The phylogenetic relationships are shown in the center. Gene IDs in red represent the ANS genes and those in blue represent the selected GT1s clustered together with ANSs.
Genes 14 02099 g004
Figure 5. Molecular docking analysis of maize GT1s. (A) Multiple sequence alignment of the PSPG motifs from 16 selected GT1 protein that may be involved in anthocyanin biosynthesis. (B) The amino acid frequency in the conserved PSPG motifs of GT1 proteins. (C) Heat map of docking results for GT1 with different substrates. The numbers indicate affinity energies (kcal/mol). The phylogenetic relationships are shown on the top and left.
Genes 14 02099 g005
Figure 6. Molecular docking of three selected GT1s with UPD-Glc (A), delphinidin (B), pelargonidin (C), and cyanidin (D). The compounds with purple bonds represent the ligands, and the amino acids with brown bonds are from the receptors. Green dotted line between the amino acids represents hydrogen bonding and other amino acids show hydrophobic interactions. The black, red, blue and yellow balls represent the C, O, N and S atoms, respectively.
Genes 14 02099 g006
Table 1. Characteristics of GT1 genes in maize genome.
Gene IDChrChromosomal PositionLength
(aa)
Gene SymbolClassificationNumber of IntronsGene Type 1
Zm00001eb020950Chr179115933–79117889473 L0Proximal
Zm00001eb020970Chr179160471–79162703465 L2Tandem
Zm00001eb020980Chr179196751–79198788465 L2Tandem
Zm00001eb033030Chr1184391611–184393452462BX9H1Dispersed
Zm00001eb041700Chr1219547437–219549217496 G0Dispersed
Zm00001eb042870Chr1226122699–226124455507 D0Dispersed
Zm00001eb047200Chr1242648507–242654443492 K1WGD or Segmental
Zm00001eb051070Chr1259782541–259784813516 A1Dispersed
Zm00001eb053690Chr1269552894–269554690471IAGLU1L2Dispersed
Zm00001eb056990Chr1282218667–282220404474 Q1Dispersed
Zm00001eb057740Chr1284753755–284758573460 I2Tandem
Zm00001eb057750Chr1284764856–284766611457 I0WGD or Segmental
Zm00001eb057770Chr1284774974–284776823459 I1Tandem
Zm00001eb057790Chr1284779663–284781743458 I1Tandem
Zm00001eb061920Chr1298006146–298007982469 I1Dispersed
Zm00001eb074330Chr219866206–19867838467CZOG1O0Proximal
Zm00001eb074370Chr220057564–20059103465 O0Proximal
Zm00001eb076850Chr228481546–28485790511SK1N1WGD or Segmental
Zm00001eb077990Chr232158225–32160541471 M0Dispersed
Zm00001eb081210Chr245506320–45508428493 G1Proximal
Zm00001eb081230Chr245701694–45703531487 G1WGD or Segmental
Zm00001eb085770Chr276160840–76162497466 O0Dispersed
Zm00001eb087380Chr295946783–95948674489 G0Dispersed
Zm00001eb094890Chr2162271068–162276069492UGT5174H1WGD or Segmental
Zm00001eb096940Chr2174552351–174554493470 H1WGD or Segmental
Zm00001eb098300Chr2180463741–180465530476 N1Dispersed
Zm00001eb105190Chr2206674564–206676436480 P0Dispersed
Zm00001eb105580Chr2208529035–208530699427SM2A1Dispersed
Zm00001eb105610Chr2208610550–208612222480 E0WGD or Segmental
Zm00001eb105630Chr2208612412–208613837470 E0WGD or Segmental
Zm00001eb107750Chr2214236761–214238763474 F1Dispersed
Zm00001eb107760Chr2214252312–214254275470 A1Dispersed
Zm00001eb110790Chr2222058692–222060708456 M0Dispersed
Zm00001eb113190Chr2229706824–229708687487 D0WGD or Segmental
Zm00001eb114130Chr2232266306–232268281476 E0Dispersed
Zm00001eb122620Chr310681696–10683755525 D0WGD or Segmental
Zm00001eb122630Chr310830992–10832903484 D0Tandem
Zm00001eb135190Chr3115806978–115812646471 E4Dispersed
Zm00001eb138250Chr3137388625–137390462491 G0Dispersed
Zm00001eb146840Chr3180787206–180789032476 A0Tandem
Zm00001eb146850Chr3180819236–180820720473 A0Tandem
Zm00001eb146860Chr3180824047–180826007512 A0Tandem
Zm00001eb150460Chr3192562189–192565830474 J1WGD or Segmental
Zm00001eb150470Chr3192567391–192571400452 J2Tandem
Zm00001eb154000Chr3205428339–205450268488 E9Tandem
Zm00001eb158880Chr3221304007–221307439474 Q0Dispersed
Zm00001eb165410Chr43542471–3544431490 L0Dispersed
Zm00001eb165590Chr44060833–4062879491BX8H2Dispersed
Zm00001eb165630Chr44116762–4118560491 E0Dispersed
Zm00001eb167530Chr48333244–8335422502 E1Dispersed
Zm00001eb170440Chr424818567–24820532516 D0WGD or Segmental
Zm00001eb170510Chr425081389–25083426483 D0Proximal
Zm00001eb172500Chr434588042–34589834490 I1Dispersed
Zm00001eb194060Chr4185323500–185325440484 G1Proximal
Zm00001eb194070Chr4185374820–185376744484 G1WGD or Segmental
Zm00001eb196550Chr4192838263–192841161522 L0WGD or Segmental
Zm00001eb196630Chr4193168606–193170298458UFGT4A0Dispersed
Zm00001eb204620Chr4236014681–236017119503CEP2E0Tandem
Zm00001eb204630Chr4236082248–236084078485 E0Tandem
Zm00001eb206400Chr4243100226–243107731500 L0WGD or Segmental
Zm00001eb234750Chr5101616810–101621419491 L4WGD or Segmental
Zm00001eb240450Chr5161029842–161031557502 D0Tandem
Zm00001eb240460Chr5161031522–161033144474 D0Tandem
Zm00001eb244570Chr5178888288–178890479488 G1Dispersed
Zm00001eb245850Chr5183441650–183444276462 C1Tandem
Zm00001eb279380Chr6122762448–122764350470 G1WGD or Segmental
Zm00001eb279510Chr6123180906–123182259447 D0Dispersed
Zm00001eb280920Chr6130691016–130693844475CGT1E0WGD or Segmental
Zm00001eb280930Chr6130704890–130706769482UGT1E0Tandem
Zm00001eb280950Chr6130831473–130833292483CGT2E0Proximal
Zm00001eb290970Chr6166328839–166330747491 G0Dispersed
Zm00001eb291420Chr6167093344–167095148457 J1WGD or Segmental
Zm00001eb291880Chr6168153151–168154910509 Q0WGD or Segmental
Zm00001eb291890Chr6168199823–168201808493 Q0Tandem
Zm00001eb293450Chr6171371429–171373586473 E0Tandem
Zm00001eb293460Chr6171373527–171375229478 E0WGD or Segmental
Zm00001eb294040Chr6172699717–172701409482 M0Dispersed
Zm00001eb304010Chr723801316–23803037463UGT9250H1WGD or Segmental
Zm00001eb304050Chr724029052–24030857469UFGT2H1Tandem
Zm00001eb304060Chr724154958–24156803482 H1Proximal
Zm00001eb304070Chr724181111–24183054466 H1Proximal
Zm00001eb304120Chr724588945–24591016468CNGT1H1Proximal
Zm00001eb318570Chr7146013215–146015100472 L1WGD or Segmental
Zm00001eb318580Chr7146096773–146098587470 L1Tandem
Zm00001eb318970Chr7147684571–147686411456 G1Dispersed
Zm00001eb322260Chr7160217163–160219108476 E0Tandem
Zm00001eb322270Chr7160220531–160222324484 E0Tandem
Zm00001eb323960Chr7165932228–165934061483 E0Tandem
Zm00001eb323970Chr7166034566–166036489518UMC2716E0Tandem
Zm00001eb330430Chr7181720552–181722435480 A0WGD or Segmental
Zm00001eb337060Chr819469860–19471775500 L0WGD or Segmental
Zm00001eb337300Chr820579174–20581428476 L2Dispersed
Zm00001eb343000Chr867212322–67213925465 L0WGD or Segmental
Zm00001eb353640Chr8128038314–128040087465 E0WGD or Segmental
Zm00001eb360890Chr8156736301–156738932480 E0Dispersed
Zm00001eb367250Chr8173936706–173940214463CZOG2O0Dispersed
Zm00001eb371300Chr8182117851–182119448468 E0Tandem
Zm00001eb371350Chr8182219335–182220996477 E0WGD or Segmental
Zm00001eb374230Chr913120306–13122164471BZ1F1Dispersed
Zm00001eb380880Chr941151938–41153717479 E0WGD or Segmental
Zm00001eb381410Chr946177110–46178902484 E0Dispersed
Zm00001eb386000Chr992897492–92899854472UMC2700L0Tandem
Zm00001eb394980Chr9136330935–136332755486 E0Dispersed
Zm00001eb419710Chr10102460083–102462158474 L2Tandem
Zm00001eb419720Chr10102642521–102644377484 L2Tandem
Zm00001eb426900Chr10134433367–134435275500 D0Dispersed
Zm00001eb432740Chr10148886364–148888273482 Q0Dispersed
1 Gene type was determined through collinearity analysis. Dispersed means that the gene might arise from transposition. Proximal means that the gene might arise from small-scale transposition or arise from tandem duplication and insertion of some other genes. WGD or segmental means that the gene might arise from whole-genome duplication (WSD) or segmental duplication.
Disclaimer/Publisher’s Note: The statements, opinions and data contained in all publications are solely those of the individual author(s) and contributor(s) and not of MDPI and/or the editor(s). MDPI and/or the editor(s) disclaim responsibility for any injury to people or property resulting from any ideas, methods, instructions or products referred to in the content.

