
Comparative Transcriptomic Analysis of Largemouth Bass (Micropterus salmoides) Livers Reveals Response Mechanisms to High Temperatures


 and
and 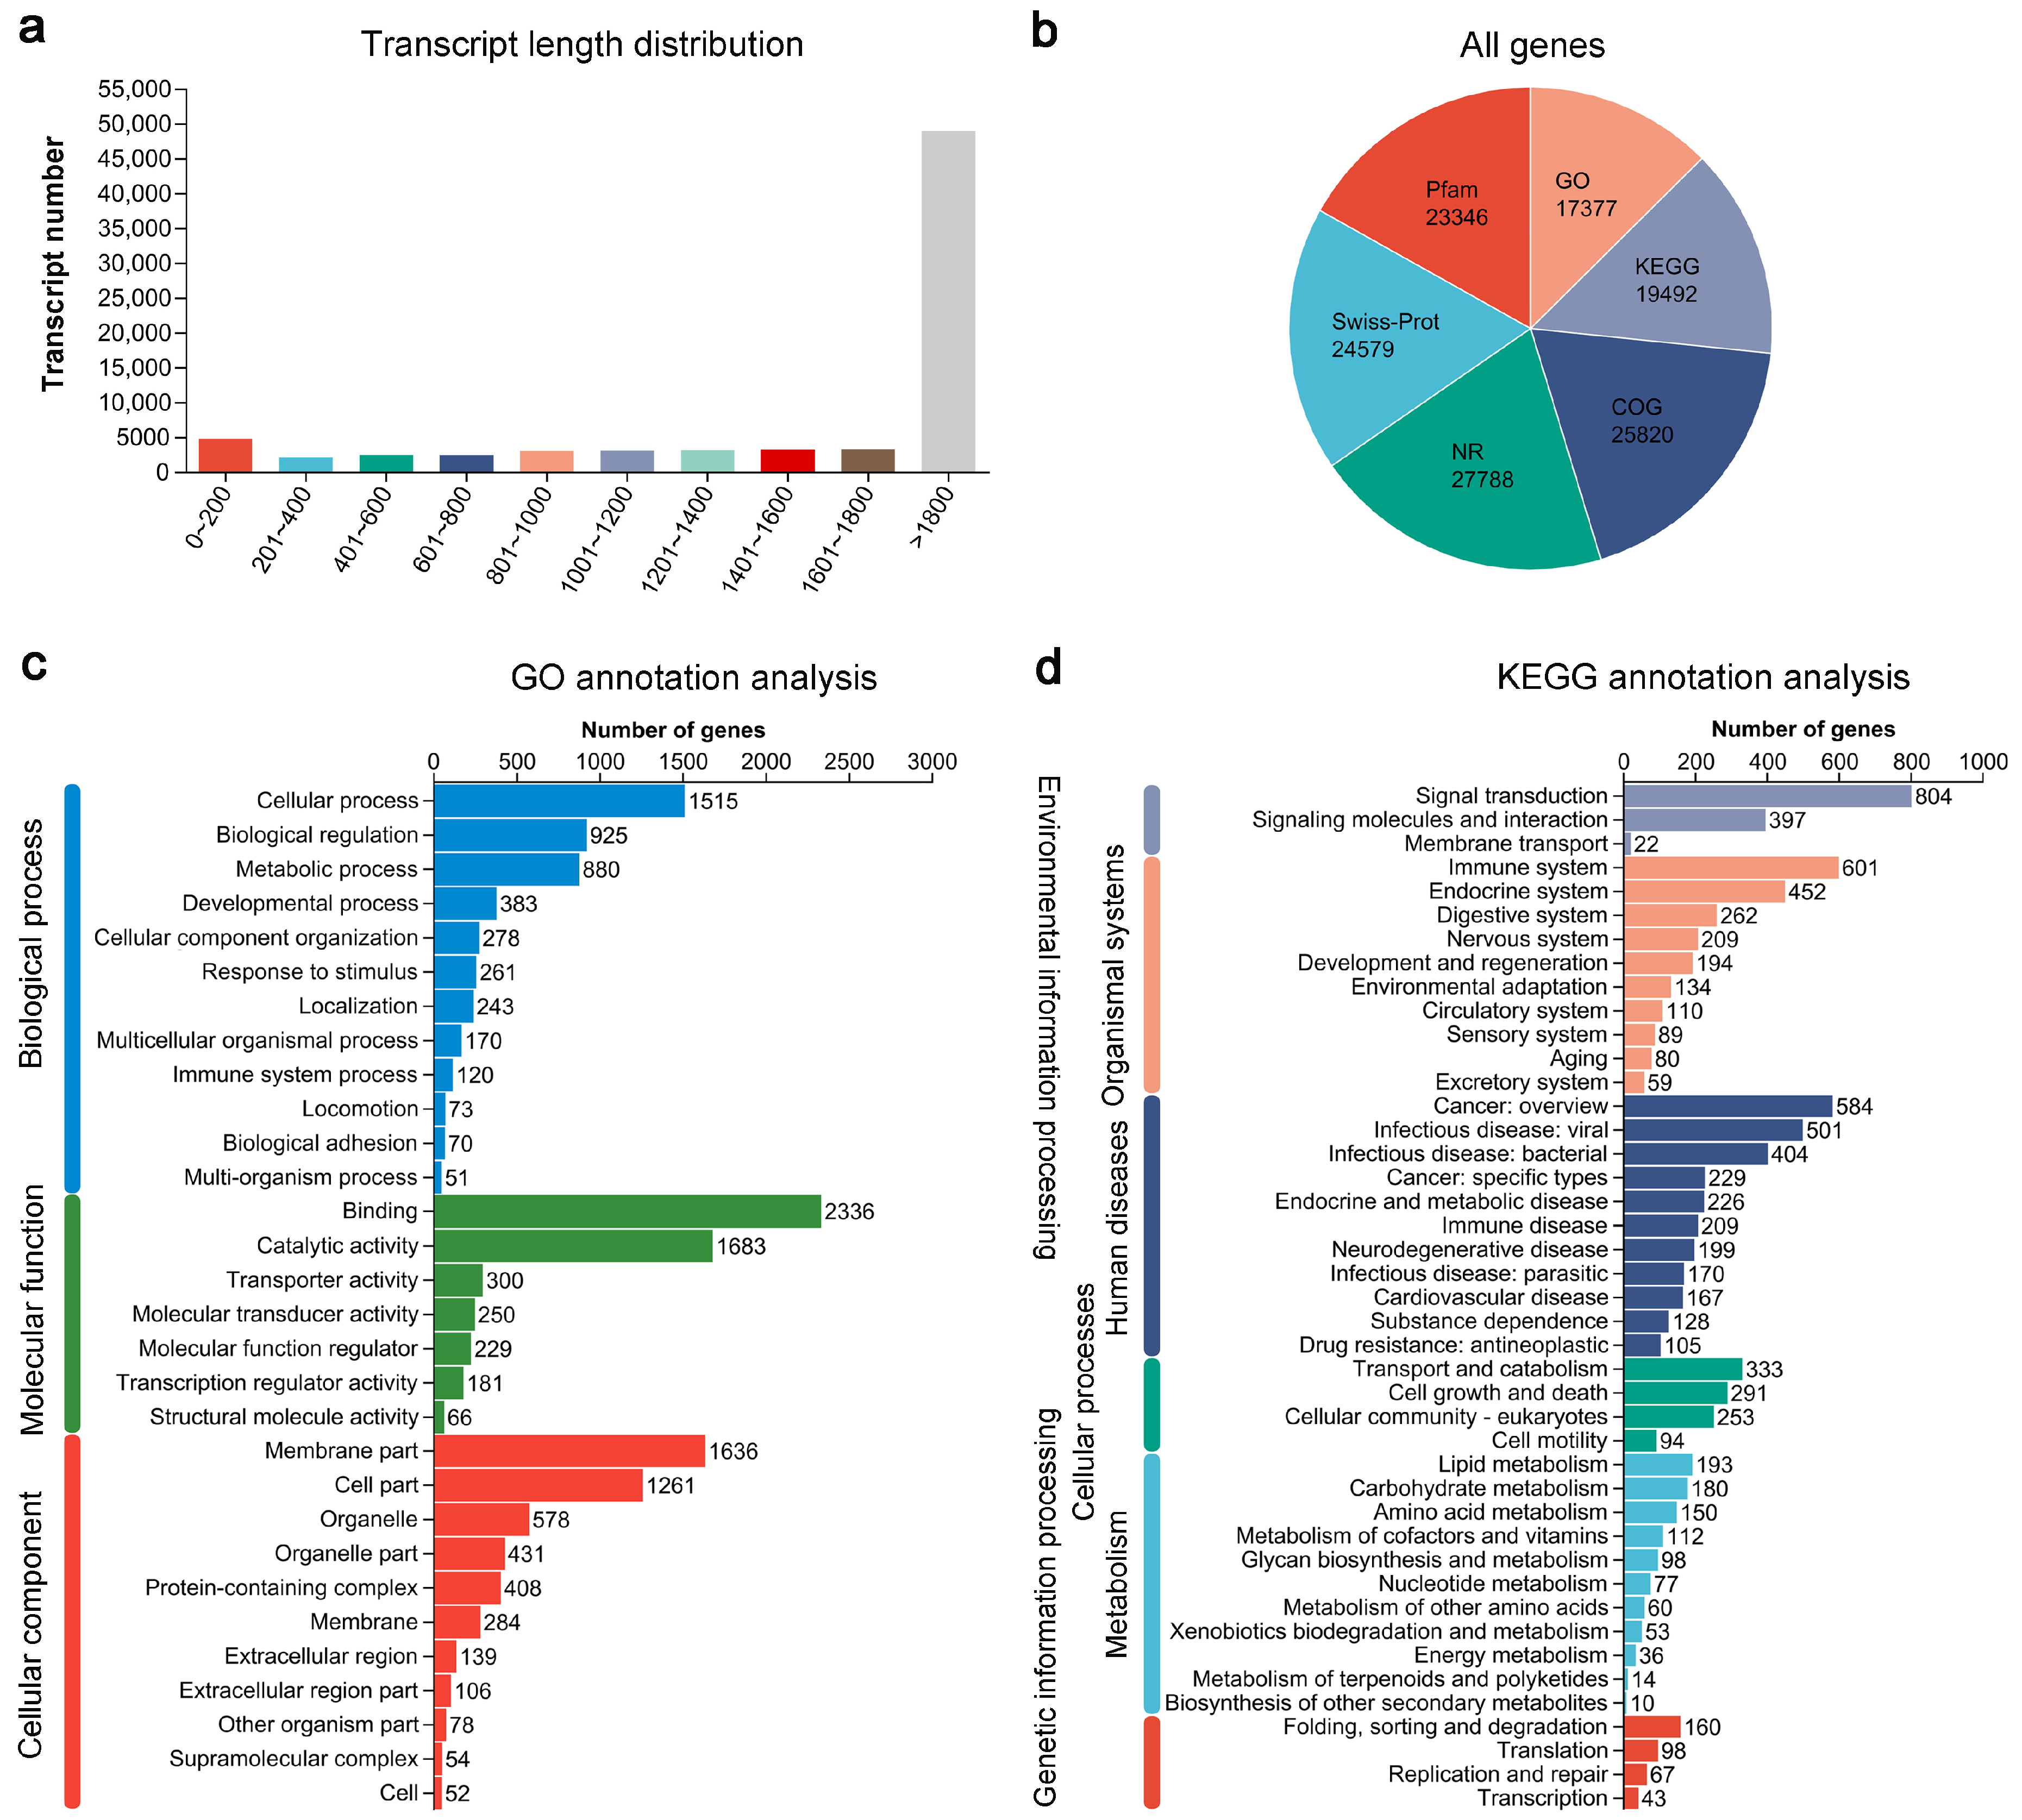
Abstract
:1. Introduction
2. Materials and Methods
2.1. Animal Materials and Rearing Conditions
2.2. HS Treatment and Sample Collection
2.3. RNA Isolation, Library Construction and Illumina Sequencing
2.4. Transcriptome Assembly and DEG Screening
2.5. Functional Annotation and Enrichment Analyses
2.6. Short Time-Series Expression Miner (STEM) and Gene–Gene Interaction (GGI) Analyses
2.7. RNA Isolation and qRT-PCR Analysis
2.8. Statistical Analysis
3. Results
3.1. Overview of Largemouth Bass Transcriptomes
3.2. Scanning of DEGs in Livers of Largemouth Bass in Response to HS
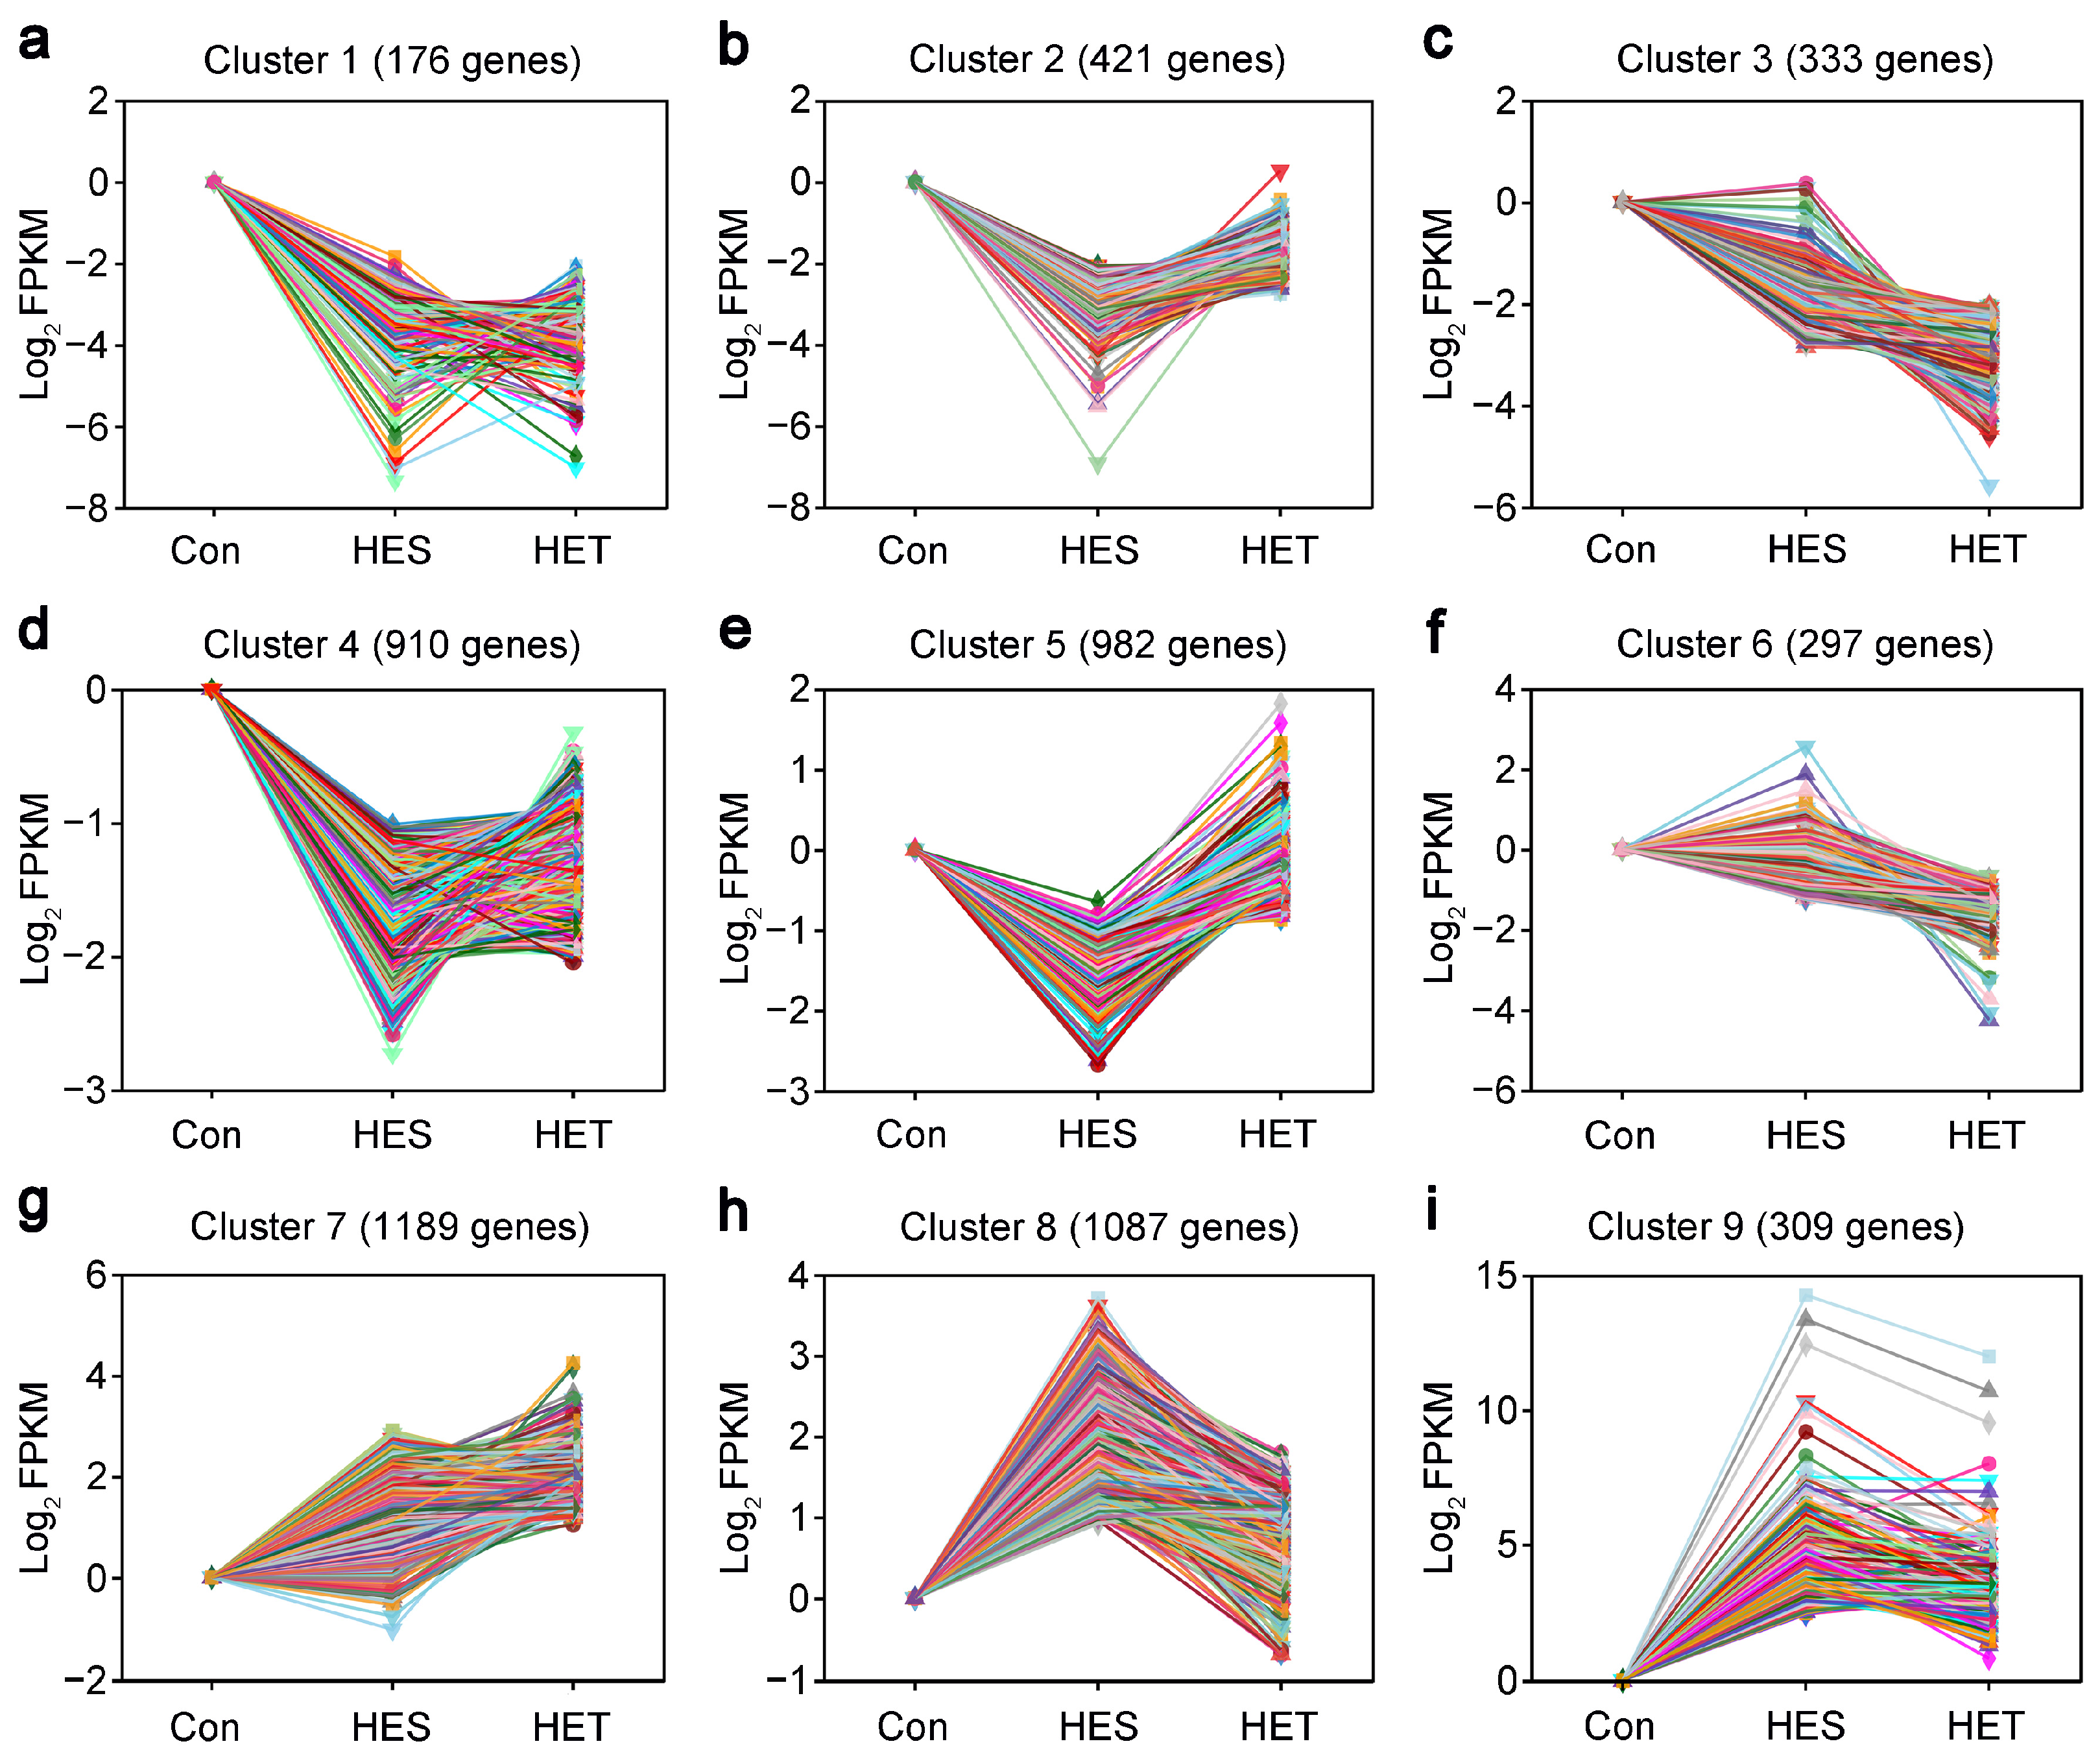
3.3. STEM Analysis of HS-Responsive DEGs in Livers of Largemouth Bass
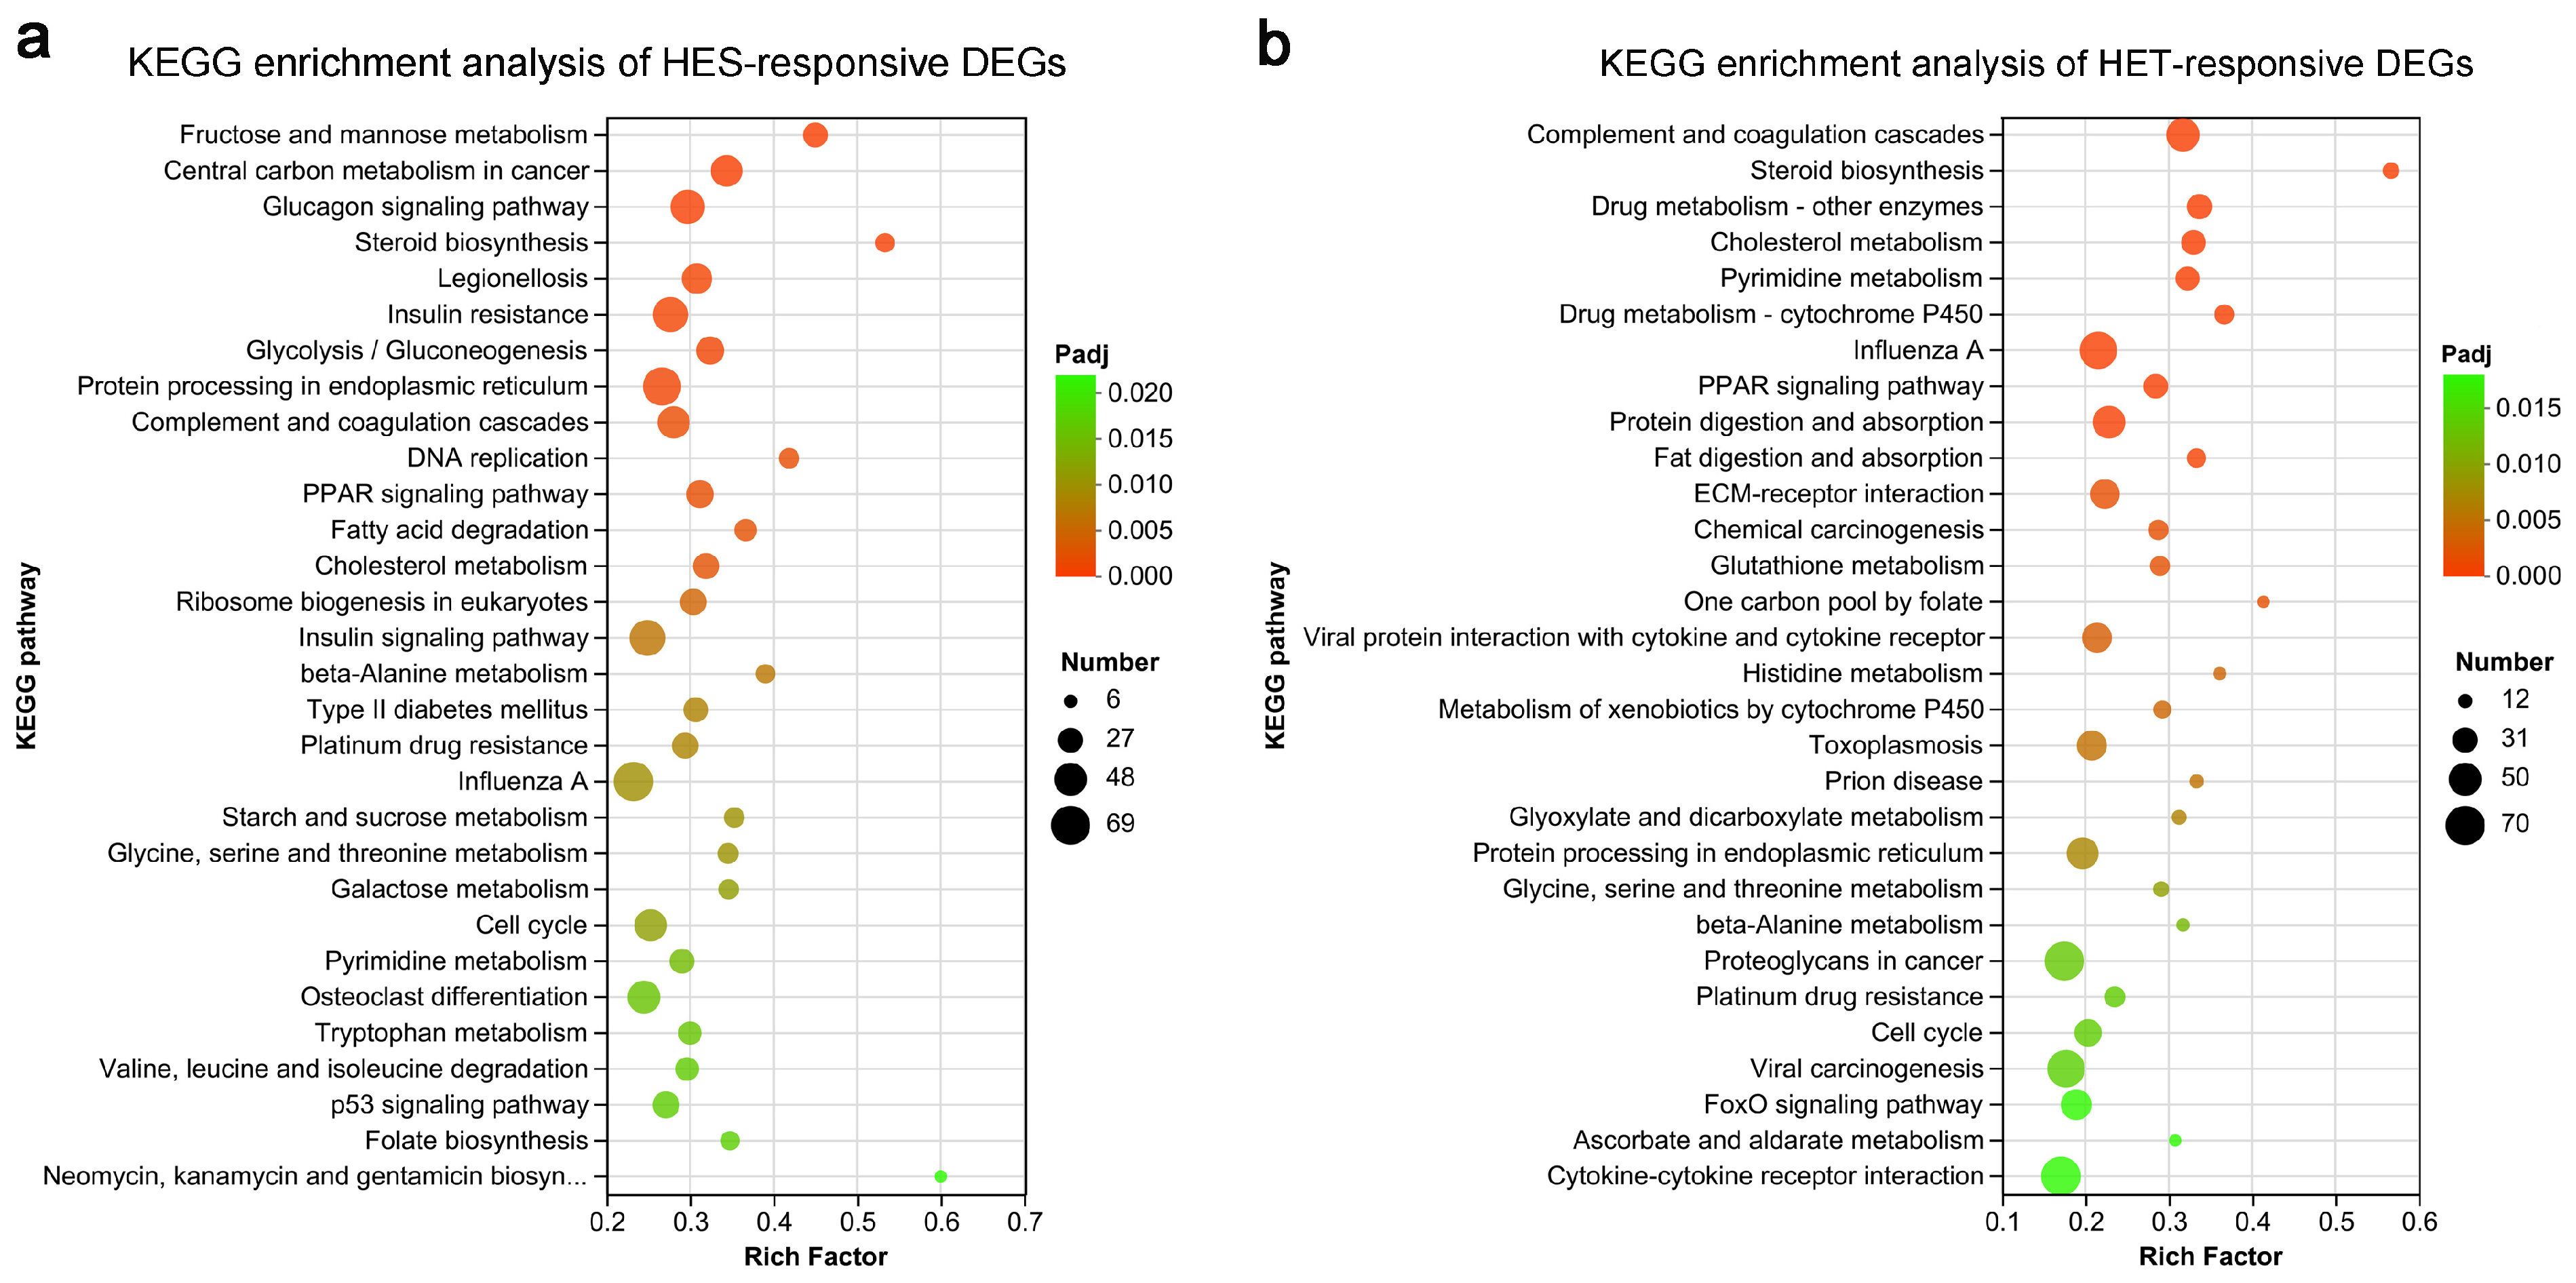
3.4. Enrichment Analysis of HS-Responsive DEGs in Livers of Largemouth Bass
3.5. GGI and Expression Analyses of DEGs Involved in ECM-Receptor Interaction Pathway in Largemouth Bass
4. Discussion
5. Conclusions
Supplementary Materials
Author Contributions
Funding
Institutional Review Board Statement
Informed Consent Statement
Data Availability Statement
Conflicts of Interest
References
- Galappaththi, E.K.; Ichien, S.T.; Hyman, A.A.; Aubrac, C.J.; Ford, J.D. Climate change adaptation in aquaculture. Rev. Aquacult. 2020, 12, 2160–2176. [Google Scholar] [CrossRef]
- Hoegh-Guldberg, O.; Jacob, D.; Taylor, M.; Guillén Bolaños, T.; Bindi, M.; Brown, S.; Camilloni, I.A.; Diedhiou, A.; Djalante, R.; Ebi, K.; et al. The human imperative of stabilizing global climate change at 1.5 °C. Science 2019, 365, eaaw6974. [Google Scholar] [CrossRef] [PubMed]
- Cheung, W.W.L.; Frölicher, T.L.; Lam, V.W.Y.; Oyinlola, M.A.; Reygondeau, G.; Sumaila, U.R.; Tai, T.C.; Teh, L.C.L.; Wabnitz, C.C.C. Marine high temperature extremes amplify the impacts of climate change on fish and fisheries. Sci. Adv. 2021, 7, eabh0895. [Google Scholar] [CrossRef]
- Sydeman, W.J.; Poloczanska, E.; Reed, T.E.; Thompson, S.A. Climate change and marine vertebrates. Science 2015, 350, 772–777. [Google Scholar] [CrossRef]
- Yu, J.; Zhong, D.; Li, S.; Zhang, Z.; Mo, H.; Wang, L. Acute temperature stresses trigger liver transcriptome and microbial community remodeling in largemouth bass (Micropterus salmoides). Aquaculture 2023, 573, 739573. [Google Scholar] [CrossRef]
- Wang, Y.; Li, C.; Pan, C.; Liu, E.; Zhao, X.; Ling, Q. Alterations to transcriptomic profile, histopathology, and oxidative stress in liver of pikeperch (Sander lucioperca) under heat stress. Fish Shellfish Immunol. 2019, 95, 659–669. [Google Scholar] [CrossRef]
- Huang, D.; Ren, M.; Liang, H.; Ge, X.; Xu, H.; Wu, L. Transcriptome analysis of the effect of high-temperature on nutrient metabolism in juvenile grass carp (Ctenopharyngodon idellus). Gene 2022, 809, 146035. [Google Scholar] [CrossRef]
- Liu, F.; Zhang, T.; He, Y.; Zhan, W.; Xie, Q.; Lou, B. Integration of transcriptome and proteome analyses reveals the regulation mechanisms of Larimichthys polyactis liver exposed to heat stress. Fish Shellfish Immunol. 2023, 135, 108704. [Google Scholar] [CrossRef]
- Lyu, L.; Wen, H.; Li, Y.; Li, J.; Zhao, J.; Zhang, S.; Song, M.; Wang, X. Deep transcriptomic analysis of black rockfish (Sebastes schlegelii) provides new insights on responses to acute temperature stress. Sci. Rep. 2018, 8, 9113. [Google Scholar] [CrossRef]
- Zhou, C.; Zhang, Z.Q.; Zhang, L.; Liu, Y.; Liu, P.F. Effects of temperature on growth performance and metabolism of juvenile sea bass (Dicentrarchus labrax). Aquaculture 2021, 537, 736458. [Google Scholar] [CrossRef]
- Cascarano, M.C.; Stavrakidis-Zachou, O.; Mladineo, I.; Thompson, K.D.; Papandroulakis, N.; Katharios, P. Mediterranean aquaculture in a changing climate: Temperature effects on pathogens and diseases of three farmed fish species. Pathogens 2021, 10, 1205. [Google Scholar] [CrossRef] [PubMed]
- Yang, C.; Dong, J.; Sun, C.; Li, W.; Tian, Y.; Liu, Z.; Gao, F.; Ye, X. Exposure to heat stress causes downregulation of immune response genes and weakens the disease resistance of Micropterus salmoides. Comp. Biochem. Physiol. Part D Genom. Proteom. 2022, 43, 101011. [Google Scholar] [CrossRef] [PubMed]
- Cheng, C.H.; Guo, Z.X.; Luo, S.W.; Wang, A.L. Effects of high temperature on biochemical parameters, oxidative stress, DNA damage and apoptosis of pufferfish (Takifugu obscurus). Ecotoxicol. Environ. Saf. 2018, 150, 190–198. [Google Scholar] [CrossRef]
- Zhou, Z.; Liu, Z.; Wang, L.; Luo, J.; Li, H. Oxidative stress, apoptosis activation and symbiosis disruption in giant clam Tridacna crocea under high temperature. Fish Shellfish Immunol. 2019, 84, 451–457. [Google Scholar] [CrossRef]
- Beemelmanns, A.; Zanuzzo, F.S.; Xue, X.; Sandrelli, R.M.; Rise, M.L.; Gamperl, A.K. The transcriptomic responses of Atlantic salmon (Salmo salar) to high temperature stress alone, and in combination with moderate hypoxia. BMC Genom. 2021, 22, 261. [Google Scholar] [CrossRef]
- Yan, W.; Qiao, Y.; He, J.; Qu, J.; Liu, Y.; Zhang, Q.; Wang, X. Molecular mechanism based on histopathology, antioxidant system and transcriptomic profiles in heat stress response in the gills of Japanese flounder. Int. J. Mol. Sci. 2022, 23, 3286. [Google Scholar] [CrossRef]
- Shi, K.P.; Dong, S.L.; Zhou, Y.G.; Li, Y.; Gao, Q.F.; Sun, D.J. RNA-seq reveals temporal differences in the transcriptome response to acute heat stress in the Atlantic salmon (Salmo salar). Comp. Biochem. Physiol. Part D Genom. Proteom. 2019, 30, 169–178. [Google Scholar] [CrossRef] [PubMed]
- Chen, Y.; Wu, X.; Lai, J.; Liu, Y.; Song, M.; Li, F.; Gong, Q. Integrated biochemical, transcriptomic and metabolomic analyses provide insight into heat stress response in Yangtze sturgeon (Acipenser dabryanus). Ecotoxicol. Environ. Saf. 2023, 249, 114366. [Google Scholar] [CrossRef]
- Lin, Y.; Miao, L.H.; Pan, W.J.; Huang, X.; Dengu, J.M.; Zhang, W.X.; Ge, X.P.; Liu, B.; Ren, M.C.; Zhou, Q.L.; et al. Effect of nitrite exposure on the antioxidant enzymes and glutathione system in the liver of bighead carp, Aristichthys nobilis. Fish Shellfis Immunol. 2018, 76, 126–132. [Google Scholar] [CrossRef]
- Somero, G.N. The cellular stress response and temperature: Function, regulation, and evolution. J. Exp. Zool. A Ecol. Integr. Physiol. 2020, 333, 379–397. [Google Scholar] [CrossRef]
- Li, F.; Long, Y.; Xie, J.; Ren, J.; Zhou, T.; Song, G.; Li, Q.; Cui, Z. Generation of GCaMP6s-expressing zebrafish to monitor spatiotemporal dynamics of calcium signaling elicited by heat stress. Int. J. Mol. Sci. 2021, 22, 5551. [Google Scholar] [CrossRef] [PubMed]
- Zhou, C.Q.; Ka, W.; Yuan, W.K.; Wang, J.L. The effect of acute heat stress on the innate immune function of rainbow trout based on the transcriptome. J. Therm. Biol. 2021, 96, 102834. [Google Scholar] [CrossRef] [PubMed]
- Xie, X.; Liang, X.; Wang, H.; Zhu, Q.; Wang, J.; Chang, Y.; Leclercq, E.; Xue, M.; Wang, J. Effects of paraprobiotics on bile acid metabolism and liver health in largemouth bass (Micropterus salmoides) fed a cottonseed protein concentrate-based diet. Anim. Nutr. 2023, 13, 302–312. [Google Scholar] [CrossRef]
- Zhao, J.; Yang, X.; Qiu, Z.; Zhang, R.; Xu, H.; Wang, T. Effects of tributyrin and alanyl-glutamine dipeptide on intestinal health of largemouth bass (Micropterus salmoides) fed with high soybean meal diet. Front. Immunol. 2023, 14, 1140678. [Google Scholar] [CrossRef] [PubMed]
- Zhao, Z.; Liu, S.; Wu, C.; Wang, Q.; Zhang, Y.; Wang, B.; Wang, L.; Sun, R.; Guo, M.; Ji, W. Bioinformatics characteristics and expression analysis of TLR3 and its adaptor protein TRIF in largemouth bass (Micropterus salmoides) upon Flavobacterium columnare infection. Gene 2023, 872, 147450. [Google Scholar] [CrossRef]
- White, D.P.; Wahl, D.H. Growth and physiological responses in largemouth bass populations to environmental warming: Effects of inhabiting chronically heated environments. J. Therm. Biol. 2020, 88, 102467. [Google Scholar] [CrossRef]
- Long, B.; Wang, J.; He, Y.; Zhao, M.; Wang, E.; Cui, J.; Deng, L.; Liu, T.; Zeng, Y.; Wang, K.; et al. Isolation, identification and pathogenicity of Aeromonas veronii isolated from Micropterus salmoides. Chin. J. Vet. Sci. 2016, 36, 48–55. [Google Scholar]
- Mulhollem, J.J.; Suski, C.D.; Wahl, D.H. Response of largemouth bass (Micropterus salmoides) from different thermal environments to increased water temperature. Fish Physiol. Biochem. 2015, 41, 833–842. [Google Scholar] [CrossRef]
- Stark, R.; Grzelak, M.; Hadfield, J. RNA sequencing: The teenage years. Nat. Rev. Genet. 2019, 20, 631–656. [Google Scholar] [CrossRef]
- Yu, H.; He, Y.; Zhang, J.; Zhang, Z.; Zhang, X. Hepatic transcriptome analysis reveals the metabolic strategies of largemouth bass (Micropterus salmoides) under different dissolved oxygen condition. Comp. Biochem. Physiol. Part D Genom. Proteom. 2023, 45, 101032. [Google Scholar] [CrossRef]
- Quan, J.; Kang, Y.; Luo, Z.; Zhao, G.; Li, L.; Liu, Z. Integrated analysis of the responses of a circRNA-miRNA-mRNA ceRNA network to heat stress in rainbow trout (Oncorhynchus mykiss) liver. BMC Genom. 2021, 22, 48. [Google Scholar] [CrossRef] [PubMed]
- Zhang, L.; Yang, Z.; Yang, M.; Yang, F.; Wang, G.; Liu, D.; Li, X.; Yang, L.; Wang, Z. Copper-induced oxidative stress, transcriptome changes, intestinal microbiota, and histopathology of common carp (Cyprinus carpio). Ecotoxicol. Environ. Saf. 2022, 246, 114136. [Google Scholar] [CrossRef] [PubMed]
- Chen, S.; Zhou, Y.; Chen, Y.; Gu, J. Fastp: An ultra-fast all-in-one FASTQ preprocessor. Bioinformatics 2018, 34, i884–i890. [Google Scholar] [CrossRef] [PubMed]
- He, K.; Zhao, L.; Yuan, Z.; Canario, A.; Liu, Q.; Chen, S.; Guo, J.; Luo, W.; Yan, H.; Zhang, D.; et al. Chromosome-level genome assembly of largemouth bass (Micropterus salmoides) using PacBio and Hi-C technologies. Sci. Data 2022, 9, 482. [Google Scholar] [CrossRef] [PubMed]
- Kim, D.; Langmead, B.; Salzberg, S.L. HISAT: A fast spliced aligner with low memory requirements. Nat. Methods 2015, 12, 357–360. [Google Scholar] [CrossRef] [PubMed]
- Pertea, M.; Pertea, G.M.; Antonescu, C.M.; Chang, T.C.; Mendell, J.T.; Salzberg, S.L. StringTie enables improved reconstruction of a transcriptome from RNA-seq reads. Nat. Biotechnol. 2015, 33, 290–295. [Google Scholar] [CrossRef]
- Li, B.; Dewey, C.N. RSEM: Accurate transcript quantification from RNA-Seq data with or without a reference genome. BMC Bioinform. 2011, 12, 323. [Google Scholar] [CrossRef]
- Luo, Y.; Coskun, V.; Liang, A.; Yu, J.; Cheng, L.; Ge, W.; Shi, Z.; Zhang, K.; Li, C.; Cui, Y.; et al. Single-cell transcriptome analyses reveal signals to activate dormant neural stem cells. Cell 2015, 161, 1175–1186. [Google Scholar] [CrossRef]
- Wang, M.; Li, J.; Qi, Z.; Long, Y.; Pei, L.; Huang, X.; Grover, C.E.; Du, X.; Xia, C.; Wang, P.; et al. Genomic innovation and regulatory rewiring during evolution of the cotton genus Gossypium. Nat. Genet. 2022, 54, 1959–1971. [Google Scholar] [CrossRef]
- Wang, Z.; Yang, L.; Zhou, F.; Li, J.; Wu, X.; Zhong, X.; Lv, H.; Yi, S.; Gao, Q.; Yang, Z.; et al. Integrated comparative transcriptome and weighted gene co-expression network analysis provide valuable insights into the response mechanisms of crayfish (Procambarus clarkii) to copper stress. J. Hazard. Mater. 2023, 448, 130820. [Google Scholar] [CrossRef]
- Klopfenstein, D.V.; Zhang, L.; Pedersen, B.S.; Ramírez, F.; Warwick Vesztrocy, A.; Naldi, A.; Mungall, C.J.; Yunes, J.M.; Botvinnik, O.; Weigel, M.; et al. GOATOOLS: A Python library for gene ontology analyses. Sci. Rep. 2018, 8, 10872. [Google Scholar] [CrossRef] [PubMed]
- Bu, D.; Luo, H.; Huo, P.; Wang, Z.; Zhang, S.; He, Z.; Wu, Y.; Zhao, L.; Liu, J.; Guo, J.; et al. KOBAS-i: Intelligent prioritization and exploratory visualization of biological functions for gene enrichment analysis. Nucleic Acids Res. 2021, 49, W317–W325. [Google Scholar] [CrossRef]
- Ren, Y.; Yu, G.; Shi, C.; Liu, L.; Guo, Q.; Han, C.; Zhang, D.; Zhang, L.; Liu, B.; Gao, H.; et al. Majorbio Cloud: A one-stop, comprehensive bioinformatic platform for multiomics analyses. iMeta 2022, 1, e12. [Google Scholar] [CrossRef]
- Ernst, J.; Bar-Joseph, Z. STEM: A tool for the analysis of short time series gene expression data. BMC Bioinform. 2006, 7, 191. [Google Scholar] [CrossRef] [PubMed]
- Maire, J.; Parisot, N.; Galvao Ferrarini, M.; Vallier, A.; Gillet, B.; Hughes, S.; Balmand, S.; Vincent-Monégat, C.; Zaidman-Rémy, A.; Heddi, A. Spatial and morphological reorganization of endosymbiosis during metamorphosis accommodates adult metabolic requirements in a weevil. Proc. Natl. Acad. Sci. USA 2020, 117, 19347–19358. [Google Scholar] [CrossRef] [PubMed]
- Szklarczyk, D.; Kirsch, R.; Koutrouli, M.; Nastou, K.; Mehryary, F.; Hachilif, R.; Gable, A.L.; Fang, T.; Doncheva, N.T.; Pyysalo, S.; et al. The STRING database in 2023: Protein-protein association networks and functional enrichment analyses for any sequenced genome of interest. Nucleic Acids Res. 2023, 51, D638–D646. [Google Scholar] [CrossRef]
- Shannon, P.; Markiel, A.; Ozier, O.; Baliga, N.S.; Wang, J.T.; Ramage, D.; Amin, N.; Schwikowski, B.; Ideker, T. Cytoscape: A software environment for integrated models of biomolecular interaction networks. Genome Res. 2003, 13, 2498–2504. [Google Scholar] [CrossRef]
- Zhu, J.; Huang, Z.; Yang, F.; Zhu, M.; Cao, J.; Chen, J.; Lin, Y.; Guo, S.; Li, J.; Liu, Z. Cadmium disturbs epigenetic modification and induces DNA damage in mouse preimplantation embryos. Ecotoxicol. Environ. Saf. 2021, 219, 112306. [Google Scholar] [CrossRef]
- Livak, K.J.; Schmittgen, T.D. Analysis of relative gene expression data using real-time quantitative PCR and the 2−ΔΔCT method. Methods 2001, 25, 402–408. [Google Scholar] [CrossRef]
- Ma, D.; Fan, J.; Tian, Y.; Jiang, P.; Wang, J.; Zhu, H.; Bai, J. Selection of reference genes for quantitative real-time PCR normalisation in largemouth bass Micropterus salmoides fed on alternative diets. J. Fish Biol. 2019, 95, 393–400. [Google Scholar] [CrossRef]
- Ruan, Z.H.; Jiang, L.S.; Li, Y.F.; Lu, Z.Q.; Chen, X.C.; Zhang, X.; Liu, W.S. Transcriptomic analysis of the immune response against A. hydrophila infection in striped catfish Pangasianodon hypophthalmus. Aquaculture 2022, 547, 737446. [Google Scholar] [CrossRef]
- Azra, M.N.; Aaqillah-Amr, M.A.; Ikhwanuddin, M.; Ma, H.; Waiho, K.; Ostrensky, A.; Dos Santos Tavares, C.P.; Abol-Munafi, A.B. Effects of climate-induced water temperature changes on the life history of brachyuran crabs. Rev. Aquacult. 2020, 12, 1211–1216. [Google Scholar] [CrossRef]
- Guo, K.; Ruan, G.; Fan, W.; Wang, Q.; Fang, L.; Luo, J.; Liu, Y. Immune response to acute heat stress in the intestine of the red swamp crayfish, Procambarus clarkii. Fish Shellfish Immunol. 2020, 100, 146–151. [Google Scholar] [CrossRef]
- Liu, J.; Zhang, C.; Wang, X.; Li, X.; Huang, Q.; Wang, H.; Miao, Y.; Li, E.; Qin, J.; Chen, L. Dietary methionine level impacts the growth, nutrient metabolism, antioxidant capacity and immunity of the Chinese mitten crab (Eriocheir sinensis) under chronic heat stress. Antioxidants 2023, 12, 209. [Google Scholar] [CrossRef] [PubMed]
- Ma, C.S.; Ma, G.; Pincebourde, S. Survive a warming climate: Insect responses to extreme high temperatures. Annu. Rev. Entomol. 2021, 66, 163–184. [Google Scholar] [CrossRef]
- Pink, M.; Abrahams, M.V. Temperature and its impact on predation risk within aquatic ecosystems. Can. J. Fish. Aquat. Sci. 2016, 73, 869–876. [Google Scholar] [CrossRef]
- Wiles, S.C.; Bertram, M.G.; Martin, J.M.; Tan, H.; Lehtonen, T.K.; Wong, B.B.M. Long-term pharmaceutical contamination and temperature stress disrupt fish behavior. Environ. Sci. Technol. 2020, 54, 8072–8082. [Google Scholar] [CrossRef]
- Yu, Y.; Chen, M.; Lu, Z.Y.; Liu, Y.; Li, B.; Gao, Z.X.; Shen, Z.G. High-temperature stress will put the thermo-sensitive teleost yellow catfish (Tachysurus fulvidraco) in danger through reducing reproductivity. Ecotoxicol. Environ. Saf. 2022, 239, 113638. [Google Scholar] [CrossRef]
- Yang, Y.; Yu, H.; Li, H.; Wang, A.; Yu, H.Y. Effect of high temperature on immune response of grass carp (Ctenopharyngodon idellus) by transcriptome analysis. Fish Shellfish Immunol. 2016, 58, 89–95. [Google Scholar] [CrossRef]
- Li, Y.; Huang, J.; Liu, Z.; Zhou, Y.; Xia, B.; Wang, Y.; Kang, Y.; Wang, J. Transcriptome analysis provides insights into hepatic responses to moderate heat stress in the rainbow trout (Oncorhynchus mykiss). Gene 2017, 619, 1–9. [Google Scholar] [CrossRef]
- Huang, J.; Li, Y.; Liu, Z.; Kang, Y.; Wang, J. Transcriptomic responses to heat stress in rainbow trout Oncorhynchus mykiss head kidney. Fish Shellfish Immunol. 2018, 82, 32–40. [Google Scholar] [CrossRef] [PubMed]
- Wang, Q.; Hao, X.; Liu, K.; Feng, B.; Li, S.; Zhang, Z.; Tang, L.; Mahboob, S.; Shao, C. Early response to heat stress in Chinese tongue sole (Cynoglossus semilaevis): Performance of different sexes, candidate genes and networks. BMC Genom. 2020, 21, 745. [Google Scholar] [CrossRef] [PubMed]
- Zhao, T.; Ma, A.; Huang, Z.; Liu, Z.; Sun, Z.; Zhu, C.; Yang, J.; Li, Y.; Wang, Q.; Qiao, X.; et al. Transcriptome analysis reveals that high temperatures alter modes of lipid metabolism in juvenile turbot (Scophthalmus maximus) liver. Comp. Biochem. Physiol. Part D Genom. Proteom. 2021, 40, 100887. [Google Scholar] [CrossRef] [PubMed]
- Zhang, W.; Xu, X.; Li, J.; Shen, Y. Transcriptomic analysis of the liver and brain in grass carp (Ctenopharyngodon idella) under heat stress. Mar. Biotechnol. 2022, 24, 856–870. [Google Scholar] [CrossRef]
- Yang, S.; Li, D.; Feng, L.; Zhang, C.; Xi, D.; Liu, H.; Yan, C.; Xu, Z.; Zhang, Y.; Li, Y.; et al. Transcriptome analysis reveals the high temperature induced damage is a significant factor affecting the osmotic function of gill tissue in Siberian sturgeon (Acipenser baerii). BMC Genom. 2023, 24, 2. [Google Scholar] [CrossRef]
- Kraitavin, W.; Yoshitake, K.; Igarashi, Y.; Mitsuyama, S.; Kinoshita, S.; Kambayashi, D.; Watabe, S.; Asakawa, S. Transcriptome analysis of yamame (Oncorhynchus masou) in normal conditions after heat stress. Biology 2019, 8, 21. [Google Scholar] [CrossRef]
- Wu, X.; Fan, Y.; Feng, J.; Ma, K.; Li, J. Transcriptomic, histological and biochemical analyses of Macrobrachium nipponense response to acute heat stress. Aquacult. Fish. 2023, in press. [Google Scholar] [CrossRef]
- Yan, D.; Long, X.; Zhang, X.; Dong, X.; Wang, Z.; Jiang, H.; An, M.; Chen, J.; Gan, L. Identification and characterization of long non-coding RNAs in intestinal immune regulation of largemouth bass, Micropterus salmoides, under acute heat stress. Comp. Biochem. Physiol. Part D Genom. Proteom. 2023, 48, 101132. [Google Scholar] [CrossRef]


Disclaimer/Publisher’s Note: The statements, opinions and data contained in all publications are solely those of the individual author(s) and contributor(s) and not of MDPI and/or the editor(s). MDPI and/or the editor(s) disclaim responsibility for any injury to people or property resulting from any ideas, methods, instructions or products referred to in the content. |
© 2023 by the authors. Licensee MDPI, Basel, Switzerland. This article is an open access article distributed under the terms and conditions of the Creative Commons Attribution (CC BY) license (https://creativecommons.org/licenses/by/4.0/).
Share and Cite
Zhou, F.; Qi, M.; Li, J.; Huang, Y.; Chen, X.; Liu, W.; Yao, G.; Meng, Q.; Zheng, T.; Wang, Z.; et al. Comparative Transcriptomic Analysis of Largemouth Bass (Micropterus salmoides) Livers Reveals Response Mechanisms to High Temperatures. Genes 2023, 14, 2096. https://doi.org/10.3390/genes14112096
Zhou F, Qi M, Li J, Huang Y, Chen X, Liu W, Yao G, Meng Q, Zheng T, Wang Z, et al. Comparative Transcriptomic Analysis of Largemouth Bass (Micropterus salmoides) Livers Reveals Response Mechanisms to High Temperatures. Genes. 2023; 14(11):2096. https://doi.org/10.3390/genes14112096
Chicago/Turabian StyleZhou, Fan, Ming Qi, Jiapeng Li, Yuanfei Huang, Xiaoming Chen, Wei Liu, Gaohua Yao, Qinghui Meng, Tianlun Zheng, Zhanqi Wang, and et al. 2023. "Comparative Transcriptomic Analysis of Largemouth Bass (Micropterus salmoides) Livers Reveals Response Mechanisms to High Temperatures" Genes 14, no. 11: 2096. https://doi.org/10.3390/genes14112096