Article

Polymorphisms in COMT and OPRM1 Collectively Contribute to Chronic Shoulder Pain and Disability in South African Breast Cancer Survivors’

by
Firzana Firfirey
1,2,
Delva Shamley
3 and
Alison V. September
1,2,4,*
1
Division of Physiological Sciences, Department of Human Biology, Faculty of Health Sciences, University of Cape Town, Cape Town 7700, South Africa
2
Health through Physical Activity, Lifestyle and Sport Research Centre (HPALS), Department of Human Biology, Faculty of Health Sciences, University of Cape Town, Cape Town 7700, South Africa
3
Division of Clinical Anatomy & Biological Anthropology, Department of Human Biology, Anatomy Building, Medical School, University of Cape Town, Cape Town 7700, South Africa
4
International Federation of Sports Medicine (FIMS), Collaborative Centre of Sports Medicine, Department of Human Biology, University of Cape Town, Cape Town 7700, South Africa
*
Author to whom correspondence should be addressed.
Submission received: 23 November 2022 / Revised: 12 December 2022 / Accepted: 16 December 2022 / Published: 21 December 2022
(This article belongs to the Special Issue Genetics and Epigenetics of Musculoskeletal Pathologies)

Abstract

:
Chronic shoulder pain and disability is a common adverse effect experienced by >40% of breast cancer survivors (BCS). Pain management protocols for acute and chronic pain include the use of opioids and opioid derivatives. Furthermore, pain-modulating genes, such as COMT and OPRM1, have been linked to the aetiology of chronic pain. This study aimed to investigate the association between genetic variants of major pain modulator genes and chronic pain/disability in BCS. Assessment of pain, disability and combined (pain and disability) symptoms were determined using the Shoulder Pain and Disability Index (SPADI). Participants were grouped according to their scores such as no-low (<30%) and moderate-high (≥30%) groups of pain, disability and combined (pain and disability). Genotyping of the COMT rs6269 (A > G), rs4633 (C > T), rs4818 (C > G) and the functional rs4680(G > A) SNPs within the BCS (N = 252) cohort were conducted using TaqMan® SNP assays. Genotype, allele, haplotype, and allele–allele combination frequencies were evaluated. Statistical analysis was applied, with significance accepted at p < 0.05. The COMT rs4680:A/A genotype was significantly associated with moderate-high pain (p = 0.024, OR: 3.23, 95% CI: 1.33–7.81) and combined (pain and disability) (p = 0.015, OR: 3.81, 95% CI: 1.47–9.85). The rs4680:A allele was also significantly associated with moderate-high pain (p = 0.035, OR: 1.58, 95% CI: 1.03–2.43) and combined (pain and disability) (p = 0.017, OR: 1.71, 95% CI: 1.07–2.71). For the inferred COMT (rs6269 A > G-rs4680 G > A) haplotype analyses, the G-G (p = 0.026, OR: 0.67, 95% CI: 0.38–1.18) and A-A (p = 0.007, OR: 2.09, 95% CI: 0.89–4.88) haplotypes were significantly associated with reduced and increased likelihoods of reporting moderate-high pain, respectively. The inferred A-A (p = 0.003, OR: 2.18, 95% CI: 0.92–5.17) haplotype was also significantly associated with combined (pain and disability). Gene–gene interaction analyses further showed allele–allele combinations for COMT (rs4680 G > A)-OPRM1 (rs1799971 A > G) and COMT (rs4680 G > A)-OPRM1(rs540825 T > A) were associated with reporting pain and combined (pain and disability) symptoms, p < 0.05. The findings of this study suggest that COMT and OPRM1 SNPs play a role in the development of chronic shoulder pain/disability in BCS in a unique South African cohort from the Western Cape.

1. Introduction

Roughly 40% of breast cancer survivors (BCS) endure chronic pain and dysfunction of the upper limb, as side effects associated with the different types of BC treatments [1]. These side effects may occur for up to six years after treatment [2]. Other side effects that have been described include lymphedema, tissue scarring, and fibrosis to name but a few [1,2]. Furthermore, several patient-related risk factors such as age, BMI, surgery type, amongst others have been associated with an increased risk [3]. Interestingly, severe acute post-operative pain is also considered a risk factor for the development of chronic pain [3]. To manage post-operative pain, clinicians largely rely on the use of opioids and/or opioid derivatives, the most frequently prescribed being morphine, codeine, tramadol, and fentanyl [4]. Genetics is more of a risk factor, which is hypothesized to explain 25% of the variability in BCS developing chronic shoulder pain and dysfunction, despite receiving treatment protocols [5,6]. Polymorphisms in the candidate genes Catechol-O-methyltransferase (COMT), and Opioid receptor µ 1 (OPRM1) gene, have been recognised as major pain modulators [7].
The COMT gene (chromosomal location: 22q11.21) encodes the catechol-O-methyltransferase enzyme. Two isoforms have been described for COMT, a membrane-bound (MB- COMT) and a soluble (S-COMT) form, each transcribed and regulated by two distinct promotors (Figure S1) [8]. The enzyme is essential in regulating the bioavailability of the catechols, such as dopamine (DA), epinephrine (EP), and norepinephrine (NEP), as well as catechol estrogens (ER) [9]. Catecholamines are known to act as both neurotransmitters and hormones to maintain the balance within the autonomic nervous system (ANS) [10]. Studies have shown that varying levels of catecholamines (excess/scarcity), including altered COMT activity, may lead to the over/under-activation of the sympathetic nervous system (SNS) [10,11]. The SNS and pain are understood to interact within this neuro-axis, implicating COMT enzymatic activity, particularly since altered levels of catecholamines are shown to result in persistent pain conditions [5,12,13].
Genetic studies have implicated COMT polymorphisms to be associated with chronic pain states [5,14]. Variation in COMT activity has been linked to the functional COMT rs4680 G > A polymorphism found on exon four at positions MB- COMT158, and S- COMT108 [8,15]. The valine (Val) to methionine (Met) substitution is associated with a decrease enzyme thermostability and activity (up to 40% differences) explained by the hydrophobic Met/Met residues [8,16]. Three other COMT polymorphisms, rs6269 A > G (intron 2), rs4633 C > T (His > His: exon 3) and rs4818 C > G (Leu > Leu: exon 4) have been investigated in haplotype studies with rs4680 G > A [12,17]. A strong LD (D’ > 0.94) is reported between the four polymorphisms [12,17]. Defining a central haploblock for COMT, these polymorphisms were used to characterize three major levels of pain sensitivity in healthy female volunteers, high (HPS: ACCG), average (APS: ATCA) and low (LPS: GCGG), [12,18]. The three characterised COMT haplotypes have been associated with altered secondary mRNA structures, and thereby different protein folding potentials and enzymatic activity [15]. The haplotypes account for 11- to 25-times the variations noted in COMT activity and thereby may surpass the functional significance associated with individual polymorphisms [12,15,17].
Population frequencies of COMT haplotypes are well described in several pain-related studies predominantly of Caucasian ancestry, and in non-breast cancer studies [12,18,19,20]. A study investigating the global genetic signatures of 28 COMT SNPs across nine geographical regions (45 populations), was conducted [21]. The study described different linkage disequilibrium (LD) patterns including the rs6269-rs4680 haploblock for each of these pain sensitivity levels [21]. The strongest LD for the rs6269-rs4818-rs740602-rs4818-rs4680 SNP pairs were observed in homogenous European, north, and south American populations [21]. In contrast, the LD across this genetic region for the African populations were not as strong. The South African (SA) mixed ancestry population is a genetically distinct cohort, with Asian, European, and African ancestral contributors [22]. Studies reporting genetic variability for mixed ancestry cohorts are limited, most notably in BCS in sub-Saharan Africa [23]. Given the critical role of COMT in pharmacogenetics and pain, it is imperative to understand the population genetic structure for COMT SNPs within SA.
In addition, gene–gene interactions between COMT and OPRM1 polymorphisms have been explored in relation to pain sensitivity in preoperative cancer, gynaecological, postoperative orthopaedic, and general surgery settings [18,24,25]. The basis for evaluating these interactions stems from studies reporting that COMT rs4680 G > A modulates OPRM1 expression and receptor binding site availability in different brain structures [24]. The mu-opioid receptor (MOR1), encoded by OPRM1, is the main site of opioid-peptide binding and consequently influences both endogenous and exogenous analgesic responses [26]. Several studies have implicated the functional OPRM1 rs1799971 A > G (A118G) SNP with variations in pain and opioid responsiveness [27,28,29]. As the most prevalent polymorphism reported for OPRM1, it is shown to reduce signal transduction and OPRM1 expression [27,28,29]. In our previous report, the inferred OPRM1 rs1799971 A > G-rs540825 T > A haplotype analysis implicated the G-T haplotype with a decreased risk for pain in BCS [30]. Specific ABCB1-OPRM1 allele–allele combinations were also associated with pain and disability. Considering the complex relationship between genes and pain; the role of multiple gene interactions has been advocated in the aetiology of chronic pain development [18,31]. However, no studies have explored the role of COMT SNPs in the development of chronic shoulder pain following breast cancer surgery with a mixed ancestry background. In addition, none have investigated the gene–gene interactions between COMT and OPRM1 in BCS with a mixed ancestry background.
The study, therefore, aimed to investigate nongenetic and genetic risk factors for chronic shoulder pain and disability in a SA cohort of mixed-ancestry BCS. Furthermore, the study aimed to describe the central haploblock distribution pattern for COMT and to evaluate the gene–gene interactions between COMT and OPRM1, for chronic pain and disability in BCS. The objectives were to: (i) Determine the genotype/allele frequency distributions for the COMT (rs6269 A > G, rs4633 C > T, rs4818 C > G, rs4680 G > A) polymorphisms, (ii) analyse inferred haplotype distribution using the two flanking SNPs of the COMT central haploblock, and iii) examine specific allele–allele combinations between COMT and OPRM1 polymorphisms as a proxy for gene–gene interactions.

2. Materials and Methods

2.1. Study Design, Participants, and Settings

This cross-sectional genetic association study, was performed in accordance with the STREGA reporting recommendations [32]. Details of the present study design, participants, and settings were previously described [30]. Briefly, volunteers were recruited from a tertiary hospital and included if they were >18 yrs of age, diagnosed with unilateral BC for >1 yr prior to recruitment and were self-identified as SA mixed ancestry. Volunteers presenting with a history of comorbidities, or prior neck and shoulder pathologies were excluded. Following informed consent, the Shoulder Pain, and Disability Index (SPADI) questionnaire was administered to each participant. In addition, venous blood samples were collected from the unaffected arm, which was used for DNA extraction [30]. The study features a subset analysis of women (N = 252) aged between 22 yrs and 74 yrs (Mean ± SD [54 ± 9.8]) that form part of a larger ongoing project. The project investigates the association between genetic markers of pain genes and chronic shoulder pain and disability in BCS.

2.2. Instruments

2.2.1. Shoulder Pain and Disability Index (SPADI)

Shoulder pain and disability symptoms were evaluated using the SPADI index, a patient-reported questionnaire consisting of thirteen items describing daily activities [30]. Participants had to rate the daily activity on a scale of 0 (no-pain/no-difficulty) to 10 (worst pain/difficulty) for each item under two domains. The first domain with only five items assesses pain, while the second domain with eight items assesses disability.
Item scores were subtotalled for each domain, converted to a percentage, and used to stratify participants into no-low (<30%) or moderate-high (≥30%) groups. The stratification of groups was based on earlier research that measured the effects of pain on the “activities of daily living” (ADL), demonstrating that moderate and severe pain corresponding to visual analogue scale (VAS) scores exceeding 30% and 50%, respectively to influence day-to-day activities [33,34]. In this study, we evaluated no-low and moderate-high groups of pain, disability and combined (pain and disability) scores.

2.2.2. SNP Selection and Genotyping

COMT (NP_000745.1) was selected based on previous associations described in the literature [7,31]. Following the manufacturer’s instructions, TaqMan® SNP genotyping assays (Thermofisher Scientific, Applied Biosystems, Foster City, CA, USA) were used to genotype the N = 252 samples in 96-well plates. In a final volume of 8 µL, each sample reaction contained 4 µL of TaqMan® genotype master mix and 0.2 µL of TaqMan® specific primer that were diluted to one-times final concentration. The reaction also contained 2.8 µL of dH2O and 1 µL of DNA template from a concentrate of [DNA] 1–10 ng. Standard Polymerase Chain Reaction (PCR) conditions were applied for the COMT (rs6269 A > G; rs4633 C > T; rs4818 C > G; rs4680 G > A) SNPs, described in an earlier publication [30]. Furthermore, each reaction plate was loaded with technical repeats and negative controls (absent of DNA template) to control for experimental quality.
All PCR reactions were conducted using the Quant studio 3 Real-time PCR (Thermofisher Scientific, Applied Biosystems, Foster City, CA, USA) system. Subsequent analyses were achieved using the ThermoFisher Cloud genotyping analysis Software Version: 3.3.0-SR2-build 21. Genotyping was accepted as successful when all DNA samples were amplified for all SNPs, except when failing to amplify after two repeat runs. The following amplification success rates were recorded for the COMT rs6269 A > G: 98%, rs4633 C > T: 98%, rs4818 C > G: 96%, and rs4680 G > A: 97%. The genotype data for OPRM1 previously described was used in this study [30]. All research and wet bench work was conducted at the HPALS Research Unit (Division of Physiological Sciences, Department of Human Biology, The University of Cape Town, Cape Town, South Africa).

2.3. Statistical Analysis

Using an average reported risk of 40% [30], the QUANTO v1.2.4.49 software was used to calculate the sample size, N = 150, sufficient to detect effect sizes of >2 at 80% power for minor allele frequencies of 0.1–0.5 [35]. Using Statistica V13.5.0.17 [36], an independent sample t-test, Pearson’s Chi-square (χ2) and Fisher’s exact tests (if n < 10), were used to analyse the frequency distributions of clinical parameters between no-low and moderate-high groups for pain, disability and combined (pain and disability). Associations were assessed for quantitative and qualitative clinical parameters (Table S1). In addition, the genotype effect on clinical parameters were assessed for the COMT (rs6269 A > G, rs4633 C > T, rs4818 C > G and rs4680 G > A) SNPs.
Genotype data were analyzed using the R language and programming environment R studio V1.3.1056 running R V4.0.4 [37]. Using the “genetics” (v1.3.8.1.3) package, the probabilities of Hardy-Weinberg equilibrium (HWE) and linkage disequilibrium (LD) were determined [38]. For associations between the genotype and pain/disability characteristics, logistic regression analyses were applied using the “SNPassoc” v2.0.2 package [39]. All genetic models (dominant, over-dominant, recessive) were tested, and the Akaike information criterion (AIC) score was used to identify the most significant model.
Haplotype analyses were performed by constructing inferred haplotypes using the individual genotype data for the COMT SNPs (rs6269 A > G; rs4680 G > A). The polymorphisms represent the genomic region spanning the central (second) haploblock described in the literature [12]. The inferred OPRM1 (rs1799971 A > G and rs540825 T > A) haplotype was previously described and implicated and the genotype data was used in this study [30]. The COMT rs4680 G > A and OPRM1 rs1799971 A > G rs540825 T > A SNPs were used to construct stepwise inferred allele–allele combinations as a proxy for gene–gene interactions. Inferred haplotype and allele–allele combination frequency distribution patterns between the no-low and moderate-high groups, were analyzed using the “haplo.stats” (v1.8.6.) package [40].
To explore pathway associated networks between COMT and OPRM1, bioinformatic analysis was conducted using the web-based applications Enrichr (Accessed: 6 September 2022 [https://maayanlab.cloud/Enrichr/]) and GeneMANIA (Accessed: 26 October 2022 [https://genemania.org/]). The web-based and online programs used in the study are cited in the bibliography. Furthermore, study data were either expressed as means ± standard deviation (m ± sd), median (interquartile range (IQR)) or a percentage (n values). All logistic regression analysis was adjusted for the confounder participants’ age at the time of surgery. Odds ratios [OR], confidence intervals at 95% [95% CI], and statistical significance accepted at p < 0.05 were reported as part of the regression analysis.

3. Results

3.1. Participants’ Characteristics

Demographical and clinical characteristics were previously described [30]. The main findings noted a significant association between younger age and an increase in risk of pain (p = 0.002), disability (p = 0.011) and combined (pain and disability) (p = 0.003), respectively (Table S2). In addition, the study noted that younger participants had fewer nodes involved than older participants in the disability (p = 0.025) and combined (pain and disability) (p = 0.034) categories (Table S2). No associations were noted for the remaining clinical characteristics assessed (Table S3).

3.2. COMT SNP Genotype Effects on Demographical and Clinical Characteristics

A significant association between COMT rs6269 A > G, and the total number of nodes involved (p = 0.008) were noted, however, the medians (IQR) were comparable between the genotypes (Table S4). Furthermore, for rs6269, fewer A/A (10.3% and 13%) genotype carriers underwent NeoCT (p = 0.009), and RT (p = 0.002) treatments, compared to G/G (44.8% and 39.6%) and A/G (44.8% and 47.4%) genotype carriers (Table S5). The COMT rs4818 C > G was associated with lymph node surgery (p = 0.002), where fewer G/G (4.5% and 3.2%) genotype carriers underwent ALND and SLNB treatments, compared to the C/C (48.6% and 74.2%) and C/G (46.9% and 22.6%) genotype carriers (Table S6).

3.3. COMT SNP Frequencies

The allele frequency distribution of the COMT (rs6269 A > G, rs4633 C > T, rs4818 C > G and rs4680 G > A) polymorphisms revealed distinct differences between the SA BCS cohort and the reported global population frequencies (Figure 1). The COMT rs6269 (G) and rs4633 (T) minor alleles, were prevalent in the SA BCS cohort (60.9% and 55.6%) compared to the global population (35.7% and 37.2%, p < 0.001) (Figure 1A,B). The COMT rs4818 (G) and rs4680 (A) minor alleles frequencies, were similar between the SA BCS (26.2% and 39.8%) cohort and the global population (29.7% and 36.9%, p > 0.05) (Figure 1C,D). Furthermore, linkage disequilibrium analysis of the BCS cohort noted a strong LD for the COMT rs4818-rs4680 pair (D’ = 0.99), whereas an LD decay (D’ < 0.9) was noted for the remaining COMT SNP pairs (Figure S1C).

3.4. Genotype and Allele Frequency Distribution of COMT

Table 1 summarises the distribution patterns of the genotype and allele frequencies of the COMT SNPs, between the no-low and moderate-high groups for pain, disability and combined (pain and disability). No significant (p > 0.05) associations were noted for the genotype and allele frequencies of COMT rs6269 A > G, rs4633 C > T and rs4818 C > G, between the no-low and moderate-high groups of pain, disability and combined (pain and disability) scores (Table 1).
However, in the pain score category, the COMT rs4680 A/A genotype was significantly observed in the moderate-high (21.5%) group, compared to the no-low (12.7%) group (Table 1). The A/A (p = 0.024, OR: 3.23, 95% CI: 1.33–7.81, AIC: 268.7) genotype was significantly associated with increased risk for reporting moderate-high pain. In the dominant model, the rs4680 A/A (p = 0.015, OR: 2.19, 95% CI: 1.14–4.21, AIC: 268.3) genotype was observed to be significantly disproportionate between the no-low and moderate-high groups. In the recessive model, the A/A (p = 0.050, OR: 2.17, 95% CI: 1.01–4.67, AIC: 270.4) genotype displayed the same distribution pattern as observed in the dominant model, however only a trend of association was noted. Based on the AIC scores, the dominant model exhibited the most significant model for COMT rs4680 G > A. In alignment with this finding, the COMT rs4680 A allele was significantly observed in the moderate-high (46.9%) group, compared to the no-low (35.8%) group. The A (p = 0.035, OR: 1.58, 95% CI: 1.03–2.43) allele was significantly associated with an increased likelihood of reporting moderate-high pain (Table 1).
No significant associations were noted between COMT rs4680 G > A and the disability category, p > 0.05.
In the category of combined scores (pain and disability), the COMT rs4680 A/A genotype was significantly observed in the moderate-high (23.1%) group compared to the no-low (12.9%) group (Table 1). The A/A (p = 0.015, OR: 3.81, 95% CI: 1.47–9.85, AIC: 240.3) genotype was significantly associated with an increased likelihood of reporting moderate-high pain. The dominant (p = 0.009, OR: 2.51, 95% CI: 1.22–5.17, AIC: 240.0) and recessive (p = 0.041, OR: 2.36, 95% CI: 1.06–5.24, AIC: 241.6) models displayed a significant association for the rs4680 A/A genotype. The A/A-A/G (dominant) and A/A (recessive) genotypes distribution were significantly disproportionate between the no-low and moderate-high groups. Once more, based on the AIC score, the dominant model exhibited the most significant model for the COMT rs4680 G > A SNP. Similarly, the COMT rs4680 A allele was significantly observed moderate-high (49.0%) group, compared to the no-low (36.0%) group. The A (p = 0.017, OR: 1.71, 95% CI: 1.07–2.71) allele was significantly associated with an increased likelihood of reporting moderate-high combined (pain and disability)(Table 1).

3.5. Inferred COMT Haplotypes

A COMT haplotype was constructed for the genomic region spanning the central haploblock using the individual genotype data of (rs6269 A > G, rs4680 G > A) (Figure S1B). Evaluation of the inferred COMT (rs6269 A > G-rs4680 G > A) haplotype, yielded four combinations A-G, G-A, G-G, and A-A (Figure 2).
In the pain scores’ category, the G-G haplotype combination was significantly observed in the no-low (27.7%) group, compared to the moderate-high (22.1%) group. The inferred G-G (p = 0.026, OR: 0.67, 95% CI: 0.38–1.18) haplotype was significantly associated with a reduced likelihood of reporting moderate-high pain (Figure 2A). In addition, the A-A haplotype combination was significantly observed in the moderate-high (10.7%) group compared to the no-low (3.1%) group. The inferred A-A (p = 0.007, OR: 2.09, 95% CI: 0.89–4.88) haplotype was significantly associated with increased likelihood of reporting moderate-high pain (Figure 2A).
No significant differences in distribution patterns were noted in the disability category (Figure 2B). In the combined (pain and disability) scores’ category, the A-A haplotype was significantly observed in the moderate-high (12.4%) group, compared to the no-low (3.2%) group. The inferred A-A (p = 0.003, OR: 2.18, 95% CI: 0.92–5.17) haplotype was significantly associated with increased likelihood of reporting moderate-high combined (pain and disability)(Figure 2C).

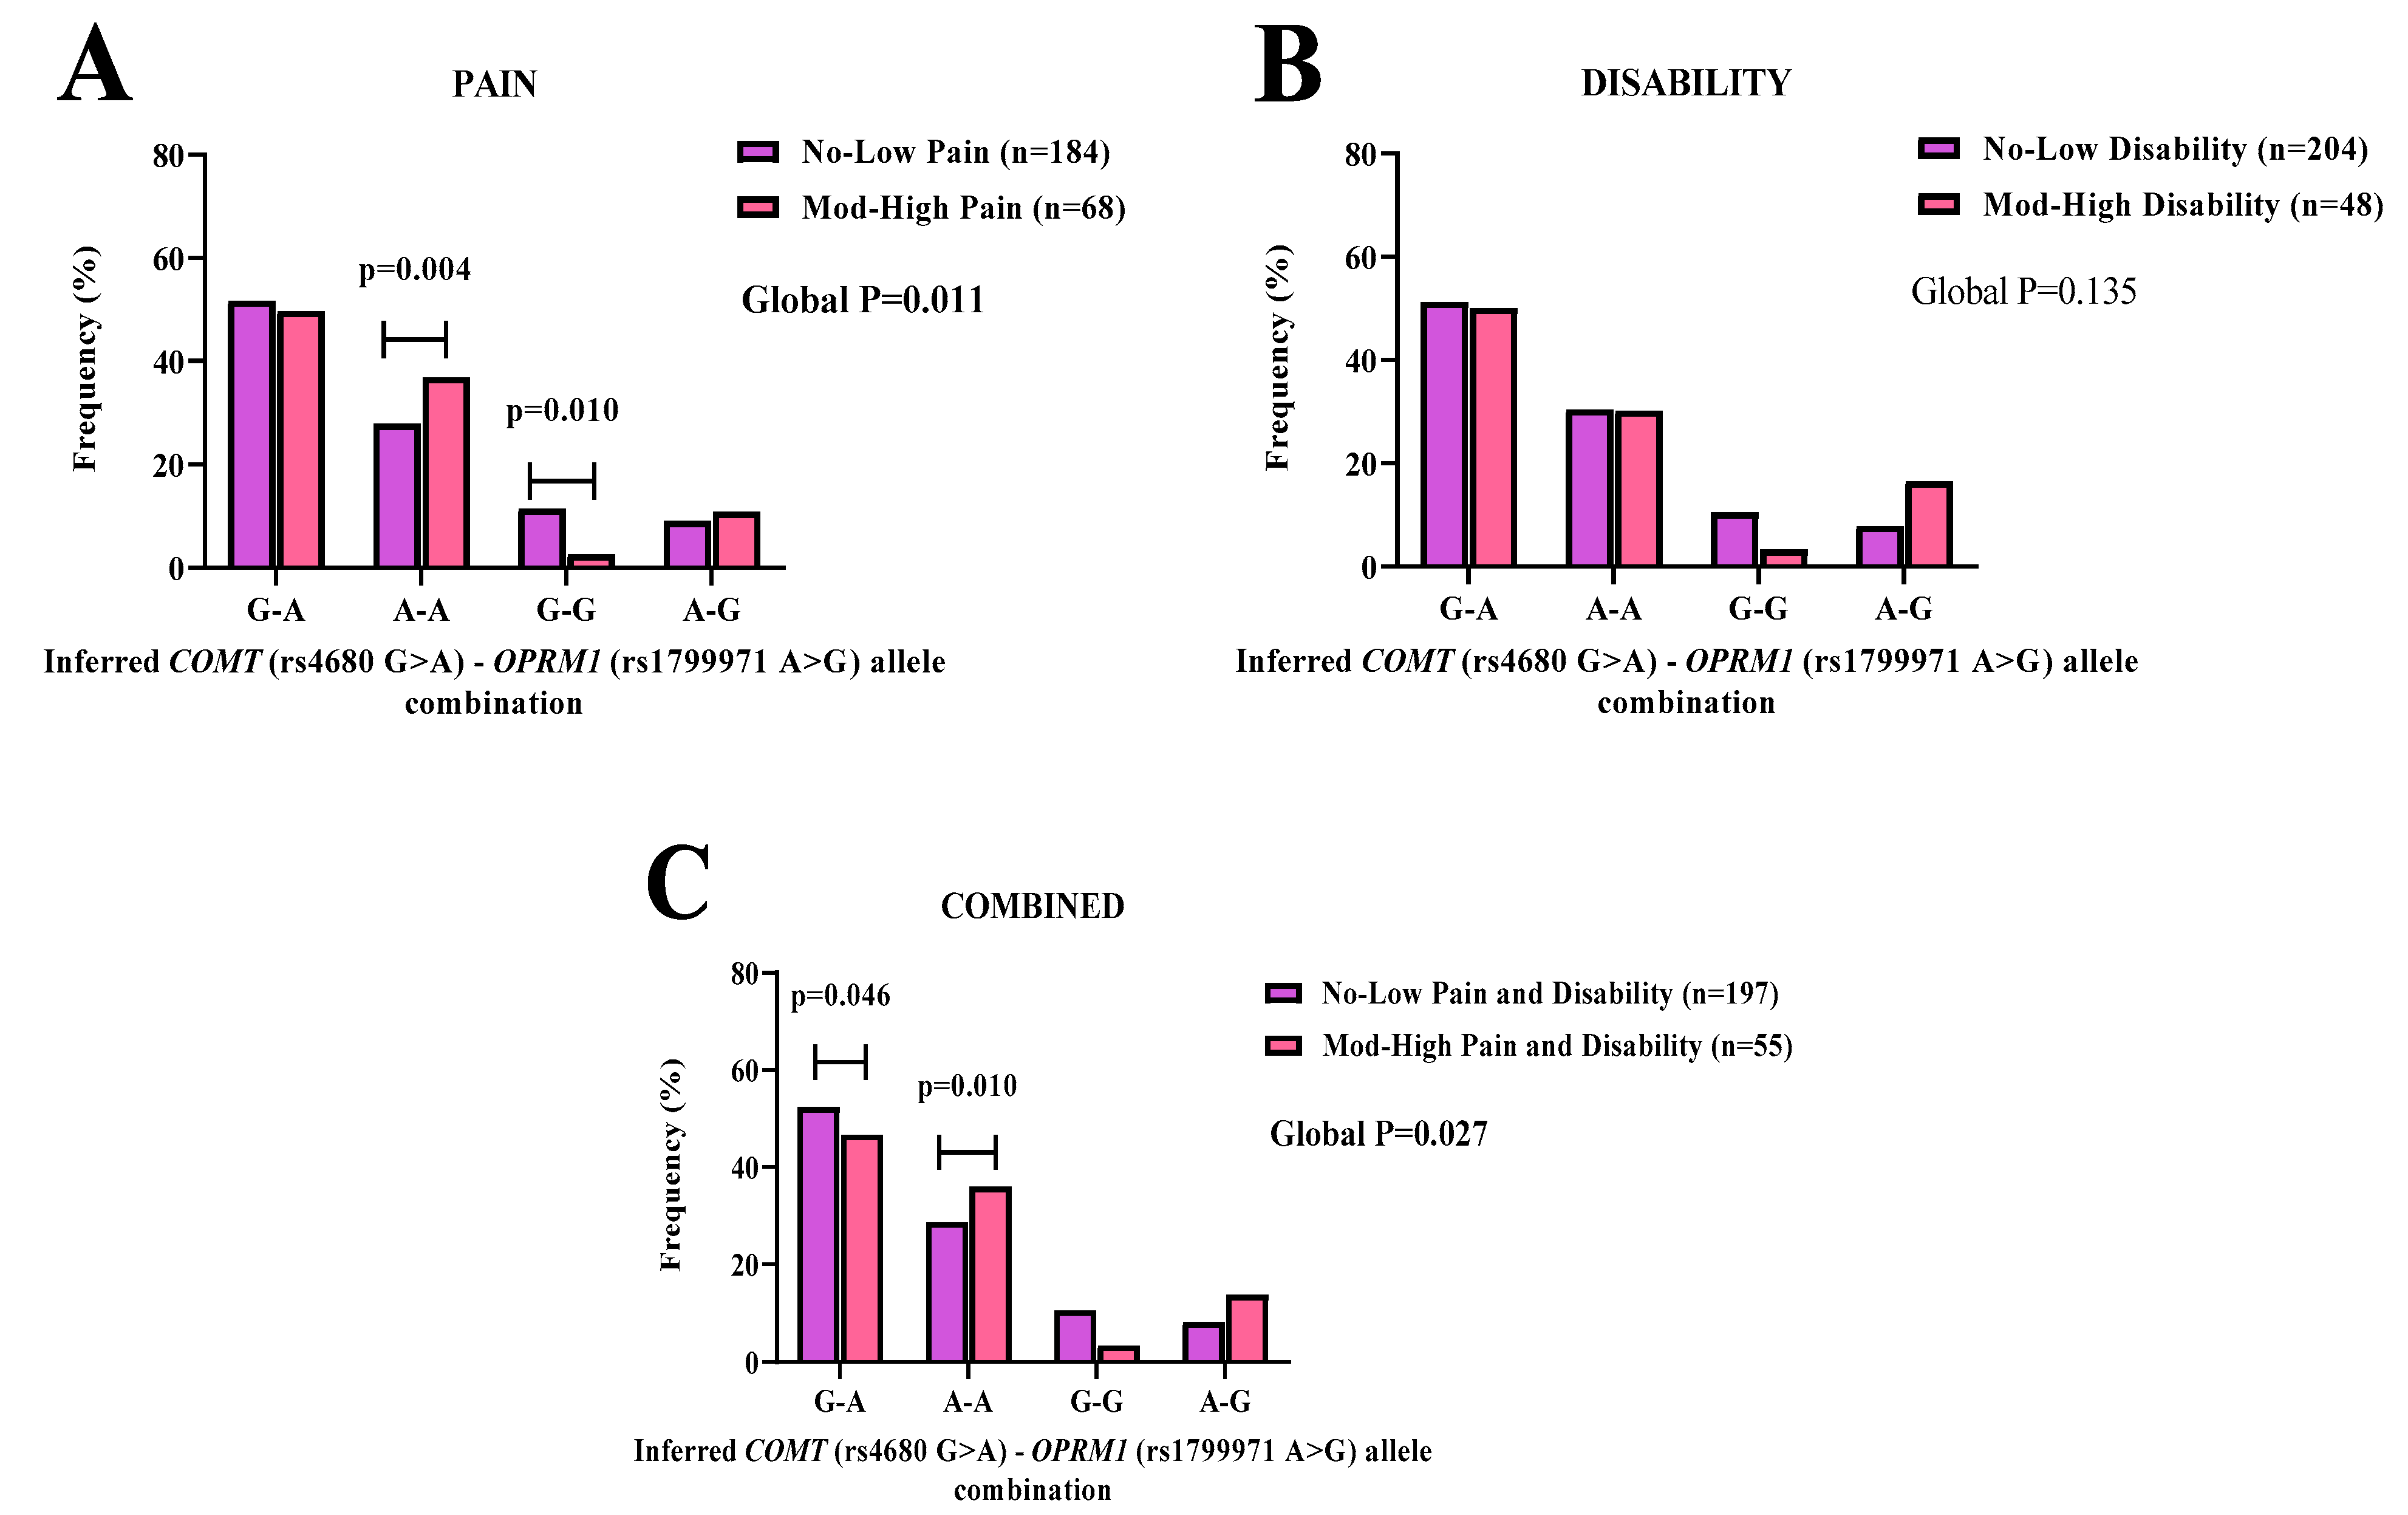
3.6. COMT-OPRM1 Allelic Combinations

COMT-OPRM1 allele–allele combinations were generated using the individual genotype data for COMT (rs4680 G > A) and OPRM1 (rs1799971 A > G, rs540825 T > A) polymorphisms.
Evaluating pain (p = 0.011) scores, for COMT (rs4680 G > A)-OPRM1 (rs1799971 A > G), the allele combination A-A was significantly observed in the moderate-high (36.9%) group compared to the no-low (27.9%) group. (Figure 3A). The allele combination G-G was significantly observed in the no-low (11.4%) group compared to the moderate-high (2.6%) group (Figure 3A). The A-A (p = 0.004, OR: 1.35, 95% CI: 0.85–2.15) and G-G (p = 0.010, OR: 0.23, 95% CI: 0.05–1.03) allele combinations were significantly associated with increased and reduced likelihoods of reporting moderate-high pain (Figure 3A).
No significant associations were noted between this allelic combination and disability (p = 0.135) scores (Figure 3B).
In the combined (pain and disability) (p = 0.027) scores’ category, the allele combination G-A, was significantly observed in the no-low (52.4%) group compared to the moderate-high (46.7%) group. The G-A (p = 0.046, OR: 1.00) combination was associated with equal likelihoods of reporting moderate-high combined (pain and disability)(Figure 3C). In addition, the allele combination A-A, was significantly observed in the moderate-high (36.0%) group, compared to the no-low (28.7%) group. The A-A (p = 0.010, OR: 1.42, 95% CI: 0.85–2.35) combination was significantly associated with an increased likelihood of reporting moderate-high combined (pain and disability)(Figure 3C).
No significant associations were noted between COMT (rs4680 G > A)–OPRM1 (rs540825 T > A) and pain (p = 0.052) or disability (p = 0.079)(Figure 4A,B).
In the combined (pain and disability) (p = 0.016) scores’ category, the allele combination G-T was significantly observed in the no-low (49.5%) group, compared to the moderate-high (36.6%) group. The G-T (p = 0.008, OR: 1.00) combination was associated with equal likelihood of reporting moderate-high combined (pain and disability) (Figure 4C). Whereas the allele combination A-A was significantly observed in the moderate-high (11.2%) group, compared to the no-low (8.0%) group. The A-A (p = 0.012, OR: 1.89, 95% CI: 0.81–4.38) was significantly associated with increased likelihood of reporting moderate-high combined (pain and disability) (Figure 4C).

3.7. Bioinformatic Analyses

Analyses of gene set enrichment tools for COMT and OPRM1 noted significant associations for both genes in several libraries (Figure S2). In the library for disease and drugs, the gene set was associated with several human diseases/conditions, including various pain conditions (Rare Disease GeneRIF and AutoRIF Gene lists). GeneMANIA analyses showed that COMT and OPRM1 share secondary and tertiary gene–associated functional networks that includes the AHCY, OPRD1, PENK and FGF2 genes (Table S7). Networks that include physical interactions, genetic interactions, co-expressed, predicted domains and pathway networks (Table S7).

4. Discussion

This study aimed to describe (i) four COMT SNPs previously associated with chronic pain that form part of the central haploblock, and (ii) to characterize the frequencies of the clinically relevant SNPs in the SA BCS cohort of mixed ancestry. The findings of this study shows that COMT polymorphisms are associated with the risk of chronic shoulder pain and disability. Further, that the association was observed in a unique South African cohort of mixed ancestry BCS. The findings revealed that a specific region between COMT rs6269 A > G–rs4680 G > A was implicated in the prevalence of chronic pain and disability. Furthermore, supporting evidence is provided implicating the potential role of gene–gene interactions, specifically between COMT-OPRM1 SNPs and chronic pain and disability within the SA BCS cohort. Interestingly, the study highlights distinct frequency differences for the COMT central haploblock in the SA population compared to the global population. Thus, the clinical relevance needs to be further explored in the context of effective pain management in this unique population.
Evaluation of the nongenetic risk factors noted significant differences between the groups for the participants age, and nodal involvement. Younger participants reported greater pain, disability and combined (pain and disability) scores, and had fewer nodes involved [30]. As earlier reported, the results are in alignment with previous literature for age, however the association for nodal involvement requires further scrutiny [3,30,41].
Genotype analysis of the functional COMT SNP rs4680 G > A, showed A/A genotype carriers had an increase in risk for pain by 3.23, and combined (pain and disability) by 3.81. Similarly, allelic analysis of the rs4680 A allele showed an increase in risk for pain by 1.58 and combined (pain and disability) by 1.71. These findings agree with the published studies indicating that rs4680 A allele is associated with increased pain and that the A allele correlates with decreased COMT enzyme activity [42,43]. Furthermore, the levels of COMT activity have been linked to the regulation of neurotransmitters in the pain modulation pathway, including the opioid system [24]. Several inconsistencies have been reported for this genetic locus, as noted by Baumbauer et al. [44]. These conflicting findings may be an indication of differences in both the study design and characterization of pain. Specifically referring to the differentiation between chronic and persistent pain conditions. The classification of chronic pain in our cohort of BCS with upper limb sequelae falls within the spectrum of musculoskeletal conditions [45].
Analyses of the central haploblock of COMT highlighted marked frequency differences between the SA BCS cohort and the reported global populations. We hypothesize that this is reflective of the significant variations in the minor allele frequencies for rs6269 A > G and rs4633 C > T across the different populations. Emphasizing the importance of profiling the genetic structure of unique populations, as in the case of the SA mixed ancestry cohort. Evaluation of the LD structure between the SNP pairs further emphasized the LD decay in the cohort investigated. This observation is not surprising, as it was previously described [46]. Specific haplotypes of the COMT haploblock was significantly associated with pain and combined (pain and disability), specifically the haplotype pairs rs6269A > G-rs4680 G > A. The observed G-G allele pair showed a decrease in risk by 0.67 for pain. Whereas the alternate A-A allele pair showed an increase in risk of 2.09 for pain and, 2.18 for combined (pain and disability). These allele pairs reflect the high enzyme COMT activity associated with the G allele [47]. The study design was limited by sample size and therefore we could not evaluate the full haploblock containing COMT rs6269 A > G, rs4633 C > T, rs4818 C > G, and rs4680 G > A.
Bioinformatic analysis have shown that COMT and OPRM1 do not directly interact with each other. However, both play pivotal functions within a broad network of shared partners towards modulating the descending pain pathway. GeneMANIA analysis showed the AHCY, FGF2, OPRD1 and PENK genes connect COMT and OPRM1 (Figure 5) [48]. The adenosyl homocysteinase enzyme (AHCY) and fibroblast growth factor 2 (FGF2) genes are responsible regulating methyltransferase (e.g., COMT activity), and fibroblasts activity, respectively [49,50]. Opioid receptor delta one (OPRD1) are related to- and can form a heterodimer with OPRM1, and proenkephalin (PENK) encodes the neuropeptide enkephalin, a strong agonist for the µ-opioid receptor [51,52]. Both AHCY and FGF2 share functional associated networks with PENK. While a genetic interaction was inferred for AHCY-PENK (radiation hybrid panels), FGF2-PENK are co-expressed within tumorous specimens (gene expression microarrays) [53,54]. Evidence extracted from the gene set enrichment showed the genes function within the same biological compartments and expressed within the same tissues following epigenomic profiling [55]. COMT and OPRM1 share target compatibility for a predicted microRNA (miRNA) interaction with mir-16-5p, micro molecules that are important for controlling gene expression [56]. Both genes were associated with morphine and dopamine drug signatures, which supports the pharmacodynamic roles associated with COMT and OPRM1 [57]. Furthermore, the genes are associated with pain and other conditions (Figure S1).
We, therefore, conducted a proxy for gene–gene interaction by analyzing allele combinations between the COMT (rs4680 G > A) and OPRM1 (rs1799971 A > G, and rs540825 T > A) SNPs. A few specific allele–allele combinations between COMT and OPRM1 polymorphisms were shown to be associated with risk for reporting pain and combined (pain and disability). The most significant interaction noted was for the COMT (rs4680 G > A)–OPRM1 (rs1799971 A > G) allele–allele combination. Analysis showed carriers with the A-A allele–allele pair had an increase in risk of 1.35 for pain and 1.42 for combined (pain and disability). Whereas the alternate G-G allele–allele combination pair had a decrease in risk for pain by 0.23. While our study did not measure opioid requirements, we did measure reported pain scores. Our findings contrasted with previous studies described in populations of European descent, which measured opioid requirements and rescue [31,58]. Our findings provide preliminary evidence to support a future study to investigate opioid administration and usage. This will allow for the exploration of these allele–pairs within the context of opioid use and pain management in this unique SA cohort.
The study could only detect effects with odds ratios of 1.5, with the current study sample powered at <80% [30]. One instrument i.e., the SPADI index was employed to measure pain and disability symptoms related to musculoskeletal pathologies. Furthermore, following the hypothesis approach, we evaluated COMT and OPRM1 SNPs that have been previously implicated in pain modulation. No correction was done for multiple testing given that more than two SNPs were evaluated (familywise error rate) accompanied by underpowered sample size. For gene–gene interactions, logistic regression analysis was applied, and allele frequencies of >3% were used to describe the interactions between COMT and OPRM1. However, given the extreme variances in data points generated for multi-locus genotype combinations, allele–allele frequency detection may be challenging [59]. Additionally, ethnicity in this cohort was self-reported. Future reports will include larger sample sizes to increase power and evaluate the association of pain and pain genes concerning pain treatment protocols. This may also allow for the consideration of other clinically relevant confounders within the analyses.

5. Conclusions

This study described the role of COMT polymorphisms in chronic shoulder pain and disability in BCS in a unique SA population. We report an association between polymorphisms of COMT with chronic pain and disability. The gene–gene interaction analysis highlighted significant and novel correlations between the COMT-OPRM1 allele–allele combinations and pain and combined (pain and disability), which contrasts to previous literature. This contrasting finding therefore highlights the value of exploring genes and various gene–gene combinations in diverse population cohorts towards improving personalized pain protocols.

Supplementary Materials

The following supporting information can be downloaded at: https://www.mdpi.com/article/10.3390/genes14010009/s1, Figure S1: The genomic organization of the COMT gene. (A) The chromosomal location 22q11.21 and region of interest (ROI) containing the COMT gene. (B) A schematic diagram of the COMT gene, illustration the genomic organization and locations of the four snps, rs6269 A > G, rs4633 C > T, rs4818 C > G and rs4680 G > A. (C) Linkage disequilibrium (LD) plot showing the |D’| x 100 values for COMT SNP pairwise analysis for the SA BCS cohort. |D’| values > 0.9 indicating strong LD. Figure S2: Gene set Enrichment analyses for the COMT and OPRM1 genes from Enrichr (maayanlab.cloud). Bar length and color brightness represents the degree of significance attached to both genes relative to the term. The longer and brighter the shade of red, the more significant the association is between the gene set and the term. Significance is the adjusted p value (p < 0.005) using the Benjamini-Hochberg method. Table S1: Clinical parameters evaluated in this study. Table S2: Clinical characteristics between pain, disability and the combined (pain and disability) categories. Table S3: Breast cancer treatment characteristics between pain, disability, and combined (pain and disability) categories. Table S4: Genotype effects of the COMT (rs6269 A > G, rs4633 C > T, rs4818 C > G and rs4680 G > A) on the quantitative clinical variables recorded for participants. Table S5: Genotype effects of the COMT rs6269 A > G and rs4633 C > T) polymorphism on categorical clinical variables recorded for participants. Table S6: Genotype effects of the COMT rs4818 C > G and rs4680 G > A) polymorphism on categorical clinical variables recorded for participants. Table S7: The list of genes that form part of the functionally associated network for the COMT and OPRM1 genes, obtained by GeneMANIA.

Author Contributions

Conceptualization, F.F., D.S. and A.V.S.; methodology, F.F., D.S. and A.V.S.; software, F.F.; validation, F.F., A.V.S. and D.S.; formal analysis, F.F., A.V.S. and D.S.; investigation, F.F., A.V.S. and D.S.; resources, F.F., A.V.S. and D.S.; data curation, F.F., A.V.S. and D.S.; writing—original draft preparation, F.F.; writing—review and editing, F.F., A.V.S. and D.S.; visualization, F.F., A.V.S. and D.S.; supervision, D.S. and A.V.S.; project administration, D.S. and A.V.S.; funding acquisition, D.S. All authors have read and agreed to the published version of the manuscript.

Funding

This work was supported by the University of Cape Town (WUN scholarship and Foundation Contingency award) and the National Research Foundations (Grant number: 102470), South Africa. The opinions and conclusions summarized in the study, are those of the author/s and do not necessarily reflect the opinions of the funders.

Institutional Review Board Statement

The study was conducted in accordance with the Declaration of Helsinki and approved by the Institutional Review Board (or Ethics Committee) of the Human Research Ethics Committee, University of Cape Town (HREC REF: 650/2016, 125/2017).

Informed Consent Statement

Informed consent was obtained from all subjects involved in the study.

Data Availability Statement

Not applicable.

Acknowledgments

The authors would like to thank (1) all participants in this study, (2) the nursing and administrative staff of the CRC, and (3) T.S Mafu for their participation and assistance in the recruitment process and study data capturing.

Conflicts of Interest

The authors declare no conflict of interest surrounding the research conducted in this study. The funders had no role in the design of the study; in the collection, analyses, or interpretation of data; in the writing of the manuscript; or in the decision to publish the results.

References

  1. Hidding, J.T.; Beurskens, C.H.; van der Wees, P.J.; van Laarhoven, H.W.; Nijhuis-van der Sanden, M.W. Treatment related impairments in arm and shoulder in patients with breast cancer: A systematic review. PLoS ONE 2014, 9, e96748. [Google Scholar] [CrossRef]
  2. Shamley, D.; Srinaganathan, R.; Oskrochi, R.; Lascurain-Aguirrebena, I.; Sugden, E. Three-dimensional scapulothoracic motion following treatment for breast cancer. Breast Cancer Res. Treat. 2009, 118, 315–322. [Google Scholar] [CrossRef] [PubMed]
  3. Wang, L.; Guyatt, G.H.; Kennedy, S.A.; Romerosa, B.; Kwon, H.Y.; Kaushal, A.; Chang, Y.; Craigie, S.; de Almeida, C.P.B.; Couban, R.J.; et al. Predictors of persistent pain after breast cancer surgery: A systematic review and meta-analysis of observational studies. Can. Med Assoc. J. 2016, 188, E352–E361. [Google Scholar] [CrossRef] [PubMed] [Green Version]
  4. Salz, T.; Lavery, J.A.; Lipitz-Snyderman, A.N.; Boudreau, D.M.; Moryl, N.; Gillespie, E.F.; Korenstein, D. Trends in Opioid Use Among Older Survivors of Colorectal, Lung, and Breast Cancers. J. Clin. Oncol. 2019, 37, 1001–1011. [Google Scholar] [CrossRef] [PubMed]
  5. Knisely, M.R.; Conley, Y.P.; Smoot, B.; Paul, S.M.; Levine, J.D.; Miaskowski, C. Associations Between Catecholaminergic and Serotonergic Genes and Persistent Arm Pain Severity Following Breast Cancer Surgery. J. Pain 2019, 20, 1100–1111. [Google Scholar] [CrossRef] [PubMed]
  6. Andersen, K.G.; Duriaud, H.M.; Jensen, H.E.; Kroman, N.; Kehlet, H. Predictive factors for the development of persistent pain after breast cancer surgery. Pain 2015, 156, 2413–2422. [Google Scholar] [CrossRef]
  7. Dimova, V.; Lotsch, J.; Huhne, K.; Winterpacht, A.; Heesen, M.; Parthum, A.; Weber, P.G.; Carbon, R.; Griessinger, N.; Sittl, R.; et al. Association of genetic and psychological factors with persistent pain after cosmetic thoracic surgery. J. Pain Res. 2015, 8, 829–844. [Google Scholar] [CrossRef] [Green Version]
  8. Wang, F.Y.; Wang, P.; Zhao, D.F.; Gonzalez, F.J.; Fan, Y.F.; Xia, Y.L.; Ge, G.B.; Yang, L. Analytical methodologies for sensing catechol-O-methyltransferase activity and their applications. J. Pharm. Anal. 2021, 11, 15–27. [Google Scholar] [CrossRef]
  9. Bates, G.W.; Edman, C.D.; Porter, J.C.; MacDonald, P.C. Catechol-O-methyltransferase activity in erythrocytes of pregnant women. Am. J. Obstet. Gynecol. 1978, 131, 555–557. [Google Scholar] [CrossRef]
  10. Paravati, S.; Rosani, A.; Warrington, S.J. Physiology, Catecholamines. In StatPearls; StatPearls Publishing: Treasure Island, FL, USA, 2022. [Google Scholar]
  11. Garcha, A.S.; Cohen, D.L. Catecholamine excess: Pseudopheochromocytoma and beyond. Adv. Chronic Kidney Dis. 2015, 22, 218–223. [Google Scholar] [CrossRef]
  12. Diatchenko, L.; Slade, G.D.; Nackley, A.G.; Bhalang, K.; Sigurdsson, A.; Belfer, I.; Goldman, D.; Xu, K.; Shabalina, S.A.; Shagin, D.; et al. Genetic basis for individual variations in pain perception and the development of a chronic pain condition. Hum. Mol. Genet. 2005, 14, 135–143. [Google Scholar] [CrossRef] [Green Version]
  13. Schlereth, T.; Birklein, F. The sympathetic nervous system and pain. Neuromolecular. Med. 2008, 10, 141–147. [Google Scholar] [CrossRef] [PubMed]
  14. Bjorland, S.; Moen, A.; Schistad, E.; Gjerstad, J.; Roe, C. Genes associated with persistent lumbar radicular pain; a systematic review. BMC Musculoskelet. Disord. 2016, 17, 500. [Google Scholar] [CrossRef] [PubMed] [Green Version]
  15. Nackley, A.G.; Shabalina, S.A.; Tchivileva, I.E.; Satterfield, K.; Korchynskyi, O.; Makarov, S.S.; Maixner, W.; Diatchenko, L. Human catechol-O-methyltransferase haplotypes modulate protein expression by altering mRNA secondary structure. Science 2006, 314, 1930–1933. [Google Scholar] [CrossRef] [PubMed] [Green Version]
  16. Machius, M.; Declerck, N.; Huber, R.; Wiegand, G. Kinetic stabilization of Bacillus licheniformis α-amylase through introduction of hydrophobic residues at the surface. J. Biol. Chem. 2003, 278, 11546–11553. [Google Scholar] [CrossRef] [PubMed] [Green Version]
  17. Schmack, K.; Rossler, H.; Sekutowicz, M.; Brandl, E.J.; Muller, D.J.; Petrovic, P.; Sterzer, P. Linking unfounded beliefs to genetic dopamine availability. Front. Hum. Neurosci. 2015, 9, 521. [Google Scholar] [CrossRef] [Green Version]
  18. Khalil, H.; Sereika, S.M.; Dai, F.; Alexander, S.; Conley, Y.; Gruen, G.; Meng, L.; Siska, P.; Tarkin, I.; Henker, R. OPRM1 and COMT Gene-Gene Interaction Is Associated With Postoperative Pain and Opioid Consumption After Orthopedic Trauma. Biol. Res. Nurs. 2017, 19, 170–179. [Google Scholar] [CrossRef] [Green Version]
  19. Sadhasivam, S.; Chidambaran, V.; Olbrecht, V.A.; Esslinger, H.R.; Zhang, K.; Zhang, X.; Martin, L.J. Genetics of pain perception, COMT and postoperative pain management in children. Pharmacogenomics 2014, 15, 277–284. [Google Scholar] [CrossRef] [Green Version]
  20. Zhang, Y.; Belfer, I.; Nouraie, M.; Zeng, Q.; Goel, R.; Chu, Y.; Krasiy, I.; Krishnamurti, L. Association of genetic variation in COMT gene with pain related to sickle cell disease in patients from the walk-PHaSST study. J. Pain Res. 2018, 11, 537–543. [Google Scholar] [CrossRef] [Green Version]
  21. Mukherjee, N.; Kidd, K.K.; Pakstis, A.J.; Speed, W.C.; Li, H.; Tarnok, Z.; Barta, C.; Kajuna, S.L.; Kidd, J.R. The complex global pattern of genetic variation and linkage disequilibrium at catechol-O-methyltransferase. Mol. Psychiatry 2010, 15, 216–225. [Google Scholar] [CrossRef]
  22. De Wit, E.; Delport, W.; Rugamika, C.E.; Meintjes, A.; Moller, M.; van Helden, P.D.; Seoighe, C.; Hoal, E.G. Genome-wide analysis of the structure of the South African Coloured Population in the Western Cape. Hum. Genet. 2010, 128, 145–153. [Google Scholar] [CrossRef]
  23. Ikediobi, O.; Aouizerat, B.; Xiao, Y.; Gandhi, M.; Gebhardt, S.; Warnich, L. Analysis of pharmacogenetic traits in two distinct South African populations. Hum. Genom. 2011, 5, 265–282. [Google Scholar] [CrossRef] [Green Version]
  24. Kowarik, M.C.; Einhauser, J.; Jochim, B.; Buttner, A.; Tolle, T.R.; Riemenschneider, M.; Platzer, S.; Berthele, A. Impact of the COMT Val(108/158)Met polymorphism on the mu-opioid receptor system in the human brain: Mu-opioid receptor, met-enkephalin and β-endorphin expression. Neurosci. Lett. 2012, 506, 214–219. [Google Scholar] [CrossRef]
  25. Yao, P.; Ding, Y.Y.; Wang, Z.B.; Ma, J.M.; Hong, T.; Pan, S.N. Effect of gene polymorphism of COMT and OPRM1 on the preoperative pain sensitivity in patients with cancer. Int. J. Clin. Exp. Med. 2015, 8, 10036–10039. [Google Scholar]
  26. Corder, G.; Castro, D.C.; Bruchas, M.R.; Scherrer, G. Endogenous and Exogenous Opioids in Pain. Annu. Rev. Neurosci. 2018, 41, 453–473. [Google Scholar] [CrossRef]
  27. Ren, Z.Y.; Xu, X.Q.; Bao, Y.P.; He, J.; Shi, L.; Deng, J.H.; Gao, X.J.; Tang, H.L.; Wang, Y.M.; Lu, L. The impact of genetic variation on sensitivity to opioid analgesics in patients with postoperative pain: A systematic review and meta-analysis. Pain Physician 2015, 18, 131–152. [Google Scholar]
  28. Hwang, I.C.; Park, J.Y.; Myung, S.K.; Ahn, H.Y.; Fukuda, K.; Liao, Q. OPRM1 A118G gene variant and postoperative opioid requirement: A systematic review and meta-analysis. Anesthesiology 2014, 121, 825–834. [Google Scholar] [CrossRef] [Green Version]
  29. Saiz-Rodriguez, M.; Ochoa, D.; Herrador, C.; Belmonte, C.; Roman, M.; Alday, E.; Koller, D.; Zubiaur, P.; Mejia, G.; Hernandez-Martinez, M.; et al. Polymorphisms associated with fentanyl pharmacokinetics, pharmacodynamics and adverse effects. Basic Clin. Pharmacol. Toxicol. 2019, 124, 321–329. [Google Scholar] [CrossRef] [Green Version]
  30. Firfirey, F.; September, A.V.; Shamley, D. ABCB1 and OPRM1 single-nucleotide polymorphisms collectively modulate chronic shoulder pain and dysfunction in South African breast cancer survivors. Pharmacogenomics 2022, 23, 513–530. [Google Scholar] [CrossRef]
  31. Reyes-Gibby, C.C.; Shete, S.; Rakvag, T.; Bhat, S.V.; Skorpen, F.; Bruera, E.; Kaasa, S.; Klepstad, P. Exploring joint effects of genes and the clinical efficacy of morphine for cancer pain: OPRM1 and COMT gene. Pain 2007, 130, 25–30. [Google Scholar] [CrossRef] [Green Version]
  32. Little, J.; Higgins, J.P.; Ioannidis, J.P.; Moher, D.; Gagnon, F.; Von Elm, E.; Khoury, M.J.; Cohen, B.; Davey-Smith, G.; Grimshaw, J. STrengthening the REporting of Genetic Association Studies (STREGA)—an extension of the STROBE statement. Genet. Epidemiol. Off. Publ. Int. Genet. Epidemiol. Soc. 2009, 33, 581–598. [Google Scholar]
  33. Tengrup, I.; Tennvall-Nittby, L.; Christiansson, I.; Laurin, M. Arm morbidity after breast-conserving therapy for breast cancer. Acta Oncol. 2000, 39, 393–397. [Google Scholar] [CrossRef] [Green Version]
  34. MacDermid, J.C.; Solomon, P.; Prkachin, K. The Shoulder Pain and Disability Index demonstrates factor, construct and longitudinal validity. BMC Musculoskelet. Disord. 2006, 7, 12. [Google Scholar] [CrossRef]
  35. Gauderman, W.; Morrison, J. QUANTO 1.1: A Computer Program for Power and Sample Size Calculations for Genetic-epidemiology Studies, Version 1.2.4. 2006. Available online: http://hydra.usc.edu/gxe (accessed on 22 November 2022).
  36. Dell. Inc. Dell Statistica (Data Analysis Software System) [Computer Program]. Version 13. 2016. Available online: www.statsoft.com (accessed on 30 April 2021).
  37. R Core Team. R: A Language and Environment for Statistical Computing; R Foundation for Statistical Computing: Vienna, Austria, 2013; ISBN 3-900051-07-0. [Google Scholar]
  38. Warnes, G.; Gorjanc, wcfG.; Leisch, F.; Man, M. _genetics: Population Genetics_. R package version 1.3.8.1.3. 2021. Available online: https://CRAN.R-project.org/package=genetics (accessed on 22 November 2022).
  39. González, J.; Armengol, L.; Guinó, E.; Solé, X.; Moreno, V. SNPassoc: SNPs-based whole genome association studies. R Package Version 2014, 1, 2–9. [Google Scholar]
  40. Sinnwell, J.P.; Schaid, D. Statistical Methods for Haplotypes When Linkage Phase Is Ambiguous; Mayo Clinic Division of Health Sciences Research: Rochester, MN, USA, 2011. [Google Scholar]
  41. Doong, S.H.; Dhruva, A.; Dunn, L.B.; West, C.; Paul, S.M.; Cooper, B.A.; Elboim, C.; Abrams, G.; Merriman, J.D.; Langford, D.J.; et al. Associations between cytokine genes and a symptom cluster of pain, fatigue, sleep disturbance, and depression in patients prior to breast cancer surgery. Biol. Res. Nurs. 2015, 17, 237–247. [Google Scholar] [CrossRef] [Green Version]
  42. Henker, R.A.; Lewis, A.; Dai, F.; Lariviere, W.R.; Meng, L.; Gruen, G.S.; Sereika, S.M.; Pape, H.; Tarkin, I.S.; Gowda, I. The associations between OPRM 1 and COMT genotypes and postoperative pain, opioid use, and opioid-induced sedation. Biol. Res. Nurs. 2013, 15, 309–317. [Google Scholar] [CrossRef] [Green Version]
  43. Martinez-Jauand, M.; Sitges, C.; Rodriguez, V.; Picornell, A.; Ramon, M.; Buskila, D.; Montoya, P. Pain sensitivity in fibromyalgia is associated with catechol-O-methyltransferase (COMT) gene. Eur. J. Pain 2013, 17, 16–27. [Google Scholar] [CrossRef]
  44. Baumbauer, K.M.; Ramesh, D.; Perry, M.; Carney, K.B.; Julian, T.; Glidden, N.; Dorsey, S.G.; Starkweather, A.R.; Young, E.E. Contribution of COMT and BDNF Genotype and Expression to the Risk of Transition From Acute to Chronic Low Back Pain. Clin. J. Pain 2020, 36, 430–439. [Google Scholar] [CrossRef]
  45. Shamley, D. A Cross-Disciplinary Look at Shoulder Pain and Dysfunction after Treatment for Breast Cancer. Int. J. Cancer Clin. Res. 2015, 2. [Google Scholar] [CrossRef]
  46. Chimusa, E.R.; Meintjies, A.; Tchanga, M.; Mulder, N.; Seoighe, C.; Soodyall, H.; Ramesar, R. A genomic portrait of haplotype diversity and signatures of selection in indigenous southern African populations. PLoS Genet. 2015, 11, e1005052. [Google Scholar] [CrossRef] [Green Version]
  47. Chen, J.; Lipska, B.K.; Halim, N.; Ma, Q.D.; Matsumoto, M.; Melhem, S.; Kolachana, B.S.; Hyde, T.M.; Herman, M.M.; Apud, J.; et al. Functional analysis of genetic variation in catechol-O-methyltransferase (COMT): Effects on mRNA, protein, and enzyme activity in postmortem human brain. Am. J. Hum. Genet. 2004, 75, 807–821. [Google Scholar] [CrossRef] [PubMed] [Green Version]
  48. Warde-Farley, D.; Donaldson, S.L.; Comes, O.; Zuberi, K.; Badrawi, R.; Chao, P.; Franz, M.; Grouios, C.; Kazi, F.; Lopes, C.T.; et al. The GeneMANIA prediction server: Biological network integration for gene prioritization and predicting gene function. Nucleic Acids Res. 2010, 38, W214–W220. [Google Scholar] [CrossRef] [PubMed] [Green Version]
  49. Vizan, P.; Di Croce, L.; Aranda, S. Functional and Pathological Roles of AHCY. Front. Cell Dev. Biol. 2021, 9, 654344. [Google Scholar] [CrossRef]
  50. Mori, S.; Hatori, N.; Kawaguchi, N.; Hamada, Y.; Shih, T.C.; Wu, C.Y.; Lam, K.S.; Matsuura, N.; Yamamoto, H.; Takada, Y.K.; et al. The integrin-binding defective FGF2 mutants potently suppress FGF2 signalling and angiogenesis. Biosci. Rep. 2017, 37, BSR20170173. [Google Scholar] [CrossRef] [PubMed]
  51. Wu, B.; Hand, W.; Alexov, E. Opioid Addiction and Opioid Receptor Dimerization: Structural Modeling of the OPRD1 and OPRM1 Heterodimer and Its Signaling Pathways. Int. J. Mol. Sci. 2021, 22, 10290. [Google Scholar] [CrossRef]
  52. Gonzalez-Nunez, V.; González, A.J.; Barreto-Valer, K.; Rodríguez, R.E. In Vivo Regulation of the μ Opioid Receptor: Role of the Endogenous Opioid Agents. Mol. Med. 2013, 19, 7–17. [Google Scholar] [CrossRef] [PubMed]
  53. Lin, A.; Wang, R.T.; Ahn, S.; Park, C.C.; Smith, D.J. A genome-wide map of human genetic interactions inferred from radiation hybrid genotypes. Genome Res. 2010, 20, 1122–1132. [Google Scholar] [CrossRef] [PubMed] [Green Version]
  54. Dobbin, K.K.; Beer, D.G.; Meyerson, M.; Yeatman, T.J.; Gerald, W.L.; Jacobson, J.W.; Conley, B.; Buetow, K.H.; Heiskanen, M.; Simon, R.M.; et al. Interlaboratory comparability study of cancer gene expression analysis using oligonucleotide microarrays. Clin. Cancer Res. 2005, 11, 565–572. [Google Scholar] [CrossRef]
  55. Xie, Z.; Bailey, A.; Kuleshov, M.V.; Clarke, D.J.B.; Evangelista, J.E.; Jenkins, S.L.; Lachmann, A.; Wojciechowicz, M.L.; Kropiwnicki, E.; Jagodnik, K.M.; et al. Gene Set Knowledge Discovery with Enrichr. Curr. Protoc. 2021, 1, e90. [Google Scholar] [CrossRef]
  56. Li, L.; Jia, J.; Liu, X.; Yang, S.; Ye, S.; Yang, W.; Zhang, Y. MicroRNA-16-5p Controls Development of Osteoarthritis by Targeting SMAD3 in Chondrocytes. Curr. Pharm. Des. 2015, 21, 5160–5167. [Google Scholar] [CrossRef]
  57. Patel, J.N.; Hamadeh, I.S. Pharmacogenomics-guided opioid management. BMJ Support. Palliat. Care 2020, 10, 374–378. [Google Scholar] [CrossRef] [PubMed]
  58. Matic, M.; Jongen, J.L.; Elens, L.; de Wildt, S.N.; Tibboel, D.; Sillevis Smitt, P.A.; van Schaik, R.H. Advanced cancer pain: The search for genetic factors correlated with interindividual variability in opioid requirement. Pharmacogenomics 2017, 18, 1133–1142. [Google Scholar] [CrossRef] [PubMed]
  59. Gilbert-Diamond, D.; Moore, J.H. Analysis of gene-gene interactions. Curr. Protoc. Hum. Genet. 2011, 70, 14. [Google Scholar] [CrossRef]
Figure 1. The global distribution and prevalence of allele frequencies for the COMT SNPs (rs6269 A > G, rs4633 C > T, rs4818 C > G, and rs4680 G > A) were obtained from the public database, NCBI-1000Genomes project (Accessed: 23 August 2021 [https://www.ncbi.nlm.nih.gov/snp/]). Displayed are the minor allele frequencies for (A) rs6269 A > G, (B) rs4633 C > T, (C) rs4818 C > G, and (D) rs4680 G > A are shown for the SA BCS cohort in comparison to the global populations. P values describe the comparison in frequency distribution between the SA BCS cohort, and the global and super populations. Significant p values (p < 0.05) are in bold type set.
Genes 14 00009 g001
Figure 2. The inferred COMT (rs6269 A > G-rs4680 G > A) allele–allele combinations’ frequency distribution patterns are displayed for (A) pain, (B) disability, and (C) combined (pain and disability) symptoms in SA BCS. No-low (purple bars) and moderate-high (pink bars) groups are displayed with the number of participants in parenthesis (n). Statistically significant (p < 0.05) frequency differences are noted with an age-adjusted p-value in bold.
Genes 14 00009 g002
Figure 3. The inferred COMT (rs4680 G > A)-OPRM1 (rs1799971 A > G) allele–allele combinations’ frequency distribution patterns are shown for (A) pain, (B) disability, and (C) combined (pain and disability) symptoms in SA BCS. No-low (purple bars) and moderate-high (pink bars) groups are displayed with the number of participants in parenthesis (n). Statistically significant (p < 0.05) frequency differences are noted with an age-adjusted p-value in bold.
Genes 14 00009 g003
Figure 4. The inferred COMT (rs4680 G > A)-OPRM1 (rs540825 T > A) allele–allele combinations’ frequency distribution patterns are shown for (A) pain, (B) disability, and (C) combined (pain and disability) symptoms in SA BCS. No-low (purple bars) and moderate-high (pink bars) groups are displayed with the number of participants in parenthesis (n). Statistically significant (p < 0.05) frequency differences are noted with an age-adjusted p-value in bold.
Genes 14 00009 g004
Figure 5. GeneMANIA network and gene–gene interaction analysis for the COMT and OPRM1 genes. Venn diagram depicting the shared network pathways and secondary gene-associated networks that indirectly associates COMT and OPRM1. Indicated by color is physical interactions (pink), genetic interactions (dark green), co-localization (dark blue), co-expressed (purple), predicted (orange), pathway (light blue) and shared protein domain (light green) network for 15 genes.
Genes 14 00009 g005
Table 1. Genotype and minor allele frequency distributions, of the COMT (rs6269 A > G; rs4633 C > T; rs4818 C > G; rs4680 G > A) polymorphisms between groups for pain, disability and combined (pain and disability) scores.
Pain Disability Pain and Disability
PolymorphismsNo-LowMod-High No-LowMod-High No-LowMod-High
(n = 184)(n = 68) AIC (n = 204)(n = 48) (n = 197)(n = 55) AIC
COMT
rs6269 A > G
G/G38.9 (68)35.4 (23) 38.5 (75)35.6 (16) 37.8 (71)38.5 (20)
A/G45.1 (79)46.2 (30) 45.1 (88)46.7 (21) 46.3 (87)42.3 (22)
A/A16.0 (28)18.5 (12) 16.4 (32)17.8 (8) 16.0 (30)19.2 (10)
G allele61.4 (215)58.5 (76) 61.0 (238)58.9 (53) 60.9 (229)59.6 (62)
p value 10.848 0.937 0.787
G Allele p value 20.600 0.721 0.821
HWE0.5320.617 0.4571.000 0.6510.406
rs4633 C > T
T/T34.3 (60)29.2 (19) 34.9 (68)24.4 (11) 35.1 (66)25 (13)
C/T46.9 (82)47.7 (31) 44.6 (87)57.8 (26) 45.7 (86)51.9 (27)
C/C18.9 (33)23.1 (15) 20.5 (40)17.8 (8) 19.1 (36)23.1 (12)
T allele57.7 (202)53.1 (69) 57.2 (223)53.3 (48) 58.0 (218)51.0 (53)
p value 10.557 0.178 0.261
T Allele p value 20.407 0.556 0.220
HWE0.5460.628 0.1540.389 0.3071.000
rs4818 C > G
C/C52.0 (89)52.3 (34) 51.6 (99)54.5 (24) 50.8 (94)56.9 (29)
C/G43.3 (74)43.1 (28) 43.8 (84)40.9 (18) 44.3 (82)39.2 (20)
G/G4.7 (8)4.6 (3) 4.7 (9)4.5 (2) 4.9 (9)3.9 (2)
G allele26.3 (90)26.2 (34) 26.6 (102)25.0 (22) 27.0 (100)23.5 (24)
p value 10.480 0.880 0.618
G Allele p value 21.000 0.893 0.527
HWE0.2470.526 0.2010.702 0.1990.707
rs4680 G > A
G/G41.0 (71)27.7 (18)0.015 a268.339.9 (77)26.7 (12) 40.9 (76)25.0 (13)0.009 a240.0
A/G46.2 (80)50.8 (33)0.382 b273.445.6 (88)55.6 (25) 46.2 (86)51.9 (27)0.342 b245.9
A/A12.7 (22)21.5 (14)0.050 c270.414.5 (28)17.8 (8) 12.9 (24)23.1 (12)0.041 c242.6
A allele35.8 (124)46.9 (61) 37.3 (144)45.6 (41) 36.0 (134)49.0 (51)
p value 10.024 268.70.113 0.015 240.3
A Allele p value 20.035 0.152 0.017
HWE0.8741.000 0.5500.564 0.8771.000
Notes: Genotype and allele frequencies are expressed as a percentage (%) with the number of participants (n) in parentheses. Global p values 1 signifies p-values for genotypes between groups, p values 2 signifies p values for alleles between groups; Significant (p < 0.05) p-values are indicated in bold typeset. p values for logistic regression analysis are listed for the dominant a, over-dominant b, and recessive c models. Included are the p-values of the Hardy–Weinberg equilibrium exact test for each of the categories included. Abbreviations: AIC: Akaike information criterion score; Mod-High: Moderate-High; HWE: Hardy–Weinberg equilibrium.
Disclaimer/Publisher’s Note: The statements, opinions and data contained in all publications are solely those of the individual author(s) and contributor(s) and not of MDPI and/or the editor(s). MDPI and/or the editor(s) disclaim responsibility for any injury to people or property resulting from any ideas, methods, instructions or products referred to in the content.

