
Association Analysis of PRKAA2 and MSMB Polymorphisms and Growth Traits of Xiangsu Hybrid Pigs
 ,
,
Abstract
:1. Introduction
2. Materials and Methods
2.1. Ethical Approval
2.2. Bioinformatics Analyses
2.3. Animal Weight and Body Size Data and Tissue Collection
2.4. DNA and RNA Extraction and cDNA Synthesis
2.5. Primer Design
2.6. Polymerase Chain Reaction (PCR)
2.7. Real-Time PCR
2.8. Data Analysis
3. Results
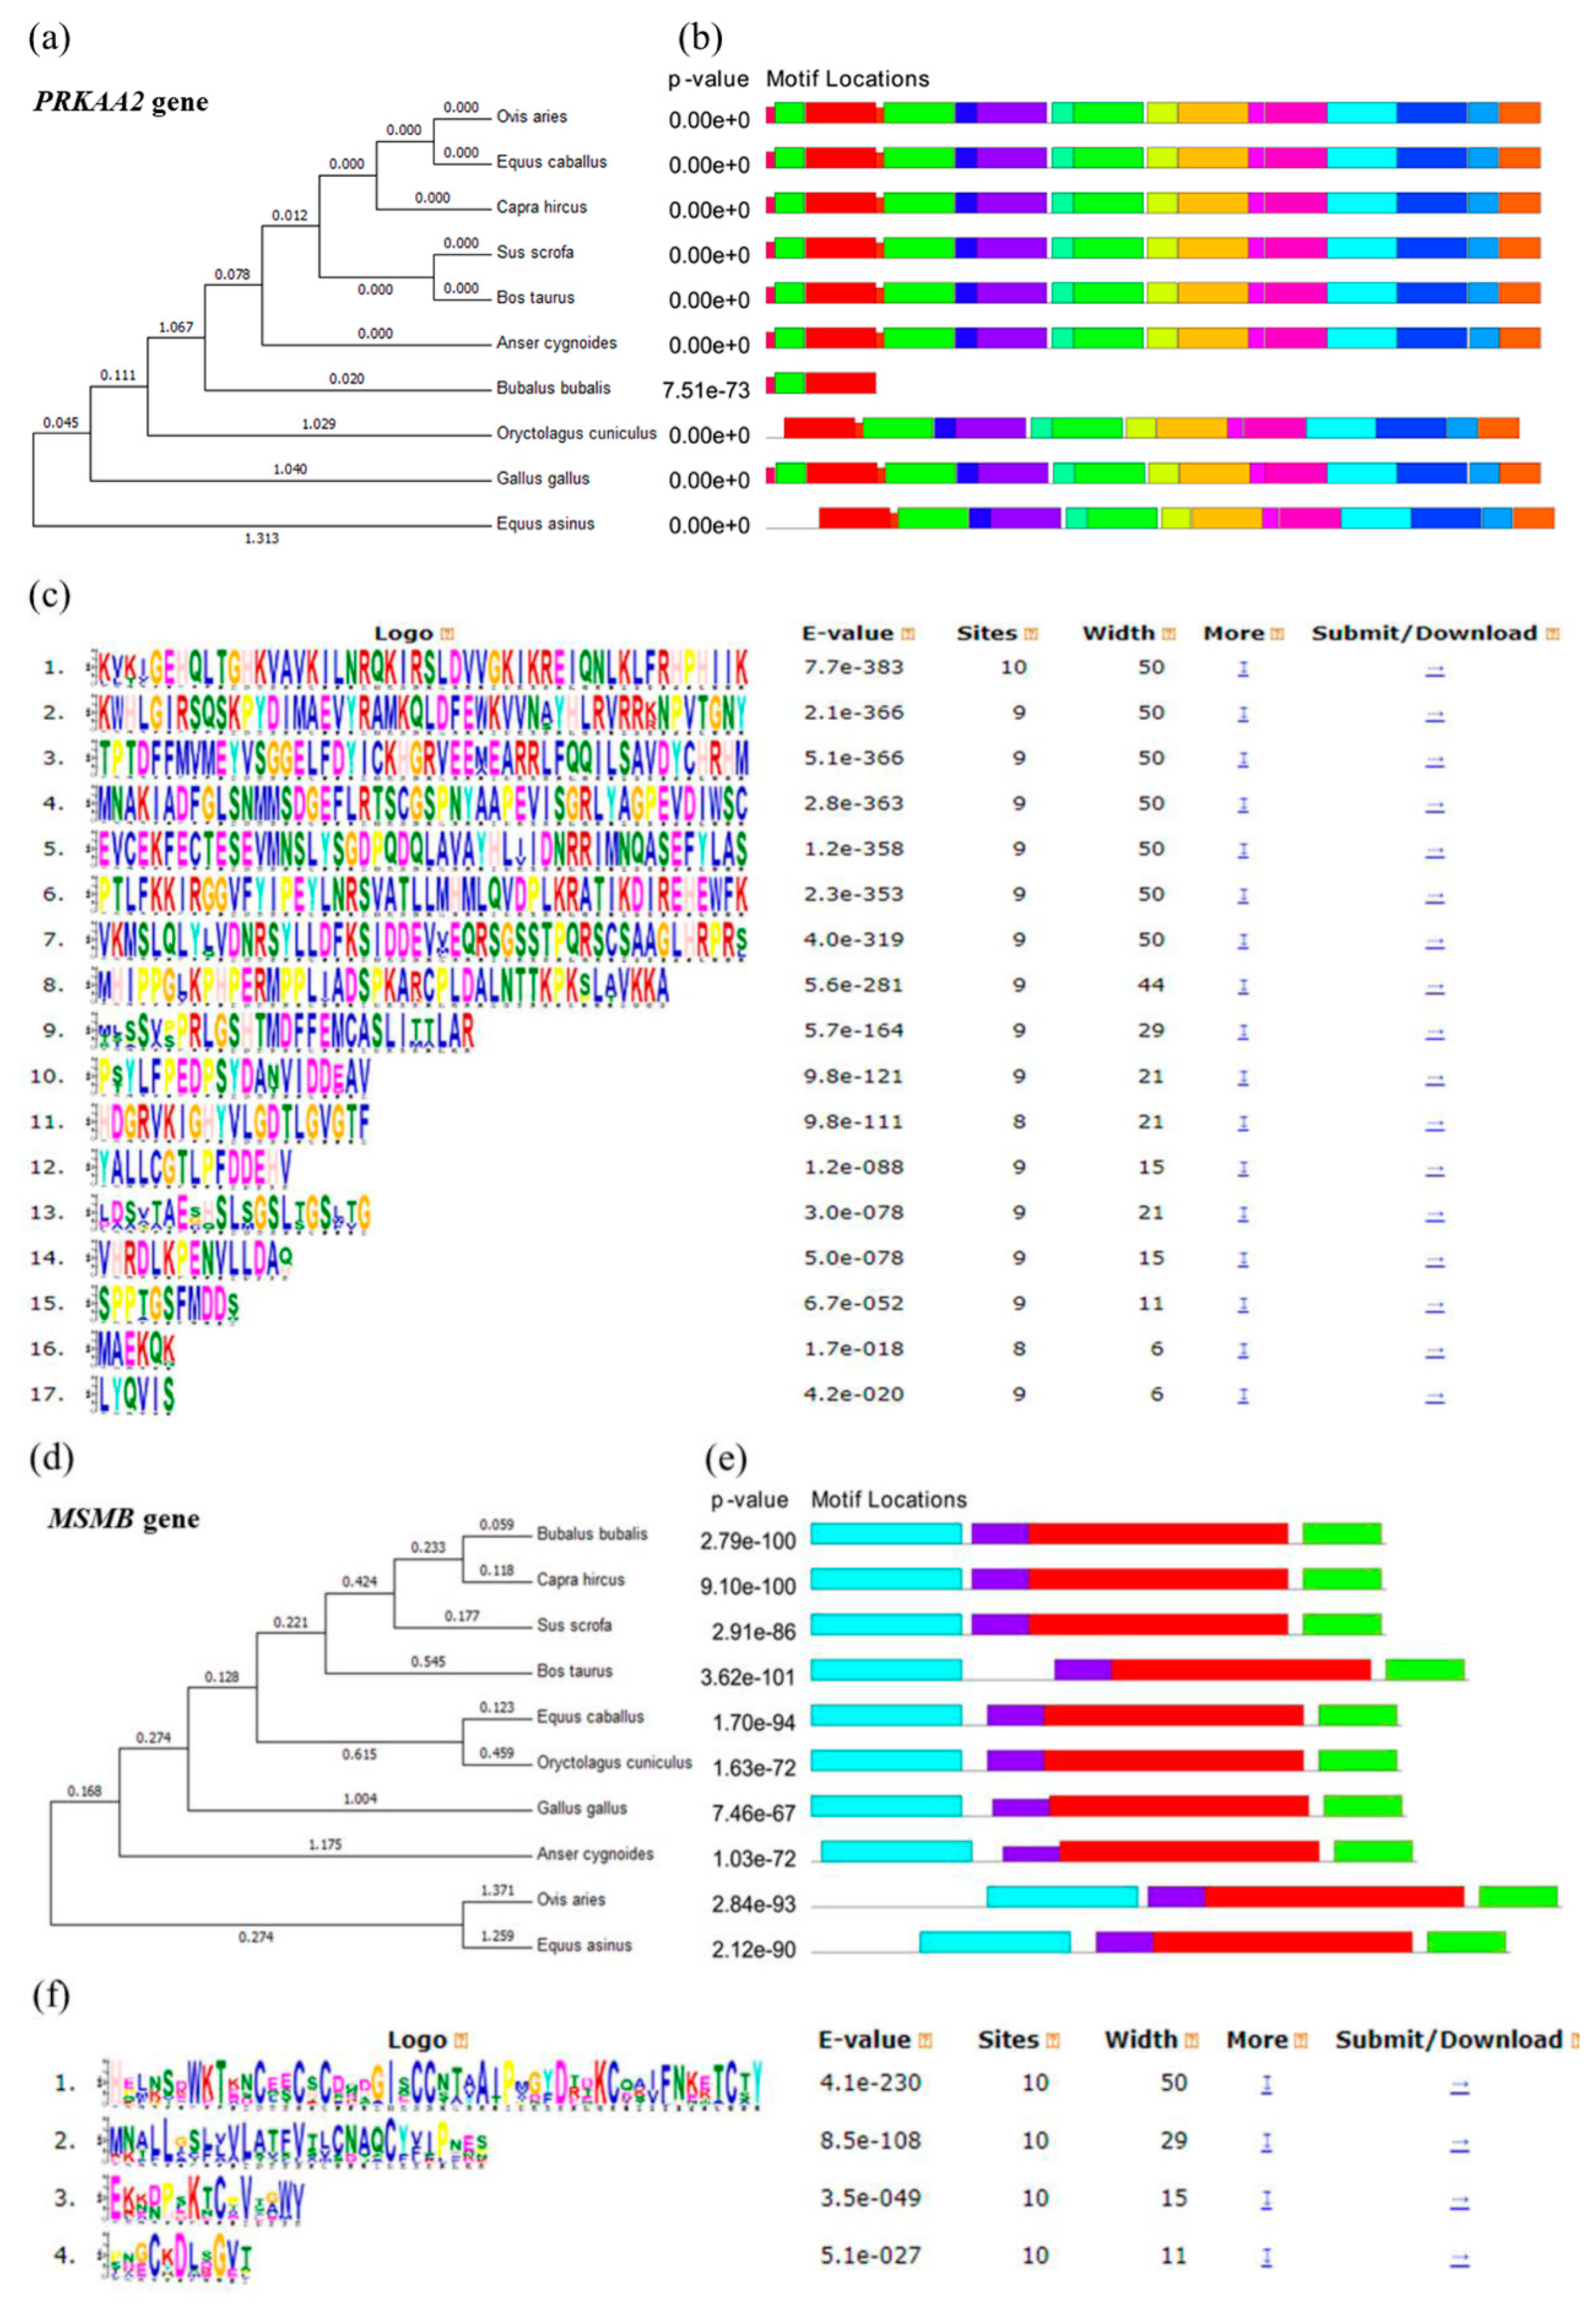
3.1. Bioinformatic Analysis of PRKAA2 and MSMB
3.2. Detection of SNP Mutation Sites in PRKAA2 and MSMB
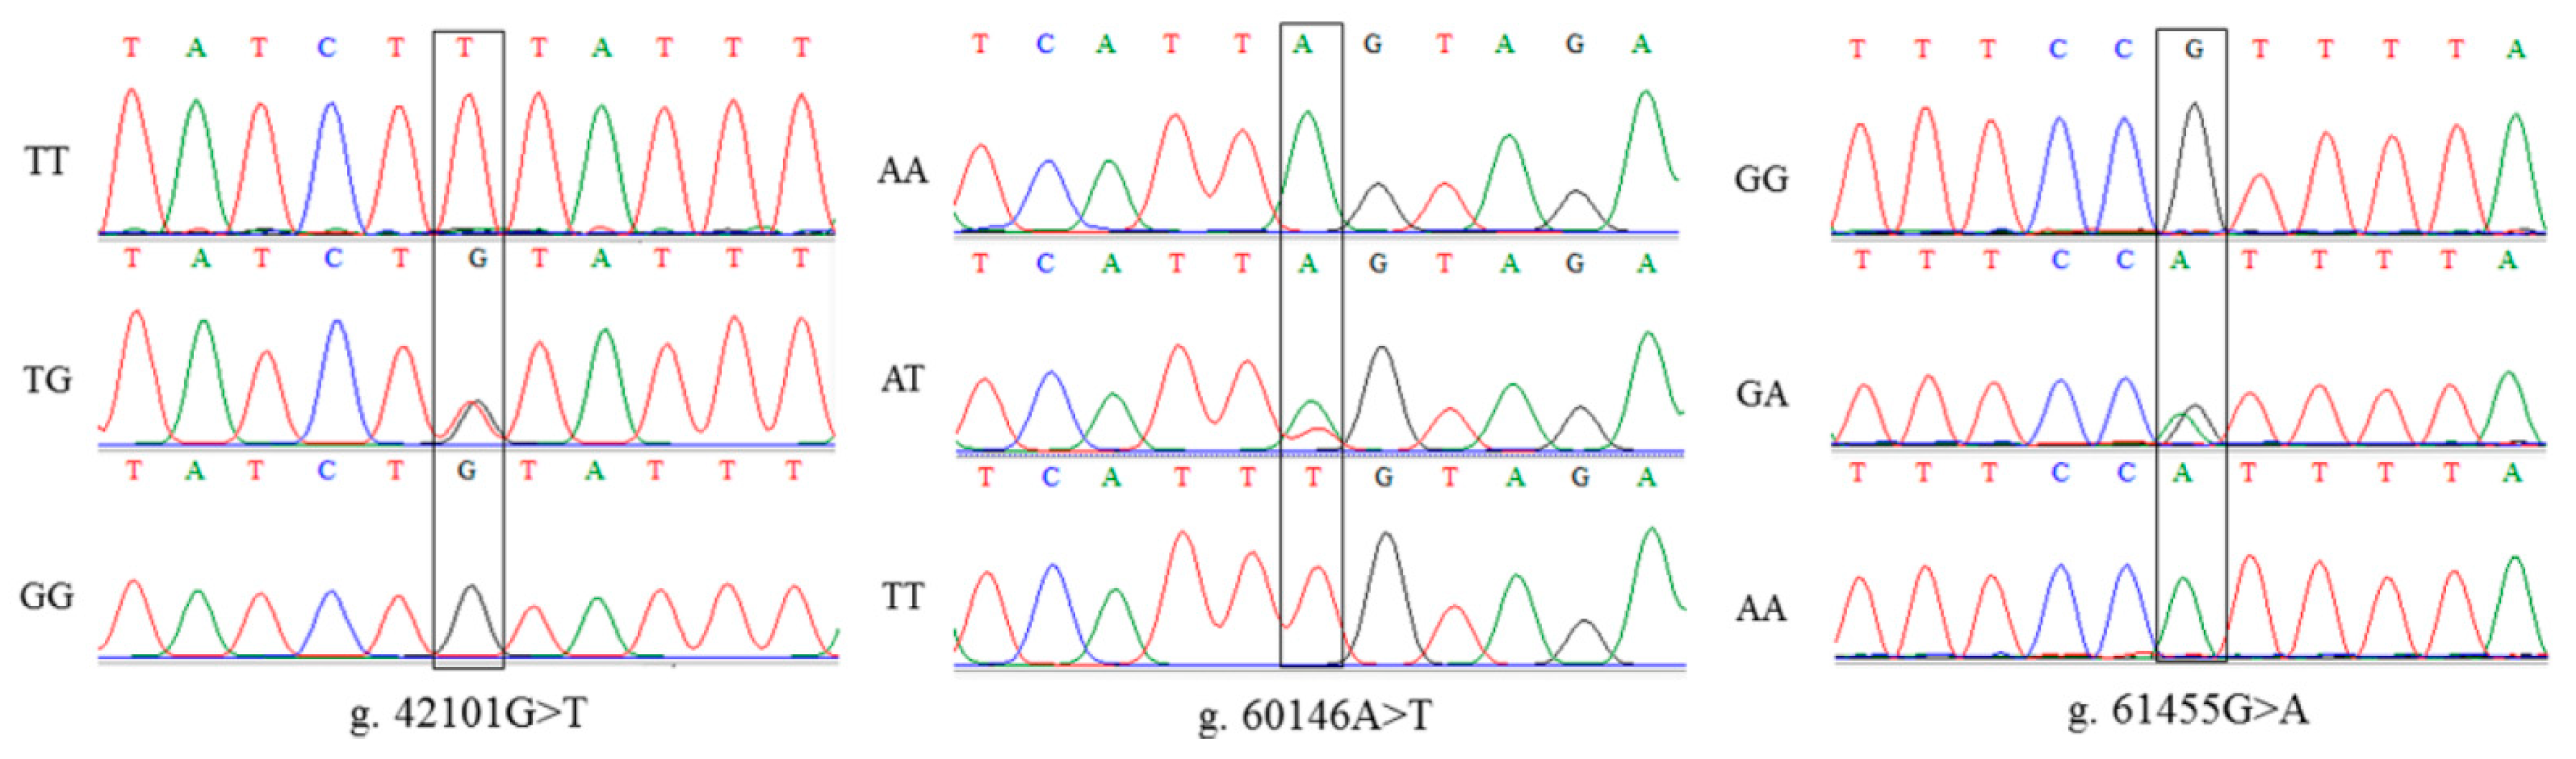
3.2.1. PRKAA2 SNP Mutation Site Detection
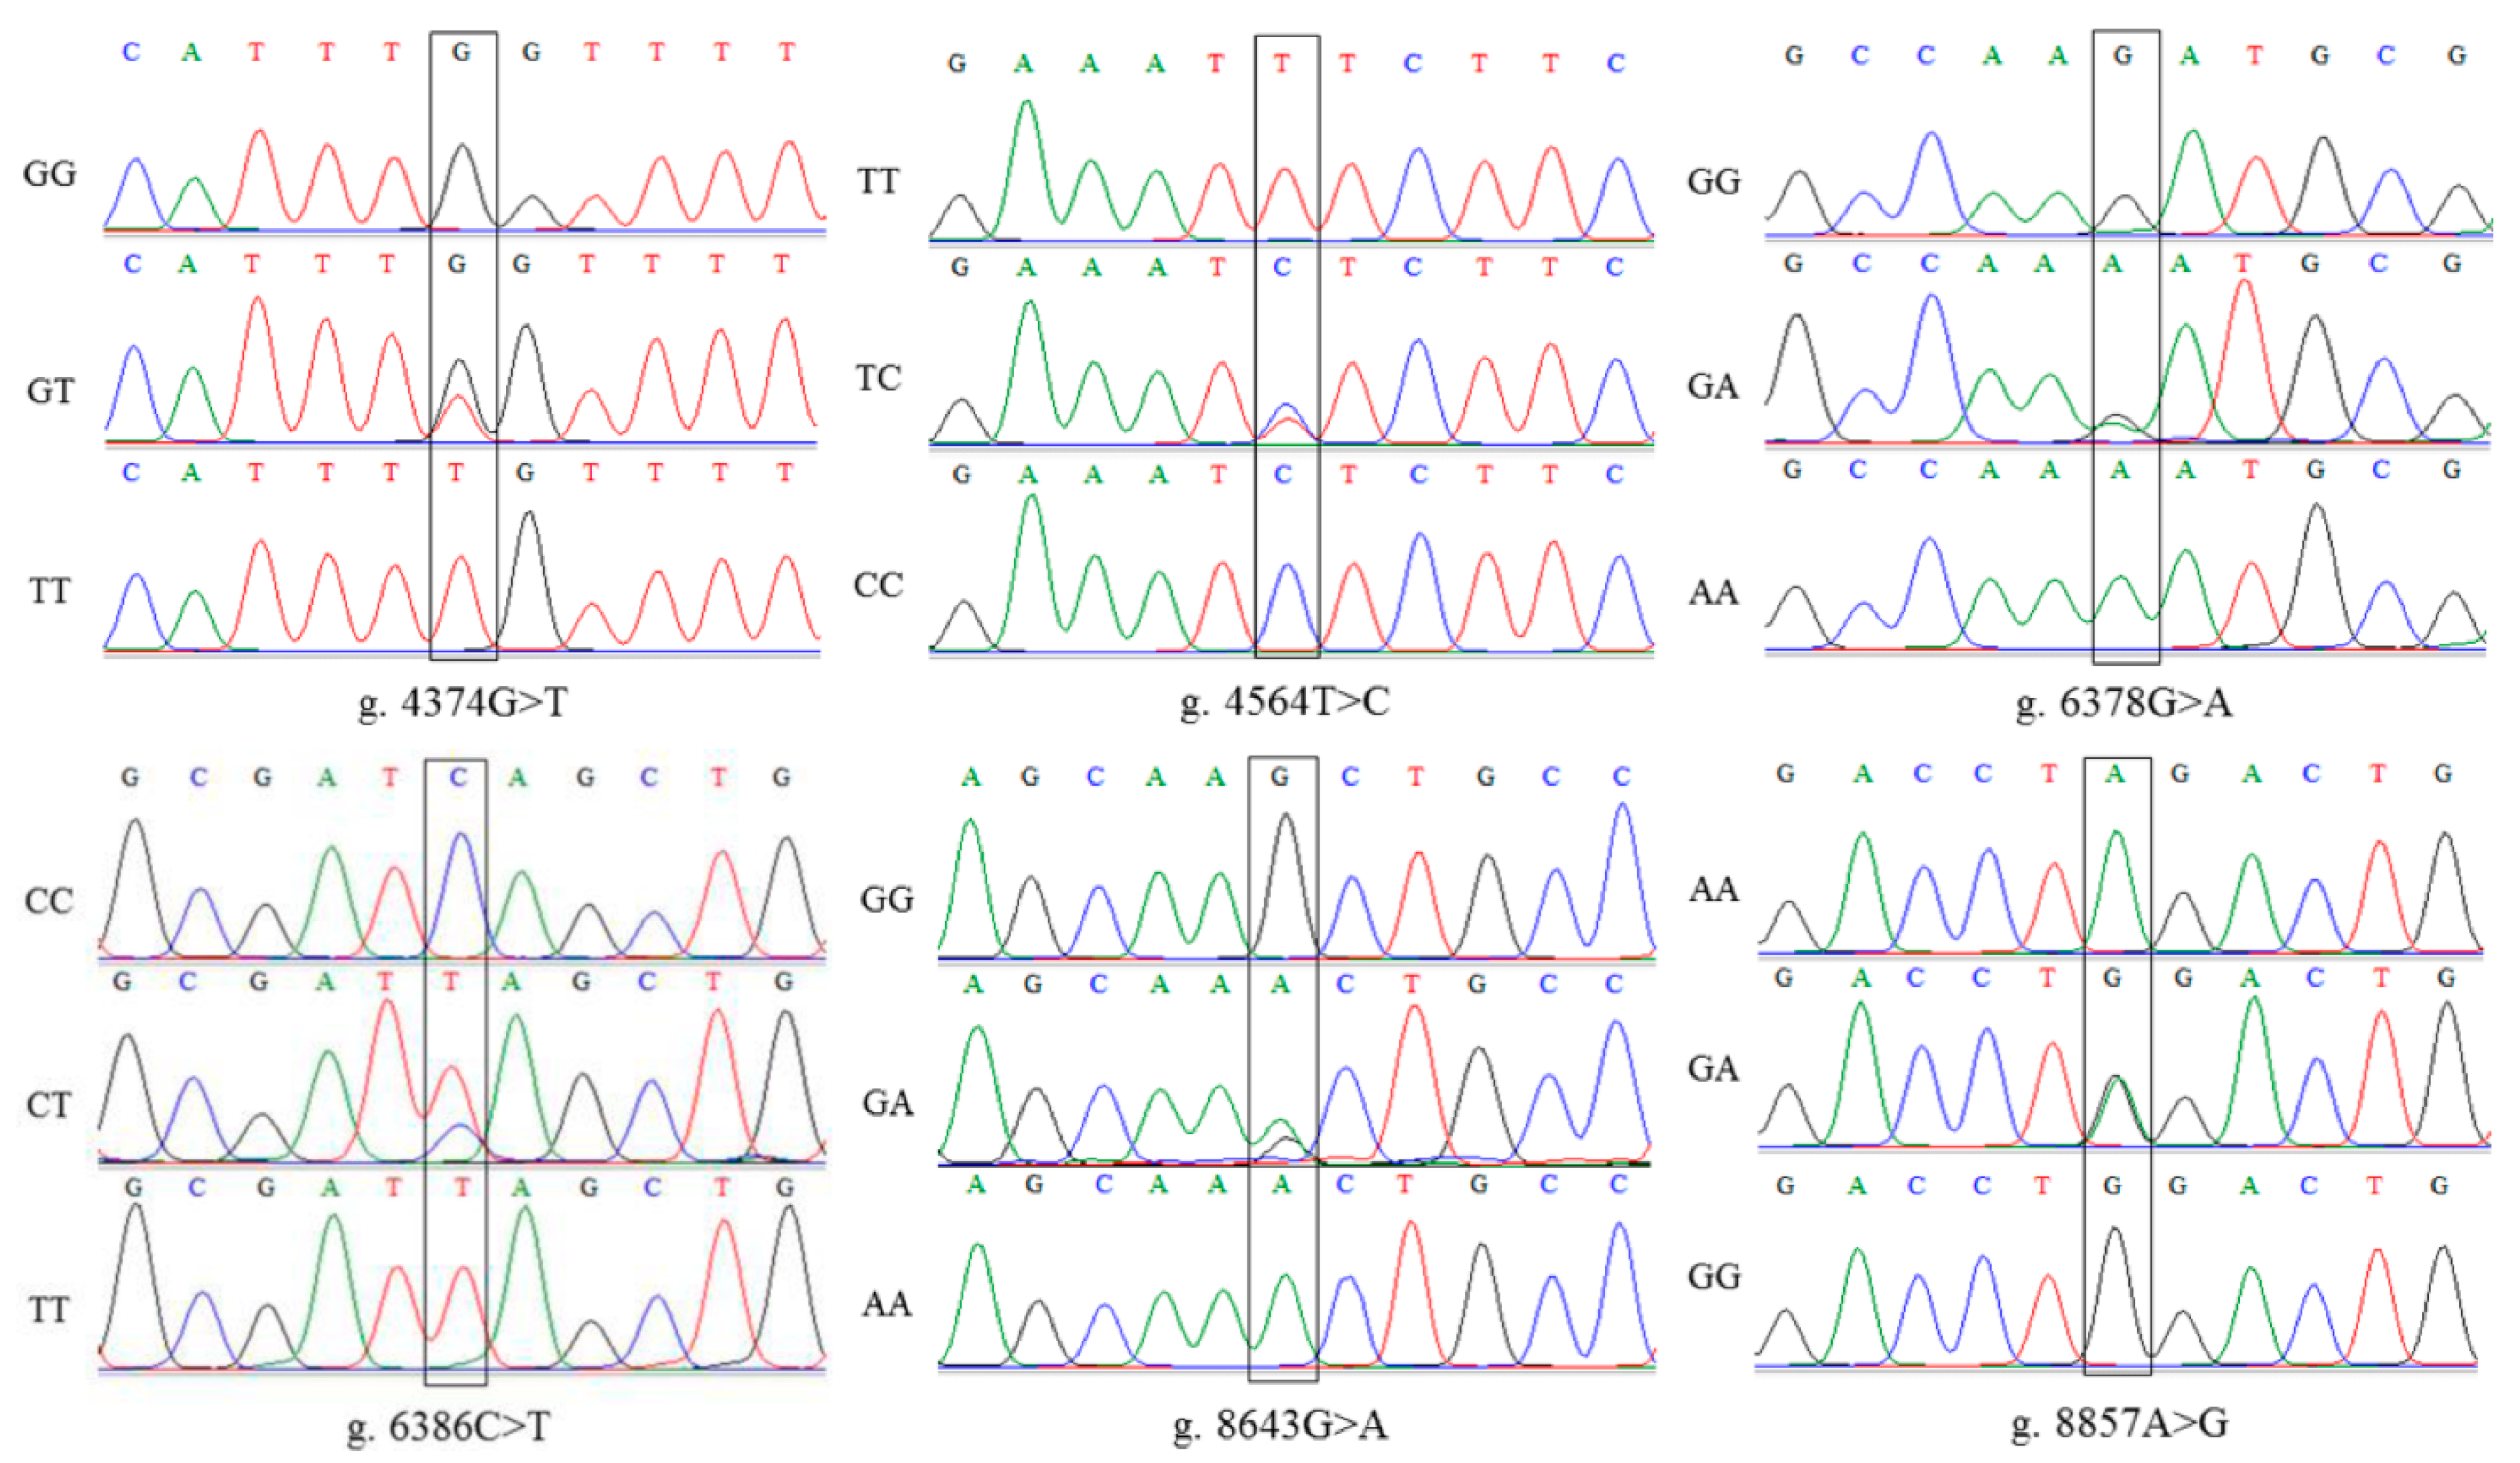
3.2.2. MSMB SNP Mutation Site Detection
3.3. Genetic Diversity Analysis of PRKAA2 and MSMB Mutation Groups
3.3.1. Genetic Diversity Analysis of PRKAA2 Mutant Groups
3.3.2. Genetic Diversity Analysis of MSMB Mutant Groups
3.4. Correlation Analysis of Genotypes and Growth Traits
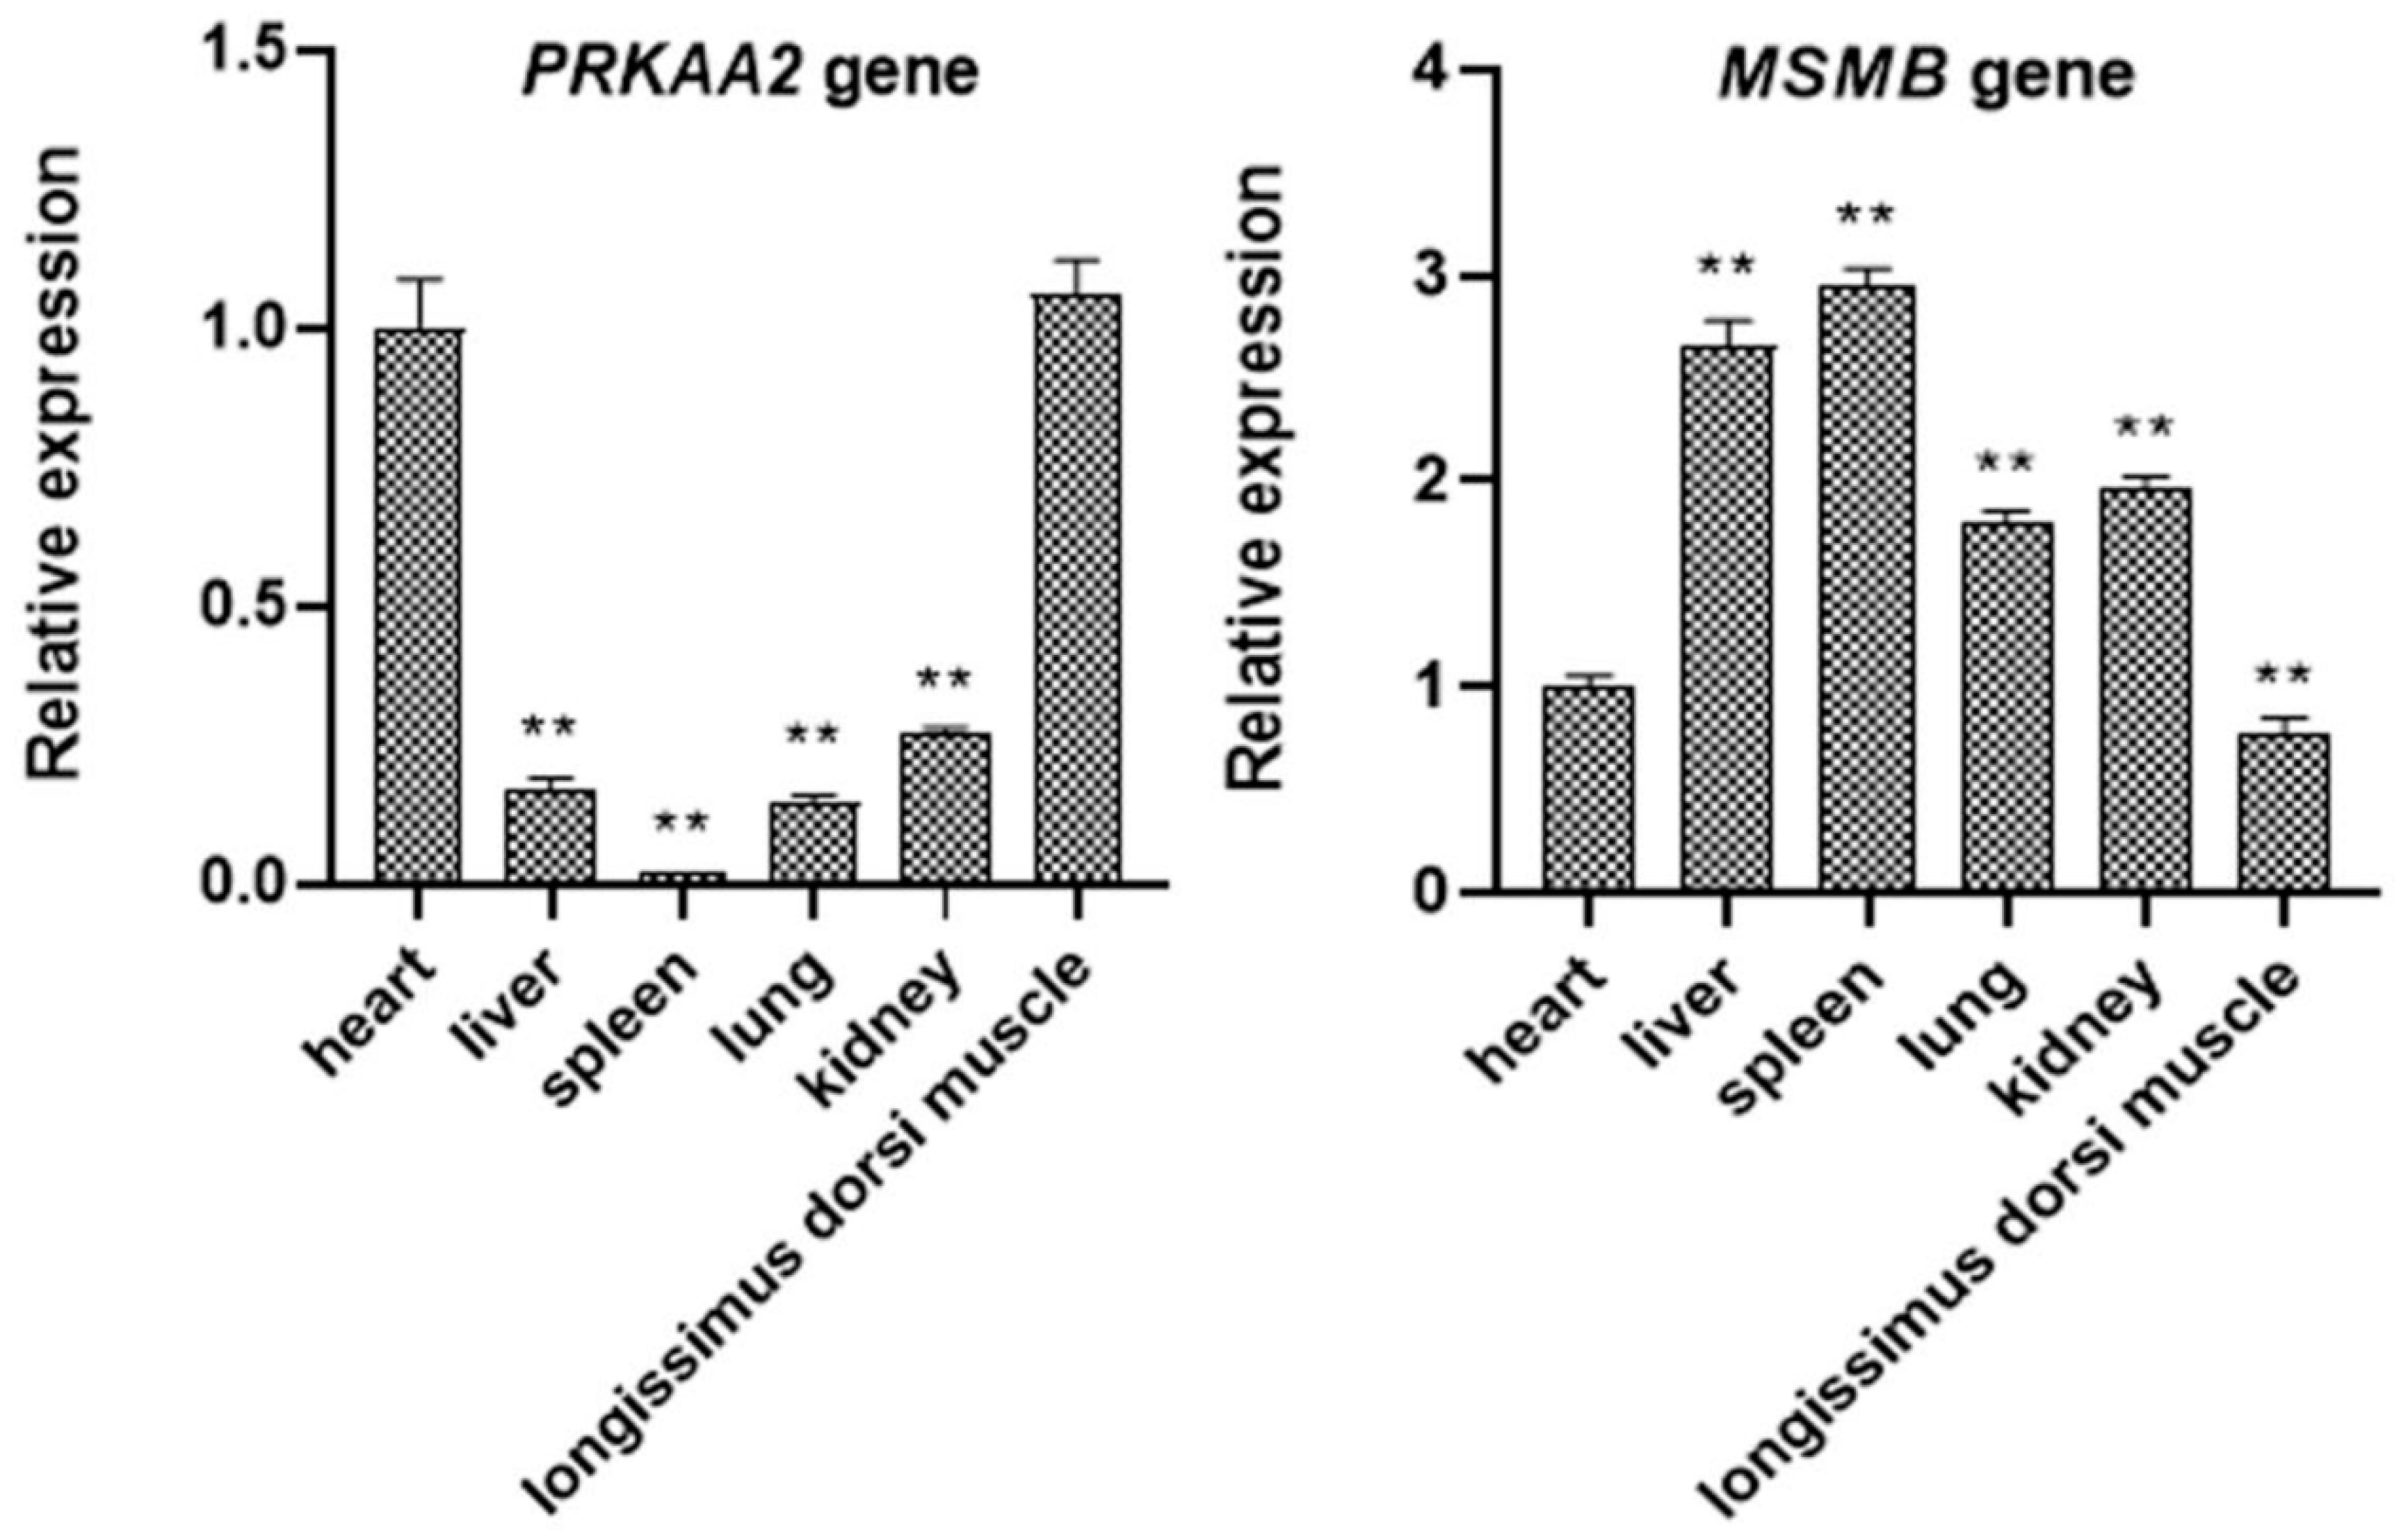
3.5. Expression of PRKAA2 and MSMB in Different Tissues
4. Discussion
5. Conclusions
Author Contributions
Funding
Institutional Review Board Statement
Informed Consent Statement
Data Availability Statement
Conflicts of Interest
References
- Tang, L.T.; Ran, X.Q.; Mao, N.; Zhang, F.P.; Niu, X.; Ruan, Y.Q.; Yi, F.L.; Li, S.; Wang, J.F. Analysis of alternative splicing events by RNA sequencing in the ovaries of Xiang pig at estrous and diestrous. Theriogenology 2018, 119, 60–68. [Google Scholar] [CrossRef] [PubMed]
- Liu, C.; Ran, X.; Wang, J.; Li, S.; Liu, J. Detection of genomic structural variations in Guizhou indigenous pigs and the comparison with other breeds. PLoS ONE 2018, 13, 194282. [Google Scholar] [CrossRef] [PubMed] [Green Version]
- Xie, J.; Li, R.; Li, S.; Ran, X.; Wang, J.; Jiang, J.; Zhao, P. Identification of Copy Number Variations in Xiang and Kele Pigs. PLoS ONE 2016, 11, 148565. [Google Scholar] [CrossRef] [PubMed] [Green Version]
- Bode, G.; Clausing, P.; Gervais, F.; Loegsted, J.; Luft, J.; Nogues, V.; Sims, J. The utility of the minipig as an animal model in regulatory toxicology. J. Pharmacol. Toxicol. Methods 2010, 62, 196–220. [Google Scholar] [CrossRef] [PubMed]
- Luo, Z.Y.; Dai, X.L.; Ran, X.Q.; Cen, Y.X.; Niu, X.; Huang, S.H.; Wang, J.F. Identification and profile of microRNAs in Xiang pig testes in four different ages detected by Solexa sequencing. Theriogenology 2017, 117, 61–71. [Google Scholar] [CrossRef]
- Xiao, L.; Estelle, J.; Kiilerich, P.; Ramayo-Caldas, Y.; Xia, Z.; Feng, Q.; Liang, S.; Pedersen, A.O.; Kjeldsen, N.J.; Liu, C.; et al. A reference gene catalogue of the pig gut microbiome. Nat. Microbiol. 2016, 1, 16161. [Google Scholar] [CrossRef] [Green Version]
- Walters, E.M.; Wolf, E.; Whyte, J.J.; Mao, J.; Renner, S.; Nagashima, H.; Kobayashi, E.; Zhao, J.; Wells, K.D.; Critser, J.K. Completion of the swine genome will simplify the production of swine as a large animal biomedical model. BMC Med. Genom. 2012, 5, 55. [Google Scholar] [CrossRef] [Green Version]
- Xin-Qin, J.; Biao, W.; Zhi-Qiang, D.; Yong, R.; Yan, H.; Meng-Qiu, H.; Shan-Shan, D.; Yu-Jie, T. Expression of IFN-lambda1 from Congjiang pigs and its effect on anti-PRRSV proliferation. Pol. J. Vet. Sci. 2020, 23, 423–430. [Google Scholar]
- Hardie, D.G.; Carling, D. The AMP-activated protein kinase--fuel gauge of the mammalian cell? Eur. J. Biochem. 1997, 246, 259–273. [Google Scholar] [CrossRef]
- Lee, J.H.; Koh, H.; Kim, M.; Kim, Y.; Lee, S.Y.; Karess, R.E.; Lee, S.H.; Shong, M.; Kim, J.M.; Kim, J.; et al. Energy-dependent regulation of cell structure by AMP-activated protein kinase. Nature 2007, 447, 1017–1020. [Google Scholar] [CrossRef]
- Hwang, S.L.; Chang, H.W. Natural vanadium-containing Jeju ground water stimulates glucose uptake through the activation of AMP-activated protein kinase in L6 myotubes. Mol. Cell. Biochem. 2012, 360, 401–409. [Google Scholar] [CrossRef] [PubMed]
- Stapleton, D.; Mitchelhill, K.I.; Gao, G.; Widmer, J.; Michell, B.J.; Teh, T.; House, C.M.; Fernandez, C.S.; Cox, T.; Witters, L.A.; et al. Mammalian AMP-activated protein kinase subfamily. J. Biol. Chem. 1996, 271, 611–614. [Google Scholar] [CrossRef] [PubMed] [Green Version]
- Turnley, A.M.; Stapleton, D.; Mann, R.J.; Witters, L.A.; Kemp, B.E.; Bartlett, P.F. Cellular distribution and developmental expression of AMP-activated protein kinase isoforms in mouse central nervous system. J. Neurochem. 1999, 72, 1707–1716. [Google Scholar] [CrossRef] [PubMed]
- Ramamurthy, S.; Chang, E.; Cao, Y.; Zhu, J.; Ronnett, G.V. AMPK activation regulates neuronal structure in developing hippocampal neurons. Neuroscience 2014, 259, 13–24. [Google Scholar] [CrossRef]
- Horikoshi, M.; Hara, K.; Ohashi, J.; Miyake, K.; Tokunaga, K.; Ito, C.; Kasuga, M.; Nagai, R.; Kadowaki, T. A polymorphism in the AMPKalpha2 subunit gene is associated with insulin resistance and type 2 diabetes in the Japanese population. Diabetes 2006, 55, 919–923. [Google Scholar] [CrossRef] [Green Version]
- Shen, J.Z.; Ge, W.H.; Fang, Y.; Liu, H. A novel polymorphism in protein kinase AMP-activated catalytic subunit alpha 2 (PRKAA2) is associated with type 2 diabetes in the Han Chinese population. J. Diabetes 2017, 9, 606–612. [Google Scholar] [CrossRef]
- Zhou, H.; He, Y.; Li, L.; Wu, C.; Hu, G. Identification novel prognostic signatures for Head and Neck Squamous Cell Carcinoma based on ceRNA network construction and immune infiltration analysis. Int. J. Med. Sci. 2021, 18, 1297–1311. [Google Scholar] [CrossRef]
- Zhang, Q.; Hong, Z.; Zhu, J.; Zeng, C.; Huang, H. miR-4999-5p Predicts Colorectal Cancer Survival Outcome and Reprograms Glucose Metabolism by Targeting PRKAA2. OncoTargets Ther. 2020, 13, 1199–1210. [Google Scholar] [CrossRef] [Green Version]
- Weijiao, Y.; Fuchun, L.; Mengjie, C.; Xiaoqing, Q.; Hao, L.; Yuan, L.; Desheng, Y. Immune infiltration and a ferroptosis-associated gene signature for predicting the prognosis of patients with endometrial cancer. Aging 2021, 13, 16713–16732. [Google Scholar] [CrossRef]
- Mckay, S.D.; White, S.N.; Kata, S.R.; Loan, R.; Womack, J.E. The bovine 5’ AMPK gene family: Mapping and single nucleotide polymorphism detection. Mamm. Genome 2003, 14, 853–858. [Google Scholar]
- Khan, W.A.; Hussain, T.; Babar, M.E.; Nadeem, A.; Saif, R. Polymorphic Status of PRKAA2 Gene in Pakistani Buffaloes. Int. J. Agric. Biol. 2015, 18, 903–905. [Google Scholar]
- Zhang, Q.; Zhao, S.; Chen, H.; Zhang, L.; Zhang, L.; Li, F.; Wang, X. SNP discovery and haplotype analysis in the bovine PRKAA2 gene. Mol. Biol. Rep. 2011, 38, 1551–1556. [Google Scholar] [CrossRef] [PubMed]
- Valtonen-Andre, C.; Lundwall, A. The cotton-top tamarin (Saguinus oedipus) has five beta-microseminoprotein genes, two of which are pseudogenes. DNA Cell Biol. 2008, 27, 45–54. [Google Scholar] [CrossRef] [PubMed]
- Makinen, M.; Valtonen-Andre, C.; Lundwall, A. New world, but not Old World, monkeys carry several genes encoding beta-microseminoprotein. Eur. J. Biochem. 1999, 264, 407–414. [Google Scholar] [CrossRef] [PubMed] [Green Version]
- Lundwall, A.; Larne, O.; Nayudu, P.L.; Ceder, Y.; Valtonen-Andre, C. Rapidly evolving marmoset MSMB genes are differently expressed in the male genital tract. Reprod. Biol. Endocrinol. 2009, 7, 96. [Google Scholar] [CrossRef] [Green Version]
- Darayee, M.; Geramizadeh, B.; Tabei, S.; Rezvani, A.; Soleimanian, S.; Rahimi, A. Suggesting Tissue-Specific MSMB Gene Promoter as a Novel Approach for Prostate Targeted Gene Therapy. Asian Pac. J. Cancer Prev. 2022, 23, 1993–2000. [Google Scholar] [CrossRef]
- Xu, B.; Wang, J.; Tong, N.; Mi, Y.; Min, Z.; Tao, J.; Li, P.; Cheng, G.; Li, J.; Wang, M.; et al. A functional polymorphism in MSMB gene promoter is associated with prostate cancer risk and serum MSMB expression. Prostate 2010, 70, 1146–1152. [Google Scholar] [CrossRef]
- Frankenberg, S.; Fenelon, J.; Dopheide, B.; Shaw, G.; Renfree, M.B. A novel MSMB-related microprotein in the postovulatory egg coats of marsupials. BMC Evol. Biol. 2011, 11, 373. [Google Scholar] [CrossRef] [Green Version]
- Terenina, E.; Fabre, S.; Bonnet, A.; Monniaux, D.; Robert-Granie, C.; Sancristobal, M.; Sarry, J.; Vignoles, F.; Gondret, F.; Monget, P.; et al. Differentially expressed genes and gene networks involved in pig ovarian follicular atresia. Physiol. Genom. 2017, 49, 67–80. [Google Scholar] [CrossRef] [Green Version]
- Zi, X.D.; Lu, J.Y.; Zhou, H.; Ma, L.; Xia, W.; Xiong, X.R.; Lan, D.L.; Wu, X.H. Comparative analysis of ovarian transcriptomes between prolific and non-prolific goat breeds via high-throughput sequencing. Reprod. Domest. Anim. 2018, 53, 344–351. [Google Scholar] [CrossRef]
- Chave, K.J.; Ryan, T.J.; Chmura, S.E.; Galivan, J. Identification of single nucleotide polymorphisms in the human gamma-glutamyl hydrolase gene and characterization of promoter polymorphisms. Gene 2003, 319, 167–175. [Google Scholar] [CrossRef] [PubMed]
- Zhao, C.; Hamilton, T. Introns regulate the rate of unstable mRNA decay. J. Biol. Chem. 2007, 282, 20230–20237. [Google Scholar] [CrossRef] [PubMed] [Green Version]
- Liu, M.; Li, M.; Wang, S.; Xu, Y.; Lan, X.; Li, Z.; Lei, C.; Yang, D.; Jia, Y.; Chen, H. Association analysis of bovine Foxa2 gene single sequence variant and haplotype combinations with growth traits in Chinese cattle. Gene 2014, 536, 385–392. [Google Scholar] [CrossRef] [PubMed]
- Wang, G.; Li, M.; Zhou, J.; An, X.; Bai, F.; Gao, Y.; Yu, J.; Li, H.; Lei, C.; Dang, R. A novel A > G polymorphism in the intron 2 of TBX3 gene is significantly associated with body size in donkeys. Gene 2021, 785, 145602. [Google Scholar] [CrossRef] [PubMed]
- Li, W.; Wang, X.; Zhang, X.; Li, F.; Zhang, D.; Li, X.; Zhang, Y.; Zhao, Y.; Zhao, L.; Xu, D.; et al. Polymorphism of sheep PRKAA2 gene and its association with growth traits. Anim. Biotechnol. 2021, 31, 1–7. [Google Scholar] [CrossRef]
- Fontanesi, L.; Davoli, R.; Nanni, C.L.; Scotti, E.; Russo, V. Study of candidate genes for glycolytic potential of porcine skeletal muscle: Identification and analysis of mutations, linkage and physical mapping and association with meat quality traits in pigs. Cytogenet. Genome Res. 2003, 102, 145–151. [Google Scholar] [CrossRef]
- Chang, B.L.; Cramer, S.D.; Wiklund, F.; Isaacs, S.D.; Stevens, V.L.; Sun, J.; Smith, S.; Pruett, K.; Romero, L.M.; Wiley, K.E.; et al. Fine mapping association study and functional analysis implicate a SNP in MSMB at 10q11 as a causal variant for prostate cancer risk. Hum. Mol. Genet. 2009, 18, 1368–1375. [Google Scholar] [CrossRef]
- Yeager, M.; Deng, Z.; Boland, J.; Matthews, C.; Bacior, J.; Lonsberry, V.; Hutchinson, A.; Burdett, L.A.; Qi, L.; Jacobs, K.B.; et al. Comprehensive resequence analysis of a 97 kb region of chromosome 10q11.2 containing the MSMB gene associated with prostate cancer. Hum. Genet. 2009, 126, 743–750. [Google Scholar] [CrossRef] [Green Version]
- Whitaker, H.C.; Warren, A.Y.; Eeles, R.; Kote-Jarai, Z.; Neal, D.E. The potential value of microseminoprotein-beta as a prostate cancer biomarker and therapeutic target. Prostate 2010, 70, 333–340. [Google Scholar] [CrossRef]


| Primer Name | Primer Sequence (5′-3′) | Amplified Fragment Size (bp) | Annealing Temperature (°C) | Application |
|---|---|---|---|---|
| PRKAA2-1 | F: TTAGACTGACCTTCGAGCAAGGTCG | 973 | 61 | Exon 1 |
| R: TCACAGAGCAGGGCACTGAAGTC | ||||
| PRKAA2-2 | F: ATTTGTTCTTCAATAATGTATGACT | 859 | 61 | Exon 2 |
| R: AAAAATCCTGATATGCTAACTTGAA | ||||
| PRKAA2-3 | F: GCTGGTTGTCTTCATCTTGGTATCA | 581 | 55 | Exon 3 |
| R: ATTACTGCAGAAGCAACCCCAACTT | ||||
| PRKAA2-4 | F: CCAGGGTTTGAATTGGATCTATAGC | 421 | 63 | Exon 4 |
| R: GCAGCTAGTATCCTTCTAAACACCA | ||||
| PRKAA2-5 | F: CAGCATATGGAAGTTCCCAGGCT | 777 | 65 | Exon 5 |
| R: TTTGATCACTGGCCTGAGGCAGT | ||||
| PRKAA2-6 | F: TCAGGTATTGCCGTAGGGCTAGTTA | 812 | 65 | Exon 6 |
| R: GCCTAACATAGATCAGGCATTCAG | ||||
| PRKAA2-7 | F: GCCACATACCCAAGTCTGAATAATC | 823 | 59 | Exon 7 |
| R: GCCAGAAGCATCTAGACCACTAAAT | ||||
| PRKAA2-8 | F: ACAGTACCTGTTACTGTGCCAGGTT | 533 | 63 | Exon 8 |
| R: CTTCTCAGAGTTCATGCCTGCGT | ||||
| PRKAA2-9 | F: TAGTGATGTCTGTTACGATTGAGGG | 667 | 63 | Exon 9 |
| R: CACCTAGTAAAGACACCGCCTATGT | ||||
| PRKAA2 | F: GCCCAGTTACTTATTTCCT | 189 | 60 | Real-time PCR |
| R: TTCATTATTCTCCGATTGTC | ||||
| GAPDH | F: TTGTGATGGGCGTGAACC | 169 | 58 | Reference gene |
| R: GTCTTCTGGGTGGCAGTGAT |
| Primer Name | Primer Sequence (5′-3′) | Amplified Fragment Size (bp) | Annealing Temperature (°C) | Application |
|---|---|---|---|---|
| MSMB-1 | F: GATGCACATGCCTGAAAGGACTC | 668 | 55 | Exon 1 |
| R: GAGTGATGGTTCCCAATTTGCTGA | ||||
| MSMB-2 | F: GTCCAACAGATCCATATCAGCCTA | 858 | 59 | Exon 2 |
| R: CTGTCCCAACCCTTTCTCTCATATA | ||||
| MSMB-3 | F: ATCACCCTAAATGCCCCTGACTCA | 778 | 57 | Exon 3 |
| R: TGAAAGAGGCATAGCTGTCCTTAG | ||||
| MSMB-4 | F: CCTACCTGGAGTGACTGACACATA | 676 | 61 | Exon 4 |
| R: AGTTAGAGGCCTAGGGAATGAGG | ||||
| MSMB | F: AAAGAAGGACCCAGGAAAG | 145 | 60 | Real-time PCR |
| R: CAATCATAGACAGTTAGAGGC | ||||
| GAPDH | F: TTGTGATGGGCGTGAACC | 169 | 58 | Reference gene |
| R: GTCTTCTGGGTGGCAGTGAT |
| SNPs | Genotypic Frequencies | Allelic Frequency | He | Ho | Ne | PIC | χ2 | |||
|---|---|---|---|---|---|---|---|---|---|---|
| g.42101G>T | GG | GT | TT | G | T | 0.498 | 0.502 | 1.991 | 0.374 | 1.833 |
| 0.244 (40) | 0.445 (73) | 0.311 (51) | 0.466 | 0.534 | ||||||
| g.60146A>T | AA | AT | TT | A | T | 0.480 | 0.520 | 1.922 | 0.365 | 2.482 |
| 0.390 (64) | 0.421 (69) | 0.189 (31) | 0.601 | 0.399 | ||||||
| g.61455G>A | GG | GA | AA | G | A | 0.499 | 0.501 | 1.996 | 0.375 | 0.649 |
| 0.213 (35) | 0.530 (87) | 0.256 (42) | 0.479 | 0.521 | ||||||
| SNPs | Genotypic Frequencies | Allelic Frequency | He | Ho | Ne | PIC | χ2 | |||
|---|---|---|---|---|---|---|---|---|---|---|
| g.4374G>T | GG | GT | TT | G | T | 0.485 | 0.515 | 1.943 | 0.368 | 3.488 |
| 0.378 (62) | 0.415 (68) | 0.207 (34) | 0.585 | 0.415 | ||||||
| g.4564T>C | TT | TC | CC | T | C | 0.477 | 0.523 | 1.913 | 0.363 | 0.285 |
| 0.378 (62) | 0.457 (75) | 0.165 (27) | 0.607 | 0.393 | ||||||
| g.6378G>A | GG | GA | AA | G | A | 0.499 | 0.502 | 1.994 | 0.374 | 0.014 |
| 0.226 (37) | 0.494 (81) | 0.280 (46) | 0.473 | 0.527 | ||||||
| g.6386C>T | CC | CT | TT | C | T | 0.499 | 0.502 | 1.994 | 0.374 | 0.014 |
| 0.226 (37) | 0.494 (81) | 0.280 (46) | 0.473 | 0.527 | ||||||
| g.8643G>A | GG | GA | AA | G | A | 0.491 | 0.509 | 1.965 | 0.371 | 0.518 |
| 0.201 (33) | 0.463 (76) | 0.335 (55) | 0.433 | 0.567 | ||||||
| g.8857A>G | AA | AG | GG | A | G | 0.483 | 0.517 | 1.935 | 0.337 | 0.588 |
| 0.152 (25) | 0.512 (84) | 0.335 (55) | 0.409 | 0.591 | ||||||
| SNPs | Genotype | W/kg | B S/cm | B H/cm | C C/cm | A C/cm | T C/cm | C D/cm | C W/cm | L H C/cm |
|---|---|---|---|---|---|---|---|---|---|---|
| g.42101G>T | GG | 89.09 ± 3.99A | 108.80 ± 4.91A | 74.78 ± 4.16 | 109.83 ± 3.66A | 119.20 ± 4.09A | 19.78 ± 1.31A | 39.38 ± 2.65 | 30.03 ± 2.13 | 71.40 ± 2.04 |
| GT | 91.42 ± 4.35B | 110.01 ± 4.59 | 75.21 ± 3.98 | 110.37 ± 3.31a | 119.66 ± 3.75a | 20.21 ± 1.18 | 40.14 ± 2.78 | 30.22 ± 1.95 | 71.51 ± 2.01 | |
| TT | 92.03 ± 4.81B | 111.39 ± 4.42B | 76.12 ± 3.81 | 111.96 ± 3.86bB | 121.35 ± 3.92bB | 20.59 ± 1.20B | 40.51 ± 3.09 | 30.00 ± 1.84 | 71.69 ± 2.04 | |
| g.60146A>T | AA | 91.67 ± 4.42 | 110.42 ± 4.38 | 75.88 ± 3.82 | 111.06 ± 3.46 | 119.86 ± 4.09 | 20.36 ± 1.17 | 40.41 ± 2.64a | 29.94 ± 1.75 | 71.95 ± 1.68 |
| AT | 90.37 ± 4.75 | 110.29 ± 4.83 | 75.33 ± 4.06 | 110.45 ± 4.00 | 120.16 ± 3.86 | 20.16 ± 1.39 | 40.20 ± 3.10 | 30.10 ± 2.16 | 71.30 ± 2.16 | |
| TT | 91.24 ± 4.19 | 109.26 ± 5.05 | 74.48 ± 4.10 | 110.68 ± 3.24 | 120.32 ± 4.04 | 20.06 ± 1.06 | 39.06 ± 2.62b | 30.45 ± 1.89 | 71.19 ± 2.24 | |
| g.61455G>A | GG | 90.86 ± 4.21 | 109.97 ± 4.79 | 76.03 ± 3.78 | 111.09 ± 3.25 | 120.71 ± 3.62 | 20.43 ± 1.04 | 41.00 ± 2.77a | 29.91 ± 2.02 | 71.37 ± 1.94 |
| GA | 90.40 ± 4.65a | 109.84 ± 4.78 | 75.33 ± 4.03 | 110.69 ± 4.00 | 120.02 ± 4.09 | 20.05 ± 1.31 | 39.64 ± 3.01b | 30.11 ± 1.92 | 71.59 ± 2.19 | |
| AA | 92.52 ± 4.32b | 110.93 ± 4.44 | 74.95 ± 4.09 | 110.52 ± 3.24 | 119.64 ± 4.01 | 20.40 ± 1.25 | 40.17 ± 2.47 | 30.24 ± 2.01 | 71.57 ± 1.74 |
| SNPs | Genotype | W/kg | B S/cm | B H/cm | C C/cm | A C/cm | T C/cm | C D/cm | C W/cm | L H C/cm |
|---|---|---|---|---|---|---|---|---|---|---|
| g.4374G>T | GG | 91.41 ± 4.76a | 110.05 ± 5.01 | 74.02 ± 3.94aA | 110.48 ± 3.61 | 120.60 ± 3.95 | 20.05 ± 1.26 | 39.19 ± 2.95aA | 30.34 ± 2.13 | 71.21 ± 2.16 |
| GT | 91.59 ± 4.21a | 110.31 ± 4.31 | 76.29 ± 3.80B | 110.71 ± 3.57 | 119.41 ± 4.15 | 20.35 ± 1.26 | 40.62 ± 2.65B | 29.84 ± 1.84 | 71.72 ± 1.91 | |
| TT | 89.27 ± 4.43b | 110.00 ± 4.96 | 76.06 ± 3.82b | 111.24 ± 3.93 | 120.44 ± 3.49 | 20.26 ± 1.21 | 40.56 ± 2.81b | 30.21 ± 1.84 | 71.76 ± 1.95 | |
| g.4564T>C | TT | 91.41 ± 4.76 | 110.05 ± 5.01 | 74.02 ± 3.94aA | 110.48 ± 3.61 | 120.60 ± 3.95 | 20.05 ± 1.26 | 39.19 ± 2.95aA | 30.34 ± 2.13 | 71.21 ± 2.16 |
| TC | 91.31 ± 4.35 | 110.15 ± 4.32 | 76.29 ± 3.80B | 110.72 ± 3.45 | 119.47 ± 4.05 | 20.39 ± 1.24 | 40.57 ± 2.61B | 29.93 ± 1.80 | 71.76 ± 1.90 | |
| CC | 89.44 ± 4.32 | 110.37 ± 5.12 | 76.00 ± 3.82b | 111.33 ± 4.29 | 120.56 ± 3.62 | 20.15 ± 1.23 | 40.67 ± 2.95b | 30.04 ± 1.97 | 71.67 ± 1.98 | |
| g.6378G>A | GG | 90.48 ± 4.61 | 110.38 ± 4.95 | 75.11 ± 4.38 | 110.65 ± 3.80 | 120.11 ± 3.56 | 20.19 ± 1.27 | 39.19 ± 3.15a | 30.16 ± 2.02 | 71.76 ± 2.50 |
| GA | 91.62 ± 4.32 | 110.01 ± 4.58 | 75.48 ± 3.98 | 110.88 ± 3.62 | 120.28 ± 4.40 | 20.28 ± 1.25 | 40.40 ± 2.84b | 30.04 ± 1.93 | 71.54 ± 1.91 | |
| AA | 90.48 ± 4.81 | 110.20 ± 4.78 | 75.43 ± 3.73 | 110.54 ± 3.65 | 119.67 ± 3.49 | 20.13 ± 1.26 | 40.20 ± 2.55 | 30.17 ± 1.99 | 71.35 ± 1.79 | |
| g.6386C>T | CC | 90.48 ± 4.61 | 110.38 ± 4.95 | 75.11 ± 4.38 | 110.65 ± 3.80 | 120.11 ± 3.56 | 20.19 ± 1.27 | 39.19 ± 3.15a | 30.16 ± 2.02 | 71.76 ± 2.50 |
| CT | 91.62 ± 4.32 | 110.01 ± 4.58 | 75.48 ± 3.98 | 110.88 ± 3.62 | 120.28 ± 4.40 | 20.28 ± 1.25 | 40.40 ± 2.84b | 30.04 ± 1.93 | 71.54 ± 1.91 | |
| TT | 90.48 ± 4.81 | 110.20 ± 4.78 | 75.43 ± 3.73 | 110.54 ± 3.65 | 119.67 ± 3.49 | 20.13 ± 1.26 | 40.20 ± 2.55 | 30.17 ± 1.99 | 71.35 ± 1.79 | |
| g.8643G>A | GG | 90.22 ± 4.08 | 109.76 ± 4.66 | 74.97 ± 3.80 | 111.03 ± 4.07 | 121.18 ± 4.19a | 20.00 ± 1.27 | 40.39 ± 2.89 | 30.12 ± 2.07 | 71.48 ± 2.35 |
| GA | 90.75 ± 4.77 | 109.87 ± 4.32 | 74.84 ± 4.14a | 110.20 ± 3.64 | 119.33 ± 4.22b | 20.29 ± 1.27 | 39.89 ± 3.04 | 30.22 ± 2.00 | 71.63 ± 2.05 | |
| AA | 91.94 ± 4.40 | 110.76 ± 5.21 | 76.38 ± 3.73b | 111.29 ± 3.34 | 120.44 ± 3.26 | 20.25 ± 1.21 | 40.11 ± 2.61 | 29.93 ± 1.84 | 71.44 ± 1.79 | |
| g.8857A>G | AA | 90.58 ± 4.21 | 109.68 ± 4.63 | 75.28 ± 3.74 | 111.36 ± 4.20 | 121.52 ± 4.23a | 20.08 ± 1.22 | 40.84 ± 2.88 | 30.16 ± 1.84 | 72.04 ± 1.90 |
| AG | 90.59 ± 4.68 | 109.88 ± 4.36 | 74.76 ± 4.12a | 110.18 ± 3.63 | 119.40 ± 4.19b | 20.24 ± 1.30 | 39.81 ± 3.00 | 30.20 ± 2.10 | 71.45 ± 2.19 | |
| GG | 91.94 ± 4.40 | 110.76 ± 5.21 | 76.38 ± 3.73b | 111.29 ± 3.34 | 120.44 ± 3.26 | 20.25 ± 1.21 | 40.11 ± 2.61 | 29.93 ± 1.84 | 71.44 ± 1.79 |
Disclaimer/Publisher’s Note: The statements, opinions and data contained in all publications are solely those of the individual author(s) and contributor(s) and not of MDPI and/or the editor(s). MDPI and/or the editor(s) disclaim responsibility for any injury to people or property resulting from any ideas, methods, instructions or products referred to in the content. |
© 2022 by the authors. Licensee MDPI, Basel, Switzerland. This article is an open access article distributed under the terms and conditions of the Creative Commons Attribution (CC BY) license (https://creativecommons.org/licenses/by/4.0/).
Share and Cite
Xu, J.; Ruan, Y.; Sun, J.; Shi, P.; Huang, J.; Dai, L.; Xiao, M.; Xu, H. Association Analysis of PRKAA2 and MSMB Polymorphisms and Growth Traits of Xiangsu Hybrid Pigs. Genes 2023, 14, 113. https://doi.org/10.3390/genes14010113
Xu J, Ruan Y, Sun J, Shi P, Huang J, Dai L, Xiao M, Xu H. Association Analysis of PRKAA2 and MSMB Polymorphisms and Growth Traits of Xiangsu Hybrid Pigs. Genes. 2023; 14(1):113. https://doi.org/10.3390/genes14010113
Chicago/Turabian StyleXu, Jiali, Yong Ruan, Jinkui Sun, Pengfei Shi, Jiajin Huang, Lingang Dai, Meimei Xiao, and Houqiang Xu. 2023. "Association Analysis of PRKAA2 and MSMB Polymorphisms and Growth Traits of Xiangsu Hybrid Pigs" Genes 14, no. 1: 113. https://doi.org/10.3390/genes14010113