
Analysis of Protein Sequence Identity, Binding Sites, and 3D Structures Identifies Eight Pollen Species and Ten Fruit Species with High Risk of Cross-Reactive Allergies

 and
and
Abstract
:1. Introduction
2. Materials and Methods
2.1. Database Search and Sequence Retrieval
2.2. Conserved Domain and Gene Family Analysis
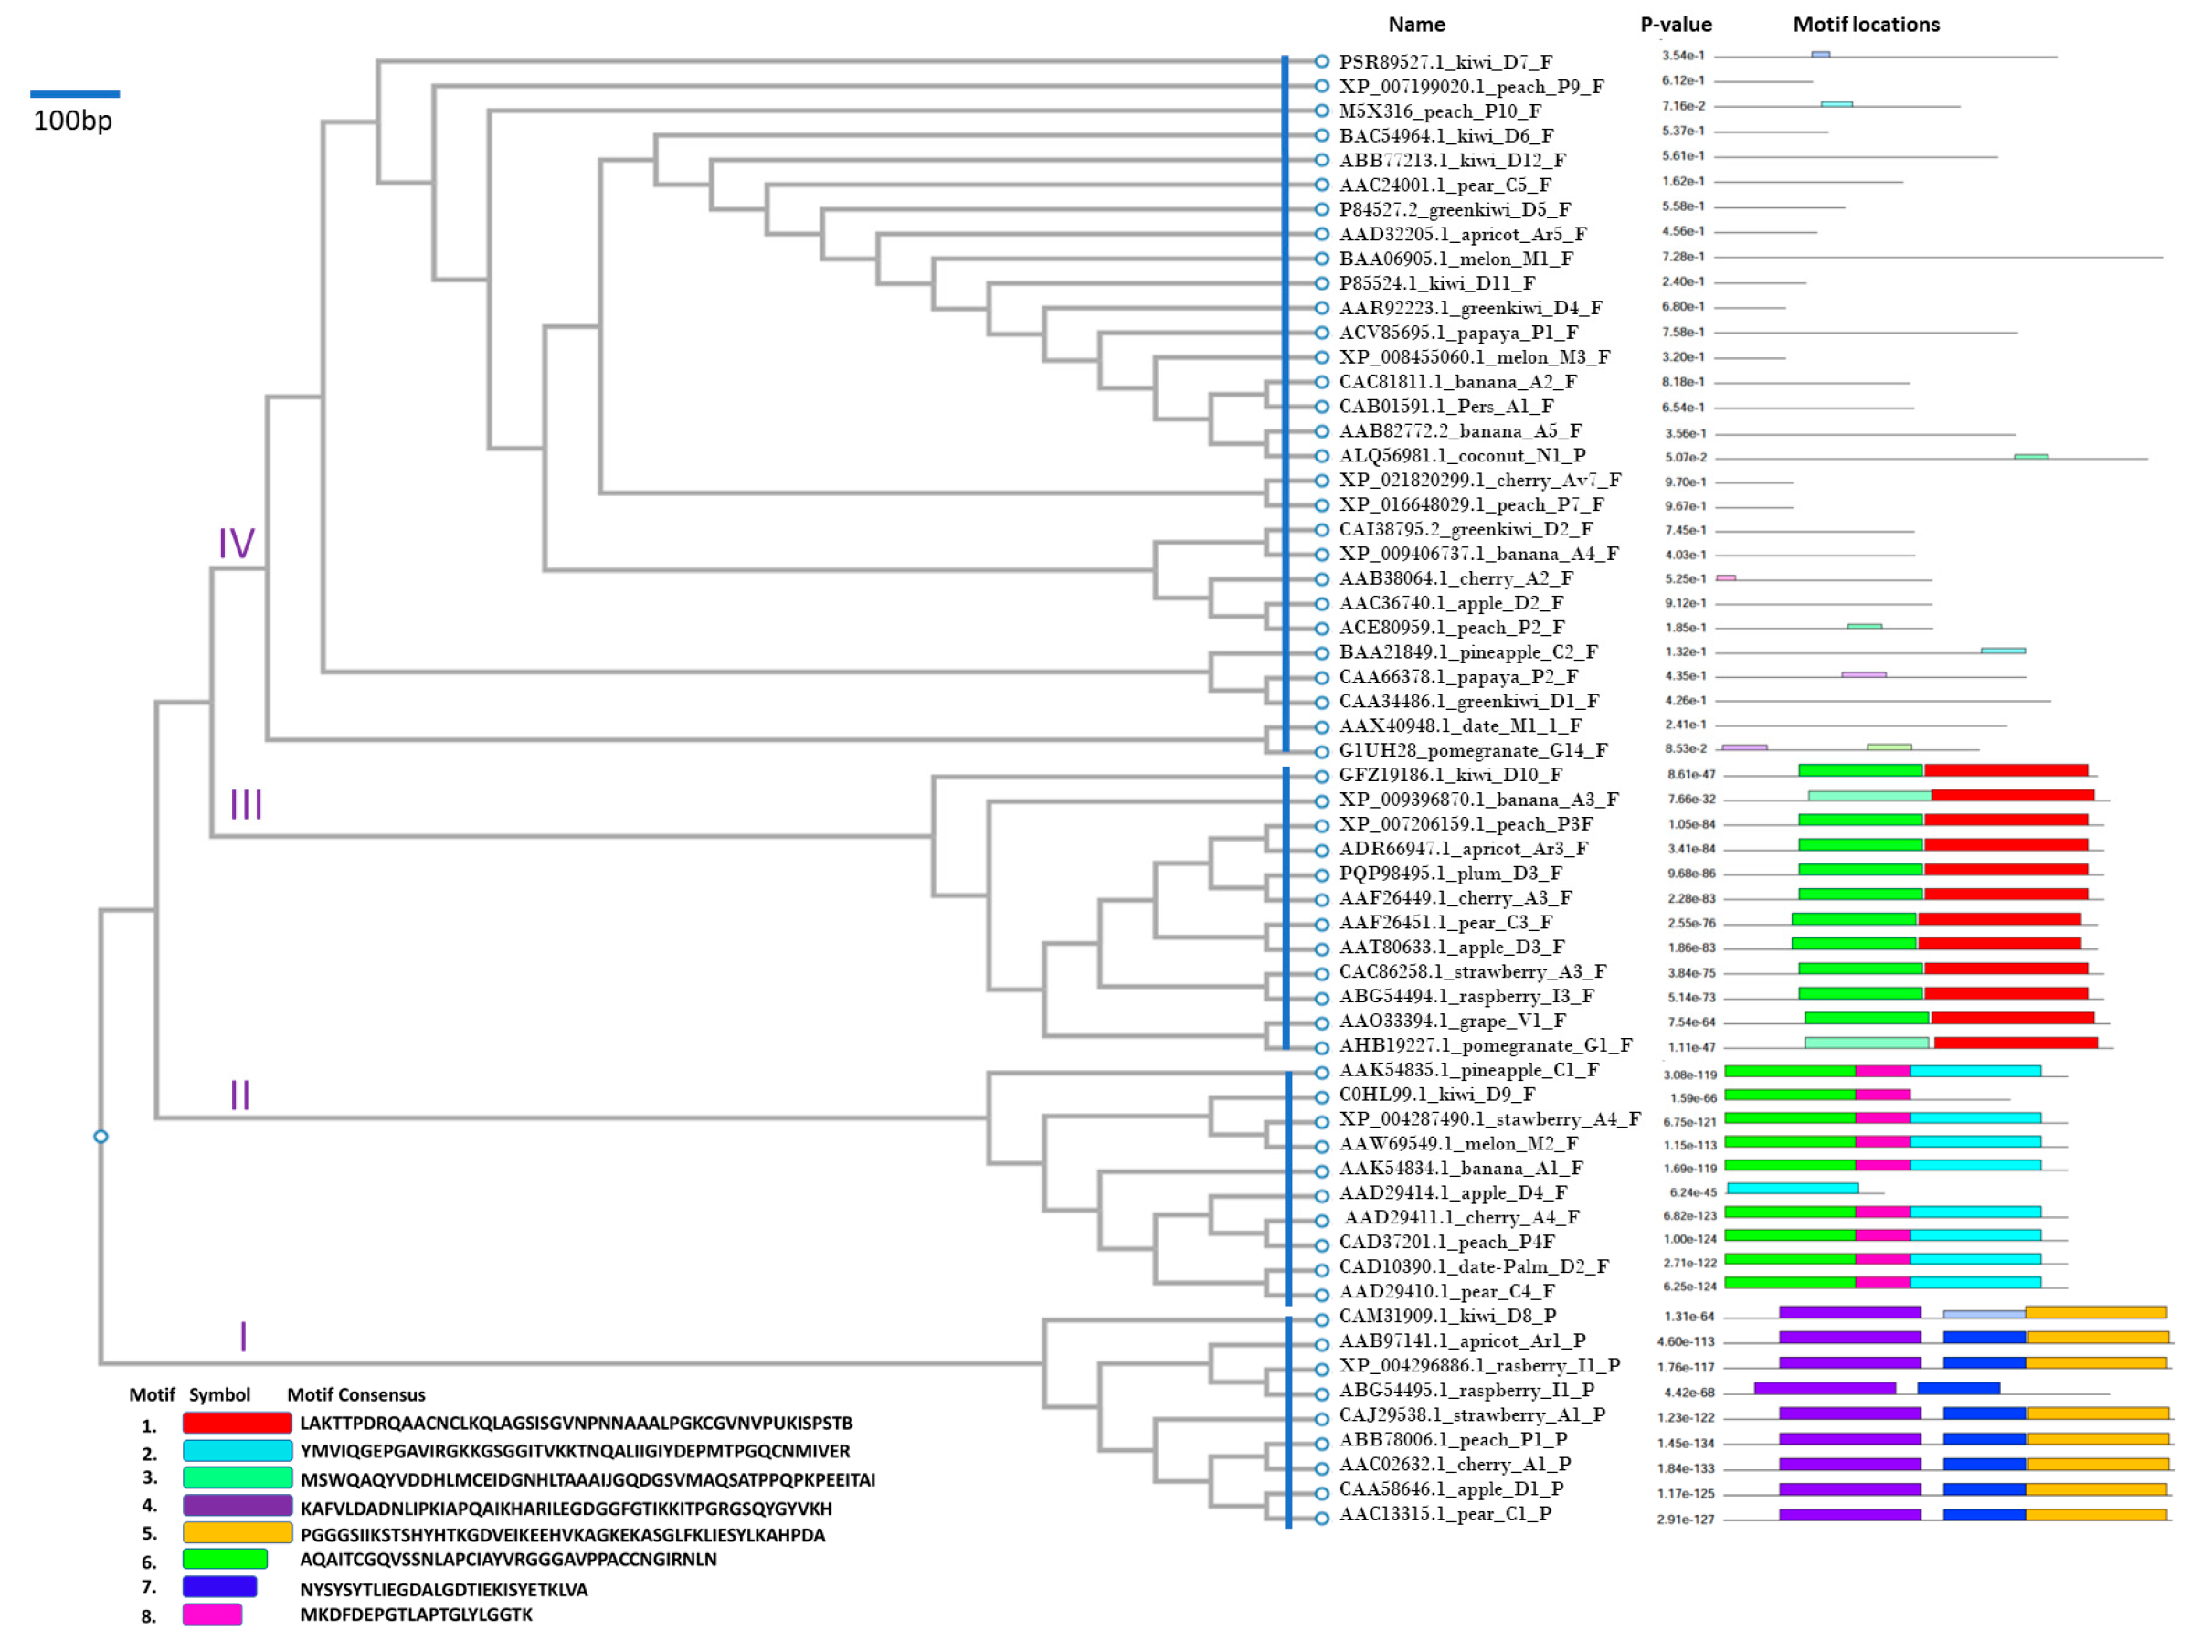
2.3. Construction of the Phylogenetic Tree
2.4. Identification and Annotation of Conserved Motifs
2.5. Protein Structure Prediction
2.6. Transmembrane and Signal Peptide Analysis
2.7. Signal Peptide Analysis and Transmembrane Topology Prediction
2.8. A-RISC Index Analysis
3. Results
3.1. Phylogenetic Clustering and Conserved Motifs
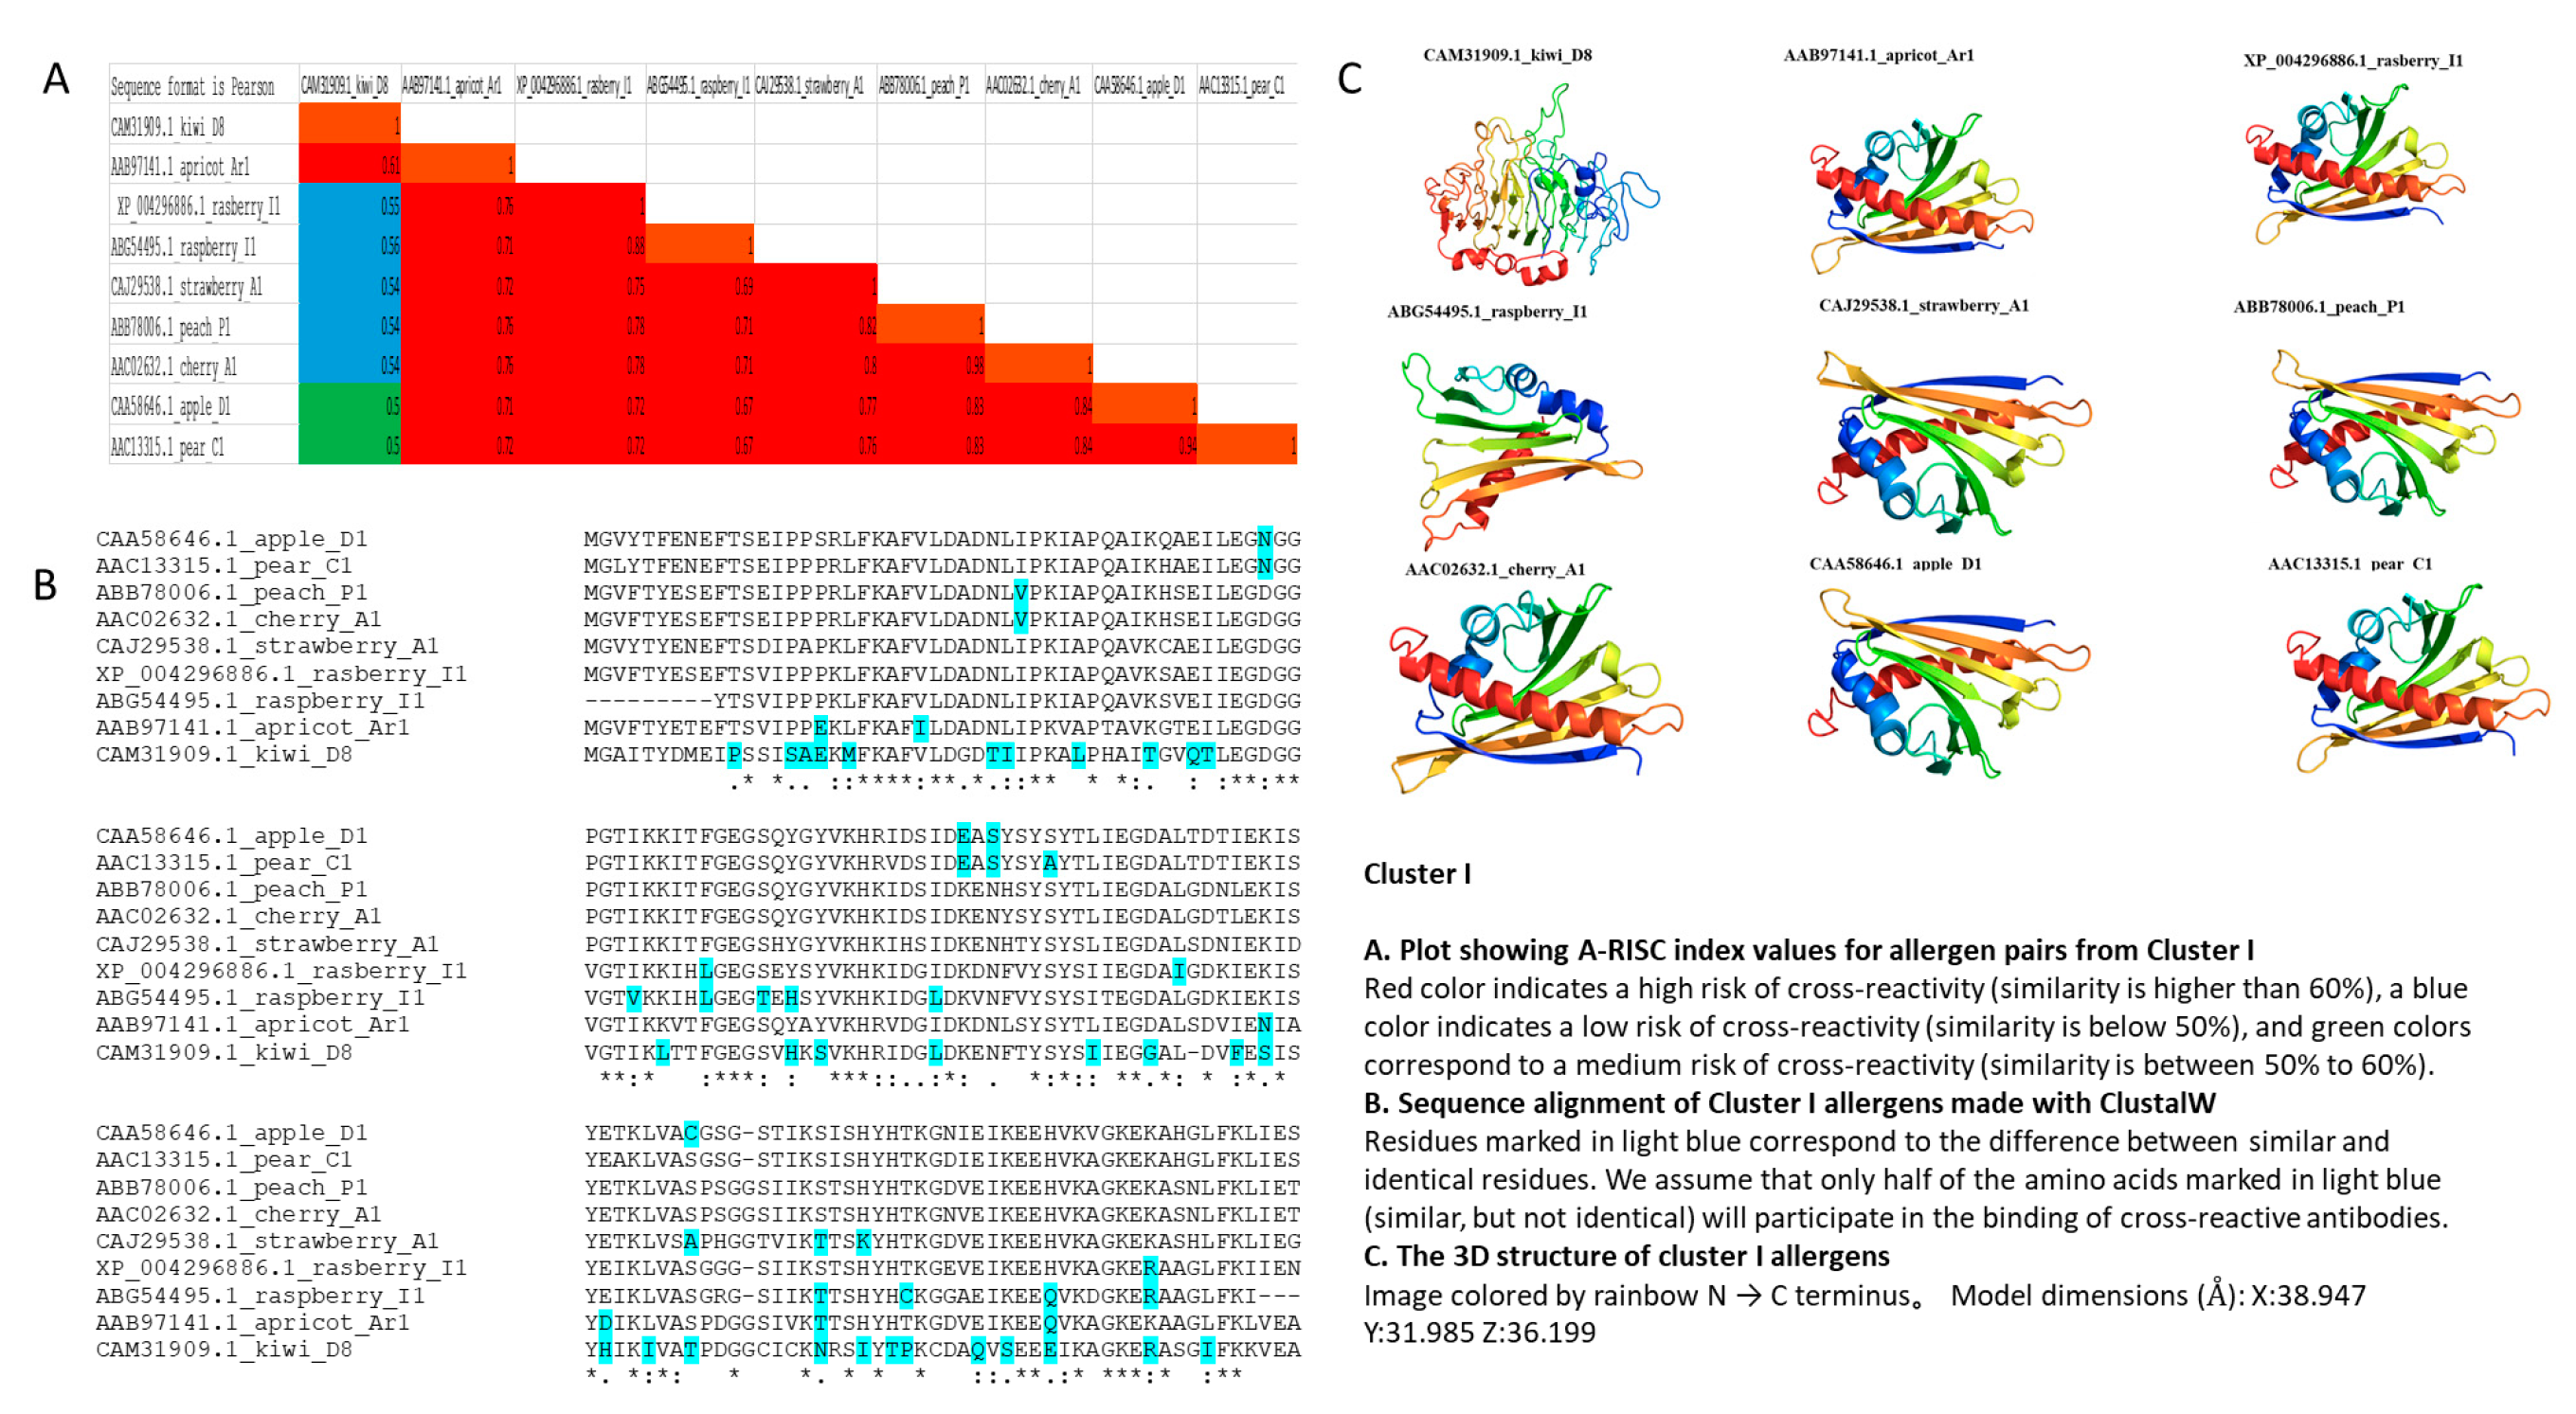
3.2. Cluster I
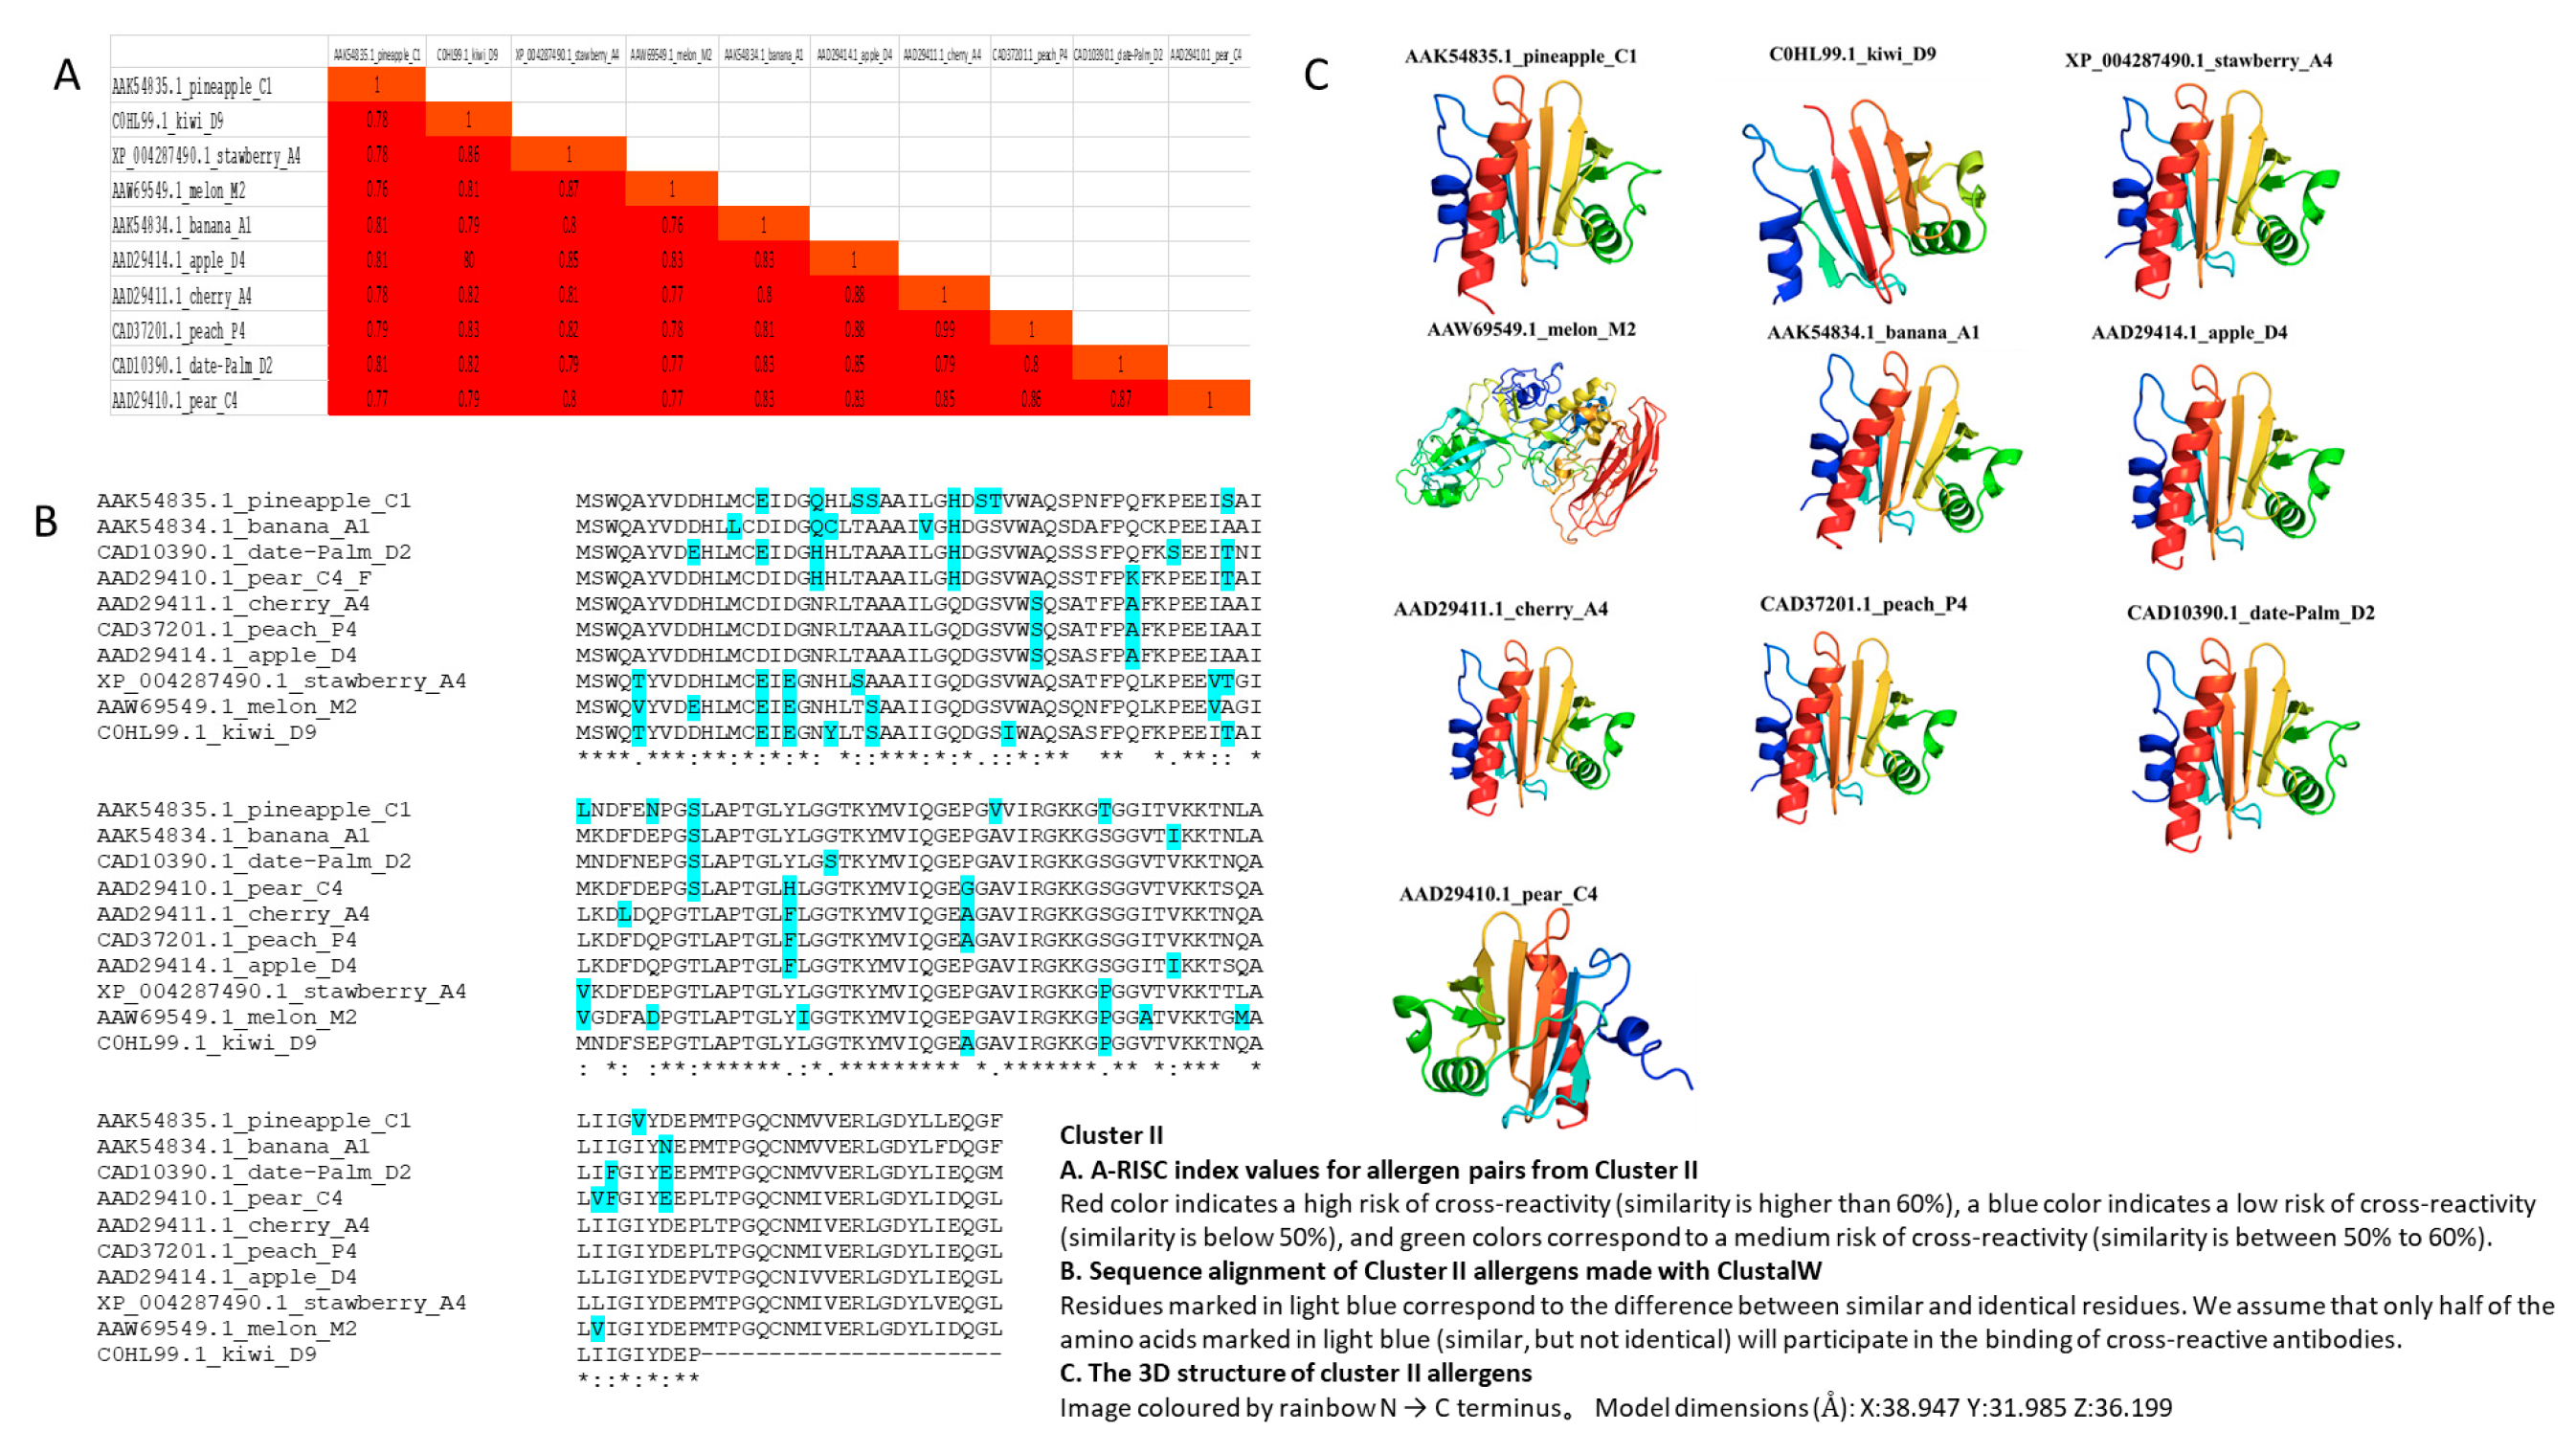
3.3. Cluster II
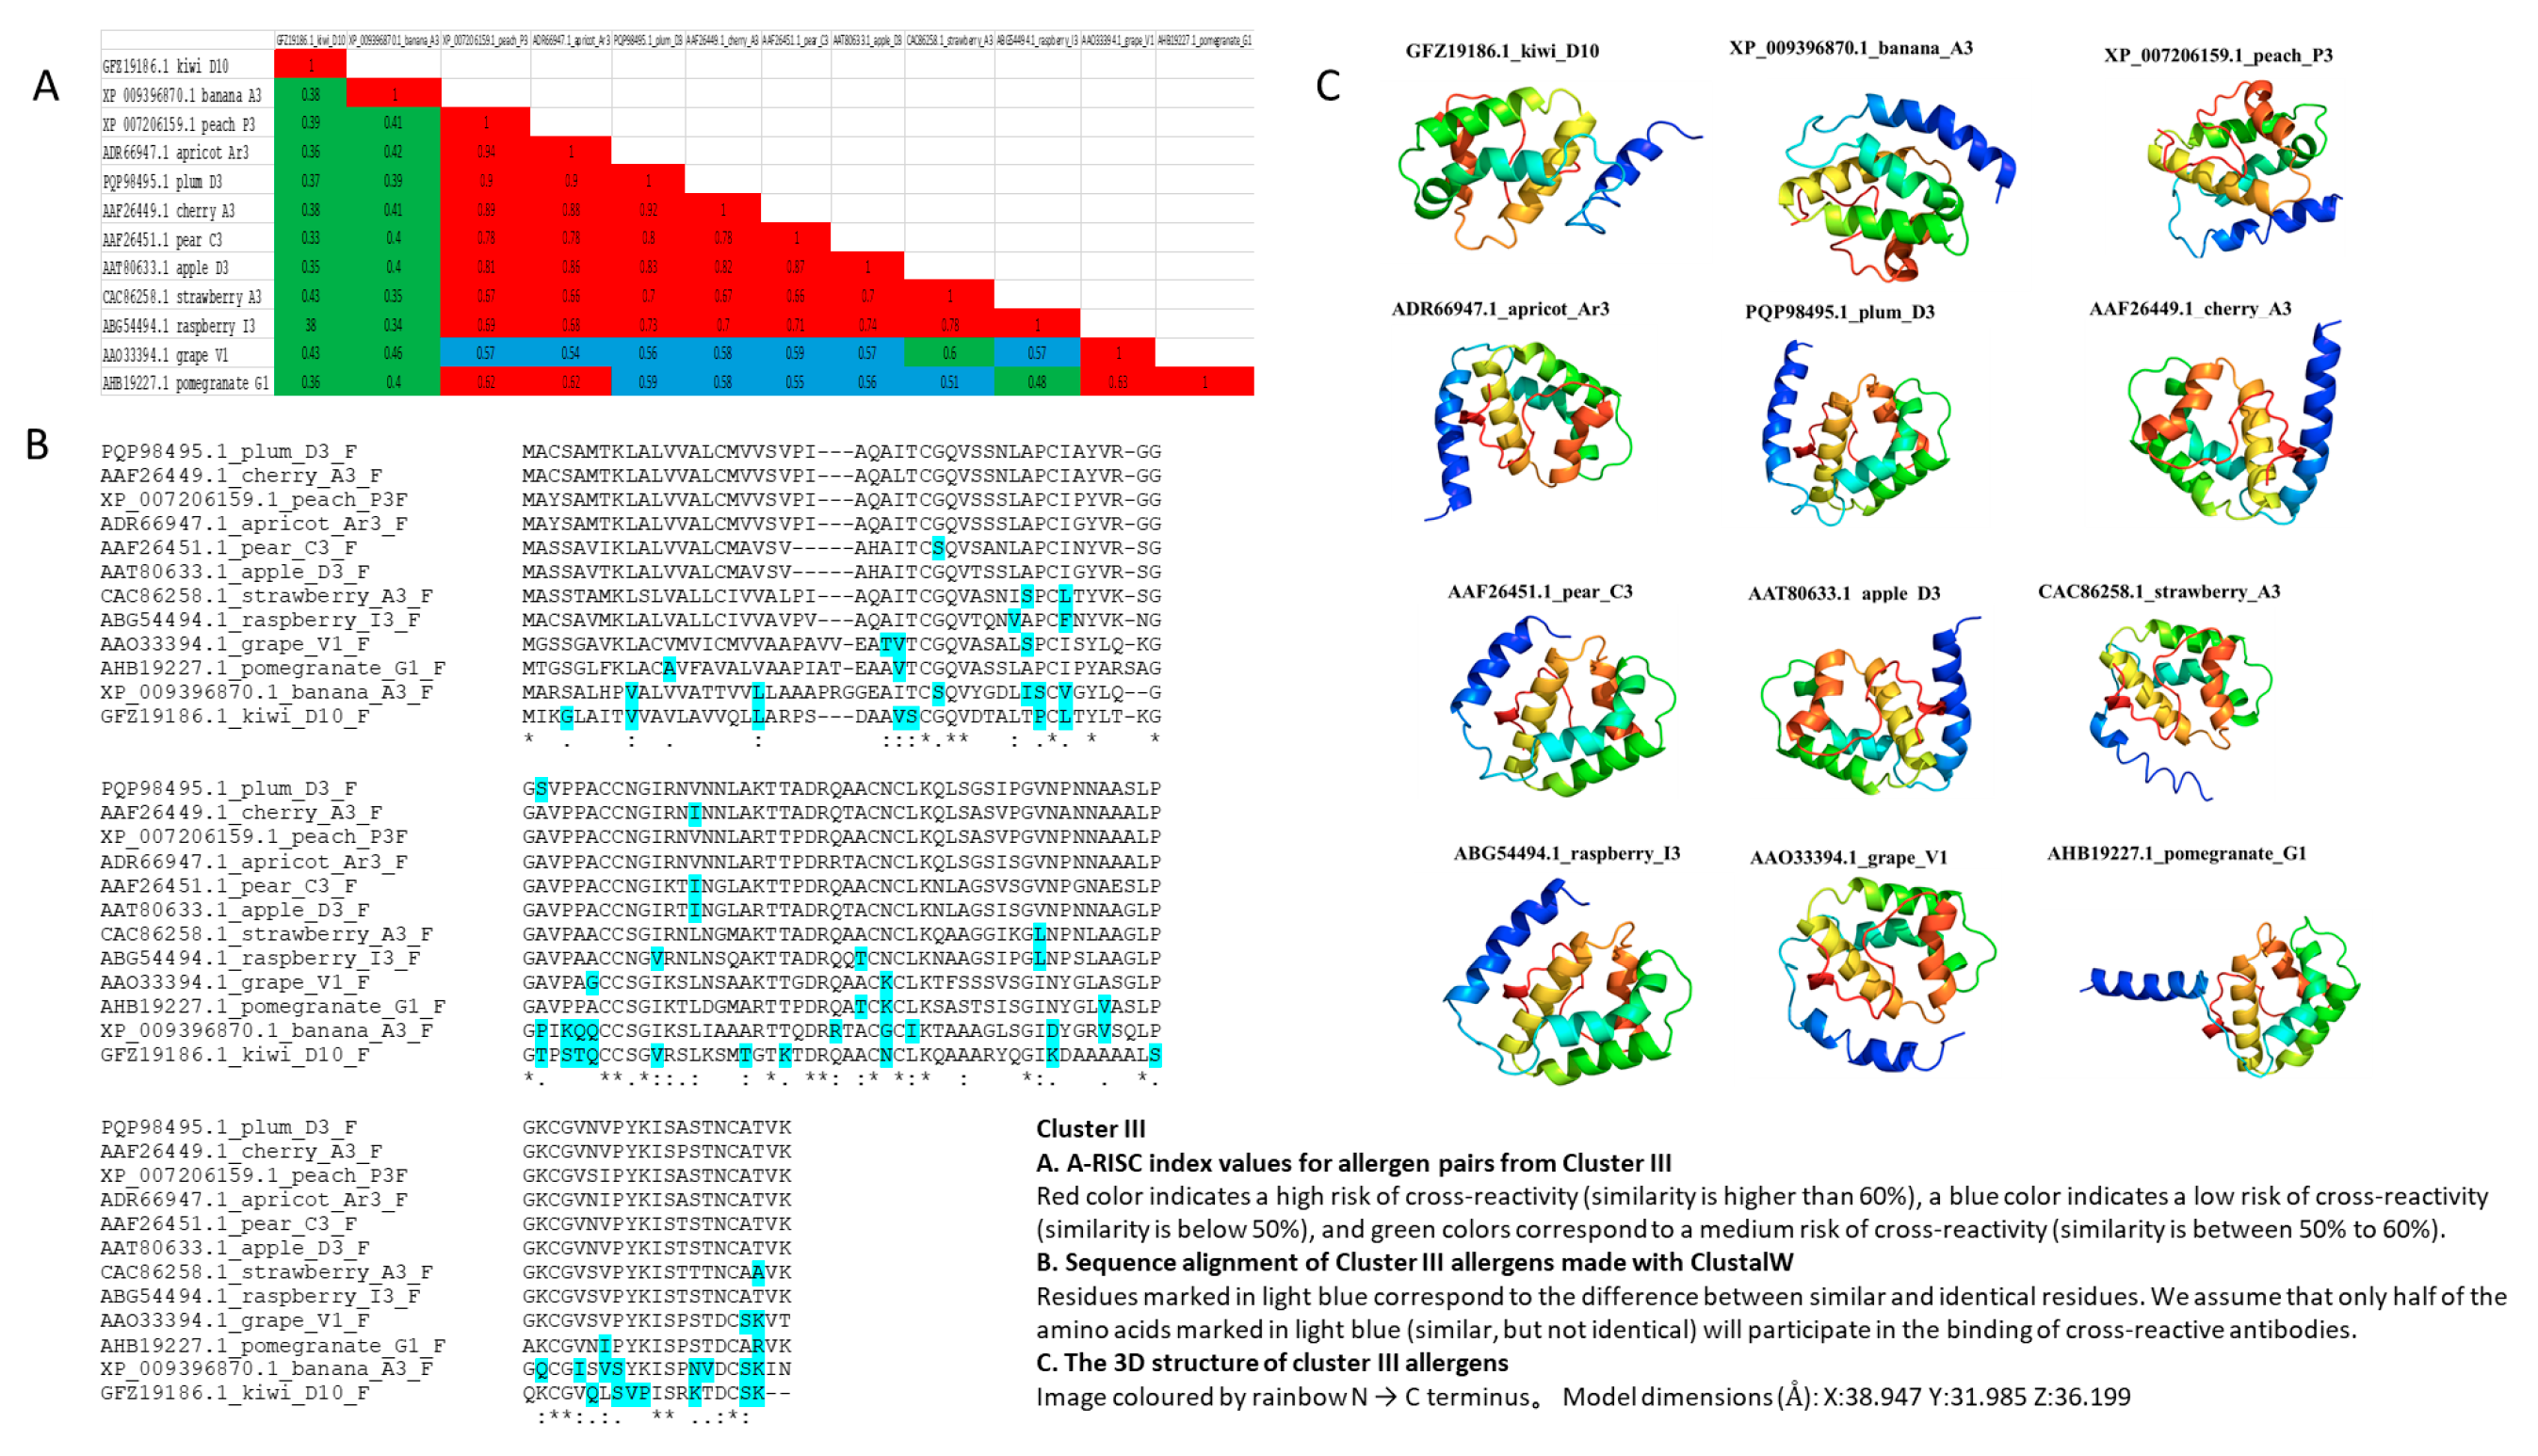
3.4. Cluster III
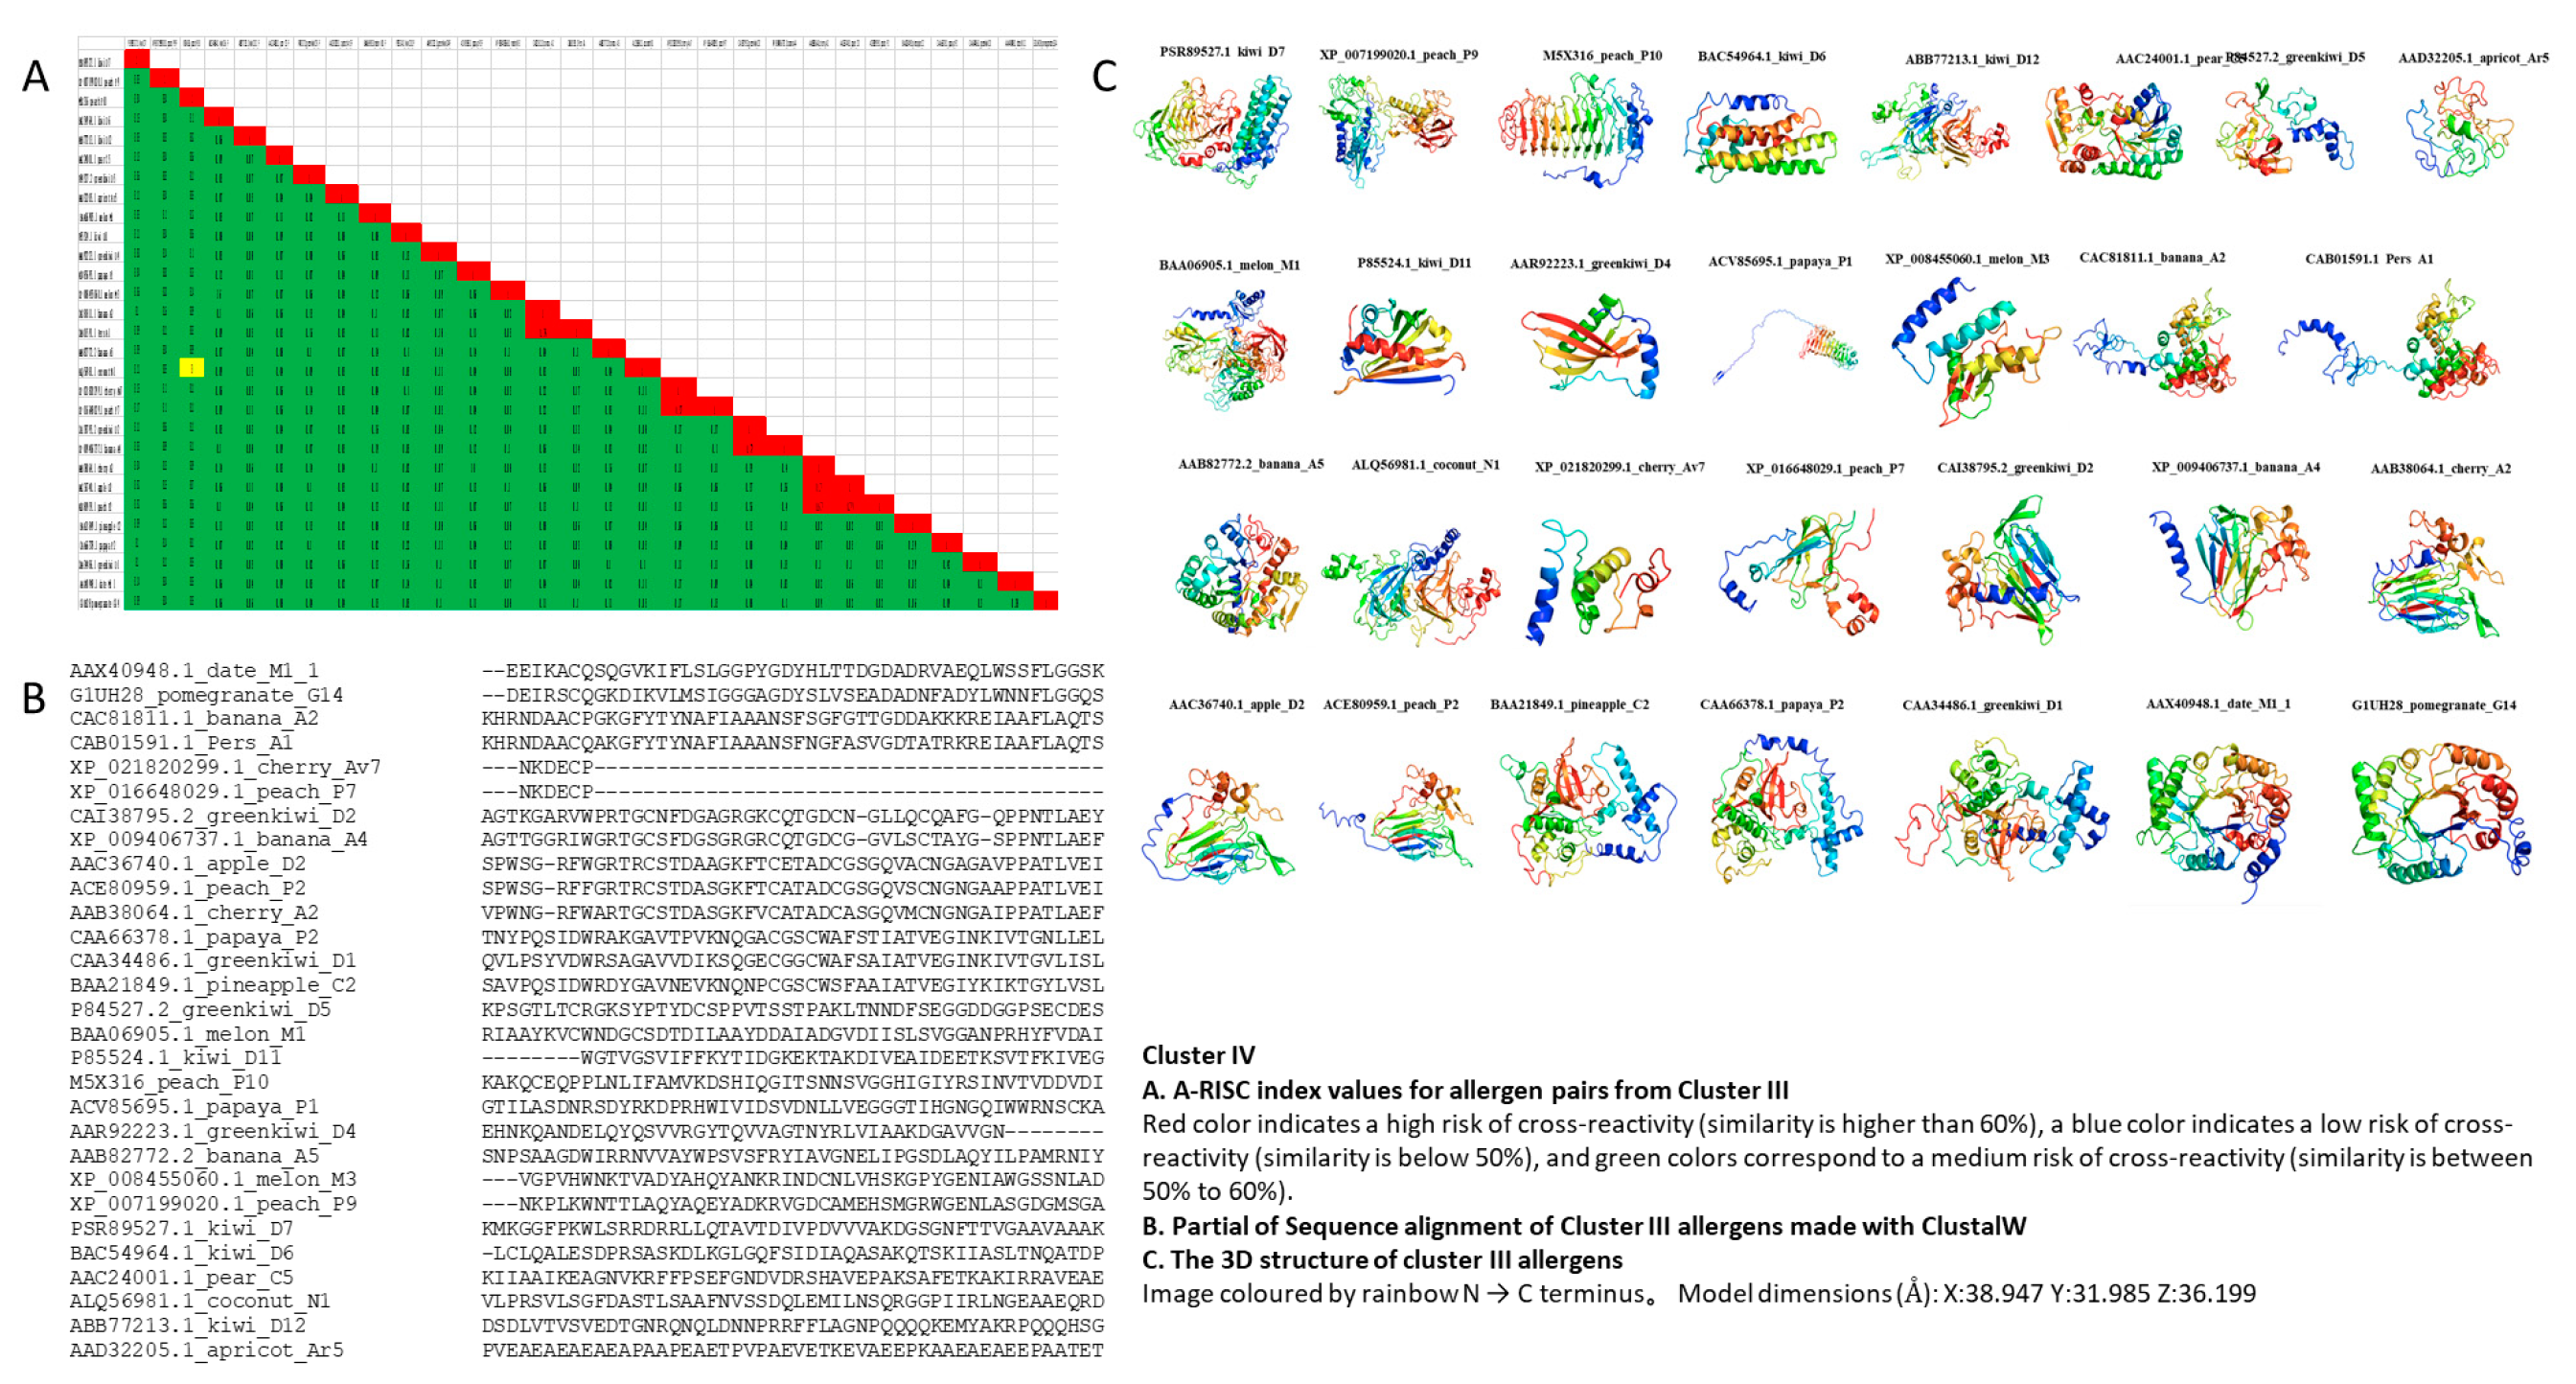
3.5. Cluster IV
3.6. Transmembrane Topology and Signal Peptide Prediction
4. Discussion
4.1. Consumer Choices, Diagnostics, and Treatment
4.2. Implications for Drug Design
4.3. Implications for Genetic Engineering
5. Conclusions
Supplementary Materials
Author Contributions
Funding
Institutional Review Board Statement
Informed Consent Statement
Data Availability Statement
Acknowledgments
Conflicts of Interest
References
- Sampson, H.A.; Ho, D.G. Clinical aspects of allergic disease: Relationship between food-specific IgE concentration and the risk of positive food challenges. J. Allergy Clin. Immunol. 1997, 100, 444–451. [Google Scholar] [CrossRef]
- Dutau, G.; Rittie, J.L.; Rance, F.; Juchet, A.; Bremont, F. New food allergies. Presse Med. 1999, 28, 1553–1559. [Google Scholar] [PubMed]
- Hassan, A.K.; Venkatesh, Y.P. An overview of fruit allergy and the causative allergens. Eur. Ann. Allergy Clin. Immunol. 2015, 47, 180–187. [Google Scholar] [PubMed]
- Mastrorilli, C.; Cardinale, F.; Giannetti, A.; Caffarelli, C. Pollen-food allergy syndrome: A not so rare disease in childhood. Medicina 2019, 55, 641. [Google Scholar] [CrossRef]
- Muluk, N.B.; Cingi, C. Oral allergy syndrome. Am. J. Rhinol. Allergy 2018, 32, 27–30. [Google Scholar] [CrossRef]
- Urwyler, S. Allosteric modulation of family C G-protein-coupled receptors: From molecular insights to therapeutic perspectives. Pharmacol. Rev. 2011, 63, 59–126. [Google Scholar] [CrossRef]
- Bridges, T.M.; Lindsley, C.W. G-protein-coupled receptors: From classical modes of modulation to allosteric mechanisms. ACS Chem. Biol. 2008, 3, 530–541. [Google Scholar] [CrossRef]
- Baudino, A.T. Targeted cancer therapy: The next generation of cancer treatment. Curr. Drug Discov. Technol. 2015, 12, 3–20. [Google Scholar] [CrossRef]
- Reynolds, S.M.; Käll, L.; Riffle, M.E.; Bilmes, J.A.; Noble, W.S. Transmembrane topology and signal peptide prediction using dynamic bayesian networks. PLoS Comput. Biol. 2008, 4, e1000213. [Google Scholar] [CrossRef]
- Wu, L.C.; Zarrin, A.A. The production and regulation of IgE by the immune system. Nat. Rev. Immunol. 2014, 14, 247–259. [Google Scholar] [CrossRef]
- Hjelm, F.; Carlsson, F.; Getahun, A.; Heyman, B. Antibody—mediated regulation of the immune response. Scand. J. Immunol. 2006, 64, 177–184. [Google Scholar] [CrossRef] [PubMed]
- Potaczek, D.P.; Kabesch, M. Current concepts of IgE regulation and impact of genetic determinants. Clin. Exp. Allergy 2012, 42, 852–871. [Google Scholar] [CrossRef] [PubMed]
- Goding, J.W. Monoclonal Antibodies: Principles and Practice; Elsevier: Amsterdam, The Netherlands, 1996. [Google Scholar]
- Shire, S. Monoclonal Antibodies: Meeting the Challenges in Manufacturing, Formulation, Delivery and Stability of Final Drug Product; Woodhead Publishing: Cambridge, UK, 2015. [Google Scholar]
- Rascio, F.; Pontrelli, P.; Netti, G.S.; Manno, E.; Infante, B.; Simone, S.; Castellano, G.; Ranieri, E.; Seveso, M.; Cozzi, E.; et al. IgE-mediated immune response and antibody-mediated rejection. Clin. J. Am. Soc. Nephrol. 2020, 15, 1474–1483. [Google Scholar] [CrossRef] [PubMed]
- Bucher, X.; Pichler, W.J.; Dahinden, C.A.; Helbling, A. Effect of tree pollen specific, subcutaneous immunotherapy on the oral allergy syndrome to apple and hazelnut. Allergy 2004, 59, 1272–1276. [Google Scholar] [CrossRef]
- Hoflehner, E.; Hufnagl, K.; Schabussova, I.; Jasinska, J.; Hoffmann-Sommergruber, K.; Bohle, B.; Maizels, R.M.; Wiedermann, U. Prevention of birch pollen-related food allergy by mucosal treatment with multi-allergen-chimers in mice. PLoS ONE 2012, 7, e39409. [Google Scholar] [CrossRef]
- Buchanan, B.B. Genetic engineering and the allergy issue. Plant Physiol. 2001, 126, 5–7. [Google Scholar] [CrossRef]
- Marchler-Bauer, A.; Lu, S.; Anderson, J.B.; Chitsaz, F.; Derbyshire, M.K.; DeWeese-Scott, C.; Fong, J.H.; Geer, L.; Geer, R.C.; Gonzales, N.R.; et al. CDD: A Conserved Domain Database for the Functional Annotation of Proteins. Nucleic Acids Res. 2011, 39, D225–D229. [Google Scholar] [CrossRef]
- Finn, R.D.; Mistry, J.; Tate, J.; Coggill, P.; Heger, A.; Pollington, J.E.; Gavin, O.L.; Gunasekaran, P.; Ceric, G.; Forslund, S.K.; et al. The Pfam Protein Families Database. Nucleic Acids Res. 2010, 38, D211–D222. [Google Scholar] [CrossRef]
- Huerta-Cepas, J.; Serra, F.; Bork, P. ETE 3, reconstruction, analysis, and visualization of phylogenomic data. Mol. Biol. Evol. 2016, 33, 1635–1638. [Google Scholar] [CrossRef]
- Price, M.N.; Dehal, P.S.; Arkin, A.P. FastTree: Computing large minimum evolution trees with profiles instead of a distance matrix. Mol. Biol. Evol. 2009, 26, 1641–1650. [Google Scholar] [CrossRef]
- Jones, D.T.; Taylor, W.R.; Thornton, J.M. The rapid generation of mutation data matrices from protein sequences. Comput. Appl. Biosci. CABIOS 1992, 8, 275–282. [Google Scholar] [CrossRef] [PubMed]
- Whelan, S.; Goldman, N. A general empirical model of protein evolution derived from multiple protein families using a maximum-likelihood approach. Mol. Biol. Evol. 2001, 18, 691–699. [Google Scholar] [CrossRef] [PubMed]
- Le, S.Q.; Gascuel, O. An improved general amino acid replacement matrix. Mol. Biol. Evol. 2008, 25, 1307–1320. [Google Scholar] [CrossRef] [PubMed]
- Bailey, T.L.; Elkan, C. Fitting a mixture model by expectation maximization to discover motifs in biopolymers. In Proceedings of the Second International Conference on Intelligent Systems for Molecular Biology, Stanford, CA, USA, 14–17 August 1994; AAAI Press: Menlo Park, CA, USA, 1994; pp. 28–36. [Google Scholar]
- Grundy, W.N.; Bailey, T.L.; Elkan, C.P.; Baker, M.E. Meta-MEME: Motif-based hidden Markov models of protein families. Bioinformatics 1997, 13, 397–406. [Google Scholar] [CrossRef]
- Kelley, L.A.; Mezulis, S.; Yates, C.M.; Wass, M.N.; Sternberg, M.J. The Phyre2 web portal for protein modeling, prediction and analysis. Nature Protocols. 2015, 10, 845–858. [Google Scholar] [CrossRef]
- Chruszcz, M.; Kapingidza, A.B.; Dolamore, C.; Kowal, K. A robust method for the estimation and visualization of IgE cross-reactivity likelihood between allergens belonging to the same protein family. PLoS ONE 2018, 13, e0208276. [Google Scholar] [CrossRef]
- Abrams, E.M.; Sicherer, S.H. Diagnosis and management of food allergy. CMAJ 2016, 188, 1087–1093. [Google Scholar] [CrossRef]
- Nagel, Y.A.; Britschgi, A.; Ricci, A. From Degraders to Molecular Glues: New Ways of Breaking Down Disease—Associated Proteins. Success. Drug Discov. 2021, 22, 47–85. [Google Scholar]
- Sakamoto, K.M. Targeting Proteins for Ubiquitination and Degradation in the Treatment of Human Disease; California Institute of Technology: Pasadena, CA, USA, 2004. [Google Scholar]
- Lumangtad, L.A.; Bell, T.W. The signal peptide as a new target for drug design. Bioorganic Med. Chem. Lett. 2020, 30, 127115. [Google Scholar] [CrossRef]
- Pauwels, E.; Schülein, R.; Vermeire, K. Inhibitors of the Sec61 Complex and Novel High Throughput Screening Strategies to Target the Protein Translocation Pathway. Int. J. Mol. Sci. 2021, 22, 12007. [Google Scholar] [CrossRef]
- Gilson, P.R.; Chisholm, S.A.; Crabb, B.S.; de Koning-Ward, T.F. Host cell remodelling in malaria parasites: A new pool of potential drug targets. Int. J. Parasitol. 2017, 47, 119–127. [Google Scholar] [CrossRef] [PubMed]
- Vermeire, K.; Bell, T.W.; Van Puyenbroeck, V.; Giraut, A.; Noppen, S.; Liekens, S.; Schols, D.; Hartmann, E.; Kalies, K.U.; Marsh, M. Signal peptide-binding drug as a selective inhibitor of co-translational protein translocation. PLoS Biol. 2014, 12, e1002011. [Google Scholar] [CrossRef] [PubMed]
- Schwake, C.; Hyon, M.; Chishti, A.H. Signal peptide peptidase: A potential therapeutic target for parasitic and viral infections. Expert Opin. Ther. Targets 2022, 26, 261–273. [Google Scholar] [CrossRef] [PubMed]


| Cluster | Protein | Length | Number of Predicted TMHs | Exp Number of AAs in TMHs | Exp Number, First 60 AAs | Total Prob of N-in | Signal Length | Signal Peptide | Signal Peptide Probability | Signal Anchor Probability |
|---|---|---|---|---|---|---|---|---|---|---|
| Cluster I | CAM31909.1_kiwi_D8 | 157 | 0 | 0 | 0 | 0.14 | 70 | no | 0 | 0 |
| Cluster I | AAB97141.1_apricot_Ar1 | 160 | 0 | 0 | 0 | 0.06 | 70 | no | 0 | 0 |
| Cluster I | XP_004296886.1_rasberry_I1 | 159 | 0 | 0 | 0 | 0.04 | 70 | no | 0 | 0 |
| Cluster I | ABG54495.1_raspberry_I1 | 137 | 0 | 0 | 0 | 0.06 | 70 | no | 0 | 0 |
| Cluster I | CAJ29538.1_strawberry_A1 | 160 | 0 | 0 | 0 | 0.13 | 70 | no | 0 | 0 |
| Cluster I | ABB78006.1_peach_P1 | 160 | 0 | 0 | 0 | 0.04 | 70 | no | 0 | 0 |
| Cluster I | AAC02632.1_cherry_A1 | 160 | 0 | 0 | 0 | 0.04 | 70 | no | 0 | 0 |
| Cluster I | CAA58646.1_apple_D1 | 159 | 0 | 0 | 0 | 0.06 | 70 | no | 0 | 0 |
| Cluster I | AAC13315.1_pear_C1 | 159 | 0 | 0 | 0 | 0.04 | 70 | no | 0 | 0 |
| Cluster II | AAK54835.1_pineapple_C1 | 131 | 0 | 0 | 0 | 0.3 | 70 | no | 0 | 0 |
| Cluster II | sp|C0HL99.1_kiwi_D9 | 109 | 0 | 0 | 0 | 0.41 | 70 | no | 0 | 0 |
| Cluster II | XP_004287490.1_stawberry_A4 | 131 | 0 | 0 | 0 | 0.35 | 70 | no | 0 | 0 |
| Cluster II | AAW69549.1_melon_M2 | 131 | 0 | 0 | 0 | 0.25 | 70 | no | 0 | 0 |
| Cluster II | AAK54834.1_banana_A1 | 131 | 0 | 0 | 0 | 0.3 | 70 | no | 0.01 | 0 |
| Cluster II | AAD29414.1_apple_D4 | 61 | 0 | 0 | 0 | 0.25 | 70 | no | 0 | 0 |
| Cluster II | AAD29411.1_cherry_A4 | 131 | 0 | 0 | 0 | 0.3 | 70 | no | 0 | 0 |
| Cluster II | CAD37201.1_peach_P4 | 131 | 0 | 0 | 0 | 0.3 | 70 | no | 0 | 0 |
| Cluster II | CAD10390.1_date-palm_D2 | 131 | 0 | 0 | 0 | 0.28 | 70 | no | 0.01 | 0 |
| Cluster II | AAD29410.1_pear_C4 | 131 | 0 | 0 | 0 | 0.3 | 70 | no | 0 | 0 |
| Cluster III | GFZ19186.1_kiwi_D10 | 115 | 0 | 1 | 1 | 0.22 | 70 | yes | 1 | 0 |
| Cluster III | XP_009396870.1_banana_A3 | 119 | 0 | 13 | 13 | 0.37 | 70 | yes | 1 | 0 |
| Cluster III | XP_007206159.1_peach_P3 | 117 | 1 | 17 | 17 | 0.8 | 70 | yes | 1 | 0 |
| Cluster III | ADR66947.1_apricot_Ar3 | 117 | 1 | 17 | 17 | 0.8 | 70 | yes | 1 | 0 |
| Cluster III | PQP98495.1_plum_D3 | 117 | 1 | 17 | 17 | 0.79 | 70 | yes | 1 | 0 |
| Cluster III | AAF26449.1_cherry_A3 | 117 | 1 | 17 | 17 | 0.78 | 70 | yes | 1 | 0 |
| Cluster III | AAF26451.1_pear_C3 | 115 | 1 | 18 | 18 | 0.52 | 70 | yes | 1 | 0 |
| Cluster III | AAT80633.1_apple_D3 | 115 | 0 | 16 | 16 | 0.57 | 70 | yes | 1 | 0 |
| Cluster III | CAC86258.1_strawberry_A3 | 117 | 1 | 21 | 21 | 0.8 | 70 | yes | 1 | 0 |
| Cluster III | ABG54494.1_raspberry_I3 | 117 | 1 | 20 | 20 | 0.62 | 70 | yes | 1 | 0 |
| Cluster III | AAO33394.1_grape_V1 | 119 | 0 | 15 | 15 | 0.53 | 70 | yes | 1 | 0 |
| Cluster III | AHB19227.1_pomegranate_G1 | 120 | 0 | 11 | 11 | 0.44 | 70 | yes | 1 | 0 |
| Cluster IV | PSR89527.1_kiwi_D7 | 559 | 0 | 10 | 10 | 0.46 | 70 | yes | 0.89 | 0.1 |
| Cluster IV | XP_007199020.1_peach_P9 | 161 | 1 | 17 | 17 | 0.89 | 70 | yes | 0.99 | 0 |
| Cluster IV | M5X16_peach_P10 | 401 | 0 | 13 | 13 | 0.54 | 70 | yes | 0.92 | 0.1 |
| Cluster IV | BAC54964.1_kiwi_D6 | 185 | 1 | 18 | 18 | 0.83 | 70 | yes | 0.94 | 0.1 |
| Cluster IV | ABB77213.1_kiwi_D12 | 462 | 0 | 0 | 0 | 0.01 | 70 | yes | 1 | 0 |
| Cluster IV | AAC24001.1_pear_C5 | 308 | 0 | 0 | 0 | 0.05 | 70 | no | 0.01 | 0 |
| Cluster IV | P84527.2_greenkiwi_D5 | 213 | 0 | 8 | 8 | 0.25 | 70 | yes | 1 | 0 |
| Cluster IV | AAD32205.1_apricot_Ar5 | 168 | 0 | 0 | 0 | 0.1 | 70 | no | 0.01 | 0 |
| Cluster IV | BAA06905.1_melon_M1 | 731 | 0 | 0 | 0 | 0 | 70 | yes | 0.97 | 0 |
| Cluster IV | P85524.1_kiwi_D11_P | 150 | 0 | 0 | 0 | 0.21 | 70 | no | 0 | 0 |
| Cluster IV | AAR92223.1_greenkiwi_D4 | 116 | 1 | 16 | 16 | 0.29 | 70 | yes | 1 | 0 |
| Cluster IV | ACV85695.1_papaya_P1 | 494 | 1 | 18 | 18 | 0.92 | 70 | yes | 0.52 | 0.2 |
| Cluster IV | XP_008455060.1_melon_M3 | 116 | 1 | 21 | 21 | 0.85 | 70 | yes | 0.95 | 0 |
| Cluster IV | CAC81811.1_banana_A2 | 318 | 0 | 0 | 0 | 0.02 | 70 | yes | 1 | 0 |
| Cluster IV | CAB01591.1_pers_A1 | 326 | 0 | 15 | 14 | 0.66 | 70 | yes | 1 | 0 |
| Cluster IV | AAB82772.2_banana_A5 | 340 | 0 | 14 | 13 | 0.66 | 70 | yes | 1 | 0 |
| Cluster IV | ALQ56981.1_coconut_N1_P | 490 | 1 | 20 | 19 | 0.97 | 70 | yes | 0.99 | 0 |
| Cluster IV | XP_021820299.1_cherry_Av7 | 88 | 0 | 11 | 11 | 0.31 | 70 | yes | 1 | 0 |
| Cluster IV | XP_016648029.1_peach_P7 | 88 | 0 | 11 | 11 | 0.31 | 70 | yes | 1 | 0 |
| Cluster IV | CAI38795.2_greenkiwi_D2 | 225 | 1 | 19 | 19 | 0.85 | 70 | yes | 1 | 0 |
| Cluster IV | XP_009406737.1_banana_A4 | 226 | 1 | 22 | 22 | 0.82 | 70 | yes | 1 | 0 |
| Cluster IV | AAB38064.1_cherry_A2 | 245 | 1 | 21 | 21 | 0.92 | 70 | yes | 1 | 0 |
| Cluster IV | AAC36740.1_apple_D2 | 245 | 0 | 0 | 0 | 0.1 | 70 | yes | 1 | 0 |
| Cluster IV | ACE80959.1_peach_P2 | 246 | 1 | 18 | 18 | 0.77 | 70 | yes | 1 | 0 |
| Cluster IV | BAA21849.1_pineapple_C2 | 351 | 1 | 16 | 16 | 0.88 | 70 | yes | 1 | 0 |
| Cluster IV | CAA66378.1_papaya_P2 | 352 | 0 | 13 | 13 | 0.61 | 70 | yes | 0.99 | 0 |
| Cluster IV | CAA34486.1_greenkiwi_D1 | 380 | 1 | 17 | 16 | 0.65 | 70 | yes | 0.95 | 0.1 |
| Cluster IV | AAX40948.1_date_M1_1 | 330 | 0 | 4 | 4 | 0.21 | 70 | yes | 0.99 | 0 |
| Cluster IV | G1UH28_pomegranate_G14 | 299 | 0 | 16 | 14 | 0.57 | 70 | yes | 1 | 0 |
Publisher’s Note: MDPI stays neutral with regard to jurisdictional claims in published maps and institutional affiliations. |
© 2022 by the authors. Licensee MDPI, Basel, Switzerland. This article is an open access article distributed under the terms and conditions of the Creative Commons Attribution (CC BY) license (https://creativecommons.org/licenses/by/4.0/).
Share and Cite
Zhou, W.; Bias, K.; Lenczewski-Jowers, D.; Henderson, J.; Cupp, V.; Ananga, A.; Ochieng, J.W.; Tsolova, V. Analysis of Protein Sequence Identity, Binding Sites, and 3D Structures Identifies Eight Pollen Species and Ten Fruit Species with High Risk of Cross-Reactive Allergies. Genes 2022, 13, 1464. https://doi.org/10.3390/genes13081464
Zhou W, Bias K, Lenczewski-Jowers D, Henderson J, Cupp V, Ananga A, Ochieng JW, Tsolova V. Analysis of Protein Sequence Identity, Binding Sites, and 3D Structures Identifies Eight Pollen Species and Ten Fruit Species with High Risk of Cross-Reactive Allergies. Genes. 2022; 13(8):1464. https://doi.org/10.3390/genes13081464
Chicago/Turabian StyleZhou, Wei, Kaylah Bias, Dylan Lenczewski-Jowers, Jiliah Henderson, Victor Cupp, Anthony Ananga, Joel Winyo Ochieng, and Violeta Tsolova. 2022. "Analysis of Protein Sequence Identity, Binding Sites, and 3D Structures Identifies Eight Pollen Species and Ten Fruit Species with High Risk of Cross-Reactive Allergies" Genes 13, no. 8: 1464. https://doi.org/10.3390/genes13081464