
Molecular Characterization of the Response to Conventional Chemotherapeutics in Pro-B-ALL Cell Lines in Terms of Tumor Relapse

 and
and 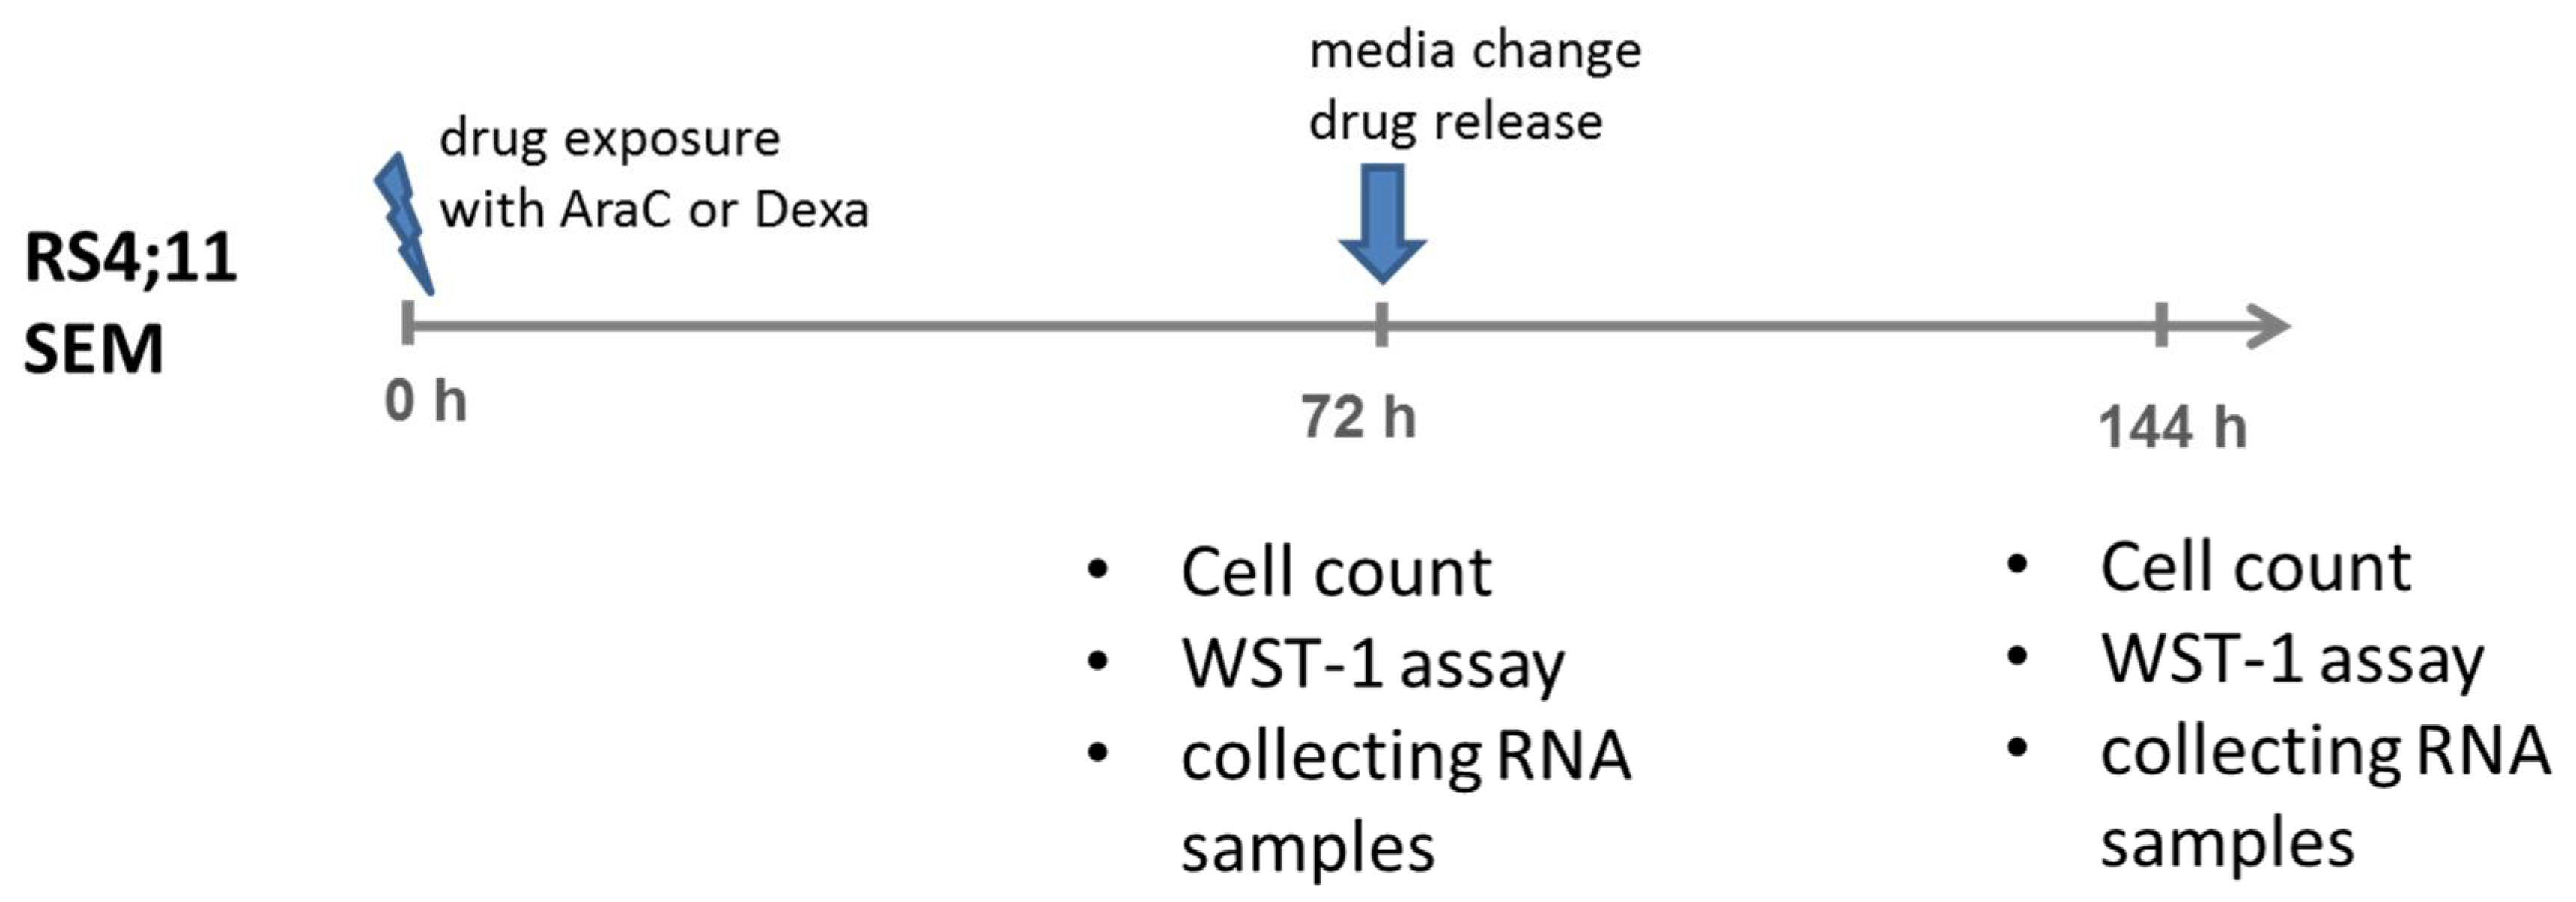
Abstract
:1. Introduction
2. Materials and Methods
2.1. Cell Lines and Culture Conditions
2.2. Cytostatic Agents
2.3. Drug Application Experiments
2.4. Biological Assays (Cell Count, Proliferation and Metabolic Activities)
2.5. RNA-Isolation and Sequencing
2.6. Data Processing
2.7. Over-Representation Analysis (ORA)
2.8. miRNA Enrichment Analysis and Related ORA
2.9. Gene Regulatory Network (GRN) Construction
2.10. Semantic Validation of the GRNs Nodes
3. Results
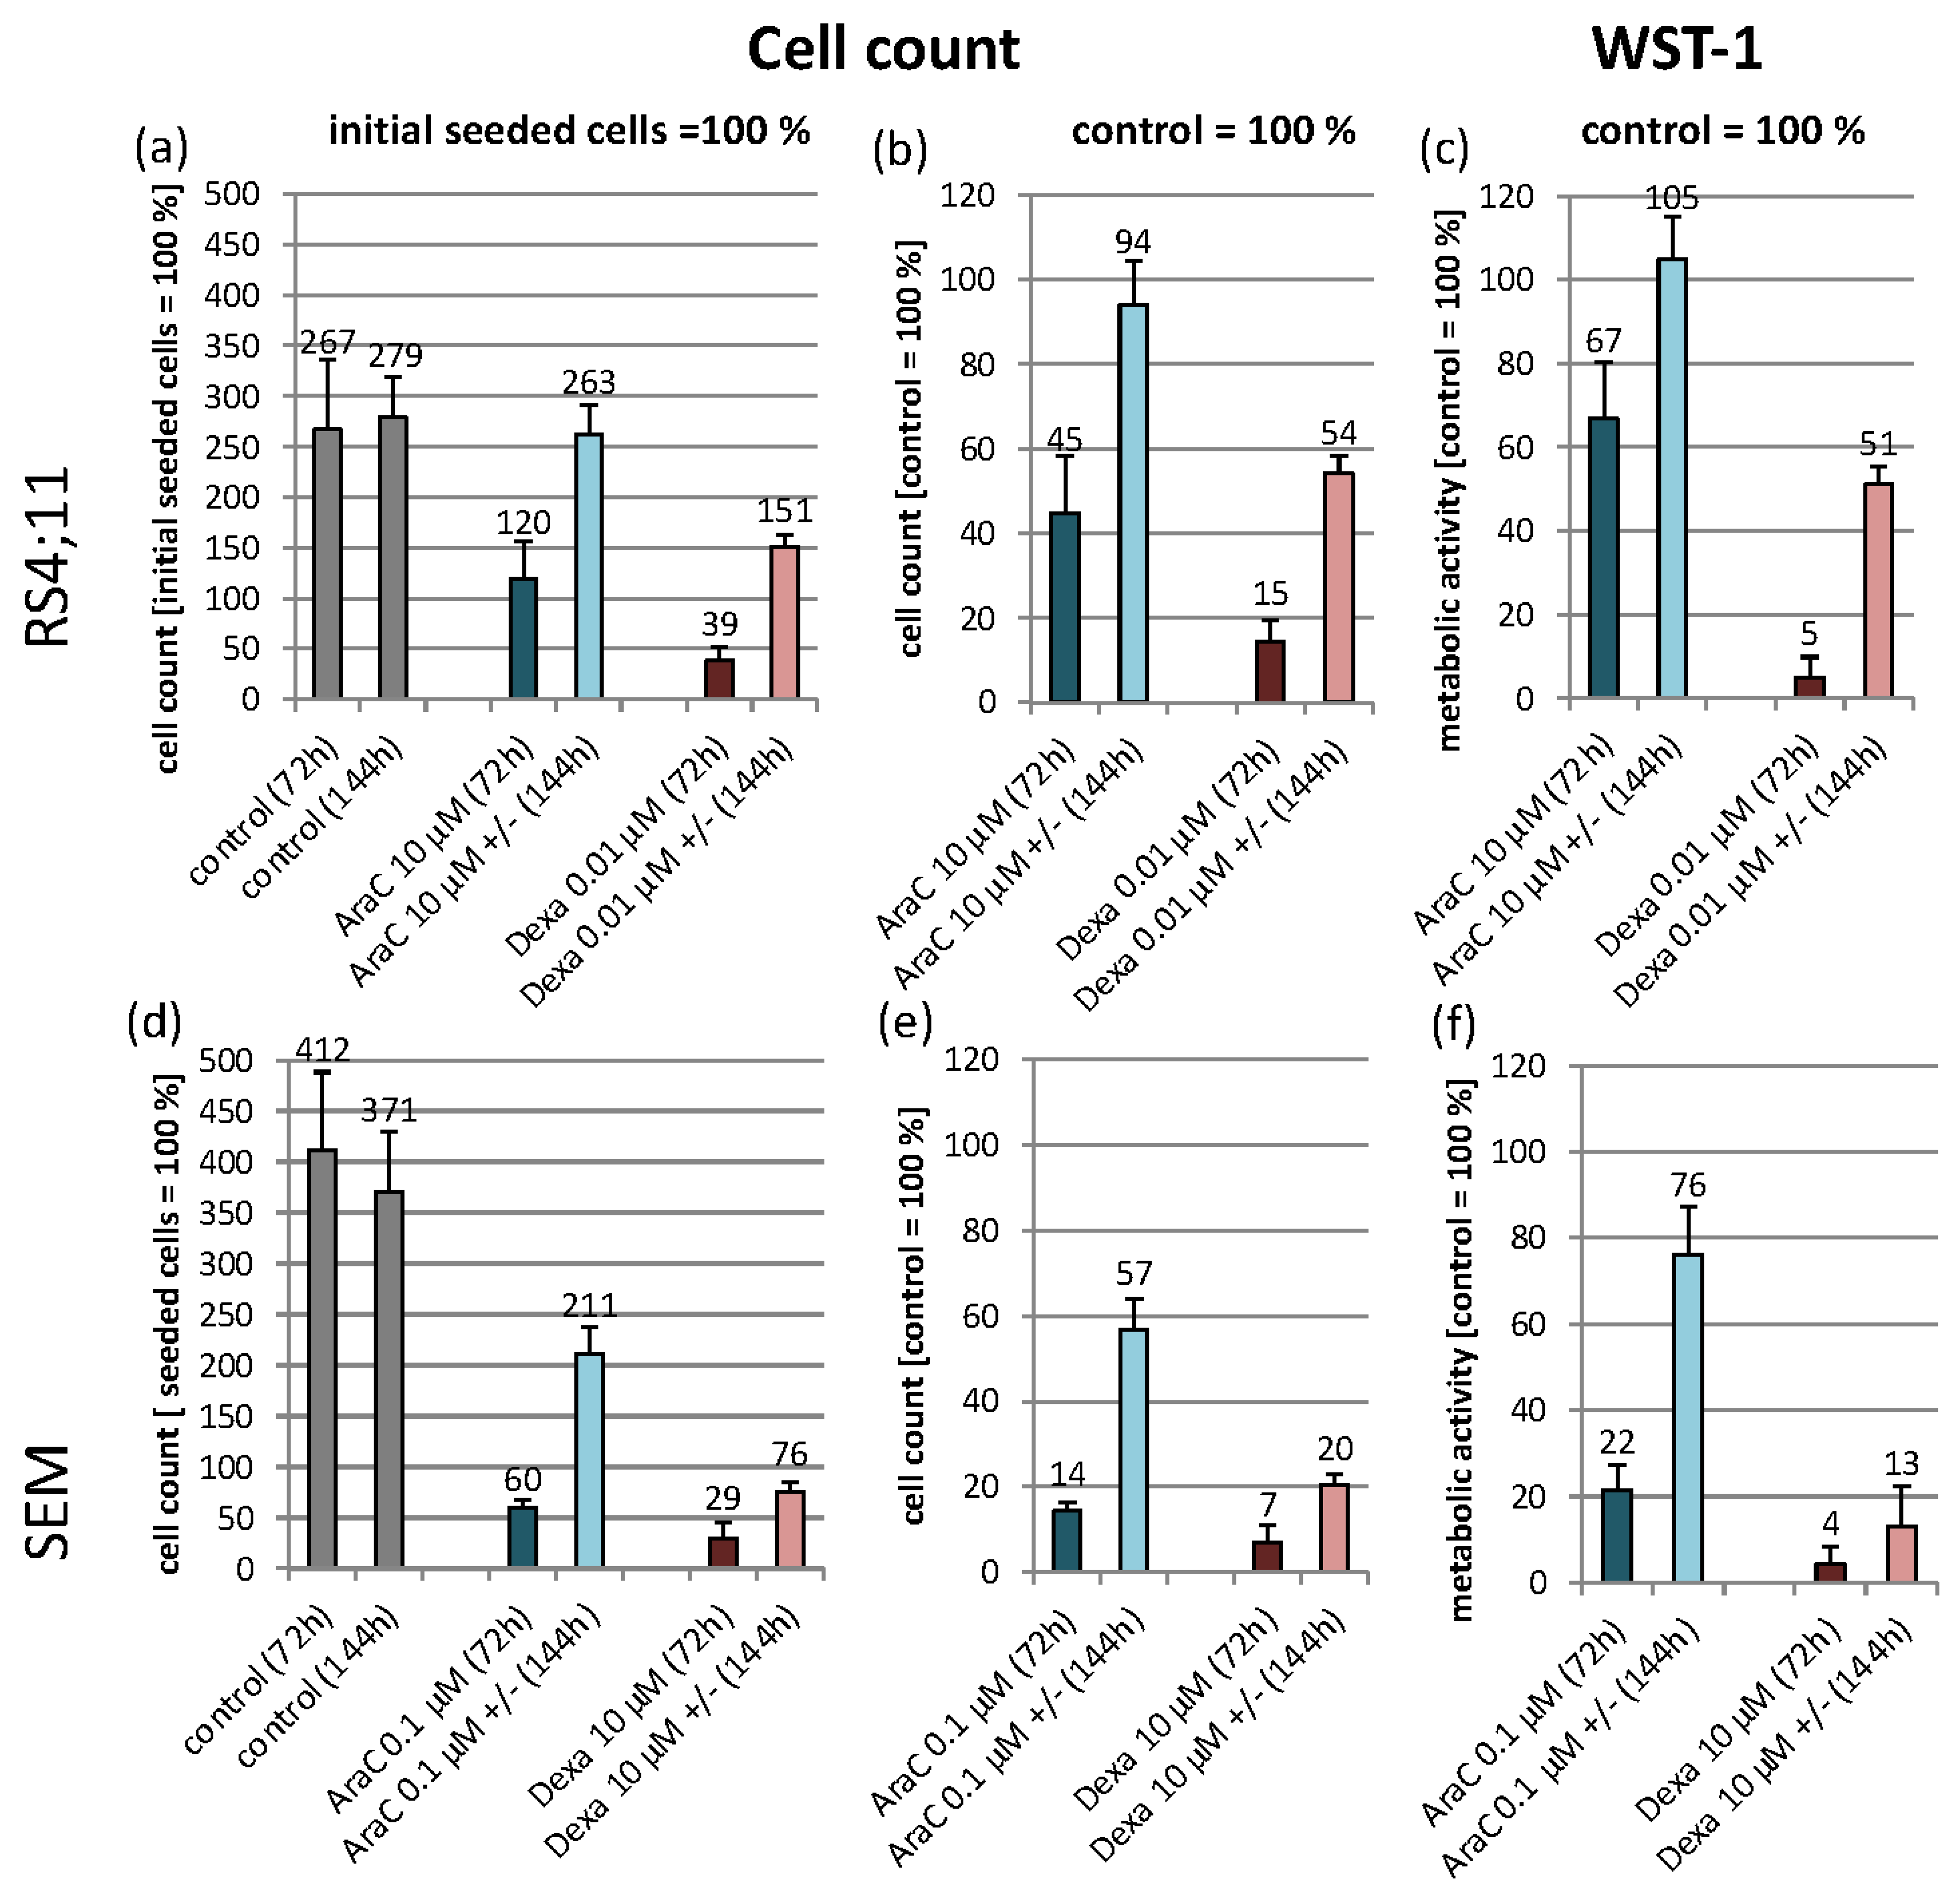
3.1. Experimental Design and Cell Line Characteristic Biological Effects of the Used Agents
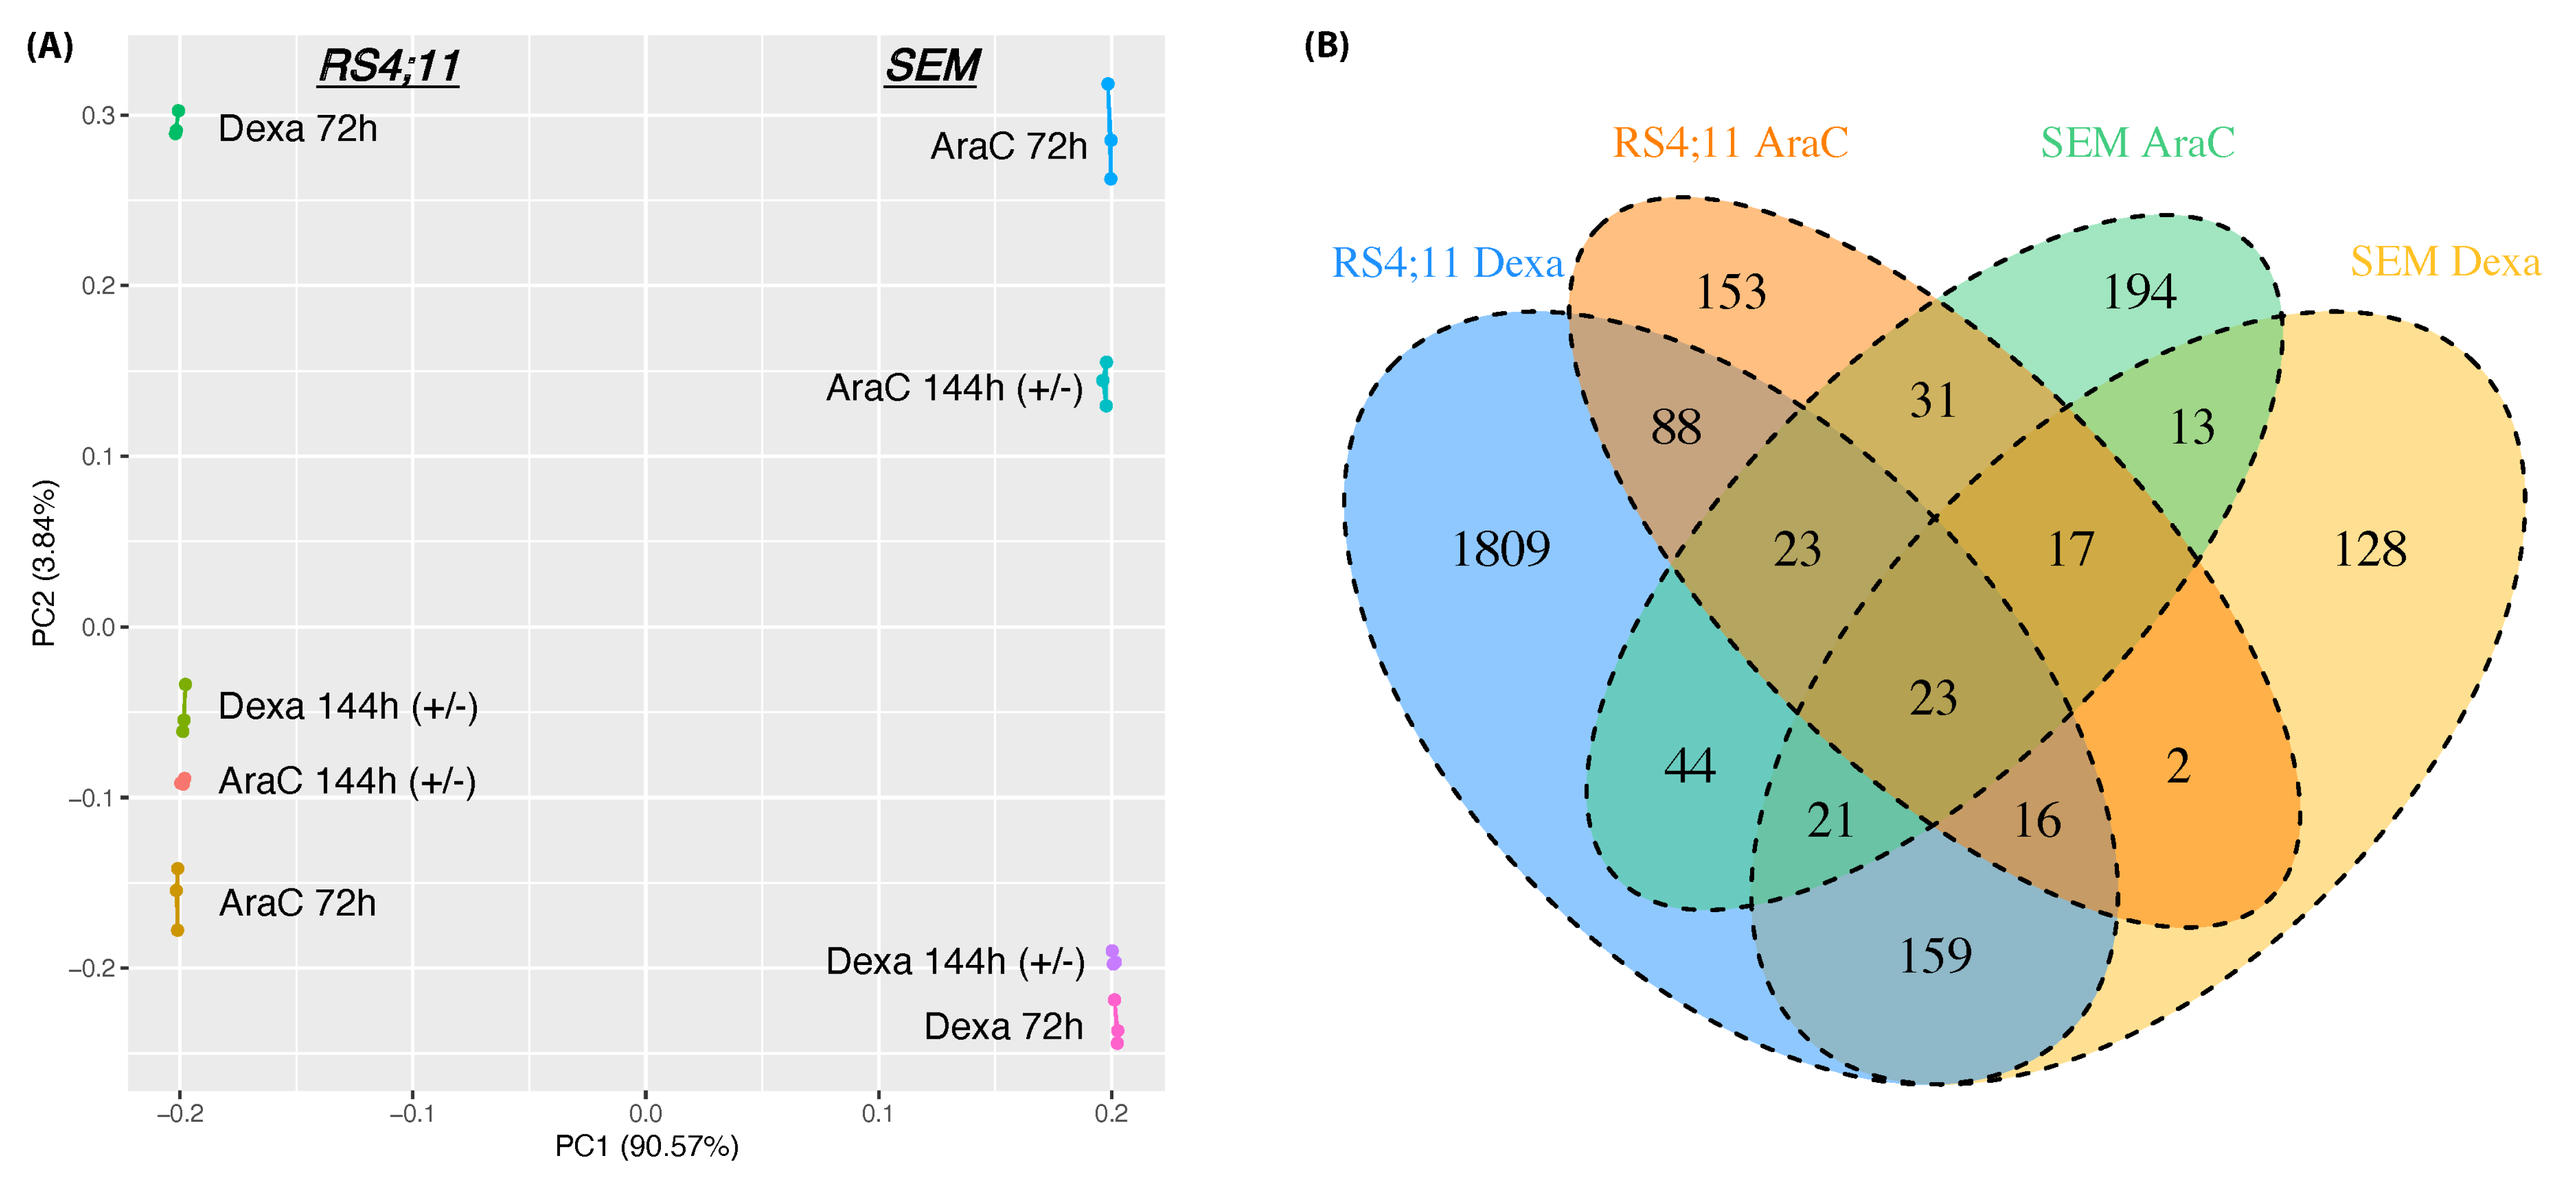
3.2. Whole-Genome Transcriptomic Differences between AraC and Dexa
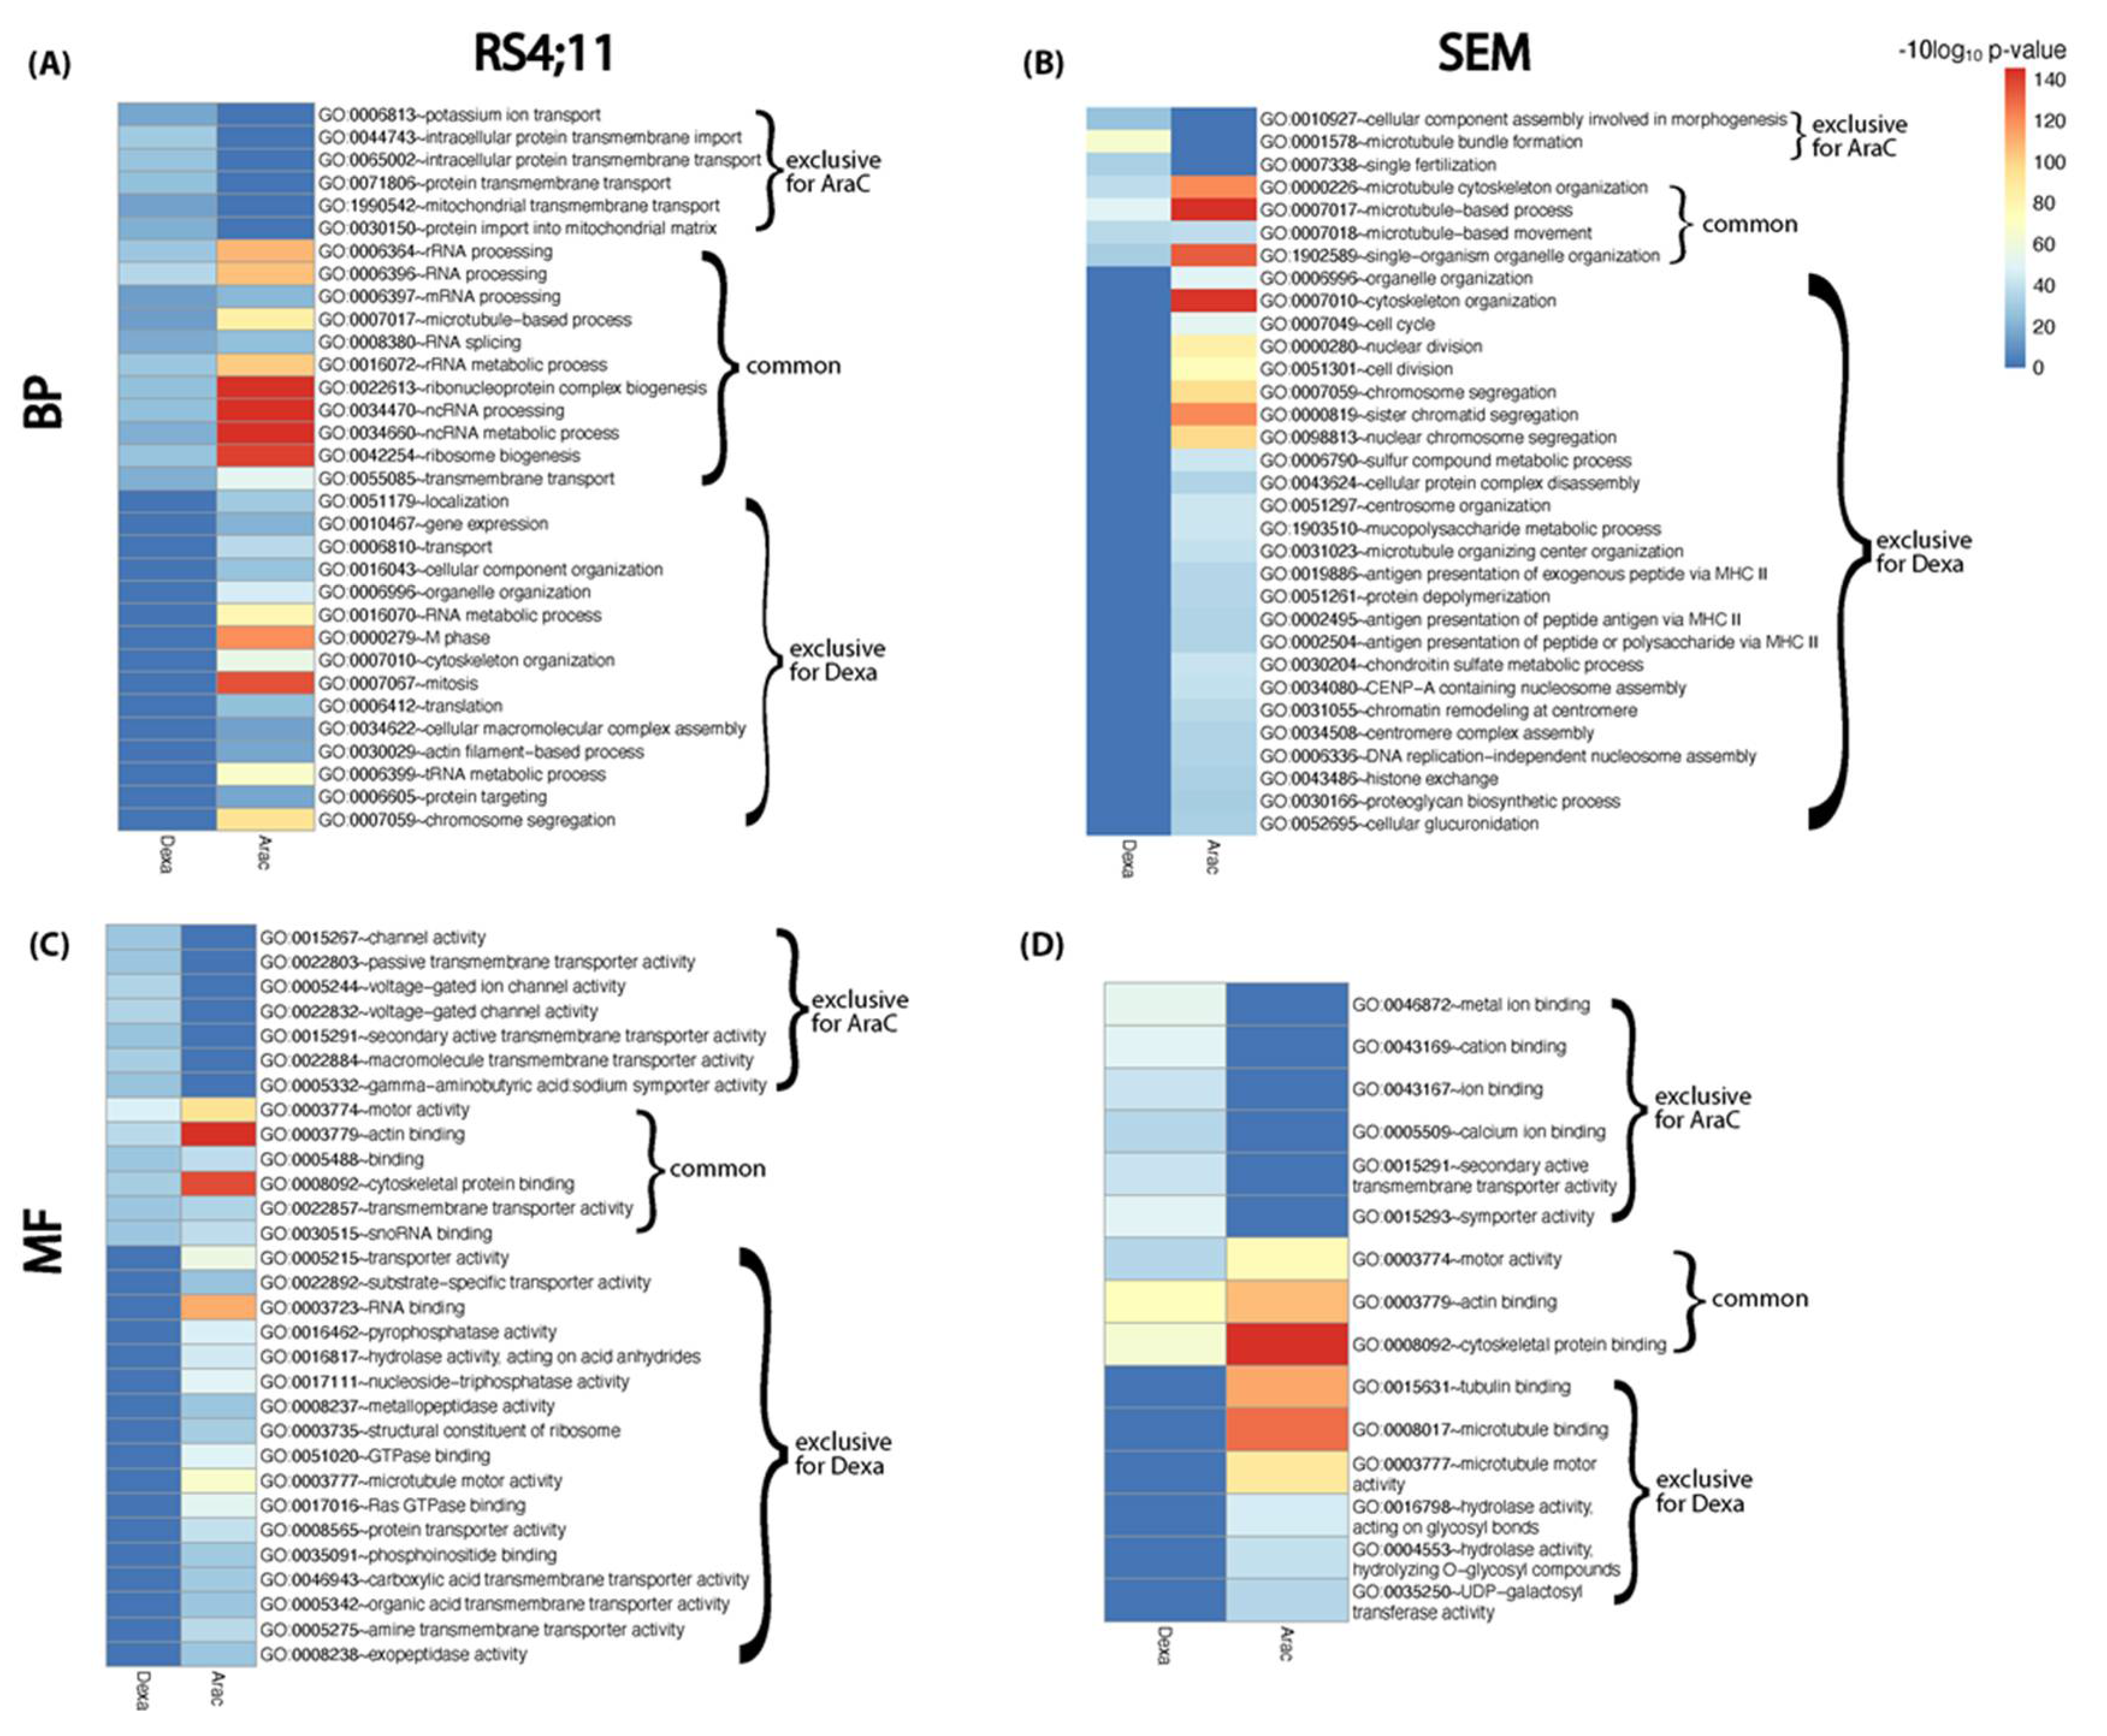
3.3. Functional Relapse Characteristics in Response to Each Drug Treatment
3.4. miRNA Enrichment Analysis
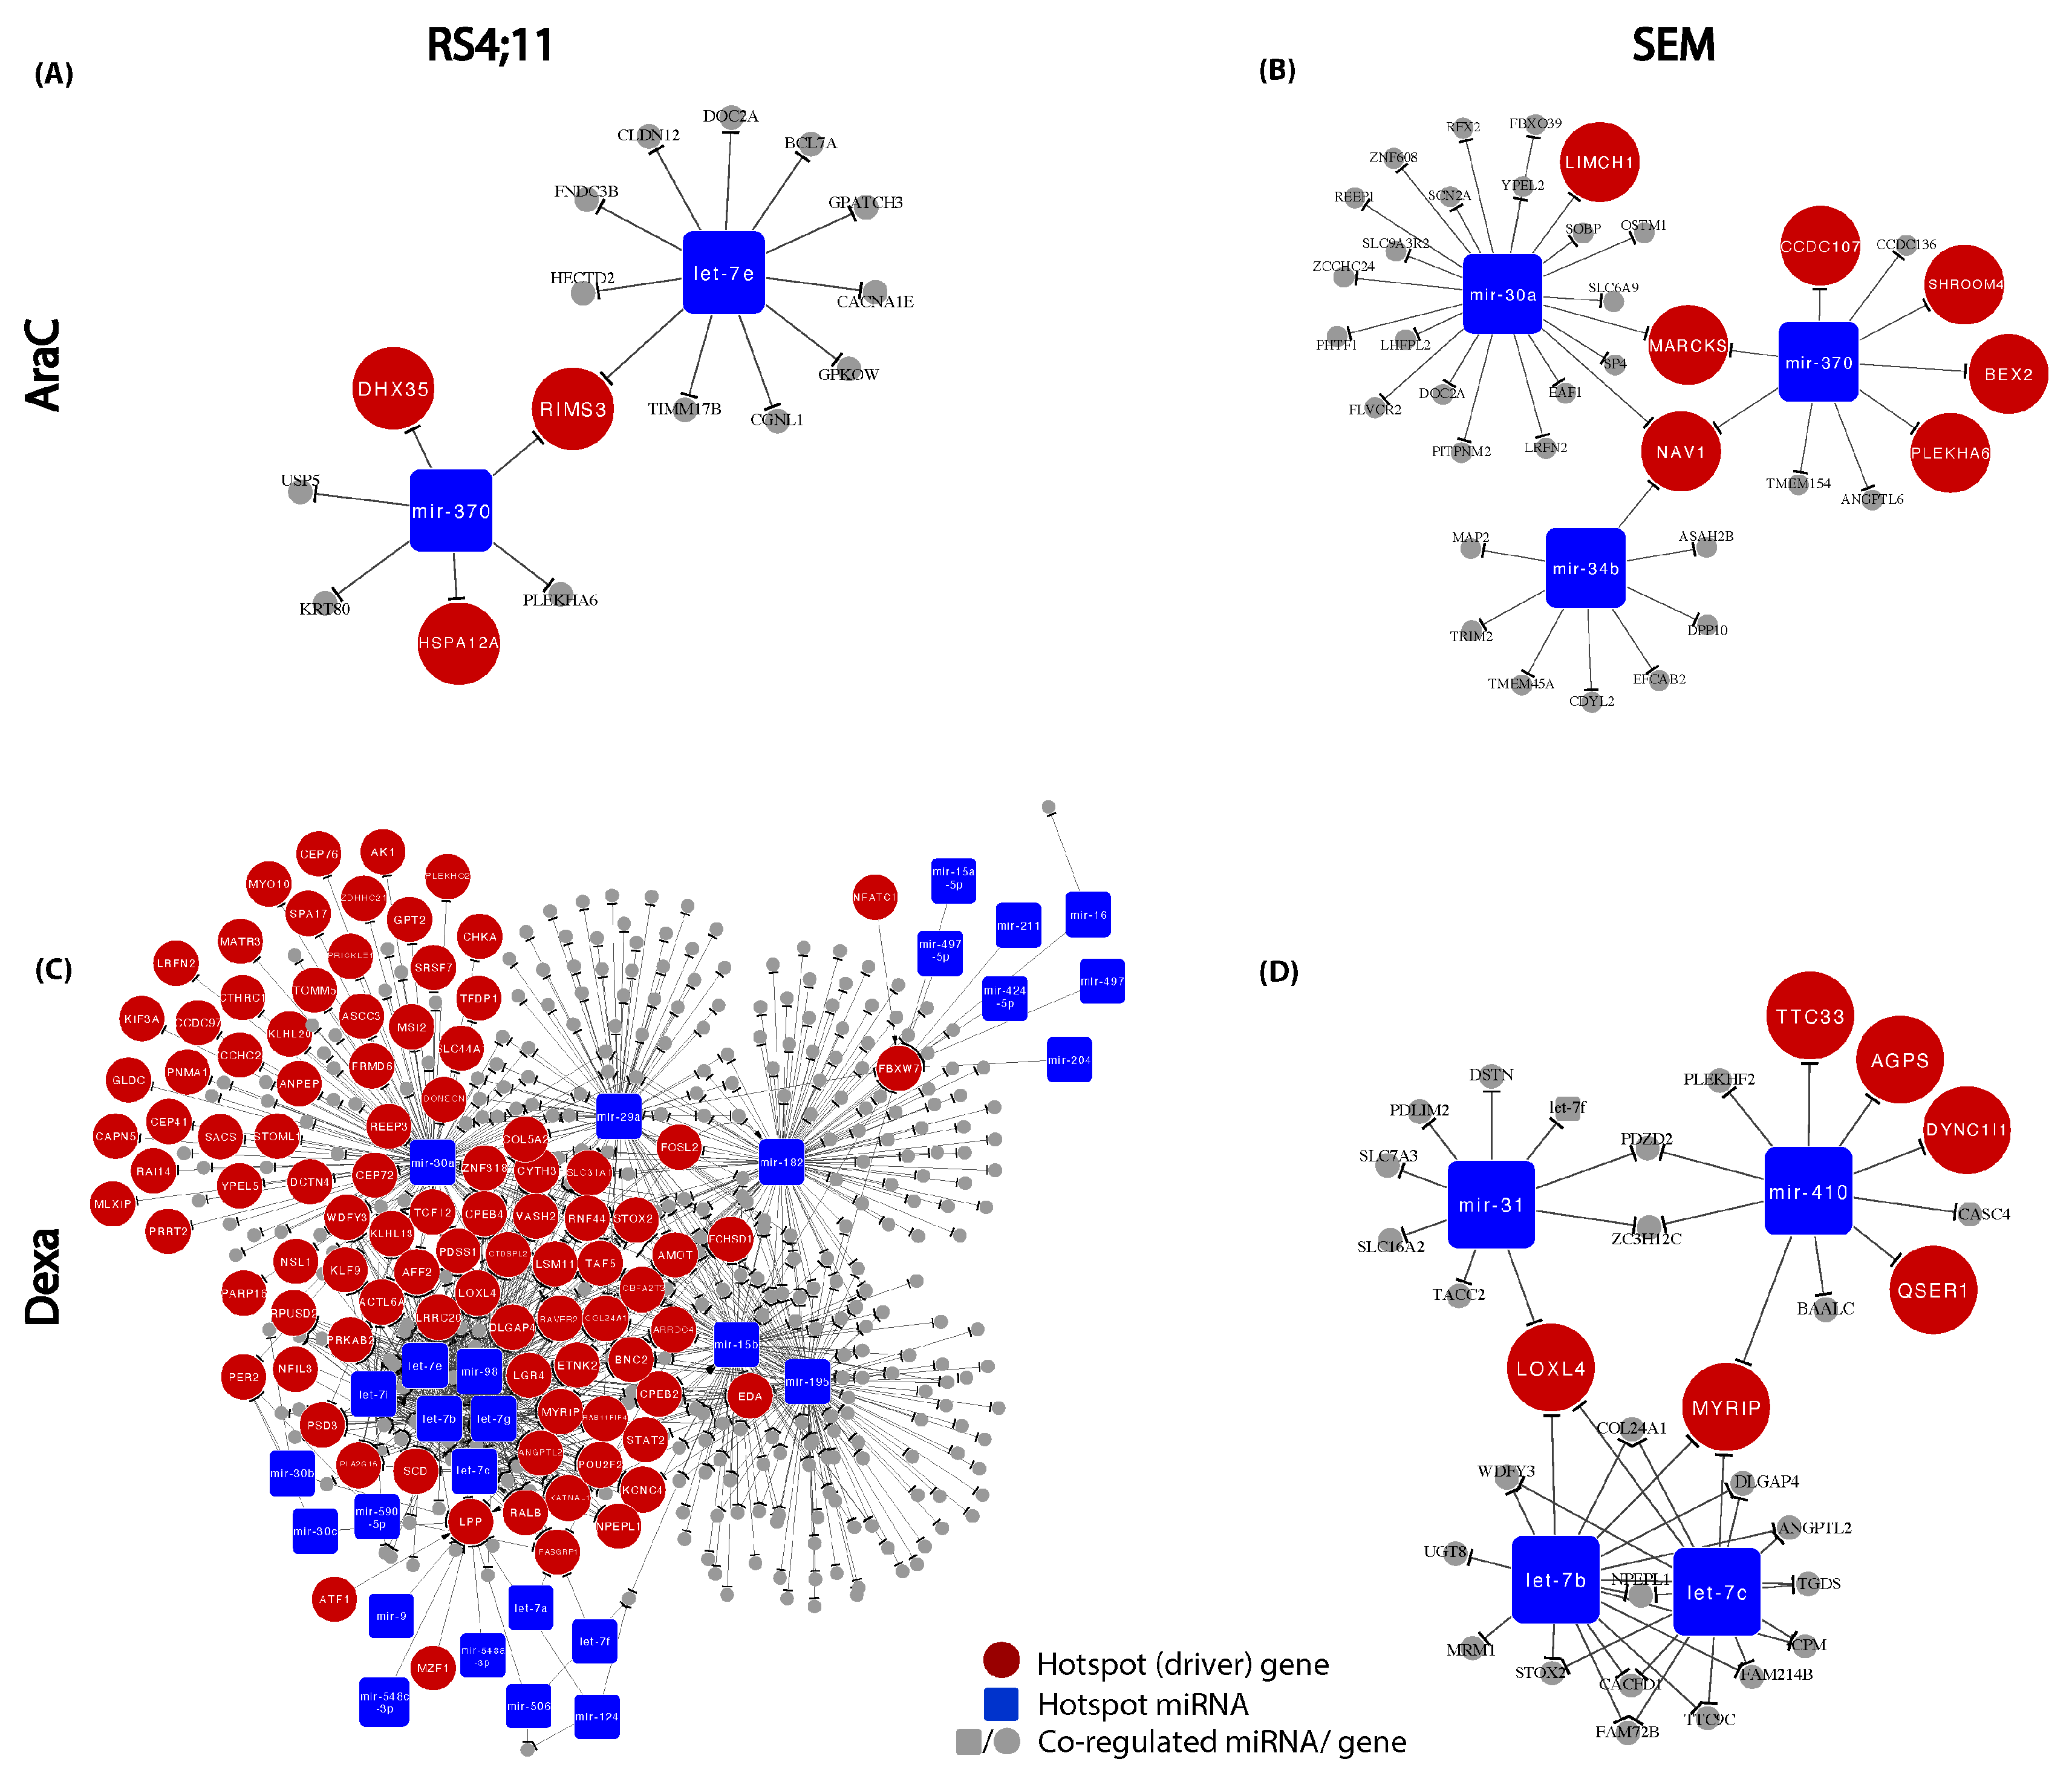
3.5. Construction of Relapse-Mediated Gene Regulatory Networks (GRN)
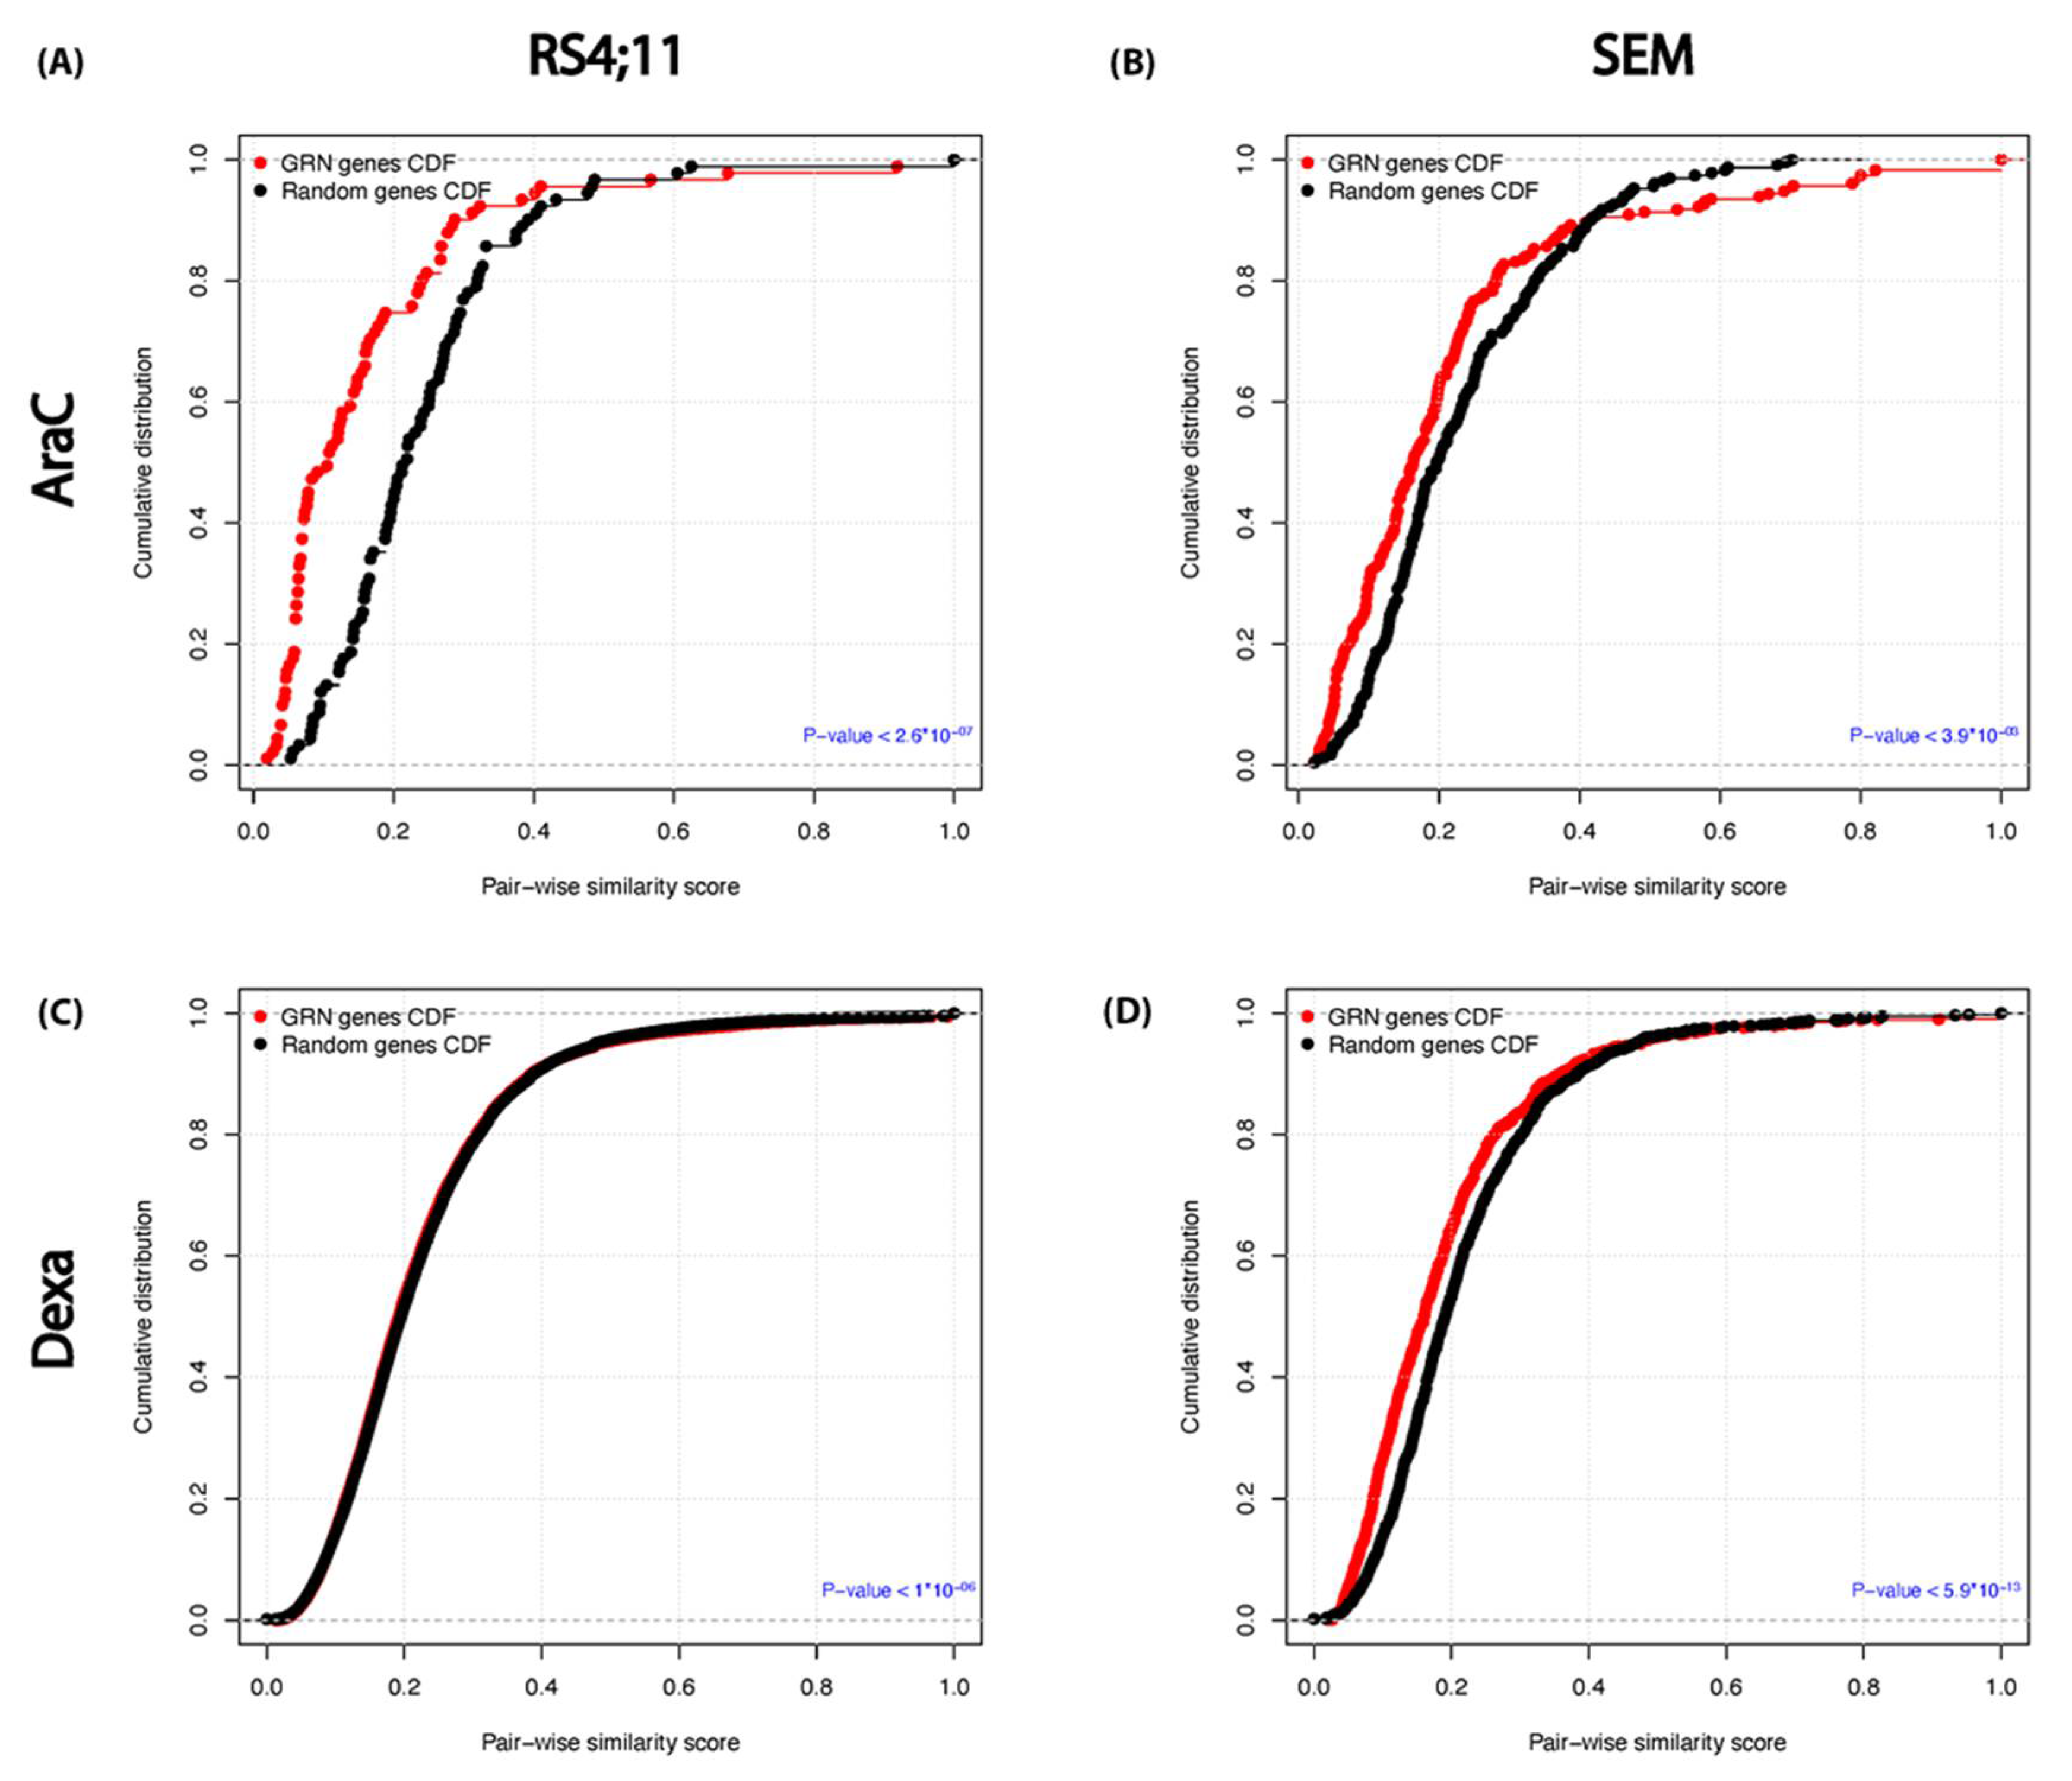
3.6. Functional Similarity and Integrity between the Relapse–Mediated GRN Genes
4. Discussion
5. Conclusions
Supplementary Materials
Author Contributions
Funding
Institutional Review Board Statement
Informed Consent Statement
Data Availability Statement
Acknowledgments
Conflicts of Interest
References
- Gökbuget, N.; Hoelzer, D. Treatment of Adult Acute Lymphoblastic Leukemia. Semin. Hematol. 2009, 46, 64–75. [Google Scholar] [CrossRef] [PubMed] [Green Version]
- Hoelzer, D.; Gökbuget, N. Chemoimmunotherapy in acute lymphoblastic leukemia. Blood Rev. 2012, 26, 25–32. [Google Scholar] [CrossRef] [PubMed]
- Gökbuget, N. Treatment of older patients with acute lymphoblastic leukemia. Hematology 2016, 2016, 573–579. [Google Scholar] [CrossRef] [PubMed] [Green Version]
- Jacobson, S.; Tedder, M.; Eggert, J. Adult Acute Lymphoblastic Leukemia: A Genetic Overview and Application to Clinical Practice. Clin. J. Oncol. Nurs. 2016, 20, E147–E154. [Google Scholar] [CrossRef] [PubMed] [Green Version]
- Müschen, M. Rationale for targeting the pre–B-cell receptor signaling pathway in acute lymphoblastic leukemia. Blood 2015, 125, 3688–3693. [Google Scholar] [CrossRef] [Green Version]
- Cruz-Rodriguez, N.; Combita, A.L.; Enciso, L.J.; Quijano, S.M.; Pinzon, P.L.; Lozano, O.C.; Castillo, J.S.; Li, L.; Bareño, J.; Cardozo, C.; et al. High expression of ID family and IGJ genes signature as predictor of low induction treatment response and worst survival in adult Hispanic patients with B-acute lymphoblastic leukemia. J. Exp. Clin. Cancer Res. 2016, 35, 64. [Google Scholar] [CrossRef] [Green Version]
- Inaba, H.; Greaves, M.; Mullighan, C.G. Acute lymphoblastic leukaemia. Lancet 2013, 381, 1943–1955. [Google Scholar] [CrossRef] [Green Version]
- Fruman, D.A.; Rommel, C. PI3K and cancer: Lessons, challenges and opportunities. Nat. Rev. Drug Discov. 2014, 13, 140–156. [Google Scholar] [CrossRef] [Green Version]
- Winters, A.C.; Bernt, K.M. MLL-Rearranged Leukemias—An Update on Science and Clinical Approaches. Front. Pediatrics 2017, 5, 4. [Google Scholar] [CrossRef] [Green Version]
- Spijkers-Hagelstein, J.A.P.; Pinhanços, S.S.; Schneider, P.; Pieters, R.; Stam, R.W. Chemical genomic screening identifies LY294002 as a modulator of glucocorticoid resistance in MLL-rearranged infant ALL. Leukemia 2013, 28, 761–769. [Google Scholar] [CrossRef]
- Hoelzer, D.; Bassan, R.; Dombret, H.; Fielding, A.; Ribera, J.-M.; Buske, C.; ESMO Guidelines Committee. Acute lymphoblastic leukaemia in adult patients: ESMO Clinical Practice Guidelines for diagnosis, treatment and follow-up. Ann. Oncol. 2016, 27, v69–v82. [Google Scholar] [CrossRef] [PubMed]
- Torra, O.S.; Othus, M.; Williamson, D.W.; Wood, B.; Kirsch, I.; Robins, H.; Beppu, L.; O’Donnell, M.R.; Forman, S.J.; Appelbaum, F.R.; et al. Next-Generation Sequencing in Adult B Cell Acute Lymphoblastic Leukemia Patients. Biol. Blood Marrow Transplant. 2017, 23, 691–696. [Google Scholar] [CrossRef] [PubMed] [Green Version]
- Mohseni, M.; Uludag, H.; Brandwein, J.M. Advances in biology of acute lymphoblastic leukemia (ALL) and therapeutic implications. Am. J. Blood Res. 2018, 8, 29–56. [Google Scholar] [PubMed]
- Terwilliger, T.; Abdul-Hay, M. Acute lymphoblastic leukemia: A comprehensive review and 2017 update. Blood Cancer J. 2017, 7, e577. [Google Scholar] [CrossRef] [PubMed] [Green Version]
- Sklarz, L.-M.; Gladbach, Y.S.; Ernst, M.; Hamed, M.; Roolf, C.; Sender, S.; Beck, J.; Schütz, E.; Fischer, S.; Struckmann, S.; et al. Combination of the PI3K inhibitor idelalisib with the conventional cytostatics cytarabine and dexamethasone leads to pathway modulations inducing anti-proliferative effects in B lymphoblastic leukaemia cell lines. Cancer Cell Int. 2020, 20, 1–14. [Google Scholar] [CrossRef]
- Pui, C.-H.; Yang, J.J.; Hunger, S.P.; Pieters, R.; Schrappe, M.; Biondi, A.; Vora, A.; Baruchel, A.; Silverman, L.B.; Schmiegelow, K.; et al. Childhood Acute Lymphoblastic Leukemia: Progress through Collaboration. J. Clin. Oncol. 2015, 33, 2938–2948. [Google Scholar] [CrossRef]
- Mitchell, C.D.; Richards, S.M.; Kinsey, S.E.; Lilleyman, J.; Vora, A.; Eden, T.O.B.; The Medical Research Council Childhood Leukaemia Working Party. Benefit of dexamethasone compared with prednisolone for childhood acute lymphoblastic leukaemia: Results of the UK Medical Research Council ALL97 randomized trial. Br. J. Haematol. 2005, 129, 734–745. [Google Scholar] [CrossRef]
- Vrooman, L.M.; Stevenson, K.E.; Supko, J.G.; O’Brien, J.; Dahlberg, S.E.; Asselin, B.L.; Athale, U.H.; Clavell, L.A.; Kelly, K.M.; Kutok, J.L.; et al. Postinduction Dexamethasone and Individualized Dosing of Escherichia Coli L-Asparaginase Each Improve Outcome of Children and Adolescents With Newly Diagnosed Acute Lymphoblastic Leukemia: Results From a Randomized Study—Dana-Farber Cancer Institute ALL Consortium Protocol 00-01. J. Clin. Oncol. 2013, 31, 1202–1210. [Google Scholar] [CrossRef] [Green Version]
- Inaba, H.; Pui, C.-H. Glucocorticoid use in acute lymphoblastic leukaemia. Lancet Oncol. 2010, 11, 1096–1106. [Google Scholar] [CrossRef] [Green Version]
- Berger, D.P.; Engelhardt, R.; Mertelsmann, R. Das Rote Buch-Hämatologische und Internistische Onkologie. In Das Rote Buch-Hämatologische und Internistische Onkologie, 6th ed.; Ecomed-Storck GmbH: Landsberg am Lech, Germany, 2017. [Google Scholar]
- Stanulla, M.; Schrappe, M. Treatment of Childhood Acute Lymphoblastic Leukemia. Semin. Hematol. 2009, 46, 52–63. [Google Scholar] [CrossRef]
- Gibson, T.M.; Ehrhardt, M.J.; Ness, K.K. Obesity and Metabolic Syndrome Among Adult Survivors of Childhood Leukemia. Curr. Treat. Options Oncol. 2016, 17, 1–13. [Google Scholar] [CrossRef] [PubMed] [Green Version]
- Dyczynski, M.; Vesterlund, M.; Björklund, A.-C.; Zachariadis, V.; Janssen, J.; Gallart-Ayala, H.; Daskalaki, E.; Wheelock, C.E.; Lehtiö, J.; Grandér, D.; et al. Metabolic reprogramming of acute lymphoblastic leukemia cells in response to glucocorticoid treatment. Cell Death Dis. 2018, 9, 1–13. [Google Scholar] [CrossRef] [PubMed] [Green Version]
- Brissot, E.; Ito, S.; Lu, K.; Cantilena, C.; Smith, B.D.; Prince, G.; Sadrzadeh, H.; Fathi, A.T.; Strickland, S.A.; Hensel, N.F.; et al. T Cell Exhaustion and Downregulation of Cytotoxic NK Cells—An Immune Escape Mechanism in Adult Acute Lymphoblastic Leukemia. Blood 2014, 124, 3781. [Google Scholar] [CrossRef]
- Ragusa, D.; Makarov, E.M.; Britten, O.; Moralli, D.; Green, C.M.; Tosi, S. The RS4;11 cell line as a model for leukaemia with t(4;11)(q21;q23): Revised characterisation of cytogenetic features. Cancer Rep. 2019, 2, e1207. [Google Scholar] [CrossRef] [Green Version]
- Bhatla, T.; Wang, J.; Morrison, D.J.; Raetz, E.A.; Burke, M.J.; Brown, P.; Carroll, W.L. Epigenetic reprogramming reverses the relapse-specific gene expression signature and restores chemosensitivity in childhood B-lymphoblastic leukemia. Blood 2012, 119, 5201–5210. [Google Scholar] [CrossRef] [Green Version]
- Stumpel, D.J.; Schneider, P.; Pieters, R.; Stam, R.W. The potential of clofarabine in MLL -rearranged infant acute lymphoblastic leukaemia. Eur. J. Cancer 2015, 51, 2008–2021. [Google Scholar] [CrossRef] [Green Version]
- Wander, P.; Cheung, L.C.; Pinhanҫos, S.S.; Jones, L.; Kerstjens, M.; Arentsen-Peters, S.T.; Singh, S.; Chua, G.-A.; Castro, P.G.; Schneider, P.; et al. Preclinical efficacy of gemcitabine in MLL-rearranged infant acute lymphoblastic leukemia. Leukemia 2020, 34, 2898–2902. [Google Scholar] [CrossRef] [PubMed]
- Marke, R.; Havinga, J.; Cloos, J.; Demkes, M.; Poelmans, G.; Yuniati, L.; Schenau, D.V.I.; Sonneveld, E.; Waanders, E.; Pieters, R.; et al. Tumor suppressor IKZF1 mediates glucocorticoid resistance in B-cell precursor acute lymphoblastic leukemia. Leukemia 2015, 30, 1599–1603. [Google Scholar] [CrossRef]
- Kruth, K.A.; Fang, M.; Shelton, D.N.; Abu-Halawa, O.; Mahling, R.; Yang, H.; Weissman, J.S.; Loh, M.L.; Müschen, M.; Tasian, S.K.; et al. Suppression of B-cell development genes is key to glucocorticoid efficacy in treatment of acute lymphoblastic leukemia. Blood 2017, 129, 3000–3008. [Google Scholar] [CrossRef]
- Hall, C.P.; Reynolds, C.P.; Kang, M.H. Modulation of Glucocorticoid Resistance in Pediatric T-cell Acute Lymphoblastic Leukemia by Increasing BIM Expression with the PI3K/mTOR Inhibitor BEZ235. Clin. Cancer Res. 2016, 22, 621–632. [Google Scholar] [CrossRef] [Green Version]
- Andrews, S.; Krueger, F.; Segonds-Pichon, A.; Biggins, L.; Krueger, C.; Wingett, S. FastQC: A Quality Control Tool for High Throughput Sequence Data. 2010. Available online: http://www.bioinformatics.babraham.ac.uk/projects/ (accessed on 1 March 2020).
- Bolger, A.M.; Lohse, M.; Usadel, B. Trimmomatic: A flexible trimmer for Illumina sequence data. Bioinformatics 2014, 30, 2114–2120. [Google Scholar] [CrossRef] [PubMed] [Green Version]
- Kim, D.; Pertea, G.; Trapnell, C.; Pimentel, H.; Kelley, R.; Salzberg, S.L. TopHat2: Accurate alignment of transcriptomes in the presence of insertions, deletions and gene fusions. Genome Biol. 2013, 14, R36. [Google Scholar] [CrossRef] [PubMed] [Green Version]
- Li, H.; Handsaker, B.; Wysoker, A.; Fennell, T.; Ruan, J.; Homer, N.; Marth, G.; Abecasis, G.; Durbin, R.; 1000 Genome Project Data Processing Subgroup. The Sequence Alignment/Map format and SAMtools. Bioinformatics 2009, 25, 2078–2079. [Google Scholar] [CrossRef] [PubMed] [Green Version]
- Anders, S.; Pyl, P.T.; Huber, W. HTSeq—A Python framework to work with high-throughput sequencing data. Bioinformatics 2015, 31, 166–169. [Google Scholar] [CrossRef] [PubMed]
- Carlson, M. org.Hs.eg.db: Genome wide annotation for Human. R Package Version 2015, 312. [Google Scholar] [CrossRef]
- Love, M.I.; Huber, W.; Anders, S. Moderated estimation of fold change and dispersion for RNA-seq data with DESeq2. Genome Biol. 2014, 15, 550. [Google Scholar] [CrossRef] [Green Version]
- Hamed, M.; Trumm, J.; Spaniol, C.; Sethi, R.; Irhimeh, M.R.; Fuellen, G.; Paulsen, M.; Helms, V. Linking Hematopoietic Differentiation to Co-Expressed Sets of Pluripotency-Associated and Imprinted Genes and to Regulatory microRNA-Transcription Factor Motifs. PLoS ONE 2017, 12, e0166852. [Google Scholar] [CrossRef]
- Benjamini, Y.; Hochberg, Y. Controlling the False Discovery Rate: A Practical and Powerful Approach to Multiple Testing. J. R. Stat. Soc. Ser. B 1995, 57, 289–300. [Google Scholar] [CrossRef]
- Hamed, M.; Spaniol, C.; Nazarieh, M.; Helms, V. TFmiR: A web server for constructing and analyzing disease-specific transcription factor and miRNA co-regulatory networks. Nucleic Acids Res. 2015, 43, W283–W288. [Google Scholar] [CrossRef] [Green Version]
- Lu, M.; Shi, B.; Wang, J.; Cao, Q.; Cui, Q. TAM: A method for enrichment and depletion analysis of a microRNA category in a list of microRNAs. BMC Bioinform. 2010, 11, 419. [Google Scholar] [CrossRef] [Green Version]
- Li, J.; Han, X.; Wan, Y.; Zhang, S.; Zhao, Y.; Fan, R.; Cui, Q.; Zhou, Y. TAM 2.0: Tool for MicroRNA set analysis. Nucleic Acids Res. 2018, 46, W180–W185. [Google Scholar] [CrossRef] [PubMed] [Green Version]
- Nazarieh, M.; Wiese, A.; Will, T.; Hamed, M.; Helms, V. Identification of key player genes in gene regulatory networks. BMC Syst. Biol. 2016, 10, 88. [Google Scholar] [CrossRef] [PubMed] [Green Version]
- Smoot, M.E.; Ono, K.; Ruscheinski, J.; Wang, P.-L.; Ideker, T. Cytoscape 2.8: New features for data integration and network visualization. Bioinformatics 2010, 27, 431–432. [Google Scholar] [CrossRef] [Green Version]
- Yu, G.; Li, F.; Qin, Y.; Bo, X.; Wu, Y.; Wang, S. GOSemSim: An R package for measuring semantic similarity among GO terms and gene products. Bioinformatics 2010, 26, 976–978. [Google Scholar] [CrossRef] [PubMed]
- Brenner, A.K.; Nepstad, I.; Bruserud, Ø. Mesenchymal Stem Cells Support Survival and Proliferation of Primary Human Acute Myeloid Leukemia Cells through Heterogeneous Molecular Mechanisms. Front. Immunol. 2017, 8, 106. [Google Scholar] [CrossRef] [Green Version]
- Lee, M.W.; Ryu, S.; Kim, D.S.; Lee, J.W.; Sung, K.W.; Koo, H.H.; Yoo, K.H. Mesenchymal stem cells in suppression or progression of hematologic malignancy: Current status and challenges. Leukemia 2019, 33, 597–611. [Google Scholar] [CrossRef] [Green Version]
- Chiarini, F.; Lonetti, A.; Evangelisti, C.; Buontempo, F.; Orsini, E.; Evangelisti, C.; Cappellini, A.; Neri, L.M.; McCubrey, J.A.; Martelli, A.M. Advances in understanding the acute lymphoblastic leukemia bone marrow microenvironment: From biology to therapeutic targeting. Biochim. Biophys. Acta 2016, 1863, 449–463. [Google Scholar] [CrossRef]
- Passaro, D.; Irigoyen, M.; Catherinet, C.; Gachet, S.; Da Costa De Jesus, C.; Lasgi, C.; Tran Quang, C.; Ghysdael, J. CXCR4 is required for leukemia-initiating cell activity in T cell acute ymphoblastic leukemia. Cancer Cell 2015, 27, 769–779. [Google Scholar] [CrossRef] [Green Version]
- LaBar, B.; Suciu, S.; Willemze, R.; Muus, P.; Marie, J.-P.; Fillet, G.; Berneman, Z.; Jaksic, B.; Feremans, W.; Bron, M.; et al. Dexamethasone compared to prednisolone for adults with acute lymphoblastic leukemia or lymphoblastic lymphoma: Final results of the ALL-4 randomized, phase III trial of the EORTC Leukemia Group. Haematologica 2010, 95, 1489–1495. [Google Scholar] [CrossRef]
- Molina-Pinelo, S.; Carnero, A.; Rivera, F.; Estevez-Garcia, P.; Bozada, J.M.; Limon, M.L.; Benavent, M.; Gómez, J.; Pastor, M.D.; Chaves, M.; et al. MiR-107 and miR-99a-3p predict chemotherapy response in patients with advanced colorectal cancer. BMC Cancer 2014, 14, 656. [Google Scholar] [CrossRef] [Green Version]
- Chen, X.-P.; Chen, Y.-G.; Lan, J.-Y.; Shen, Z.-J. MicroRNA-370 suppresses proliferation and promotes endometrioid ovarian cancer chemosensitivity to cDDP by negatively regulating ENG. Cancer Lett. 2014, 353, 201–210. [Google Scholar] [CrossRef] [PubMed]
- Ortega, M.; Bhatnagar, H.; Lin, A.P.; Wang, L.; Aster, J.C.; Sill, H.; Aguiar, R.C.T. A microRNA-mediated regulatory loop modulates NOTCH and MYC oncogenic signals in B- and T-cell malignancies. Leukemia 2015, 29, 968–976. [Google Scholar] [CrossRef] [PubMed] [Green Version]
- Li, X.; Zhang, Y.; Zhang, Y.; Ding, J.; Wu, K.; Fan, D. Survival prediction of gastric cancer by a seven-microRNA signature. Gut 2010, 59, 579–585. [Google Scholar] [CrossRef] [PubMed]
- Kawaguchi, T.; Yan, L.; Qi, Q.; Peng, X.; Gabriel, E.M.; Young, J.; Liu, S.; Takabe, K. Overexpression of suppressive microRNAs, miR-30a and miR-200c are associated with improved survival of breast cancer patients. Sci. Rep. 2017, 7, 15945. [Google Scholar] [CrossRef] [PubMed] [Green Version]
- Teufel, M.; Seidel, H.; Köchert, K.; Meinhardt, G.; Finn, R.S.; Llovet, J.M.; Bruix, J. Biomarkers Associated With Response to Regorafenib in Patients With Hepatocellular Carcinoma. Gastroenterology 2019, 156, 1731–1741. [Google Scholar] [CrossRef] [Green Version]
- Tang, R.; Liang, L.; Luo, D.; Feng, Z.; Huang, Q.; He, R.; Gan, T.; Yang, L.; Chen, G. Downregulation of MiR-30a is Associated with Poor Prognosis in Lung Cancer. Med. Sci. Monit. 2015, 21, 2514–2520. [Google Scholar] [CrossRef] [Green Version]
- Pérez-Rivas, L.G.; Jerez, J.M.; Carmona, R.; De Luque, V.; Vicioso, L.; Claros, M.G.; Viguera, E.; Pajares, B.; Sánchez, A.; Ribelles, N.; et al. A microRNA Signature Associated with Early Recurrence in Breast Cancer. PLoS ONE 2014, 9, e91884. [Google Scholar] [CrossRef]
- Wang, T.; Chen, G.; Ma, X.; Yang, Y.; Chen, Y.; Peng, Y.; Bai, Z.; Zhang, Z.; Pei, H.; Guo, W. miR-30a regulates cancer cell response to chemotherapy through SNAI1/IRS1/AKT pathway. Cell Death Dis. 2019, 10, 153. [Google Scholar] [CrossRef]
- Forno, I.; Ferrero, S.; Russo, M.V.; Gazzano, G.; Giangiobbe, S.; Montanari, E.; Del Nero, A.; Rocco, B.M.C.; Albo, G.; Languino, L.R.; et al. Deregulation of MiR-34b/Sox2 Predicts Prostate Cancer Progression. PLoS ONE 2015, 10, e0130060. [Google Scholar] [CrossRef]
- Zhang, L.; Liao, Y.; Tang, L. MicroRNA-34 family: A potential tumor suppressor and therapeutic candidate in cancer. J. Exp. Clin. Cancer Res. 2019, 38, 53. [Google Scholar] [CrossRef] [Green Version]
- Edmonds, M.D.; Eischen, C.M. Differences in miRNA Expression in Early Stage Lung Adenocarcinomas that Did and Did Not Relapse. PLoS ONE 2014, 9, e101802. [Google Scholar] [CrossRef] [PubMed]
- Yeh, C.-H.; Moles, R.; Nicot, C. Clinical significance of microRNAs in chronic and acute human leukemia. Mol. Cancer 2016, 15, 37. [Google Scholar] [CrossRef] [PubMed] [Green Version]
- Agirre, X.; Vilas-Zornoza, A.; Jiménez-Velasco, A.; Martin-Subero, J.I.; Cordeu, L.; Gárate, L.; José-Eneriz, E.S.; Abizanda, G.; Rodríguez-Otero, P.; Fortes, P.; et al. Epigenetic silencing of the tumor suppressor microRNA Hsa-miR-124a regulates CDK6 expression and confers a poor prognosis in acute lymphoblastic leukemia. Cancer Res. 2009, 69, 4443–4453. [Google Scholar] [CrossRef] [Green Version]
- Sugita, F.; Maki, K.; Nakamura, Y.; Sasaki, K.; Mitani, K. Overexpression ofMIR9indicates poor prognosis in acute lymphoblastic leukemia. Leuk. Lymphoma 2013, 55, 78–86. [Google Scholar] [CrossRef] [PubMed]
- Liang, Y.-N.; Tang, Y.-L.; Ke, Z.-Y.; Chen, Y.-Q.; Luo, X.-Q.; Zhang, H.; Huang, L.-B. MiR-124 contributes to glucocorticoid resistance in acute lymphoblastic leukemia by promoting proliferation, inhibiting apoptosis and targeting the glucocorticoid receptor. J. Steroid Biochem. Mol. Biol. 2017, 172, 62–68. [Google Scholar] [CrossRef]
- Oliveira, L.H.; Schiavinato, J.L.; Fráguas, M.S.; Lucena-Araujo, A.R.; Haddad, R.; Araújo, A.G.; Dalmazzo, L.F.; Rego, E.M.; Covas, D.T.; Zago, M.A.; et al. Potential roles of microRNA-29a in the molecular pathophysiology of T-cell acute lymphoblastic leukemia. Cancer Sci. 2015, 106, 1264–1277. [Google Scholar] [CrossRef]
- Butrym, A.; Baczynska, D.; Tukiendorf, A.; Rybka, J.; Dobosz, T.; Jurczak, W.; Kuliczkowski, K.; Mazur, G. High Expression of Mir-15a Predicts Shorter Survival and Worse Response to Chemotherapy in Patients with Acute Myeloid Leukemia (AML). Blood 2014, 124, 5330. [Google Scholar] [CrossRef]
- Calin, G.; Croce, C.M. Chronic lymphocytic leukemia: Interplay between noncoding RNAs and protein-coding genes. Blood 2009, 114, 4761–4770. [Google Scholar] [CrossRef] [Green Version]
- Qi, H.-X.; Cao, Q.; Sun, X.-Z.; Zhou, W.; Hong, Z.; Hu, J.; Juan, C.-X.; Li, S.; Kuai, W.-X. MiR-410 regulates malignant biological behavior of pediatric acute lymphoblastic leukemia through targeting FKBP5 and Akt signaling pathway. Eur. Rev. Med. Pharmacol. Sci. 2018, 22, 8797–8804. [Google Scholar]
- Chirshev, E.; Oberg, K.C.; Ioffe, Y.J.; Unternaehrer, J.J. Let-7as biomarker, prognostic indicator, and therapy for precision medicine in cancer. Clin. Transl. Med. 2019, 8, 24. [Google Scholar] [CrossRef] [Green Version]
- Huang, Y.; Hong, X.; Hu, J.; Lu, Q. Targeted regulation of miR-98 on E2F1 increases chemosensitivity of leukemia cells K562/A02. OncoTargets Ther. 2017, 10, 3233–3239. [Google Scholar] [CrossRef] [PubMed] [Green Version]
- Horibata, S.; Gui, G.; Lack, J.; DeStefano, C.B.; Gottesman, M.M.; Hourigan, C.S. Heterogeneity in refractory acute myeloid leukemia. Proc. Natl. Acad. Sci. USA 2019, 116, 10494–10503. [Google Scholar] [CrossRef] [PubMed] [Green Version]
- Qin, T.; Zhao, H.; Shao, Y.; Hu, N.; Shi, J.; Fu, L.; Zhang, Y. High expression of AK1 predicts inferior prognosis in acute myeloid leukemia patients undergoing chemotherapy. Biosci. Rep. 2020, 40, 1–10. [Google Scholar] [CrossRef] [PubMed]
- Aly, R.M.; Ghazy, H.F. Prognostic significance ofMSI2predicts unfavorable outcome in adult B-acute lymphoblastic leukemia. Int. J. Lab. Hematol. 2014, 37, 272–278. [Google Scholar] [CrossRef]
- Zhao, H.Z.; Jia, M.; Luo, Z.B.; Cheng, Y.P.; Xu, X.J.; Zhang, J.Y.; Li, S.S.; Tang, Y.M. Prognostic significance of the Musashi-2 (MSI2) gene in childhood acute lymphoblastic leukemia. Neoplasma 2016, 63, 150–157. [Google Scholar] [CrossRef] [Green Version]
- Schubert, C.; Allhoff, M.; Tillmann, S.; Maié, T.; Costa, I.G.; Lipka, D.B.; Schemionek, M.; Feldberg, K.; Baumeister, J.; Brümmendorf, T.H.; et al. Differential roles of STAT1 and STAT2 in the sensitivity of JAK2V617F- vs. BCR-ABL-positive cells to interferon alpha. J. Hematol. Oncol. 2019, 12, 36. [Google Scholar] [CrossRef]
- Hodson, D.J.; Shaffer, A.L.; Xiao, W.; Wright, G.W.; Schmitz, R.; Phelan, J.D.; Yang, Y.; Webster, D.E.; Rui, L.; Kohlhammer, H.; et al. Regulation of normal B-cell differentiation and malignant B-cell survival by OCT2. Proc. Natl. Acad. Sci. USA 2016, 113, E2039–E2046. [Google Scholar] [CrossRef] [Green Version]
- Advani, A.S.; Lim, K.; Gibson, S.; Shadman, M.; Jin, T.; Copelan, E.; Kalaycio, M.; Sekeres, M.A.; Sobecks, R.; Hsi, E. OCT-2 expression and OCT-2/BOB.1 co-expression predict prognosis in patients with newly diagnosed acute myeloid leukemia. Leuk. Lymphoma 2010, 51, 606–612. [Google Scholar] [CrossRef]
- Sailo, B.L.; Banik, K.; Girisa, S.; Bordoloi, D.; Fan, L.; Halim, C.E.; Wang, H.; Kumar, A.P.; Zheng, D.; Mao, X.; et al. FBXW7 in Cancer: What Has Been Unraveled Thus Far? Cancers 2019, 11, 246. [Google Scholar] [CrossRef] [Green Version]
- Franke, N.E.; Kaspers, G.L.; Assaraf, Y.G.; Van Meerloo, J.; Niewerth, D.; Kessler, F.L.; Poddighe, P.J.; Kole, J.; Smeets, S.J.; Ylstra, B.; et al. Exocytosis of polyubiquitinated proteins in bortezomib-resistant leukemia cells: A role for MARCKS in acquired resistance to proteasome inhibitors. Oncotarget 2016, 7, 74779–74796. [Google Scholar] [CrossRef] [Green Version]
- Yang, Y.; Chen, Y.; Saha, M.N.; Chen, J.; Evans, K.; Qiu, L.; Reece, D.; Chen, G.; Chang, H. Targeting phospho-MARCKS overcomes drug-resistance and induces antitumor activity in preclinical models of multiple myeloma. Leukemia 2015, 29, 715–726. [Google Scholar] [CrossRef] [PubMed]
- Lebedev, T.; Vagapova, E.; Popenko, V.I.; Leonova, O.G.; Spirin, P.V.; Prassolov, V.S. Two Receptors, Two Isoforms, Two Cancers: Comprehensive Analysis of KIT and TrkA Expression in Neuroblastoma and Acute Myeloid Leukemia. Front. Oncol. 2019, 9, 1046. [Google Scholar] [CrossRef] [PubMed]
- Cloos, J.; Roeten, M.S.; Franke, N.E.; Van Meerloo, J.; Zweegman, S.; Kaspers, G.J.; Jansen, G. (Immuno)proteasomes as therapeutic target in acute leukemia. Cancer Metastasis Rev. 2017, 36, 599–615. [Google Scholar] [CrossRef] [PubMed]
- Kang, H.; Wilson, C.S.; Harvey, R.C.; Chen, I.-M.; Murphy, M.H.; Atlas, S.R.; Bedrick, E.J.; Devidas, M.; Carroll, A.J.; Robinson, B.W.; et al. Gene expression profiles predictive of outcome and age in infant acute lymphoblastic leukemia: A Children’s Oncology Group study. Blood 2012, 119, 1872–1881. [Google Scholar] [CrossRef] [PubMed]
- Wang, T.; Cheng, C.; Peng, L.; Gao, M.; Xi, M.; Rousseaux, S.; Khochbin, S.; Wang, J.; Mi, J. Combination of arsenic trioxide and Dasatinib: A new strategy to treat Philadelphia chromosome-positive acute lymphoblastic leukaemia. J. Cell. Mol. Med. 2017, 22, 1614–1626. [Google Scholar] [CrossRef] [Green Version]


Publisher’s Note: MDPI stays neutral with regard to jurisdictional claims in published maps and institutional affiliations. |
© 2022 by the authors. Licensee MDPI, Basel, Switzerland. This article is an open access article distributed under the terms and conditions of the Creative Commons Attribution (CC BY) license (https://creativecommons.org/licenses/by/4.0/).
Share and Cite
Gladbach, Y.S.; Sklarz, L.-M.; Roolf, C.; Beck, J.; Schütz, E.; Fuellen, G.; Junghanss, C.; Murua Escobar, H.; Hamed, M. Molecular Characterization of the Response to Conventional Chemotherapeutics in Pro-B-ALL Cell Lines in Terms of Tumor Relapse. Genes 2022, 13, 1240. https://doi.org/10.3390/genes13071240
Gladbach YS, Sklarz L-M, Roolf C, Beck J, Schütz E, Fuellen G, Junghanss C, Murua Escobar H, Hamed M. Molecular Characterization of the Response to Conventional Chemotherapeutics in Pro-B-ALL Cell Lines in Terms of Tumor Relapse. Genes. 2022; 13(7):1240. https://doi.org/10.3390/genes13071240
Chicago/Turabian StyleGladbach, Yvonne Saara, Lisa-Madeleine Sklarz, Catrin Roolf, Julia Beck, Ekkehard Schütz, Georg Fuellen, Christian Junghanss, Hugo Murua Escobar, and Mohamed Hamed. 2022. "Molecular Characterization of the Response to Conventional Chemotherapeutics in Pro-B-ALL Cell Lines in Terms of Tumor Relapse" Genes 13, no. 7: 1240. https://doi.org/10.3390/genes13071240