Article

Gene Conversion Explains Elevated Diversity in the Immunity Modulating APL1 Gene of the Malaria Vector Anopheles funestus

1
Department of Vector Biology, Liverpool School of Tropical Medicine, Liverpool L3 5QA, UK
2
LSTM Research Unit, Centre for Research in Infectious Diseases (CRID), Yaoundé P.O. Box 13591, Cameroon
3
School of Biological and Environmental Sciences, Liverpool John Moores University, Byrom Street, Liverpool L3 3AF, UK
*
Author to whom correspondence should be addressed.
Genes 2022, 13(6), 1102; https://doi.org/10.3390/genes13061102
Submission received: 20 May 2022 / Revised: 16 June 2022 / Accepted: 17 June 2022 / Published: 20 June 2022
(This article belongs to the Special Issue Adaptive Evolution of Insects)

Abstract

:
Leucine-rich repeat proteins and antimicrobial peptides are the key components of the innate immune response to Plasmodium and other microbial pathogens in Anopheles mosquitoes. The APL1 gene of the malaria vector Anopheles funestus has exceptional levels of non-synonymous polymorphism across the range of An. funestus, with an average πn of 0.027 versus a genome-wide average of 0.002, and πn is consistently high in populations across Africa. Elevated APL1 diversity was consistent between the independent pooled-template and target-enrichment datasets, however no link between APL1 diversity and insecticide resistance was observed. Although lacking the diversity of APL1, two further mosquito innate-immunity genes of the gambicin anti-microbial peptide family had πns ratios greater than one, possibly driven by either positive or balancing selection. The cecropin antimicrobial peptides were expressed much more highly than other anti-microbial peptide genes, a result discordant with current models of anti-microbial peptide activity. The observed APL1 diversity likely results from gene conversion between paralogues, as evidenced by shared polymorphisms, overlapping read mappings, and recombination events among paralogues. In conclusion, we hypothesize that higher gene expression of APL1 than its paralogues is correlated with a more open chromatin formation, which enhances gene conversion and elevated diversity at this locus.

Graphical Abstract

1. Introduction

In 2018, there were 228 million cases of malaria worldwide, leading to 405,000 deaths. The majority of the cases (93%) and deaths (94%) occurred in Sub-Saharan Africa, and Plasmodium falciparum was overwhelmingly responsible (>99%) [1]. P. falciparum is vectored by Anopheles mosquitoes, and vector competence (susceptibility to Plasmodium) varies greatly between species, due to the action of immune genes [2,3]. Furthermore, rising insecticide resistance may increase or decrease the vector competence of Anopheles mosquitoes by stimulating or blocking mosquito immune responses [4].
Insects lack the adaptive immune response of vertebrates, relying entirely on a powerful, innate immune system to fight pathogens. Mosquitoes are no exception, employing a complement-like system acting in the hemolymph that identifies and targets pathogens for destruction [5]. In the Anopheles species the complement-based response to Plasmodium and pathogenic microbes is mediated by a dimer of Anopheles Plasmodium-responsive leucine-rich repeat protein 1 (APL1) and Leucine-Rich Immune Molecule 1 (LRIM1), which form a complex with the thioester-containing protein 1 (TEP1) [6], a homologue of the vertebrate complement protein C3. Together, this complex recognizes pathogens of bacterial and fungal origin, in addition to the ookinete stage of Plasmodium, and triggers a cascade that eliminates them through either lysis or melanization [7,8]. Another component of the Anopheles innate immune systems is the anti-microbial peptides (AMPs), which have a range of antibacterial, antifungal and antiviral activities [9]. They help to make insects extremely resistant to bacterial infection through multiple mechanisms, including membrane destruction, interfering with pathogen metabolism and by targeting cytoplasmic components [9]. Insect AMPs are split into five families, which are variable in presence and copy number across the mosquito species [10]. A cysteine-rich AMP named gambicin was marginally lethal to Plasmodium berghei ookinetes [11]. Despite these defense mechanisms, P. falciparum is still well able to evade detection by mosquito immunity complexes through the action of the Pfs47 surface protein and mosquito receptor in a ‘lock and key’ fashion [12,13].
Among the Anopheles mosquitoes, the sibling species Anopheles gambiae and Anopheles coluzzii of the An. gambiae species complex have the best studied set of APL, LRIM and TEP genes. Silencing any one of these genes in these species enhances Plasmodium infectivity [14,15]. Of particular note are the presence of Plasmodium-resistant strains of An. gambiae sensu lato, due to the circulating alleles of these genes [16,17]. The APL1 and TEP1 genes have elevated genetic diversity compared to background levels and have undergone selective sweeps [18,19]. In the ancestral lineage to the An. gambiae complex and Anopheles christyi, the APL1 locus duplicated to form three copies (labelled A, B and C) [20], but remains as a single locus in the other Anopheles species, including Anopheles funestus. Outside the An. gambiae complex, RNAi-mediated silencing of the single-copy APL1 in Anopheles stephensi results in increased mortality, which is rescued by antibiotics [20]. Specifically, APL1 in An. stephensi modulates the abundance of the Klebsiella and Cedecea bacteria of the Enterobacteriaceae family [21], both of which are naturally found in Anopheles microbiomes. Reyes Ruiz et al. (2019) proposed two models for how the APL1/LRIM1/TEP1 complex acts to eliminate pathogens. In the first model, the complex acts as a recognition molecule that changes conformation on pathogen-binding which activates a zymogen protease; in the second model, the pathogen surface is recognized by another molecule that activates a protease of hemolymph APL1, leading to the release of a processed form of TEP1 in the pathogen’s vicinity [8].
The observations of exceptional polymorphism and maintenance of alleles at the APL1 and TEP1 loci in the An. gambiae complex were consistent with gene conversion versus alternative possibilities, such as balancing selection [18,19]. However, balancing selection is thought to explain similarly raised levels of genetic diversity seen in the AMPs of four populations of Drosophila melanogaster [22] and is possibly acting on gambicin in An. gambiae [23]. By contrast to APL1 and TEP1 loci, the third component of the complement complex, LRIM1, has not been associated with higher diversity in An. gambiae [19,24]. An adaptive role for APL1- and TEP1-elevated diversity may reflect protection against a variety of microbial pathogens that vary across a mosquito species’ ranges and seasonality [18,20]. however, high diversity of APL1 is not a genus-wide trait; in An. stephensi the single-copy of APL1 exhibits low genetic diversity in an Iranian-sampled population [20]. This could reflect a locally stable microbiome of enteric taxa that places APL1 under purifying selection. In An. stephensi, APL1 has a dual function against Cedecea and Klebsiella enterobacteria, and Plasmodium, which was demonstrated with Plasmodium yoelii following the depletion of APL1 [20,21]. An. gambiae s. l. APL1 differs as the three APL1 proteins protect against Plasmodium infection, but not pathogenic bacteria [20], meaning an alternative mechanism must perform anti-bacterial responses.
An. funestus is one of the major vector species of P. falciparum in sub-Saharan Africa. It is widespread across Sub-Saharan Africa, and in several regions, it is the dominant vector of malaria [25,26]. As a member of the An. funestus group it is phylogenetically distant from An. gambiae, Anopheles arabiensis and An. coluzzii of the An. gambiae species complex. Historically, it has been more difficult to breed and maintain laboratory colonies, until the introduction of forced egg-laying techniques [27]. Together, these factors have left An. funestus less well-studied in many aspects of its biology, relative to the other malaria vector species. Indeed, a chromosome-level genome assembly became available much later than for the An. gambiae complex species [28]. Despite this prior resource deficit, the molecular basis of resistance to pyrethroid insecticides is, arguably, best understood in this species, with several metabolic resistance-conferring variants identified in cytochrome p450 and glutathione-S-transferase (GST) genes using both whole genome sequencing and targeted enrichment sequencing approaches and subsequently functionally validated [29,30,31]. Over-expression of GSTs creates a possible point of crosstalk between resistance and immunity, as the over expressed GSTs may neutralize reactive oxidative species (ROS), which are a key component of insect immune response to Plasmodium [4,32]. There may also be an energetic trade-off between the over expression of metabolic resistance genes such as GSTs and the robustness of immune responses to Plasmodium and other pathogens [4,32]. An. funestus encodes single-copy orthologues of the APL1, LRIM1 and TEP1 complement genes with paralogues for each gene (VectorBase genome annotation, version 51). This is particularly so for the TEP-family genes, which may reflect a Diptera-wide trend for expansion in this family [33,34]. The An. funestus genome also encodes 11 AMP genes of the defensin, cecropin, attacin and gambicin families, but lacks the diptericin gene (in annotation version 51) [28].
Here, we assessed the genetic diversity of the APL1/TEP1/LRIM1 and AMP innate immunity genes in An. funestus for the first time, using a combination of genomic and expression datasets. Among the AMP genes we found that two gambicin genes have elevated πns ratios concordant with ongoing selection alongside a high expression of cecropins across the An. funestus populations. Principally, we show that the key Plasmodium and Gram-negative bacteria response gene APL1 has high non-synonymous (πn) and synonymous (πs) diversities versus genome-wide averages for this species. Multiple sources of evidence, including read mappings, shared polymorphisms and recombination between the APL paralogues, suggest that non-homologous gene conversion plays a key role in the elevated diversities.

2. Materials and Methods

2.1. Identifying APL, LRIM, TEP and AMP Genes in An. funestus

We selected immune genes that were directly annotated as APL, LRIM, TEP and AMP genes (a) from the An. funestus AfunF3.1 gene-set; (b) the genes that were designated as orthologues of An. gambiae (AgamP1.10) genes of each category in VectorBase; and (c) the An. funestus paralogues for genes selected by criteria (a) and (b). VectorBase defines the orthologues and paralogues using OrthoMCL [35].

2.2. Variant Prediction from Genome-Wide Pooled-Sequencing

Read data for pooled-template whole genome sequencing (PoolSeq), target-enriched individual genome sequencing (SureSelect) and RNA-sequencing (RNAseq) analyses are available in the European Nucleotide Archive under accessions PRJEB13485, PRJEB24384, PRJEB35040, PRJEB24351, PRJEB24520, PRJEB47287, PRJEB48958 and PRJEB24506 [29,31,36,37]. The pooled-sequencing data for ten F0 populations of An. funestus from eight locations and two lab strains [29,36] were aligned to the AfunF3.1 genome assembly [28] with BWA (0.7.17) (sampling locations and alignment metrics, Table S1, Supplementary Materials). Alignment bam files were sorted, duplicates removed with Picard (2.18.15-0) [38] and converted to mpileup format in Samtools (1.9) [39]. Variants were identified with Varscan (mpileup2cns, version 2.4.3) [40,41] with a p-value threshold of 0.05 and a minimum allele frequency of 0.01. Variants were left-aligned, normalized, split into biallelic sites, and SNPs filtered within 20 bp of an indel in bcftools (1.9) [39]. The SNP effects were predicted in SnpEff (v4.3) [42] using a custom An. funestus database created from the AfunF3 genome. The population genetic parameters were estimated for annotated genes using SNPGenie (version 2019.10.31) [43], filtered variants, and the AfunF3.1 genome annotation. The additional genes were noted if they had high diversities and could be linked to immune function. Per gene and exon average read coverage depths were calculated in Jvarkit (version d9efbd3, https://github.com/lindenb/jvarkit, accessed on 23 April 2020) “bamstats05.jar” from bam alignment files to compare per-gene coverages versus genome-wide averages.

2.3. Targeted Sequencing of Candidate Resistance Genes and Regions

To identify the APL1 variant sites with allele frequencies significantly associated with resistant phenotypes, we analyzed a targeted enrichment experiment, based on the genes with a potential role in insecticide resistance (see [37] for further details). For the populations of An. funestus from Malawi and Uganda, we selected ten mosquitoes that died after 60 min exposure to permethrin and ten mosquitoes still alive after 180 min exposure. Due to lower resistance levels in Cameroon, the mosquitoes that died after 20 min exposure to permethrin or were alive after 60 min were collected. Ten individuals each from the susceptible FANG lab strain originating in Angola, and the FUMOZ pyrethroid-resistant strain originating in Mozambique were also included [44]. In short, a selection of potentially resistance-related genes, including heat shock proteins, odorant binding proteins, detoxification genes and immune response genes, and all of the known target-site resistance genes’ sequences from An. funestus [37]. Additionally, all of the genes in the major quantitative trait loci associated with pyrethroid resistance were included. These were a 120 kb region BAC clone of the rp1 (resistance to pyrethroid 1) locus containing the CYP6 P450 gene cluster on chromosome 2R and the 113kb region BAC clone sequence for rp2 on chromosome 2L [45]. A total of 1302 target sequences were included. The baits were designed using the SureSelect DNA Advanced Design Wizard of the eArray program of Agilent; the library preparation and sequencing were performed by the Centre for Genomic Research (CGR), University of Liverpool, using the SureSelect target enrichment custom kit. The libraries were pooled in equimolar amounts and sequenced in 2 × 150 bp paired-end fragments on an Illumina MiSeq with 20 samples per run (version 4 chemistry).
The alignment, sorting and duplicate removal of the SureSelect data for 80 individuals were the same as for the pooled sequencing. The variants were called in freebayes (v1.3.2) and filtered for a phred-scaled quality score greater than 20 with ‘vcffilter’ of vcflib (v1.0.0) [46]. Only the genes with an average coverage of over 500 calculated in Jvarkit from all of the pooled individuals were retained for population genetic analyses. The diploid SureSelect variant data were then phased, using WhatsHap [47]. The phased SNP-only genotypes for 160 haploid genomes were converted into fasta sequences in bcftools. The immune genes of interest were extracted from haplotype genomes using GffRead [48] and aligned in muscle [49] to ensure correct positioning across the haplotypes. Kimura’s 2-parameter distance haplotype networks were constructed in the R package pegas, as were per gene Tajima’s D estimates and p-values to indicate the population structure and the directional or balancing selection at each locus [50].

2.4. Fst-Based Associations between Resistant and Susceptible Mosquitoes within Each Country

Non-synonymous and synonymous annotated SNPs for immune genes separately, and the whole of chromosome 2, were input to the R package poolfstat (v2.0.0) in variant calling format (VCF) for global Fst estimates from African populations [51]. An Fst-based association study was performed on APL1 variants between the ten susceptible (dead) and ten resistant (alive) mosquitoes generated by the SureSelect experiment. The pFst (https://github.com/vcflib/vcflib, accessed on 6 April 2021) tool was run on the freebayes-predicted variants (applying flag “—type GL” in pFst). The analysis was restricted to bi-allelic coding sequence variants, and the resulting p-values were false discovery rate adjusted using qvalues [52] package in R, and with a threshold of 0.05 applied.

2.5. Gene Expression of APL1, TEP and LRIM Genes

The RNASeq data for 46 replicates of An. funestus (first published in Weedall et al., 2019) from Ghana, Uganda, Cameroon, Malawi, FANG and FUMOZ were aligned to the genome using the subread aligner (2.0.1) and quantified using featureCounts of the Subread package [53]. The raw counts were converted to transcripts per million (TPM) values (following http://ny-shao.name/2016/11/18/a-short-script-to-calculate-rpkm-and-tpm-from-featurecounts-output.html, accessed on 17 September 2021) to allow comparison between the genes, and the average TPM per gene calculated from all of the replicates combined. These RNASeq data were generated from the total RNA of mosquitoes that survived exposure to pyrethroids (resistant) and DDT, or that were not exposed to insecticides (control) and the resistant (FUMOZ) and susceptible (FANG) laboratory strains. A differential gene expression analysis between countries (combined by insecticide treatment) and the FANG and FUMOZ laboratory strains was performed on the raw counts in DESeq2, using the iDEP server (version 94) [54]. The counts were filtered to include only genes with a minimum count per million of 0.5 in at least four libraries. All of the 15 possible pairwise contrasts were tested, with a false discovery rate cut-off of 0.05 used to accept significance. Of the 13,144 genes that passed iDEP filtering, only the results for immunity genes of the AMP, APL, LRIM, TEP family genes and their paralogues were investigated further.

2.6. Identifying Shared Polymorphisms and Recombination between APL1 Paralogues

The discordantly mapped read pairs, in which each read of the pair mapped to a different paralogue, were quantified for each population. These discordantly mapped pairs may result from gene conversion homogenizing sequences between paralogues, or, if spurious, lead to inflated diversity estimates of APL1 and paralogues. The discordant mappings were removed for each paralogue by filtering the unmapped, secondary and supplementary alignments in Samtools. The variants were recalled for these genes in Varscan, annotated with SnpEff, and gene-wide diversity metrics and coverages re-inferred with SNPGenie and bamstats05, respectively. To identify the shared polymorphisms in the stringently remapped data, a codon-aware alignment of the five paralogues was created in macse2 (v2.05), and the Varscan-predicted synonymous and non-synonymous SNPs per gene were converted to positions in the multiple sequence alignment. The VCF files for each position were then combined to identify the shared polymorphisms’ positions. Secondly, the locations of discordant mappings with predicted insert sizes greater than 10,000 bp were identified and counted for each paralogue by intersecting the read pair mapping with gene annotations in bedtools for PoolSeq and SureSelect data. A Venn diagram of the shared polymorphisms between APL paralogues was created, using jvenn [55].
The recombination between the paralogues was tested with GARD (Genetic Algorithm in Recombination Detection) on the Datamonkey Adaptive Evolution Server. GARD was run with defaults and with ‘General Discrete’ site-to-site variation and three rate classes, to check consistency between parameters. The coiled coil domains were predicted for each paralogue, using DeepCoil2 [56].

3. Results

3.1. Immune Gene Complements of An. funestus

We identified one copy of APL1 (AFUN018743) syntenic with APL1C in An. gambiae and 4 paralogues, 13 LRIM genes and 36 TEP genes in the An. funestus genome annotation. Their designations and chromosomal locations are given in Table S2 (Supplementary Materials). The An. funestus APL1 and the four paralogues all encode a leucine-rich repeat domain and two 3′ end coiled coils, similar to their orthologues in An. gambiae. None of the An. funestus APL1 genes, however, share the repeated amino acid motif ‘P-A-N-G-G-L’ present in the 5′ end of An. gambiae APL1C. None of the four paralogues of APL1: AFUN018581; AFUN000279; AFUN000288 and AFUN000597 are syntenic with APL1A/B/C of An. gambiae. All five of the An. funestus genes are orthologous to the APL1 of An. stephensi (ASTEI02571) which lacks paralogues [20], while only APL1/AFUN018743 is syntenic. The phylogenetically closest species to An. funestus with VectorBase genome annotations are Anopheles culicafacies and Anopheles minimus. Both species encode three genes orthologous only to the five APL1-like genes of An. funestus. The TEP and LRIM genes, TEP1 (AFUN018758) and LRIM1 (AFUN005964), orthologues were defined by synteny to their An. gambiae equivalents in VectorBase (AGAP010815 and AGAP006348, respectively). Most of the APL1, LRIM and TEP-like genes are present on chromosome 3, with eight on chromosome 2 and zero on the X chromosome.
Two anti-microbial peptide-family gambicin genes (AFUN006610 and AFUN006611) are encoded in the An. funestus genome, which occur consecutively on chromosome 2 (around position 65.13 mb). A third consecutive gene, AFUN006612, is a VectorBase paralogue of AFUN006611 but is annotated as an unspecified product. Other AMP genes identified include the four cecropins, four defensins and one attacin gene; only diptericin is lacking from the An. funestus genome.

3.2. APL1 Has Elevated Diversity

The complete PoolSeq and SureSelect datasets consisted of 12,968 and 952 genes with SNPgenie polymorphism data, respectively. In the PoolSeq data, 229 genes had a πN/πS ratio greater than one, 36 of which were annotated with functions, including one of the gambicin genes (AFUN006610), two of the defensin genes (AFUN016516 and AFUN016588), two salivary gland proteins (AFUN016070 and AFUN016250) and a cuticular protein RR-1 (AFUN000936). Of the genes included in the targeted-enrichment data, πN/πS was greater than one for the same gambicin, but not for the salivary gland and cuticular protein genes.
In both PoolSeq and SureSelect data, An. funestus APL1 is an outlier in diversity levels compared to genes of a similar length (nonsynonymous sites polymorphism πN, Figure 1) with a πN of 0.027 and a πS of 0.036 in the PoolSeq data (Table 1 and Table S3, Supplementary Materials). Both were elevated against genome-wide averages of 0.002 and 0.021 for πN and πS, respectively (Table S4, Supplementary Materials). This was consistent across the populations, including the insecticide-susceptible lab strain FANG, with πN ranging from 0.023–0.030 (Table S4, Supplementary Materials). The APL1 paralogues also had elevated diversities, although to a lesser extent (Table 1). When ranked by PoolSeq πN values, APL1 had the 15th highest values of the 12,968 genes included, and only three of those with greater πN were from genes with greater than 400 nonsynonymous sites (Table S3, Supplementary Materials). The immunity genes of the LRIM and TEP families do not show similarly elevated diversities, with the highest per gene πN value of 0.013 (AFUN005964/LRIM1) and 0.017, respectively (Table S3, Supplementary Materials), nor do any of the genes from these families have a πNs ratio of greater than one. The TEP gene with the highest πN (AFUN019003) had no synteny to other TEP genes in VectorBase. The average coverage of each gene from the PoolSeq data indicated that APL1 and paralogue AFUN018581 have elevated coverage versus genome-wide means across the populations (Table 2), however, the coverage profiles of these genes were both lower (less than two-fold genome averages) and dissimilar in shape to those of known An. funestus duplication events (Figure S1, Supplementary Materials, for comparison with a known duplication). Instead of a sharp well-defined region of doubled (or more) coverage, as seen for duplications, the regions of increased coverage are non-uniform across these genes. This suggests that an alternative explanation, such as gene conversion, explains the observed coverage variability.

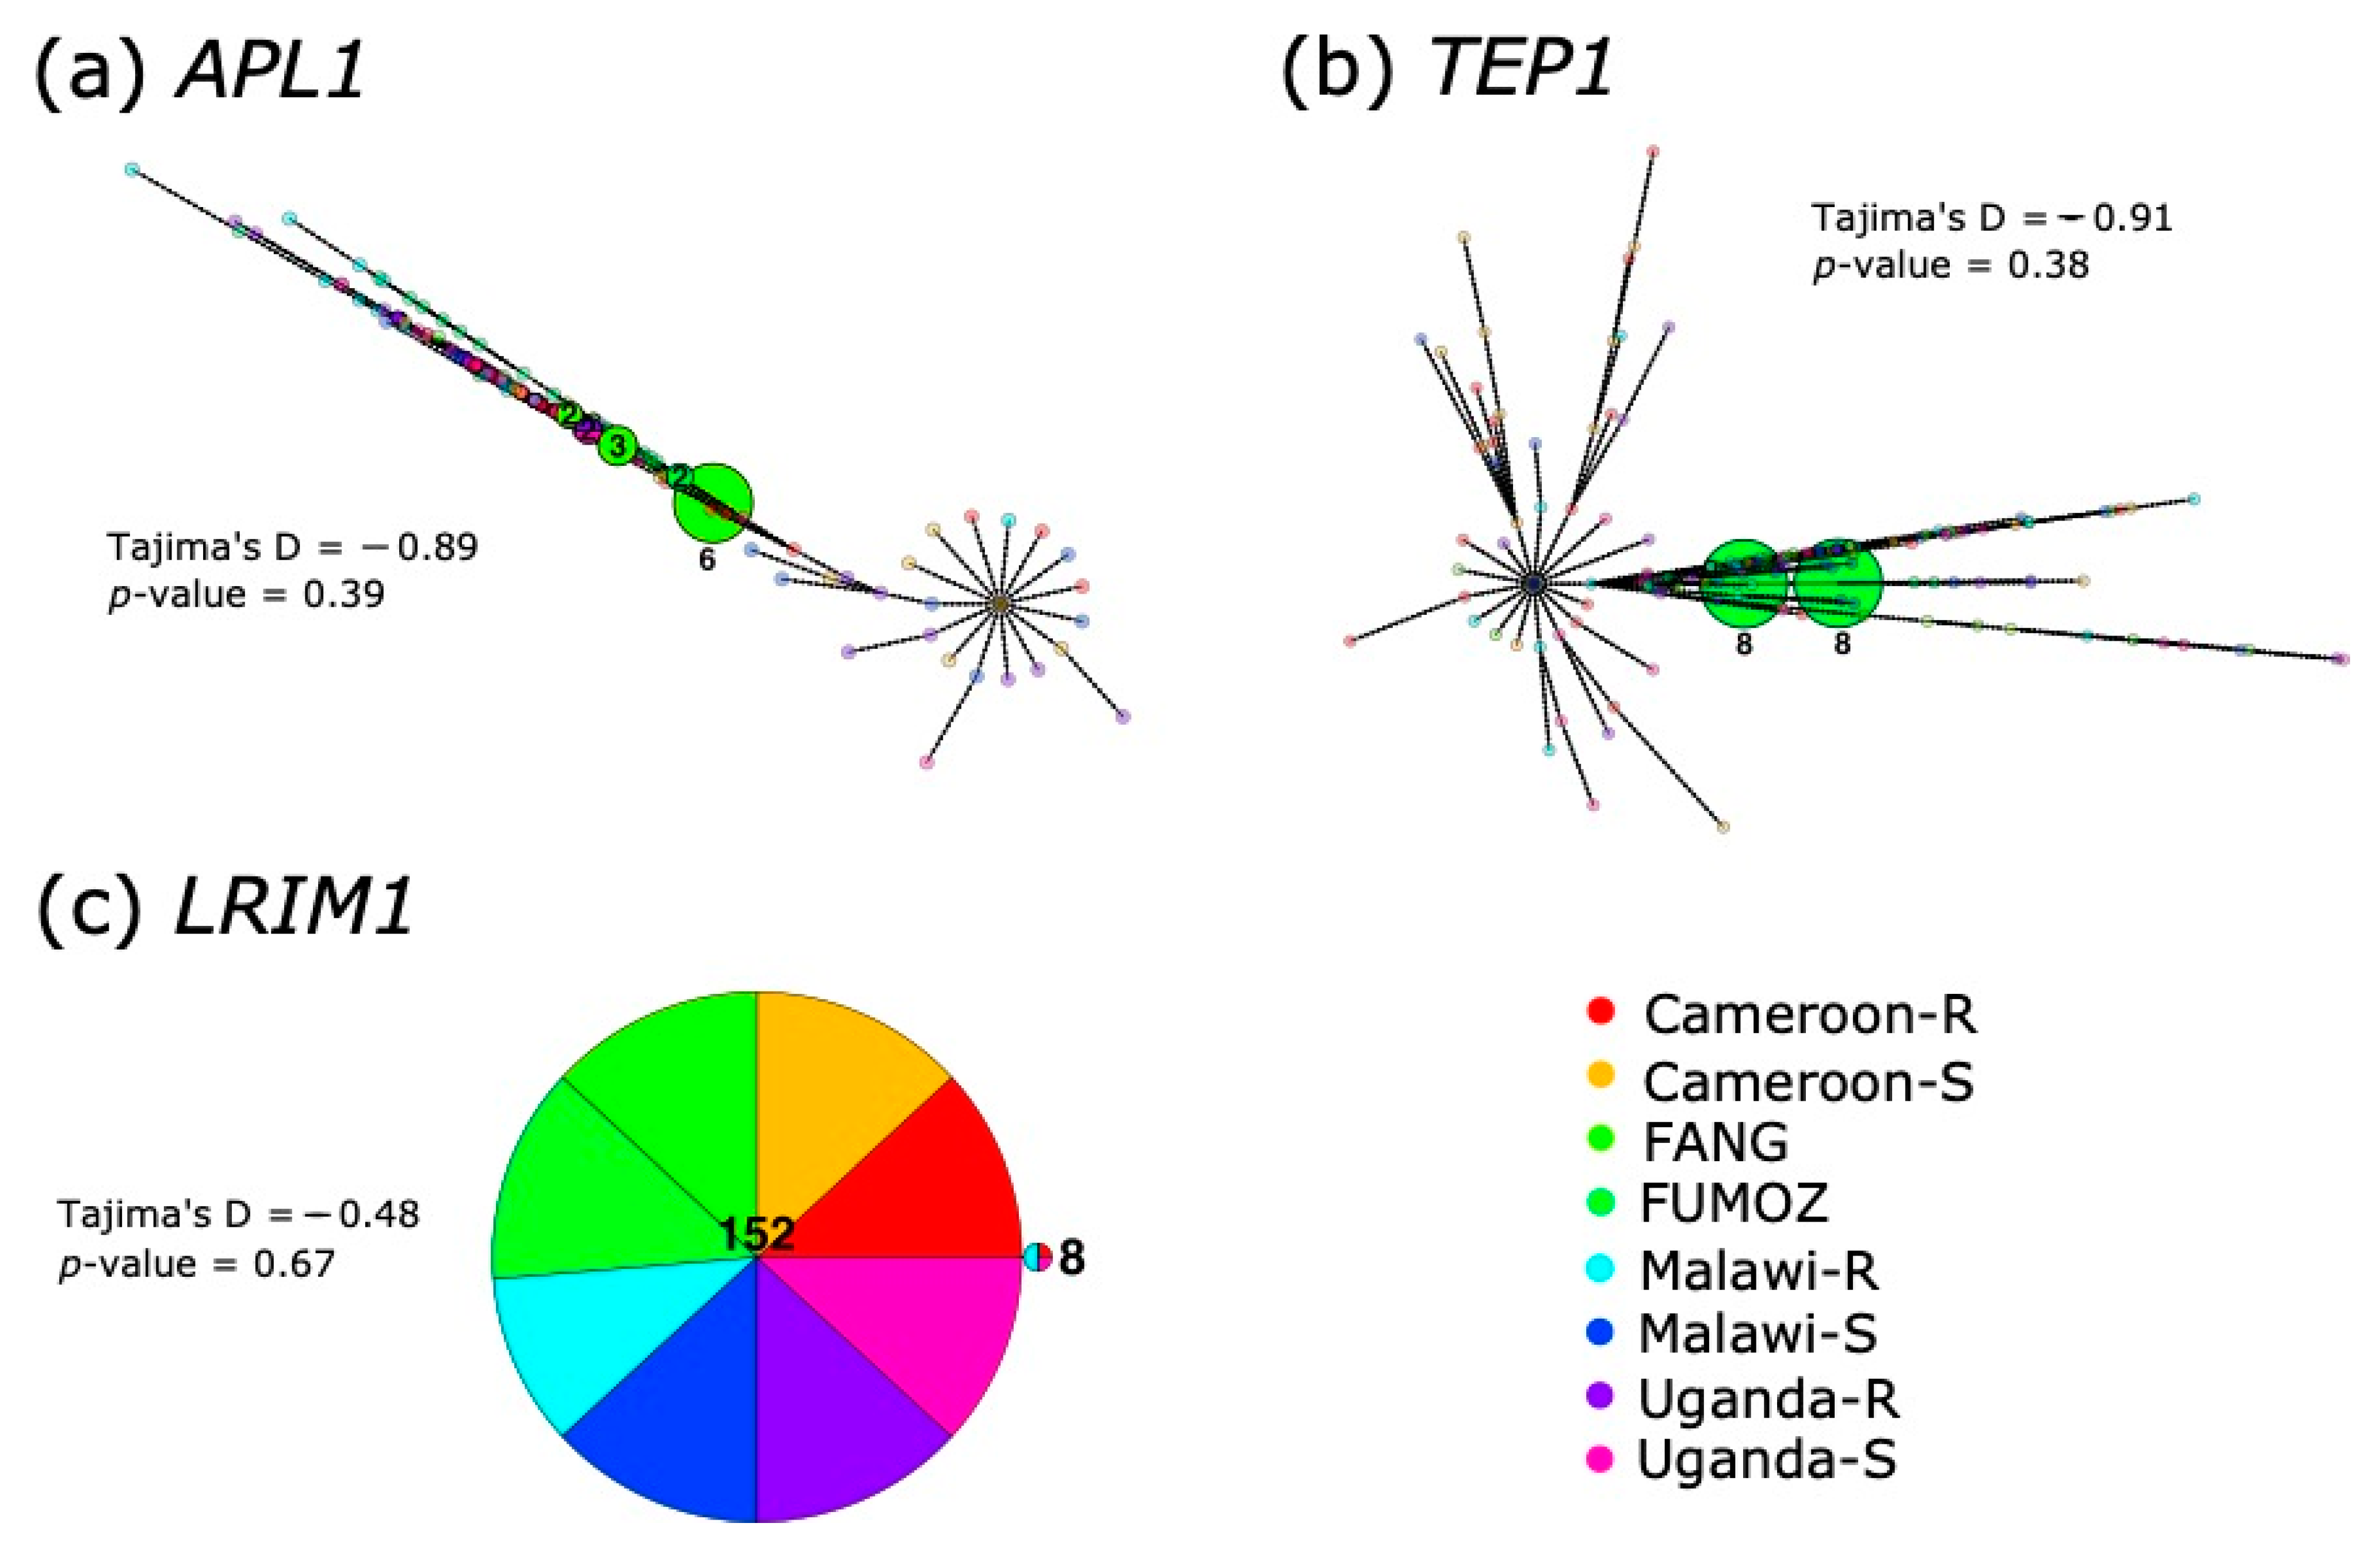
3.3. Haplotype Analyses and Fst between Countries Reveals No Clustering by Resistance or Origin

The haplotype analyses of APL1 (Figure 2) revealed a high degree of intermingling among the regions and resistance with no discernible groupings. Most of the haplotypes (145/160) were unique and did not group with any other sequences, the largest cluster was of six FANG sequences, followed by a cluster of three, also FANG, sequences. TEP1 was very similar in its overall lack of shared haplotypes, with 144 of 160 being unique. Only two clusters of eight sequences each, both consisting entirely of FUMOZ sequences, were present. For both of the genes, the mutational separation between haplotypes was high (represented by circles on connecting nodes in Figure 2). LRIM1, by contrast, only presented two clusters across all of the 160 haplotypes, one of 152 sequences and one of 8, which were separated by only one mutation. Tajima’s D tests for detecting population structure or selection were non-significant for all three genes.
Pairwise Fst among the PoolSeq populations revealed a slightly lower average global Fst for the APL1, TEP1, LRIM1 genes at 0.13, 0.12 and 0.15, respectively, versus a chromosome-wide estimate of 0.16 (Table S5, Supplementary Materials), while the two gambicins had Fsts of 0.17 and 0.13. Only six of the genes had global Fsts greater than 0.3 of the 62 immune genes tested. Four of these were LRIM genes, one was TEP1 and one an APL1 paralogue (AFUN000279), however the APL1 paralogue only had two SNPs contributing to the Fst estimate, whereas the other genes had 33–143 SNPs contributing (Table S5, Supplementary Materials). Between the dead and alive SureSelect individuals, after filtering for biallelic variants, 146 positions were included in the Fst analysis of the APL1 gene within populations. No positions were significantly different between the dead and alive individuals for each population tested.

3.4. Gambicin and Other Immune-Related Genes Are Also Highly Polymorphic

Two further immunity-related genes had elevated levels of diversity across PoolSeq populations and SureSelect data, a gambicin (AFUN006611) and a fibrinogen domain containing gene (AFUN019026) (Table S6, Supplementary Materials). The fibrinogen gene has six VectorBase paralogues, of which only one, AFUN014704, also had elevated diversity restricted to southern African populations (Table S6, Supplementary Materials). Gambicin (AFUN006611) also had a πNs ratio greater than one in nine PoolSeq populations and a SureSelect πNs of 1.55. This gene has two nearby gambicin paralogues in the An. funestus genome (AFUN006610 and AFUN006612). The AFUN006610 also had an average PoolSeq πNs greater than one at 1.37 while AFUN006612 did not, at a πNs ratio of 0.09 (Table S6, Supplementary Materials); AFUN006610 was not included in the SureSelect baits hence no estimate was made from these data. The haplotype networks differed in topology between the two gambicin genes (Figure S2, Supplementary Materials). The AFUN006610 gene was dominated by one haplotype of 142/160 sequences, whereas for AFUN006611 the largest cluster was of 59 sequences with smaller clusters of up to 12 sequences. Unlike for APL1 and TEP1, the mutational distances between clusters were low, with at most two mutations separating the clusters in AFUN006611 and only one in AFUN006610. Neither gene showed a separation between origin and resistance status of the included mosquitoes. The average coverages of gambicin genes were 39, 40 and 39-fold for AFUN006610, AFUN006611 and AFUN006612, respectively, which did not indicate a possible duplication event underlying the elevated diversity. Other AMP genes lacked the consistency in high πNs ratios of gambicins, with only a cecropin (AFUN000369) having elevated levels in the three Mozambique pools from the 2002, 2016 and FUMOZ resistance strains at 1.09, 0.98 and 0.98, respectively.

3.5. APL1 Expression Is Greater Than Its Paralogues and a Subset of AMPs Are Very Highly Expressed

Of the five APL1 paralogues, APL1 is expressed more highly across Africa than the other genes, at an average expression level of 102.43 (TPM, Table S7, Supplementary Materials). The next closest APL1 paralogue in expression is AFUN000597, at a mean TPM expression of 17.45. It is important to note, however, that there may have been some artefactual expression between the APL1 locus and paralogues in hard-to-discern directions, as the underlying gene conversion will have affected the RNASeq read mapping. Indeed, cross-mapping reads were used to support the inference of gene conversion as part of this study. One TEP gene (AFUN02066), syntenic with TEP15 and TEP2 in An. gambiae, had double the average of APL1 at 201.30 TPM. Two of the LRIM genes were also of higher average expression than APL1 (AFUN003917 and AFUN005964), while the TEP1 gene AFUN018758 was slightly lower at 73.54 TPM (Table S7, Supplementary Materials; per-replicate and average normalized expressions of APL/TEP and LRIM genes). For the AMP genes, three cecropins (AFUN011465, AFUN015822 and AFUN015823) were expressed at by far the highest TPM of all of immune genes tested (means 1448, 2691, 2031 TPM, Table S7, Supplementary Materials) followed by a defensin (AFUN006915) at 795 TPM. The two gambicin genes and their paralogue were expressed at much lower TPMs of 14 (AFUN006610), 1 (AFUN006611) and 1 (AFUN006612) TPM, respectively.
The RNASeq results for the APL1 revealed three contrasts between FANG, Ghana and Uganda, all of them versus Cameroon were significant, with expression being higher in Cameroon in each case (Table S8, Supplementary Materials). For TEP1, six contrasts were significant, in which Ghana and Uganda both have lower expression than Cameroon, FANG and FUMOZ. The LRIM1 locus was significantly lower expressed in Ghana versus both Cameroon and FANG. For all three categories of immune gene, log2-fold changes were not large (<2). For the two gambicins and the paralogue, only AFUN006610 was significant across ten of the fifteen contrasts, and expression was highest in susceptible FANG and low in resistant FUMOZ (Tables S7 and S8, Supplementary Materials). Of the cecropin and defensin genes, AFUN011465 was the most interesting. It was significant for six contrasts, including all five contrasts involving FANG, where it was expressed at an average of 2340 TPM across the FANG replicates, versus 1244 for all of the other replicates combined (Tables S7 and S8, Supplementary Materials).

3.6. Discordant Read Mappings Consistent with Gene Conversion between APL1 Paralogues

We isolated the discordant read-pair mappings in the PoolSeq and SureSelect datasets for APL1 and its paralogues from the combined Africa-wide datasets for each. This revealed that discordant mappings of paired reads occur extensively between paralogues (Figure 3 and Figure S3, Supplementary Materials). For all five paralogues, discordant mappings were identified across the two exons of each gene. These mappings were biased to exon 2 for each paralogue in PoolSeq and SureSelect data, which form most of the coding sequence across the APL paralogues. In AFUN000288, no discordant mappings were observed across exon 1 (Figure S3, Supplementary Materials). The only notable gene which experienced cross-mapping of reads to the APL1 paralogues was gene AFUN020339. However, this was an artifact of paralogue AFUN000279, being encoded in an intron of this gene. The APL1/AFUN018743 locus shared most discordant read-mappings with AFUN015851, the paralogue which also had high average PoolSeq coverage.
By converting the variant positions between the APL1 paralogues to those of the multiple sequence alignment and verifying that the same reference/ancestral and alternative allele occurred at overlapping positions, we identified shared polymorphisms. The shared polymorphisms remained after discordant read mappings were removed from the variant predictions (Venn diagram, Figure 4). The greatest overlaps were between APL1, AFUN018581 and AFUN000279 at the 25 and 20 variant positions, respectively. Both GARD models predicted 20 breakpoints across the APL1 paralogue alignment, and each was significant for breakpoints versus rate heterogeneity across the alignment. The longest unbroken segment of the alignment was between positions 257–1320 of the 3075 bp long alignment. This corresponded to the coding region present only in AFUN000288 but was equivalent to a length of 72 bp only in the other paralogues, a length that was consistent with the other breakpoint lengths predicted by GARD (File S1, Supplementary Materials).
Two coiled-coil domains were predicted by DeepCoil in the 3′ region of all five paralogues (Figure S4, Supplementary Materials). In APL1, the non-synonymous mutations occurred more frequently in these coiled-coil domains in PoolSeq data: 56 such sites were identified in the 313 bp covering these two domains, versus 188 across the 1593 bp of remaining coding sequence. Furthermore, the coiled-coil domains contained 10 multi-allelic nonsynonymous SNPs, a rate twice as high (0.032 per non-synonymous site vs. 0.016) as for the rest of the gene, which has 25 such multi-allelic nonsynonymous variants. This coiled-coil region was not the region with the most discordant mappings in APL1 (Figure 3).

4. Discussion

The An. funestus APL1 gene and its paralogues encode a 5′ signal peptide, LRIM domain and 3′ end coiled-coil region. This is in line with An. stephensi APL1, to which An. funestus is more closely related than An. gambiae s.l. [20,57]. None of the An. funestus APL1 genes contain the variable ‘PANGGL’ motif present on the 5′ end of An. gambiae APL1C and APL1A [18], nor does the APL1 gene of the more closely related An. stephensi [20]. None of the genes investigated here, including AMPs, had patterns of diversity restricted to their regions or resistance status (Figure 2 and Figure S2, Supplementary Materials), although FANG and FUMOZ formed clusters in APL1 and TEP1 haplotype networks, respectively, whereas almost zero field samples had concordant haplotypes.

4.1. Gene Conversion Explains Elevated APL1 Diversity in An. funestus

The three genes that form the pathogen-eliminating complement system in Anopheles have a distinct pattern of diversity to their An. gambiae counterparts. The elevated diversity APL1 is similar to that of An. gambiae, but no population exhibits the hallmarks of a selective sweep in the same way as APL1C Plasmodium resistance alleles in An. coluzzii [18]. Unlike An. gambiae, the TEP gene diversities were not outliers compared to background levels [19], although the highest πN values were elevated (>0.015) for four of these genes (Table S3, Supplementary Materials). The LRIM genes exhibited the least elevated diversity of the three types, similar to the LRIM genes in An. gambiae [19,24]. The results were consistent across PoolSeq and SureSelect. No genes from across each category appeared to have undergone a recent selection sweep, which would have been shown by reduced πN and πs at the affected locus and surroundings. We also found no link between insecticide resistance and allele frequencies for the principal APL1 locus (AFUN0018743). Thus, in these data, a link between the insect complement system and vector competence cannot be made. By contrast, the increased GST expression in An. funestus does lead to a higher Plasmodium load through the metabolism of parasite-killing ROS and/or a fitness trade-off that decreases the robustness of immune responses [32].
This observed diversity is not an artifact of gene duplication of the APL1 gene or reads mapping between paralogues due to high sequence similarity. When read-pairs that mapped between APL1 and its paralogues were removed, the genetic diversity of APL1N and πS) remained high in both the pooled and target-enriched datasets. Furthermore, the shared polymorphisms between paralogues were identified after the removal of discordant read-pairs filtered from the datasets. This is consistent with gene conversion between the paralogues of APL1 that maintains high diversity at the principal locus. The paralogue alignment-based GARD approach detected many recombination events among the five APL1 paralogues, which is concordant with gene conversion [58]. The An. stephensi APL1 diversity sampled from Iran did not exhibit the elevated polymorphism of An. funestus found in all populations sampled here [20]. In An. gambiae, the elevated APL1 diversity was not associated with an increased interspecific divergence through relaxed constraint or a higher-than-average mutation rate [18]. In fact, lower inter-specific divergence was observed, consistent with adaptive maintenance of variation.

4.2. Gene Conversion Acts on APL1 Orthologues in Other Anopheles Species

The observed gene conversion-mediated increased diversity in An. funestus APL1 mirrors that found for the TEP1 gene in An. gambiae [19]. It is also likely true for the APL1 paralogues in An. gambiae, as the polymorphisms and the PANGGL motif are shared between loci [18]. The An. gambiae s. l. TEP1 was shown to exchange diversity with TEP5 and TEP6 through gene conversion [19]. However, the high diversity in TEP1 was principally due to the presence of two divergent allele classes, one of which provides resistance to Plasmodium infection. When analyzed separately, the two allele classes exhibited diversity levels close to other An. gambiae loci [19]. This is similar to the An. funestus orthologue of TEP1, and other TEP genes, which do not show elevated polymorphisms across Africa (Table S3, Supplementary Materials), suggesting no such divergence of haplotypes in this species. However, the granularity of the TEP1 haplotype network (Figure 2b) suggests that processes may be occurring in this gene that are too subtle to detect by the population genetic metrics applied here.
Gene conversion can lead to increased diversification at a locus under a model in which multiple donor genes contribute diversity, either reciprocally or to a recipient single locus [59]. This is not restricted to complete genes, as the pseudogenes of the spirochaete Borrelia hermsii and African Trypanosomes can also donate diversity to surface protein genes, in order to evade host immune responses [60,61]. Here, we found that the APL1 An. funestus locus exhibits high diversity, as, to a lesser extent, do its four paralogues. This is a different outcome to the more frequently observed gene conversion between a single donor and recipient locus, which leads to sequence homogenization, which has occurred between the tandemly duplicated insecticide-resistance-conferring Cyp6P9a and Cyp6P9b loci in An. funestus from Benin [36]. Kurosawa and Ohta (2011) proposed that a highly expressed gene could become the principal recipient locus among a set of paralogues experiencing reciprocal gene conversion [59]. We observed such a gene expression relationship between APL1, which is both the most highly expressed and genetically diverse gene among the five paralogues. This relationship is hypothesized to result from the regulation of gene expression by local DNA accessibility, which is controlled by epigenetic modifications on surrounding chromatin. A gene more highly expressed than others in its gene conversion network will have more accessible DNA, which enhances the probability of homologous recombination occurring at this locus [59].
The elevated diversity of APL1 was maintained in Anopheles gambiae sensu. stricto. post-duplication of APL1 into three copies [18]. This implies that elevated diversity is an important component of APL1 function, as a simple model of sub-functionalization of gene copies post-duplication, through differential pathogen targeting, for example, would predict a reduction in allelic diversity at each locus.

4.3. Elevated πN in the An. funestus Anti-Microbial Protein Gambicin

The high gambicin gene πNs ratios indicate positive selection, alternatively, balancing selection could explain both of the πNs greater than one and the outright high levels of πN shown in Figure 1 [62]. Alternatively, this locus could be undergoing gene conversion, as is likely occurring at APL1. One test for balancing selection would involve testing for trans-species polymorphisms at these two loci in other funestus group species. Such trans-species polymorphisms are commonly found in AMPs among the Drosophila species [62]. We also note that this is a relatively short gene with ~61 synonymous sites, which may make the πNs ratio more susceptible to stochasticity than longer genes. Interestingly, gambicin is the only AMP among Dipterans that has been previously associated with positive selection [23,33,63]. Among the wider insects, evidence for positive selection on AMPs is patchy, despite the natural expectation that the AMPs will evolve rapidly under selection from microbes [33]. This has been explained by the diversity of the AMPs that insects encode, creating a dynamic environment which prevents selection on any one component [64]. Rather, selection is hypothesized to act on the speed and efficiency of transcription and translation of AMPs post-infection [33,65].
Current models of insect cecropin AMP activity assume low levels of expression in the midguts, fat bodies or reproductive tracts, until an immune challenge ramps up transcription [66]. Our observation of three cecropins and a defensin expressed at much higher levels (>700-fold plus) than the other AMPs indicates that this is an incomplete model. Especially so, as expression of three of these four genes was consistent across African populations and laboratory strains, which suggests constitutive high expression of these genes in the face of diverse environmental pathogen challenges. The fourth gene, AFUN011465, a cecropin, is particularly interesting, due to both its high expression and greater expression in the susceptible FANG strain. We hypothesize that the FANG strain mosquitoes can invest more resources into expression of this immune gene, as they do not incur the energetic costs of metabolic resistance mechanisms versus the other strains. The fitness costs of metabolic resistance in An. funestus are well-established with respect to life-history traits [67,68]. Indeed, the opposite has been observed in the moth Trichoplusia ni, in which investment in immunity has its own negative effect on developmental fitness [69]. Conversely, the AMP genes may be ‘cheap’ to express constitutively and therefore have little to no effect on overall fitness, as found for diptericin in Drosophila melanogaster [70]. Under this scenario, we would not expect a trade-off to explain the higher AFUN011465 expression in susceptible FANG, although the added burden of an additional factor in resistance-conferring gene expression may make AMP expression more costly than otherwise. Linking fitness traits measured phenotypically to immune homeostasis through gene expression would further our understanding of the mechanisms underlying resistance trade-offs. This hypothesis can be tested by pathogen survival analyses on different strains of An. funestus versus FANG in controlled conditions, without insecticide exposure. Such an experiment would require some knowledge of the pathogen range of the AFUN011465 cecropin protein with respect to Plasmodium, bacteria and other threats.

5. Conclusions

An. funestus has high diversity at the key immune complement factor, APL1, which is most likely due to non-homologous gene conversion between the five paralogues of this gene. This is in line with the APL1 genes in An. gambiae s. l. in sub-Saharan Africa, but not the more closely related An. stephensi. The existence of the non-syntenic APL1 paralogues may provide neo-functional diversity that liberates APL1 in An. funestus from the constraints observed in An. stephensi, which encodes a single copy of APL1. In future experiments, the mortality effect of silencing APL1 through RNAi (see [71] for similar) in response to pathogen challenge would help establish sub-functionalization at this locus. The combinatorial silencing of paralogues would also help define which paralogues act functionally or as wells of genetic diversity alone. We hypothesize that open chromatin at the most expressed paralogue (APL1/AFUN018743) may explain preferential replenishing of this locus with diversity from other paralogues. The An. funestus TEP1 gene that APL1 interacts with does not exhibit high diversity or the selective sweep signals seen in An. gambiae s. l., nor do numerous paralogues of this gene. The final gene of the pathogen-eradicating complex, LRIM1, also lacks a pattern of diversity different to the background levels that are similar to other Anopheles species investigated to date. We also show that gambicin anti-microbial peptide genes have elevated nonsynonymous diversity. The gambicins are the only AMP genes that have been previously associated with positive selection in insects, and gene conversion or balancing selection could explain these observations. The cecropin and defensin AMPs were constitutively highly expressed across An. funestus, at odds with expectation and therefore warranting further investigation.

Supplementary Materials

The following supporting information can be downloaded at: https://www.mdpi.com/article/10.3390/genes13061102/s1, Figure S1: Comparison of APL1 coverage with that of a known duplicated gene. In this case, read coverages showing a duplication spanning the CYP6AA1 and part of the CYP6AA2 loci in Benin first identified in [36] and the APL1 locus also from Benin. Plots were generated in IGV (v2.8.13); Figure S2: Haplotype networks of (a) AFUN006610 and (b) AFUN006611 gambicin genes from SureSelect data. Haplotypes are colored by origin (country or laboratory strain) and resistance or susceptibility of individual mosquitoes. Black circles on nodes indicate the mutational distance between haplotypes. Unique haplotypes were made translucent due to the degree of overlap along nodes. Tajima’s D and associated p-value are given for each gene adjacent to the haplotype network; Figure S3: Discordant read mappings across APL1 paralogues. Density of mappings in green, domains shaded in light grey. CC = coiled-coil domain; LR = LRIM domain; Figure S4: Coiled coil domain predictions for APL1 and paralogues; Table S1: Read alignments for PoolSeq and SureSelect samples generated from bam alignment files using command ‘sambamba flagstat’; Table S2: Chromosomal locations of APL1, LRIM and TEP genes identified in the An. funestus version F3 genome adapted from VectorBase version 51 gff annotation file. APL1 and paralogues are in bold. Chromosome = chromosome of gene; Source = data source; Type = type of feature, all are protein coding genes; Start = start of gene on chromosome; End = end of gene on chromosome; Strand = gene is present on forward (+) or reverse (−) strand; Gene = gene name in VectorBase format; VectorBase description = gene annotation as assigned by VectorBase; Table S3: Gene rankings and population genetic metrics for APL/TEP/LRIM immune genes of each class investigated from PoolSeq data; Table S4: Per country πN and πS estimates from PoolSeq data for genome-wide averages and APL1 and paralogues; Table S5: Global Fst estimates for immune genes estimated from PoolSeq populations. Gene = VectorBase identifier; Function = class of gene; Fst = global Fst estimate and No of SNPs = number of SNPs contributing to Fst estimate; Table S6: πN, πS and numbers of non-synonymous and synonymous sites for other immunity-related genes in An. funestus from PoolSeq data; Table S7: Transcript per million (TPM) counts and means for APL (bolded), LRIM, TEP and AMP genes from RNASeq sampled in Cameroon (CMR), Ghana (GHA), Malawi (MAL), Uganda (UGA), and FANG/FUMOZ laboratory strains. Mean = average of all replicates across experiment. The insecticide treatment and origin of each sample is encoded in replicate names. UNX = unexposed; PER = permethrin; DDT = Dichlorodiphenyltrichloroethane (DDT). Thus, a header containing “MAL.UNX” = a replicate sample in Malawi that was unexposed to insecticide treatment; Table S8: DESeq2 differential gene expression results between countries and laboratory strains for APL (bolded), LRIM, TEP and AMP genes. Analysis was run using iDEP. Log2-fold change and adjusted p-value are given for every pairwise contrast made, for example “FANG-Cameroon log2FoldChange” refers to the FANG versus Cameroon contrast Log2-fold change. Only genes with greater than 0.5 counts per million in four or more replicates passed pre-filtering in iDEP; File S1: Log file of GARD predicted breakpoints in the codon-aligned multiple sequence alignment of the five An. funestus APL1 paralogues.

Author Contributions

Conceptualization, J.H. and C.S.W.; methodology, J.H.; formal analysis, J.H.; investigation, J.H.; resources, H.I.; data curation, J.H.; writing—original draft preparation, J.H.; writing—review and editing, J.H, C.S.W., J.M.R. and G.D.W.; visualization, J.H.; supervision, C.S.W.; project administration, C.S.W.; funding acquisition, C.S.W. All authors have read and agreed to the published version of the manuscript.

Funding

This research was funded in whole, or in part, by the Wellcome Trust Senior Research Fellowships in Biomedical Sciences to CSW (101893/Z/13/Z and 217188/Z/19/Z) and a Bill and Melinda Gates Foundation grant to CSW (INV-006003). For the purpose of open access, the author has applied a CC BY public copyright license to any Author Accepted Manuscript version arising from this submission.

Institutional Review Board Statement

Not applicable.

Informed Consent Statement

Not applicable.

Data Availability Statement

Read data for PoolSeq, SureSelect and RNASeq analyses is available in the European Nucleotide Archive under accessions PRJEB13485, PRJEB24384, PRJEB35040, PRJEB24351, PRJEB24520, PRJEB47287, PRJEB48958 and PRJEB24506.

Conflicts of Interest

The authors declare no conflict of interest.

References

  1. WHO. World Malaria Report 2020: 20 Years of Global Progress and Challenges; World Malaria Report: Geneva, Switzerland, 2020; pp. 1–151. [Google Scholar]
  2. White, B.J.; Lawniczak, M.K.N.; Cheng, C.; Coulibaly, M.B.; Wilson, M.D.; Sagnon, N.; Costantini, C.; Simard, F.; Christophides, G.K.; Besansky, N.J. Adaptive divergence between incipient species of Anopheles gambiae increases resistance to Plasmodium. Proc. Natl. Acad. Sci. USA 2011, 108, 244–249. [Google Scholar] [CrossRef] [PubMed] [Green Version]
  3. Blandin, S.A.; Wang-Sattler, R.; Lamacchia, M.; Gagneur, J.; Lycett, G.; Ning, Y.; Levashina, E.A.; Steinmetz, L.M. Dissecting the genetic basis of resistance to malaria parasites in Anopheles gambiae. Science 2009, 326, 147–150. [Google Scholar] [CrossRef] [Green Version]
  4. Rivero, A.; Vezilier, J.; Weill, M.; Read, A.F.; Gandon, S. Insecticide control of vector-borne diseases: When is insecticide resistance a problem? PLoS Pathog. 2010, 6, e1001000. [Google Scholar] [CrossRef] [Green Version]
  5. Clayton, A.M.; Dong, Y.; Dimopoulos, G. The Anopheles innate immune system in the defense against malaria infection. J. Innate Immun. 2014, 6, 169–181. [Google Scholar] [CrossRef] [PubMed]
  6. Baxter, R.H.G.; Chang, C.-I.; Chelliah, Y.; Blandin, S.; Levashina, E.A.; Deisenhofer, J. Structural basis for conserved complement factor-like function in the antimalarial protein TEP1. Proc. Natl. Acad. Sci. USA 2007, 104, 11615–11620. [Google Scholar] [CrossRef] [PubMed] [Green Version]
  7. Povelones, M.; Bhagavatula, L.; Yassine, H.; Tan, L.A.; Upton, L.M.; Osta, M.A.; Christophides, G.K. The CLIP-domain serine protease homolog SPCLIP1 regulates complement recruitment to microbial surfaces in the malaria mosquito Anopheles gambiae. PLoS Pathog. 2013, 9, e1003623. [Google Scholar] [CrossRef] [PubMed] [Green Version]
  8. Reyes Ruiz, V.M.; Sousa, G.L.; Sneed, S.D.; Farrant, K.V.; Christophides, G.K.; Povelones, M. Stimulation of a protease targeting the LRIM1/APL1C complex reveals specificity in complement-like pathway activation in Anopheles gambiae. PLoS ONE 2019, 14, e0214753. [Google Scholar] [CrossRef]
  9. Wu, Q.; Patočka, J.; Kuča, K. Insect antimicrobial peptides, a mini review. Toxins 2018, 10, 461. [Google Scholar] [CrossRef]
  10. Lee, W.-S.; Webster, J.A.; Madzokere, E.T.; Stephenson, E.B.; Herrero, L.J. Mosquito antiviral defense mechanisms: A delicate balance between innate immunity and persistent viral infection. Parasit. Vectors 2019, 12, 1–12. [Google Scholar] [CrossRef] [Green Version]
  11. Vizioli, J.; Bulet, P.; Hoffmann, J.A.; Kafatos, F.C.; Müller, H.-M.; Dimopoulos, G. Gambicin: A novel immune responsive antimicrobial peptide from the malaria vector Anopheles gambiae. Proc. Natl. Acad. Sci. USA 2001, 98, 12630–12635. [Google Scholar] [CrossRef] [PubMed] [Green Version]
  12. Molina-Cruz, A.; Garver, L.S.; Alabaster, A.; Bangiolo, L.; Haile, A.; Winikor, J.; Ortega, C.; van Schaijk, B.C.L.; Sauerwein, R.W.; Taylor-Salmon, E.; et al. The human malaria parasite Pfs47 gene mediates evasion of the mosquito immune system. Science 2013, 340, 984–987. [Google Scholar] [CrossRef] [PubMed] [Green Version]
  13. Cha, S.-J.; Jacobs-Lorena, M. A Plasmodium key fits a mosquito lock. Proc. Natl. Acad. Sci. USA 2020, 117, 3898–3900. [Google Scholar] [CrossRef] [PubMed]
  14. Molina-Cruz, A.; DeJong, R.J.; Ortega, C.; Haile, A.; Abban, E.; Rodrigues, J.; Jaramillo-Gutierrez, G.; Barillas-Mury, C. Some strains of Plasmodium falciparum, a human malaria parasite, evade the complement-like system of Anopheles gambiae mosquitoes. Proc. Natl. Acad. Sci. USA 2012, 109, E1957–E1962. [Google Scholar] [CrossRef] [Green Version]
  15. Povelones, M.; Waterhouse, R.M.; Kafatos, F.C.; Christophides, G.K. Leucine-rich repeat protein complex activates mosquito complement in defense against Plasmodium parasites. Science 2009, 324, 258–261. [Google Scholar] [CrossRef] [Green Version]
  16. Niaré, O.; Markianos, K.; Volz, J.; Oduol, F.; Touré, A.; Bagayoko, M.; Sangaré, D.; Traoré, S.F.; Wang, R.; Blass, C.; et al. Genetic loci affecting resistance to human malaria parasites in a West African mosquito vector population. Science 2002, 298, 213–216. [Google Scholar] [CrossRef] [PubMed]
  17. Riehle, M.M.; Markianos, K.; Niaré, O.; Xu, J.; Li, J.; Touré, A.M.; Podiougou, B.; Oduol, F.; Diawara, S.; Diallo, M.; et al. Natural malaria infection in Anopheles gambiae is regulated by a single genomic control region. Science 2006, 312, 577–579. [Google Scholar] [CrossRef] [Green Version]
  18. Rottschaefer, S.M.; Riehle, M.M.; Coulibaly, B.; Sacko, M.; Niare, O.; Morlais, I.; Traore, S.F.; Vernick, K.D.; Lazzaro, B.P. Exceptional diversity, maintenance of polymorphism, and recent directional selection on the APL1 malaria resistance genes of Anopheles gambiae. PLoS Biol. 2011, 9, e1000600. [Google Scholar] [CrossRef] [Green Version]
  19. Obbard, D.J.; Callister, D.M.; Jiggins, F.M.; Soares, D.C.; Yan, G.; Little, T.J. The evolution of TEP1, an exceptionally polymorphic immunity gene in Anopheles gambiae. BMC Evol. Biol. 2008, 8, 274. [Google Scholar] [CrossRef] [Green Version]
  20. Mitri, C.; Bischoff, E.; Eiglmeier, K.; Holm, I.; Dieme, C.; Brito-Fravallo, E.; Raz, A.; Zakeri, S.; Nejad, M.I.K.; Djadid, N.D.; et al. Gene copy number and function of the APL1 immune factor changed during Anopheles evolution. Parasit. Vectors 2020, 13, 18. [Google Scholar] [CrossRef] [Green Version]
  21. Mitri, C.; Bischoff, E.; Belda Cuesta, E.; Volant, S.; Ghozlane, A.; Eiglmeier, K.; Holm, I.; Dieme, C.; Brito-Fravallo, E.; Guelbeogo, W.M.; et al. Leucine-Rich immune factor APL1 is associated with specific modulation of enteric microbiome taxa in the asian malaria mosquito Anopheles stephensi. Front. Microbiol. 2020, 11, 306. [Google Scholar] [CrossRef] [Green Version]
  22. Chapman, J.R.; Hill, T.; Unckless, R.L. Balancing Selection Drives the Maintenance of Genetic Variation in Drosophila Antimicrobial Peptides. Genome Biol. Evol. 2019, 11, 2691–2701. [Google Scholar] [CrossRef] [PubMed] [Green Version]
  23. Lehmann, T.; Hume, J.C.C.; Licht, M.; Burns, C.S.; Wollenberg, K.; Simard, F.; Ribeiro, J. Molecular evolution of immune genes in the malaria mosquito Anopheles gambiae. PLoS ONE 2009, 4, e4549. [Google Scholar] [CrossRef] [PubMed] [Green Version]
  24. Slotman, M.A.; Parmakelis, A.; Marshall, J.C.; Awono-Ambene, P.H.; Antonio-Nkondjo, C.; Simard, F.; Caccone, A.; Powell, J.R. Patterns of selection in anti-malarial immune genes in malaria vectors: Evidence for adaptive evolution in LRIM1 in Anopheles arabiensis. PLoS ONE 2007, 2, e793. [Google Scholar] [CrossRef]
  25. Gillies, M.T.; De Meillon, B. The Anophelinae of Africa South of the Sahara (Ethiopian Zoogeographical Region); South African Institute for Medical Research: Johannesburg, South Africa, 1968; Volume 54. [Google Scholar]
  26. Coetzee, M.; Fontenille, D. Advances in the study of Anopheles funestus, a major vector of malaria in Africa. Insect Biochem. Mol. Biol. 2004, 34, 599–605. [Google Scholar] [CrossRef] [PubMed]
  27. Morgan, J.C.; Irving, H.; Okedi, L.M.; Steven, A.; Wondji, C.S. Pyrethroid resistance in an Anopheles funestus population from Uganda. PLoS ONE 2010, 5, e11872. [Google Scholar] [CrossRef]
  28. Ghurye, J.; Koren, S.; Small, S.T.; Redmond, S.; Howell, P.; Phillippy, A.M.; Besansky, N.J. A chromosome-scale assembly of the major African malaria vector Anopheles funestus. Gigascience 2019, 8, giz063. [Google Scholar] [CrossRef]
  29. Weedall, G.D.; Mugenzi, L.M.J.; Menze, B.D.; Tchouakui, M.; Ibrahim, S.S.; Amvongo-Adjia, N.; Irving, H.; Wondji, M.J.; Tchoupo, M.; Djouaka, R.; et al. A cytochrome P450 allele confers pyrethroid resistance on a major African malaria vector, reducing insecticide-treated bednet efficacy. Sci. Transl. Med. 2019, 11, eaat7386. [Google Scholar] [CrossRef] [Green Version]
  30. Riveron, J.M.; Yunta, C.; Ibrahim, S.S.; Djouaka, R.; Irving, H.; Menze, B.D.; Ismail, H.M.; Hemingway, J.; Ranson, H.; Albert, A.; et al. A single mutation in the GSTe2 gene allows tracking of metabolically based insecticide resistance in a major malaria vector. Genome Biol. 2014, 15, R27. [Google Scholar] [CrossRef] [Green Version]
  31. Mugenzi, L.M.J.; Menze, B.D.; Tchouakui, M.; Wondji, M.J.; Irving, H.; Tchoupo, M.; Hearn, J.; Weedall, G.D.; Riveron, J.M.; Wondji, C.S. Cis-regulatory CYP6P9b P450 variants associated with loss of insecticide-treated bed net efficacy against Anopheles funestus. Nat. Commun. 2019, 10, 4652. [Google Scholar] [CrossRef] [Green Version]
  32. Tchouakui, M.; Chiang, M.-C.; Ndo, C.; Kuicheu, C.K.; Amvongo-Adjia, N.; Wondji, M.J.; Tchoupo, M.; Kusimo, M.O.; Riveron, J.M.; Wondji, C.S. A marker of glutathione S-transferase-mediated resistance to insecticides is associated with higher Plasmodium infection in the African malaria vector Anopheles funestus. Sci. Rep. 2019, 9, 5772. [Google Scholar] [CrossRef] [Green Version]
  33. Viljakainen, L. Evolutionary genetics of insect innate immunity. Brief. Funct. Genom. 2015, 14, 407–412. [Google Scholar] [CrossRef] [PubMed] [Green Version]
  34. Sackton, T.B.; Lazzaro, B.P.; Clark, A.G. Rapid expansion of immune-related gene families in the house fly, Musca domestica. Mol. Biol. Evol. 2017, 34, 857–872. [Google Scholar] [CrossRef] [Green Version]
  35. Li, L.; Stoeckert, C.J.; Roos, D.S. OrthoMCL: Identification of ortholog groups for eukaryotic genomes. Genome Res. 2003, 13, 2178–2189. [Google Scholar] [CrossRef] [PubMed] [Green Version]
  36. Weedall, G.D.; Riveron, J.M.; Hearn, J.; Irving, H.; Kamdem, C.; Fouet, C.; White, B.J.; Wondji, C.S. An Africa-wide genomic evolution of insecticide resistance in the malaria vector Anopheles funestus involves selective sweeps, copy number variations, gene conversion and transposons. PLOS Genet. 2020, 16, e1008822. [Google Scholar] [CrossRef]
  37. Hearn, J.; Djoko Tagne, C.S.; Ibrahim, S.S.; Tene-Fossog, B.; Mugenzi, L.M.J.; Irving, H.; Riveron, J.M.; Weedall, G.D.; Wondji, C.S. Multi-omics analysis identifies a CYP9K1 haplotype conferring pyrethroid resistance in the malaria vector Anopheles funestus in East Africa. Mol. Ecol. 2022. accepted. [Google Scholar] [CrossRef] [PubMed]
  38. Picard Toolkit. Broad Institute, GitHub Repos. 2019. Available online: https://github.com/broadinstitute (accessed on 19 May 2022).
  39. Li, H.; Handsaker, B.; Wysoker, A.; Fennell, T.; Ruan, J.; Homer, N.; Marth, G.; Abecasis, G.; Durbin, R. The sequence alignment/map format and SAMtools. Bioinformatics 2009, 25, 2078–2079. [Google Scholar] [CrossRef] [PubMed] [Green Version]
  40. Koboldt, D.C.; Chen, K.; Wylie, T.; Larson, D.E.; McLellan, M.D.; Mardis, E.R.; Weinstock, G.M.; Wilson, R.K.; Ding, L. VarScan: Variant detection in massively parallel sequencing of individual and pooled samples. Bioinformatics 2009, 25, 2283–2285. [Google Scholar] [CrossRef] [PubMed] [Green Version]
  41. Koboldt, D.C.; Zhang, Q.; Larson, D.E.; Shen, D.; McLellan, M.D.; Lin, L.; Miller, C.A.; Mardis, E.R.; Ding, L.; Wilson, R.K. VarScan 2: Somatic mutation and copy number alteration discovery in cancer by exome sequencing. Genome Res. 2012, 22, 568–576. [Google Scholar] [CrossRef] [Green Version]
  42. Cingolani, P.; Platts, A.; Wang, L.L.; Coon, M.; Nguyen, T.; Wang, L.; Land, S.J.; Lu, X.; Ruden, D.M. A program for annotating and predicting the effects of single nucleotide polymorphisms, SnpEff: SNPs in the genome of Drosophila melanogaster strain w1118; iso-2; iso-3. Fly 2012, 6, 80–92. [Google Scholar] [CrossRef] [Green Version]
  43. Nelson, C.W.; Moncla, L.H.; Hughes, A.L. SNPGenie: Estimating evolutionary parameters to detect natural selection using pooled next-generation sequencing data. Bioinformatics 2015, 31, 3709–3711. [Google Scholar] [CrossRef] [Green Version]
  44. Hunt, R.H.; Brooke, B.D.; Pillay, C.; Koekemoer, L.L.; Coetzee, M. Laboratory selection for and characteristics of pyrethroid resistance in the malaria vector Anopheles funestus. Med. Vet. Entomol. 2005, 19, 271–275. [Google Scholar] [CrossRef] [PubMed]
  45. Wondji, C.S.; Irving, H.; Morgan, J.; Lobo, N.F.; Collins, F.H.; Hunt, R.H.; Coetzee, M.; Hemingway, J.; Ranson, H. Two duplicated P450 genes are associated with pyrethroid resistance in Anopheles funestus, a major malaria vector. Genome Res. 2009, 19, 452–459. [Google Scholar] [CrossRef] [PubMed] [Green Version]
  46. Garrison, E.; Marth, G. Haplotype-based variant detection from short-read sequencing. arXiv 2012, arXiv:1207.3907. [Google Scholar] [CrossRef]
  47. Patterson, M.; Marschall, T.; Pisanti, N.; Van Iersel, L.; Stougie, L.; Klau, G.W.; Schönhuth, A. WhatsHap: Weighted haplotype assembly for future-generation sequencing reads. J. Comput. Biol. 2015, 22, 498–509. [Google Scholar] [CrossRef] [PubMed]
  48. Pertea, G.; Pertea, M. GFF utilities: GffRead and GffCompare [version 2; peer review: 3 approved]. F1000Research 2020, 9, 304. [Google Scholar] [CrossRef]
  49. Edgar, R.C. MUSCLE: Multiple sequence alignment with high accuracy and high throughput. Nucleic Acids Res. 2004, 32, 1792–1797. [Google Scholar] [CrossRef] [Green Version]
  50. Paradis, E. pegas: An R package for population genetics with an integrated—Modular approach. Bioinformatics 2010, 26, 419–420. [Google Scholar] [CrossRef] [Green Version]
  51. Hivert, V.; Leblois, R.; Petit, E.J.; Gautier, M.; Vitalis, R. Measuring genetic differentiation from Pool-seq data. Genetics 2018, 210, 315–330. [Google Scholar] [CrossRef] [Green Version]
  52. Dabney, A.; Storey, J.D.; Warnes, G.R. Qvalue: Q-Value Estimation for False Discovery Rate Control; R Packag. Version 2.22.0. 2021. p. 1. Available online: https://www.bioconductor.org/packages/devel/bioc/manuals/qvalue/man/qvalue.pdf (accessed on 19 May 2022).
  53. Liao, Y.; Smyth, G.K.; Shi, W. The Subread aligner: Fast, accurate and scalable read mapping by seed-and-vote. Nucleic Acids Res. 2013, 41, e108. [Google Scholar] [CrossRef]
  54. Ge, S.X.; Son, E.W.; Yao, R. iDEP: An integrated web application for differential expression and pathway analysis of RNA-Seq data. BMC Bioinform. 2018, 19, 534. [Google Scholar] [CrossRef] [Green Version]
  55. Bardou, P.; Mariette, J.; Escudié, F.; Djemiel, C.; Klopp, C. jvenn: An interactive Venn diagram viewer. BMC Bioinform. 2014, 15, 293. [Google Scholar] [CrossRef] [PubMed] [Green Version]
  56. Ludwiczak, J.; Winski, A.; Szczepaniak, K.; Alva, V.; Dunin-Horkawicz, S. DeepCoil—a fast and accurate prediction of coiled-coil domains in protein sequences. Bioinformatics 2019, 35, 2790–2795. [Google Scholar] [CrossRef] [PubMed]
  57. Neafsey, D.E.; Waterhouse, R.M.; Abai, M.R.; Aganezov, S.S.; Alekseyev, M.A.; Allen, J.E.; Amon, J.; Arcà, B.; Arensburger, P.; Artemov, G.; et al. Highly evolvable malaria vectors: The genomes of 16 Anopheles mosquitoes. Science 2015, 347, 1258522. [Google Scholar] [CrossRef] [Green Version]
  58. Kosakovsky Pond, S.L.; Posada, D.; Gravenor, M.B.; Woelk, C.H.; Frost, S.D.W. GARD: A genetic algorithm for recombination detection. Bioinformatics 2006, 22, 3096–3098. [Google Scholar] [CrossRef] [PubMed] [Green Version]
  59. Kurosawa, K.; Ohta, K. Genetic diversification by somatic gene conversion. Genes 2011, 2, 48–58. [Google Scholar] [CrossRef] [PubMed]
  60. Restrepo, B.I.; Barbour, A.G. Antigen diversity in the bacterium B. hermsii through “somatic” mutations in rearranged vmp genes. Cell 1994, 78, 867–876. [Google Scholar] [CrossRef]
  61. Morrison, L.J.; Marcello, L.; McCulloch, R. Antigenic variation in the African trypanosome: Molecular mechanisms and phenotypic complexity. Cell Microbiol. 2009, 11, 1724–1734. [Google Scholar] [CrossRef] [Green Version]
  62. Unckless, R.L.; Lazzaro, B.P. The potential for adaptive maintenance of diversity in insect antimicrobial peptides. Philos. Trans. R. Soc. B Biol. Sci. 2016, 371, 20150291. [Google Scholar] [CrossRef] [Green Version]
  63. Arcà, B.; Struchiner, C.J.; Pham, V.M.; Sferra, G.; Lombardo, F.; Pombi, M.; Ribeiro, J.M.C. Positive selection drives accelerated evolution of mosquito salivary genes associated with blood-feeding. Insect Mol. Biol. 2014, 23, 122–131. [Google Scholar] [CrossRef] [Green Version]
  64. Lazzaro, B.P. Natural selection on the Drosophila antimicrobial immune system. Curr. Opin. Microbiol. 2008, 11, 284–289. [Google Scholar] [CrossRef] [Green Version]
  65. Sackton, T.B.; Lazzaro, B.P.; Schlenke, T.A.; Evans, J.D.; Hultmark, D.; Clark, A.G. Dynamic evolution of the innate immune system in Drosophila. Nat. Genet. 2007, 39, 1461–1468. [Google Scholar] [CrossRef] [PubMed]
  66. Brady, D.; Grapputo, A.; Romoli, O.; Sandrelli, F. Insect cecropins, antimicrobial peptides with potential therapeutic applications. Int. J. Mol. Sci. 2019, 20, 5862. [Google Scholar] [CrossRef] [PubMed] [Green Version]
  67. Tchouakui, M.; Miranda, J.R.; Mugenzi, L.M.J.; Djonabaye, D.; Wondji, M.J.; Tchoupo, M.; Tchapga, W.; Njiokou, F.; Wondji, C.S. Cytochrome P450 metabolic resistance (CYP6P9a) to pyrethroids imposes a fitness cost in the major African malaria vector Anopheles funestus. Heredity 2020, 124, 621–632. [Google Scholar] [CrossRef] [PubMed]
  68. Tchouakui, M.; Mugenzi, L.M.J.; Wondji, M.J.; Tchoupo, M.; Njiokou, F.; Wondji, C.S. Combined over-expression of two cytochrome P450 genes exacerbates the fitness cost of pyrethroid resistance in the major African malaria vector Anopheles funestus. Pestic. Biochem. Physiol. 2021, 173, 104772. [Google Scholar] [CrossRef]
  69. Freitak, D.; Wheat, C.W.; Heckel, D.G.; Vogel, H. Immune system responses and fitness costs associated with consumption of bacteria in larvae of Trichoplusia ni. BMC Biol. 2007, 5, 56. [Google Scholar] [CrossRef] [Green Version]
  70. Fellous, S.; Lazzaro, B.P. Potential for evolutionary coupling and decoupling of larval and adult immune gene expression. Mol. Ecol. 2011, 20, 1558–1567. [Google Scholar] [CrossRef] [Green Version]
  71. Kouamo, M.F.M.; Ibrahim, S.S.; Hearn, J.; Riveron, J.M.; Kusimo, M.; Tchouakui, M.; Ebai, T.; Tchapga, W.; Wondji, M.J.; Irving, H.; et al. Genome-wide transcriptional analysis and functional validation linked a cluster of epsilon glutathione S-transferases with insecticide resistance in the major malaria vector Anopheles funestus across Africa. Genes 2021, 12, 561. [Google Scholar] [CrossRef]
Figure 1. Anopheles funestus APL1 (AFUN018743) is an outlier in non-synonymous diversity. Number of non-synonymous sites versus πN for all genes (a). PoolSeq data and a selection of potentially resistance associated loci; (b). SureSelect data. APL1 paralogues also have high πN relative to other genes, but to a lesser extent and with more variability between data types. The anti-microbial gene gambicin (AFUN006611) is also labelled.
Genes 13 01102 g001
Figure 2. Haplotype networks of (a) APL1; (b) TEP1 and (c) LRIM1 from SureSelect data. Haplotypes are colored by origin (country or laboratory strain) and resistance (R) or susceptibility (S) of individual mosquitoes. Black circles on nodes indicate the mutational distance between haplotypes. Unique haplotypes were made translucent due to the degree of overlap along nodes. Tajima’s D and associated p-value are given for each gene adjacent to the haplotype network.
Genes 13 01102 g002
Figure 3. Diversity of APL1 domains and discordant read pair mappings. (a) Nucleotide diversity (π) for non-synonymous sites in purple and synonymous sites in green; line is mean across twelve PoolSeq populations and shaded area is standard deviation; (b) Discordant read mapping density across the APL1 gene-body is given in green in lower figure, density of multi-allelic positions is shown in salmon pink and positions of such sites are plotted as black dots labelled “multi-allelic sites”. CC-Domain is the region encoding two coiled-coil motifs and LRIM domain, both are shaded in light grey. The single intron is shaded in dark grey. Domains, exon and untranslated region positions are given on the X-axis.
Genes 13 01102 g003
Figure 4. Venn diagram and bar chart of shared polymorphisms for APL1 paralogues. Polymorphisms that occur in the same alignment position of the same reference and alternate alleles between paralogues after removal of discordant read mapping. Each gene is labelled with a different color, total number of shared positions per gene is given in the bar chart below.
Genes 13 01102 g004
Table 1. Diversity estimates for APL1 and paralogues in An. funestus.
GeneNonsynonymous SitesSynonymous SitesπNπS
PoolSeq
APL1/AFUN0187431475.80426.200.0270.036
AFUN0185811396.35409.620.0230.036
AFUN0002791399.86406.140.0100.012
AFUN0002882320.70688.300.0120.019
AFUN0005971401.36404.640.0080.008
SureSelect
APL1/AFUN0187431461.21418.620.0250.027
AFUN0185811389.97402.910.0190.023
AFUN0002791389.10402.130.0220.028
AFUN0002882313.82689.230.0170.025
AFUN0005971398.40404.380.0180.020
Nonsynonymous sites = number of nonsynonymous positions across gene; Synonymous sites = number of synonymous positions across gene; πN = nucleotide diversity at nonsynonymous sites; πS = nucleotide diversity at synonymous sites.
Table 2. Average gene coverages from combined PoolSeq data versus background genome-wide averages for APL1 and its paralogues.
GeneOriginal CoverageDiscordant Read Filtered Coverage
AFUN01874348.3142.79
AFUN01858149.5543.16
AFUN00027920.7917.06
AFUN00028823.1220.48
AFUN00059714.6012.15
All genes33.98N/A
Publisher’s Note: MDPI stays neutral with regard to jurisdictional claims in published maps and institutional affiliations.

