
Differentially Expressed miRNAs in Age-Related Neurodegenerative Diseases: A Meta-Analysis

 ,
,
Abstract
: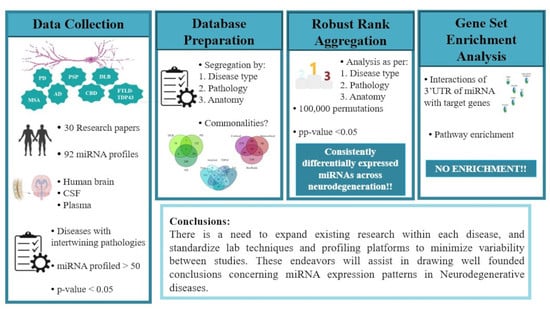
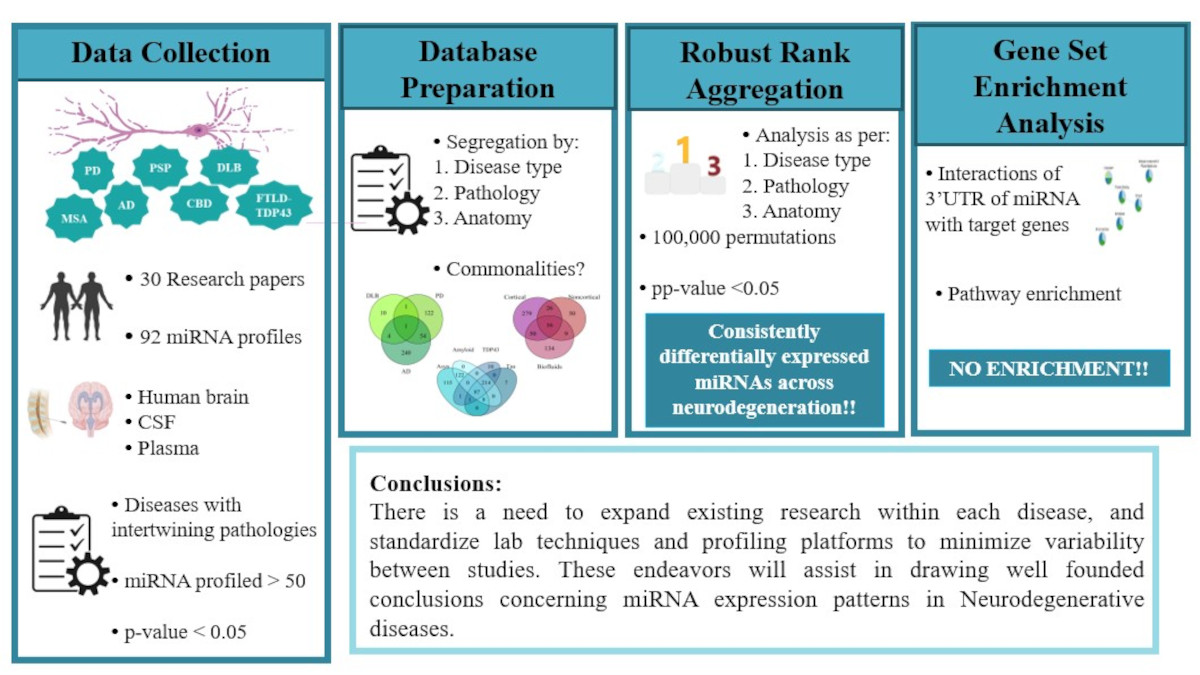
1. Introduction
2. Materials and Methods
2.1. Collection of Data
2.2. Database of Differentially Expressed miRNAs in NDDs
2.3. Robust Rank Aggregation
2.4. Gene Set Enrichment Analysis

| Sr. No. | Study | Disease | Platform | Profiled | Criteria | Anatomy |
|---|---|---|---|---|---|---|
| 1 | Schulze et al., 2018 [54] | PD | Illumina deep sequencing (TruSeq SBS v3 Kit)/GRCh38 (annotation based on ElDorado 6–2015) | 1917 (92 DE) | p-adj. < 0.05; log2FC ≥ 0.6 | Brain: cingulate gyrus |
| 2 | Hoss et al., 2016 [55] | PD | Illumina HiSeq 2000 | 1223 (124 DE) | FDR q < 0.05 | Brain: prefrontal cortex (Brodmann Area 9) |
| 3 | Wake et al., 2016 [56] | PD | Illumina HiSeq 2000 | 2584 (3 DE) | Brain: prefrontal cortex (Brodmann Area 9) | |
| 4 | Ding et al., 2016 [57] | PD | Illumina solexa sequencing | 1123 (15 DE) | p < 0.001; FC ≥ 1.5; 300 ≥ copies; | Serum |
| 5 | Dong et al., 2016 [58] | PD | Illumina solexa sequencing | 721 (12 DE) | FC ≥ 3; 100 ≥ copies | Serum |
| 6 | Botta-Orfila et al., 2014 [59] | PD | TaqMan Array Human MicroRNA A Cards v2.0 | 377 (2 DE) | p ≤ 0.05 | Serum |
| 7 | Annese et al., 2018 [60] | PD | Illumina MiSeq platform | 2589 (40 DE) | p-adj. ≤ 0.05; log2 fold change | Brain: hippocampal CA1 region |
| 8 | Burgos et al., 2014 [61] | PD | Illumina HiSeq2000 | 2228 (CSF: 17 DE; serum: 5 DE) | p-adj. < 0.05; 0.7 < log2 FC | CSF and serum |
| 9 | Vallelunga et al., 2014 [62] | PD | TaqMan Human MicroRNA Array v3.0 A and B (Applied Biosystems | Life Technologies™) | 754 (5 DE) | p < 0.05 | Serum |
| 10 | Gui et al., 2015 [63] | PD | TaqMan Low-Density Array Human miRNA Panels (Applied Biosystems) | 746 (27 DE) | p-adj. < 0.05; FC > 2 | CSF |
| 11 | Kume et al., 2018 [64] | MSA | 3D-Gene miRNA oligo chips (version 17; Toray Industries, Inc.) | 679 (67 DE) | p < 0.05 | Serum |
| 12 | Lee et al., 2014 [65] | MSA-Cerebellar | Human miRNA Microarray 8 × 15 K kit (Agilent Tech) | 866 (31 DE) | p-value < 0.05; FC > 1.5 | Brain: cerebellar cortex |
| 13 | Kim et al., 2019 [66] | MSA-Parkinson | TaqMan microRNA Reverse Transcription Kit (Applied Biosystems) | 800 (31 DE) | p-value ≤ 0.001; FDR ≤ 0.02 | Brain: striatum |
| 14 | Wakabayashi et al., 2016 [67] | MSA-C and MSA-P | Human miRNA oligo chip (Toray Industries) | 1734 (Pons: 38 DE; Cerebellum: 23 DE) | Brain: pons and cerebellum | |
| 15 | Ubhi et al., 2014 [68] | MSA | OneArray® Human microRNA Microarray v3 | 1087 (14 DE) | p < 0.05; FC > 2 | Brain: frontal cortex |
| 16 | Uwatoko et al., 2019 [69] | MSA-C and MSA-P | 3D-Gene® Human miRNA oligo chip (Ver. 17.0)-TORAY Industries | 1720 (79 DE) | p < 0.05 | Plasma |
| 17 | Vallelunga et al., 2014 [62] | MSA-C and MSA-P | TaqMan Human MicroRNA Array v3.0 A and B (Applied Biosystems | Life Technologies™) | 754 (5 DE) | p < 0.05 | Serum |
| 18 | Ubhi et al., 2014 [68] | CBD | OneArray® Human microRNA Microarray v3 | 1087 (12 DE) | p < 0.05; FC > 2 | Brain: frontal cortex |
| 19 | Tatura et al., 2016 [70] | PSP | TaqMan Array MicroRNA A cards (Thermo Fisher Scientific) | 372 (4 DE) | p < 0.05; log FC ≥ 1 | Brain: inferior frontal gyri |
| 20 | Ubhi et al., 2014 [68] | PSP | OneArray® Human microRNA Microarray v3 | 1087 (12 DE) | p < 0.05; FC > 2 | Brain: frontal cortex |
| 21 | Hébert et al., 2013 [71] | DLB | Illumina GAIIx | 1921 (21 DE) | p < 0.05 | Brain: superior and middle temporal gyri (Brodmann Areas 21/22) |
| 22 | Hébert et al., 2013 [71] | FTLD | Illumina GAIIx | 1921 (21 DE) | p < 0.05 | Brain: superior and middle temporal gyri (Brodmann Areas 21/22) |
| 23 | Chen-Plotkin et al., 2012 [72] | FTLD | miRCURY LNA array version 11.0 (Exiqon) | 836 (11 DE) | p < 0.05 | Brain: frontal cortex |
| 24 | Hébert et al., 2013 [71] | AD | Illumina GAIIx | 1921 (17 DE) | p < 0.05 | Brain: superior and middle temporal gyri (Brodmann Areas 21/22) |
| 25 | Kumar et al., 2017 [73] | AD and MCI | Affymetrix GeneChip miRNA array v. 4.0 | 2584 (4 DE in AD; 50 DE in MCI) | p < 0.05; log FC ≥ 2 | Serum |
| 26 | Lugli et al., 2015 [74] | AD | Illumina HiSeq2500 | 2589 (20 DE) | p < 0.05 | Plasma |
| 27 | Wu et al., 2017 [75] | AD | Illumina HiSeq2500 Sequencer | 2042 (72 DE) | p < 0.05; log FC ≥ 2 | Serum |
| 28 | Hara et al., 2017 [76] | AD | Illumina Genome Analyzer IIx (GAIIx) | 2584 (serum: 20 DE; Temporal cortex: 213 DE) | p-adj. ≤ 0.05 | Serum and Brain: temporal cortex |
| 29 | Annese et al., 2018 [60] | AD | Illumina MiSeq platform | 2589 (40 DE) | p-adj. ≤ 0.05; log2 fold change | Brain: (1) hippocampal CA1 region; (2) middle temporal gyrus (Brodmann Area 21); and (3) the middle frontal gyrus (Brodmann Area 46) |
| 30 | Nunez-Iglesias et al., 2010 [77] | AD | 2042 (30 DE) | 470 (48 DE) | FDR < 0.05 | Brain: parietal lobe cortex |
| 31 | Patrick et al., 2017 [78] | AD | NanoString nCounter assay | 2042 (30 DE) | p-adj. < 0.05 | Brain: dorsolateral prefrontal cortex (Brodmann Areas 9 and 46) |
| 32 | Wang et al., 2011 [79] | AD | miRCURY™ LNA array version 11.0 (Exiqon, Denmark) | 904 (113 DE) | p < 0.05 | Brain: superior and middle temporal gyri (Brodmann Areas 21 and 22) |
| 33 | Hébert et al., 2008 [80] | AD | mirVana miRNA Bioarrays V2 (Ambion Inc.) | 328 (16 DE) | p < 0.05 | Brain: cerebral cortex |
| 34 | Van Harten et al., 2015 [81] | AD | qRT-PCR (Taqman Array MicroRNA cards A and B, v3.0) | 754 (24 DE) | p < 0.05 | CSF |
| 35 | Dong et al., 2015 [82] | AD | Illumina’s Solexa Sequencer | 721 (4 DE) | p < 0.05 | Serum |
| 36 | Lv et al., 2018 [83] | AD | MiRCURY™ Array (v.18.0) (Exiqon) | 1223 (28 DE) | p-adj. < 0.05; FC > 2 | CSF |
| 37 | Lau et al., 2013 [84] | AD | 1. nCounter Human miRNA Expression Assay Kit version 1 (Nanostring Technologie); and 2. Illumina HiSeq 2000 system | 641 (expression array) (Hippocampus: 35 DE); Prefrontal cortex: 41DE) and 2038 (Deep seq) (85 DE) | p-adj. < 0.05 (nCounter array); p-adj. < 0.001 (Deep seq) | Brain: (1) hippocampus; (2) prefrontal cortex |
| 38 | Ubhi et al., 2014 [68] | AD | OneArray® Human microRNA Microarray v3 | 1087 (13DE) | p < 0.05; FC > 2 | Brain: frontal cortex |
| 39 | Burgos et al., 2014 [61] | AD | Illumina HiSeq2000 | 2228 (CSF: 41 DE; serum: 20 DE) | p-adj. < 0.05; log2FC > 0.7; normalized mean > 5 mapped reads for each group | CSF and serum |
| 40 | Gui et al., 2015 [63] | AD | TaqMan Low-Density Array Human miRNA Panels (Applied Biosystems) | 746 (7 DE) | p-adj. < 0.05; FC > 2 | CSF |
3. Results
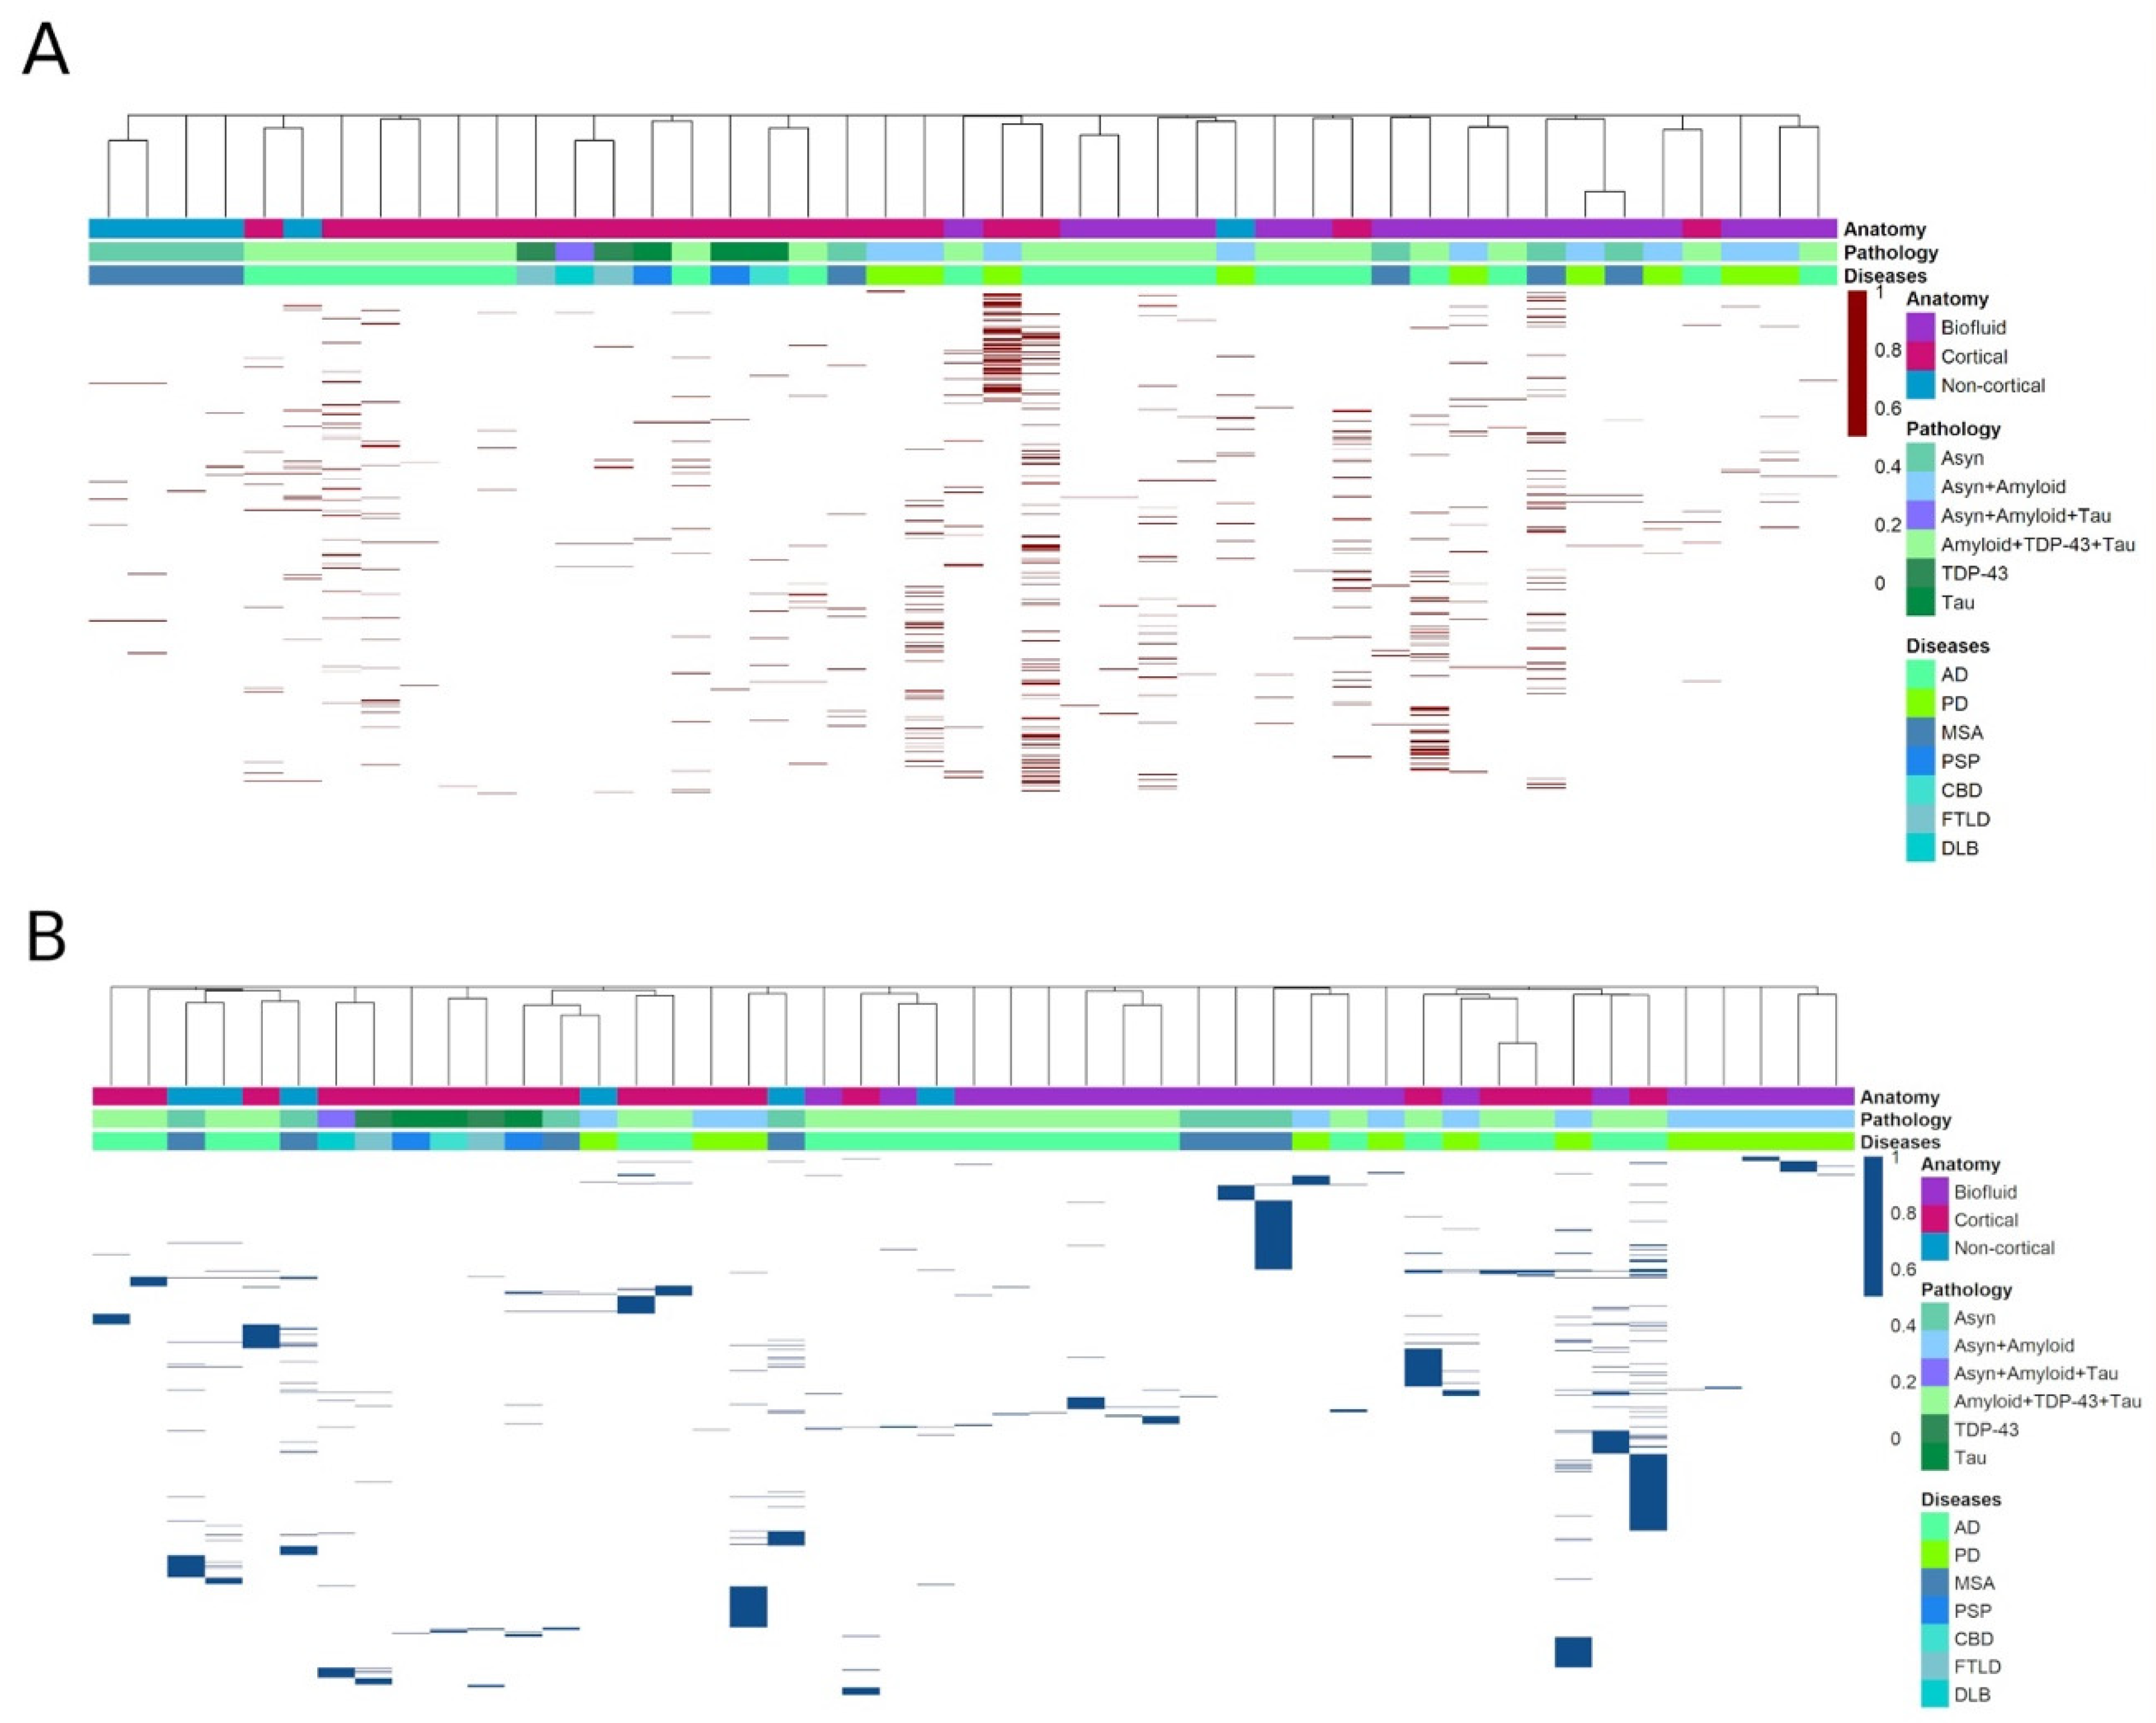
3.1. Heatmap Analysis
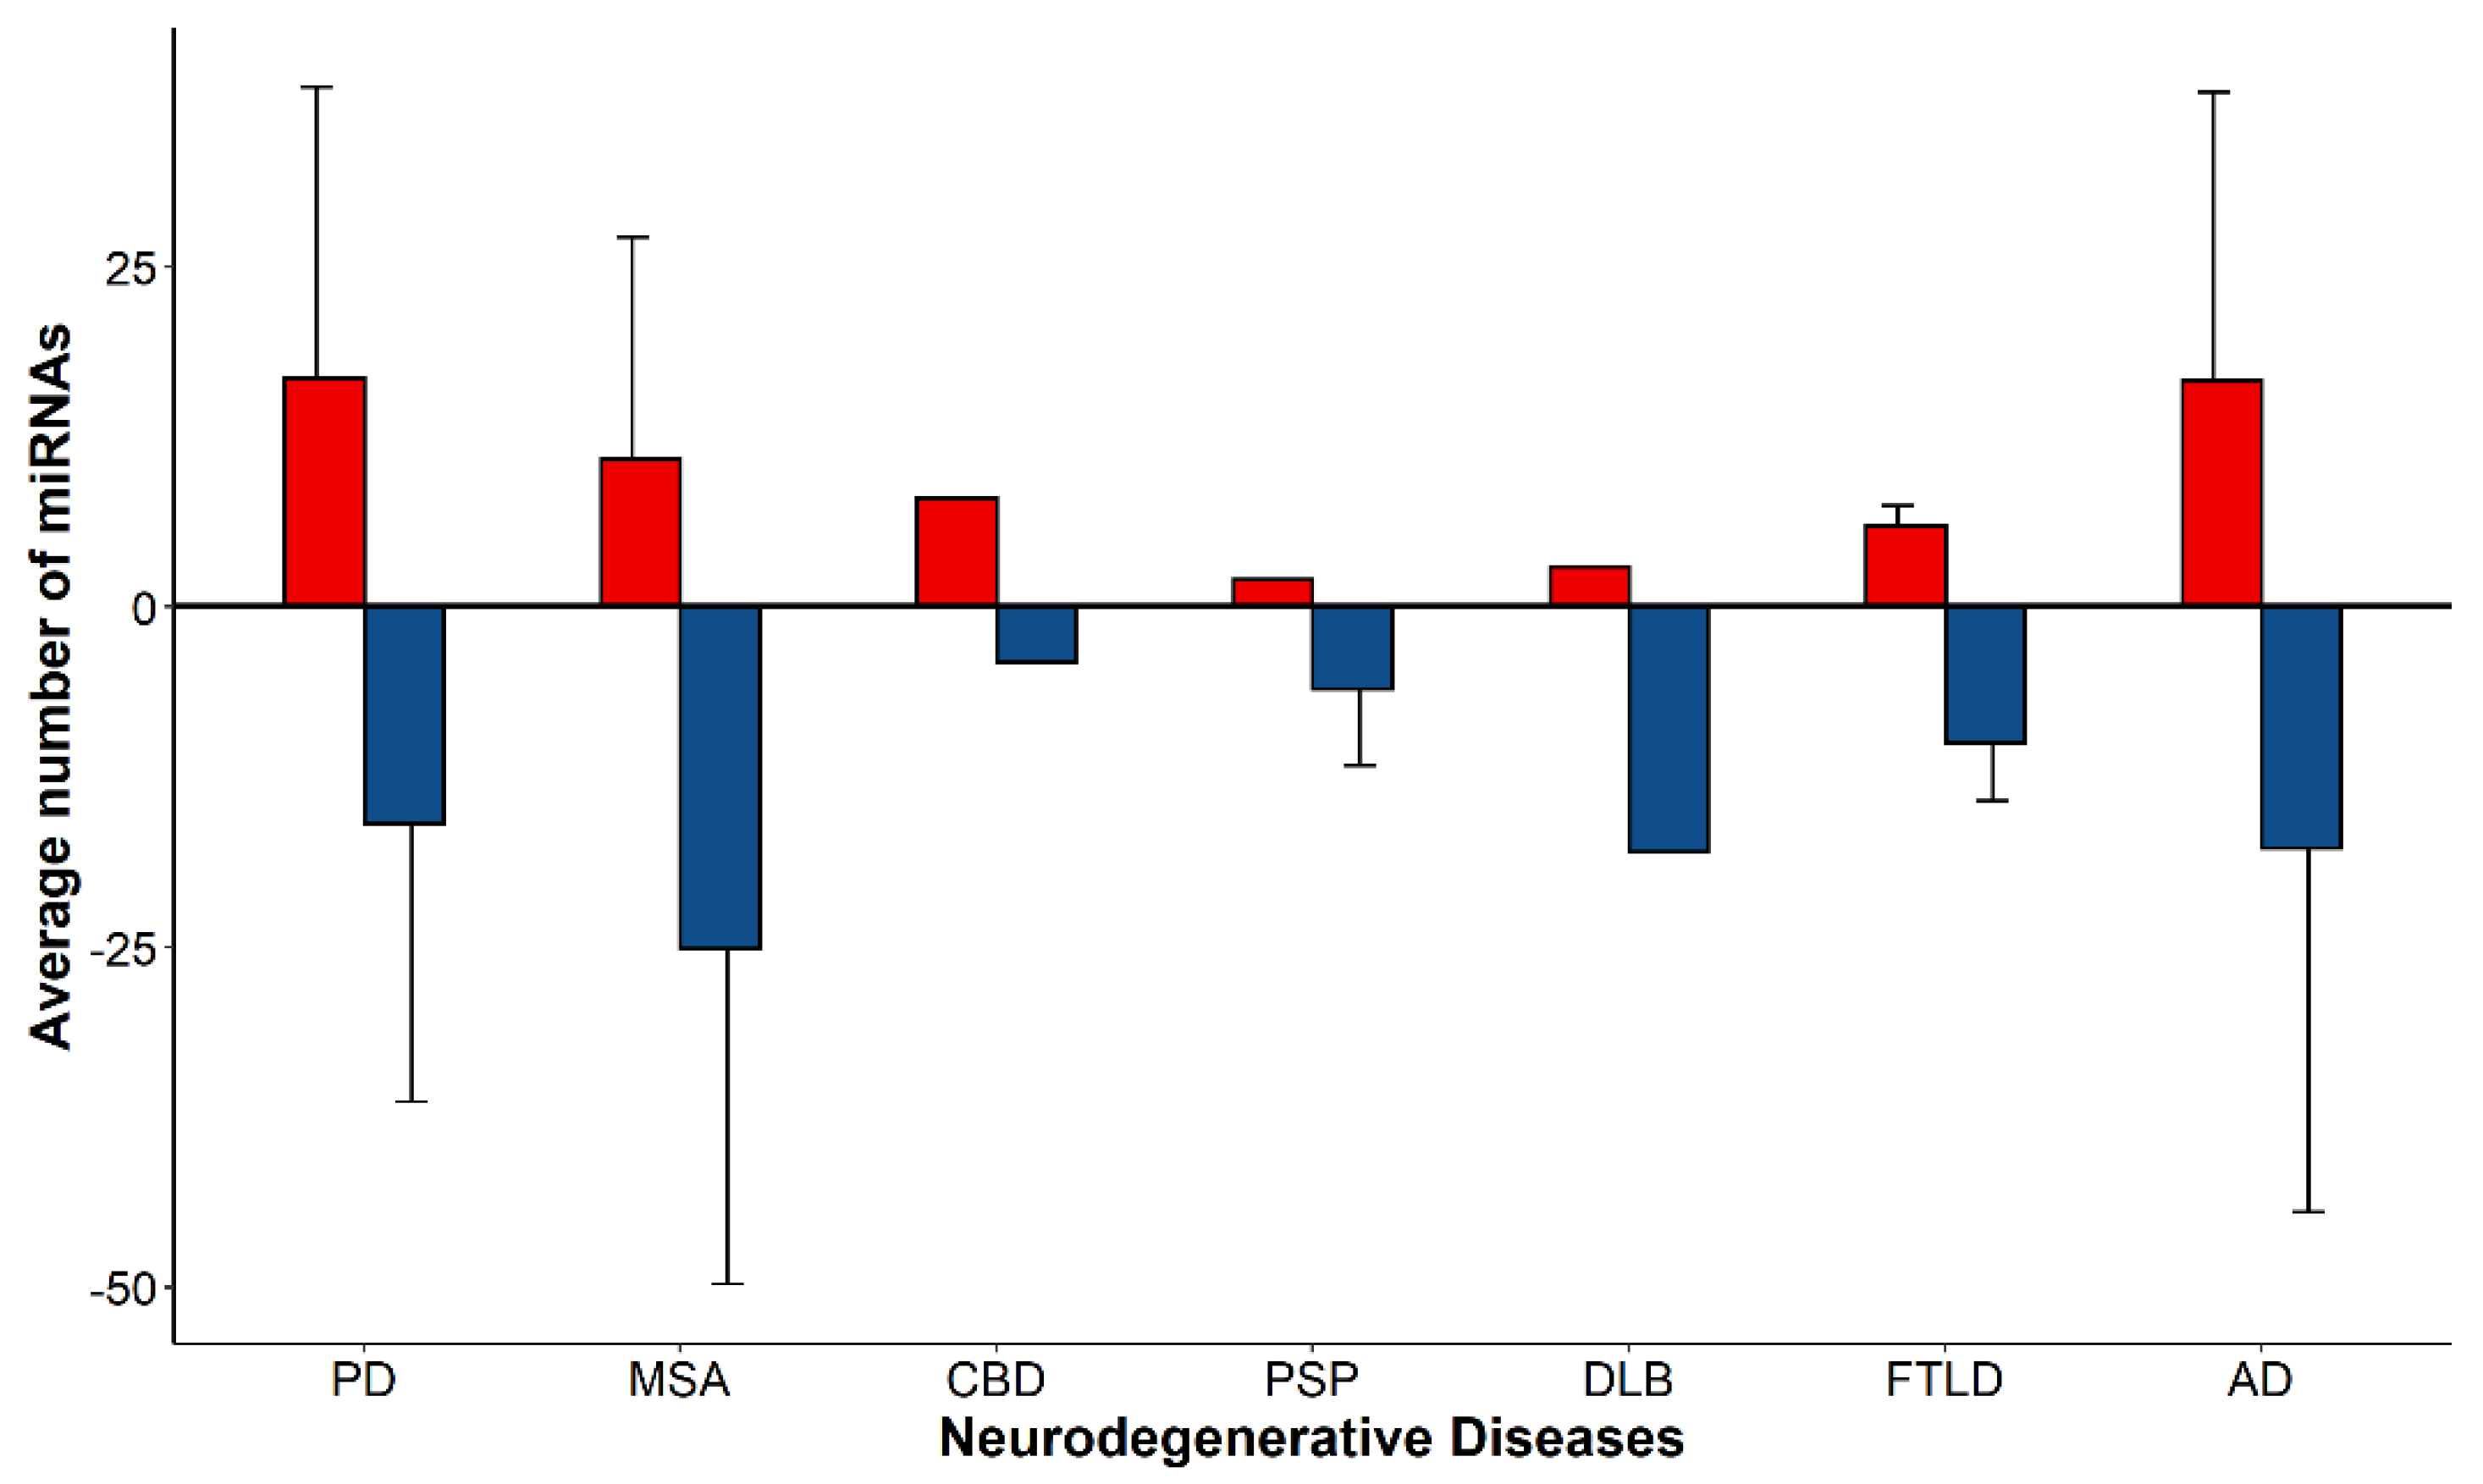
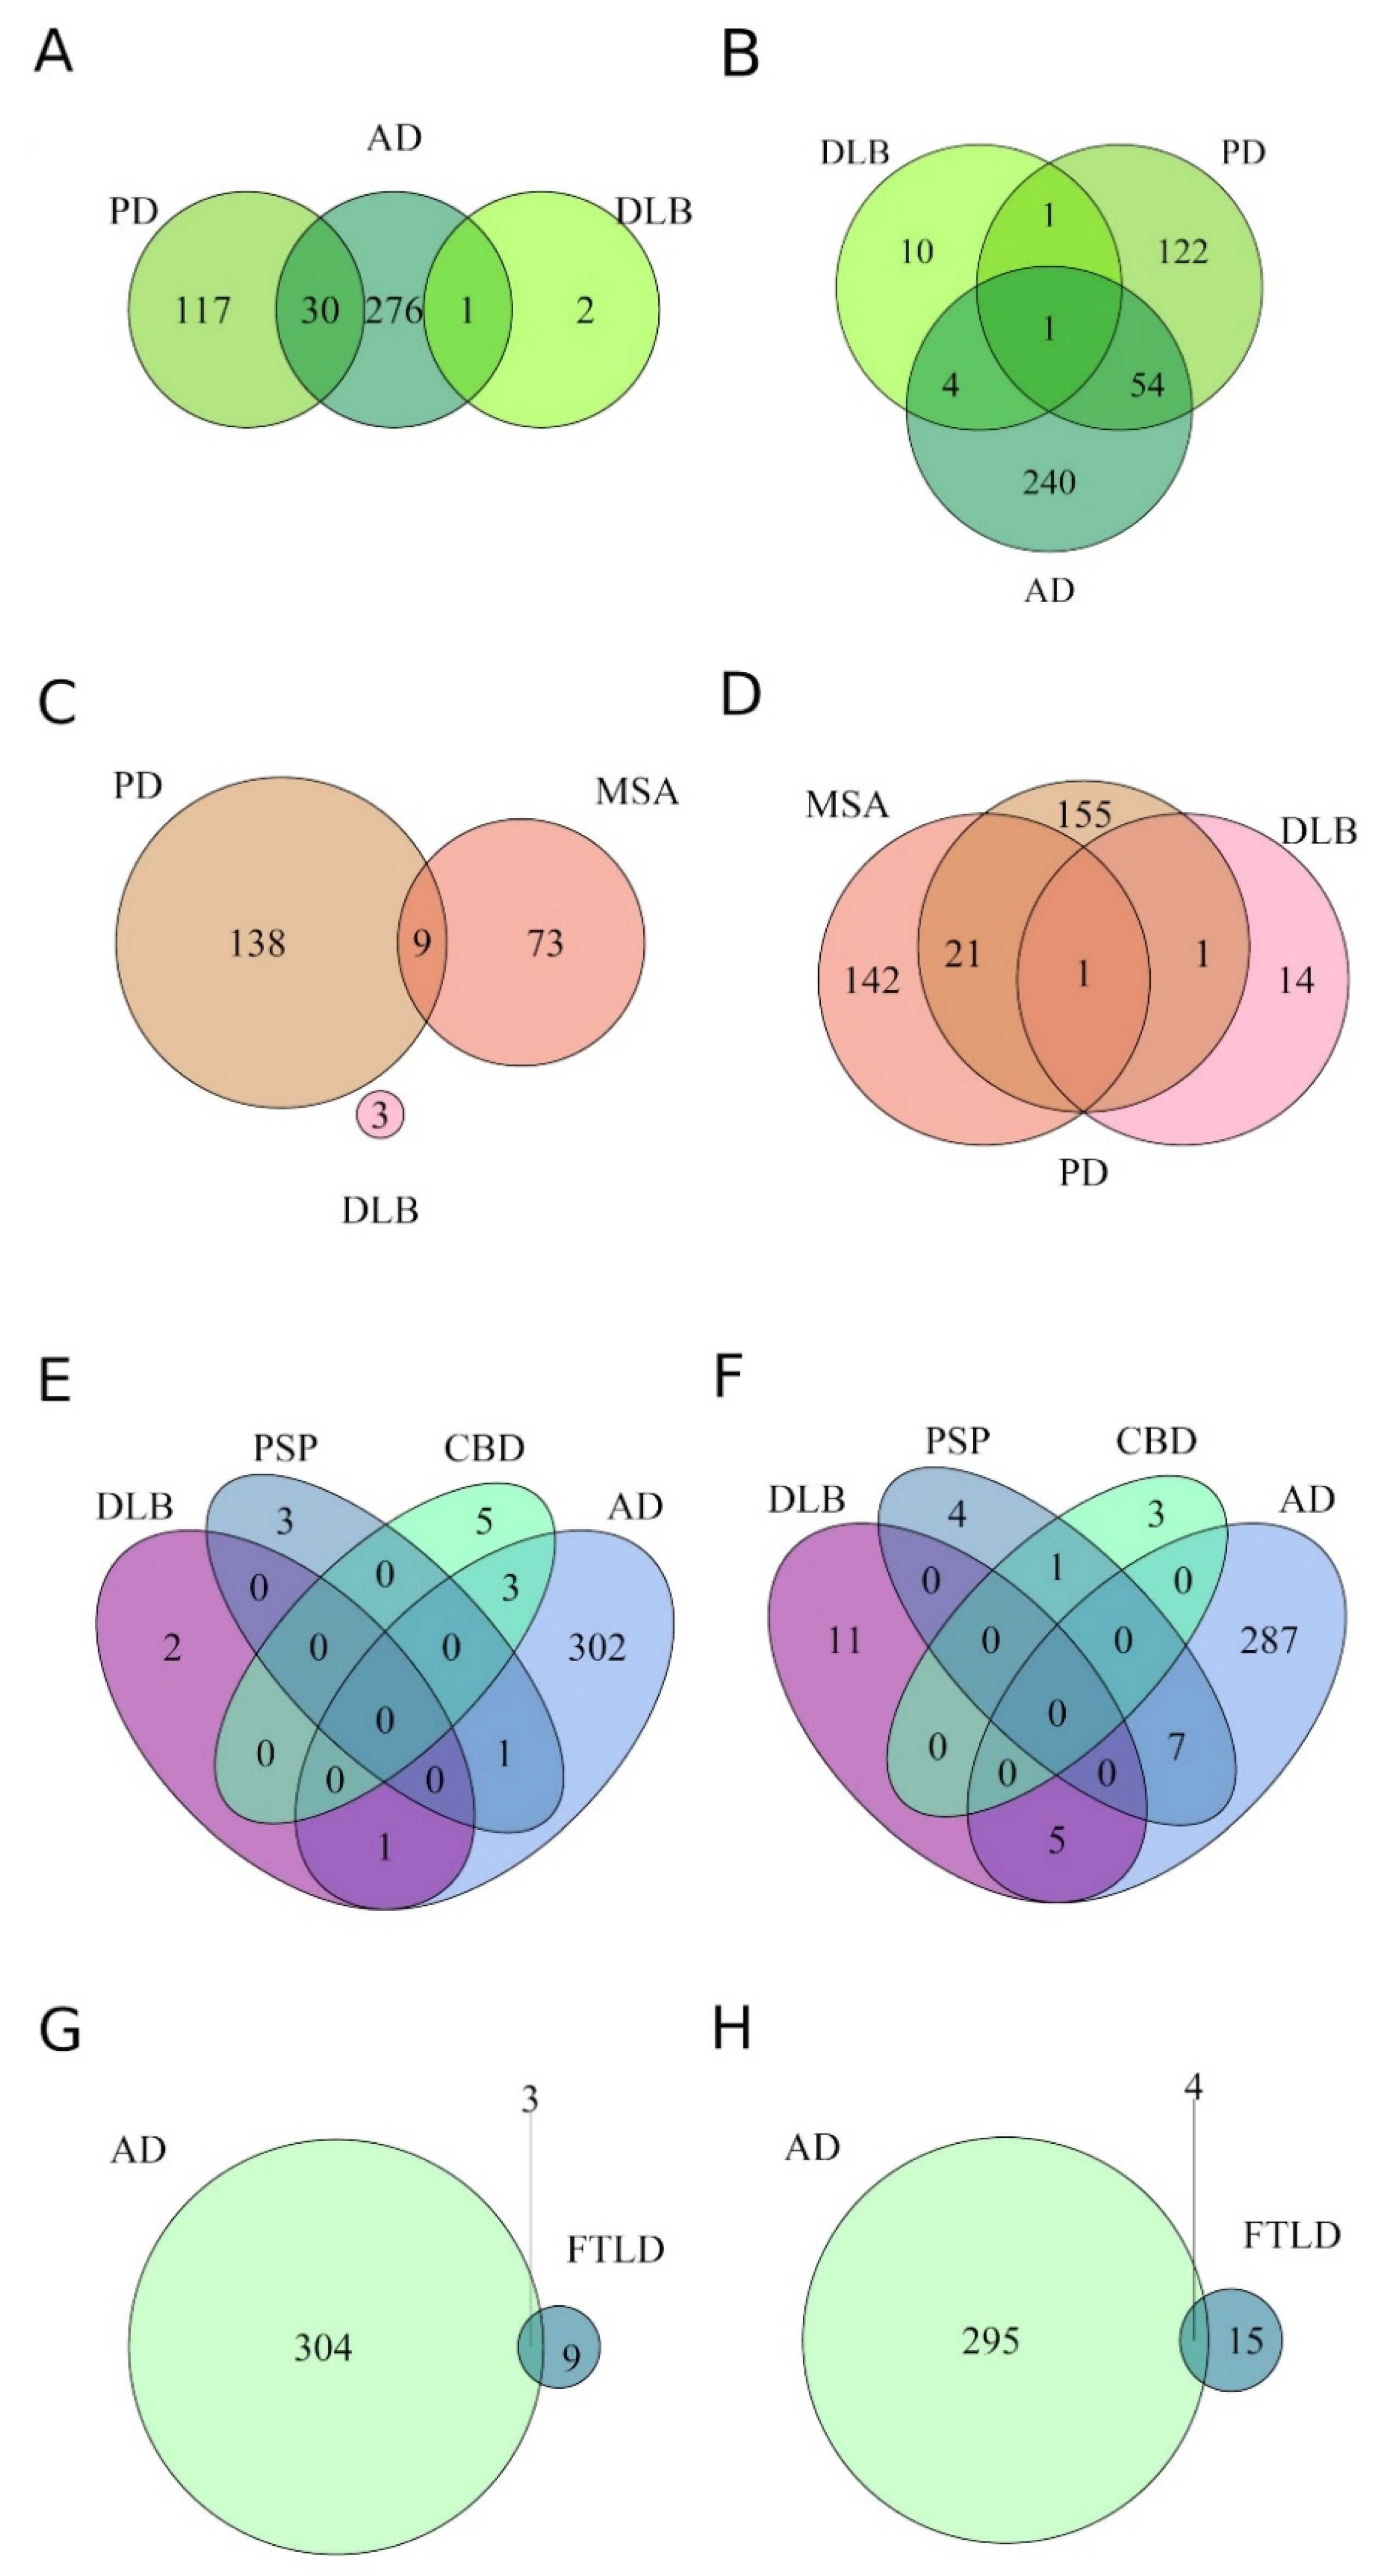
3.2. Differential Expression of miRNAs within Proteinopathies
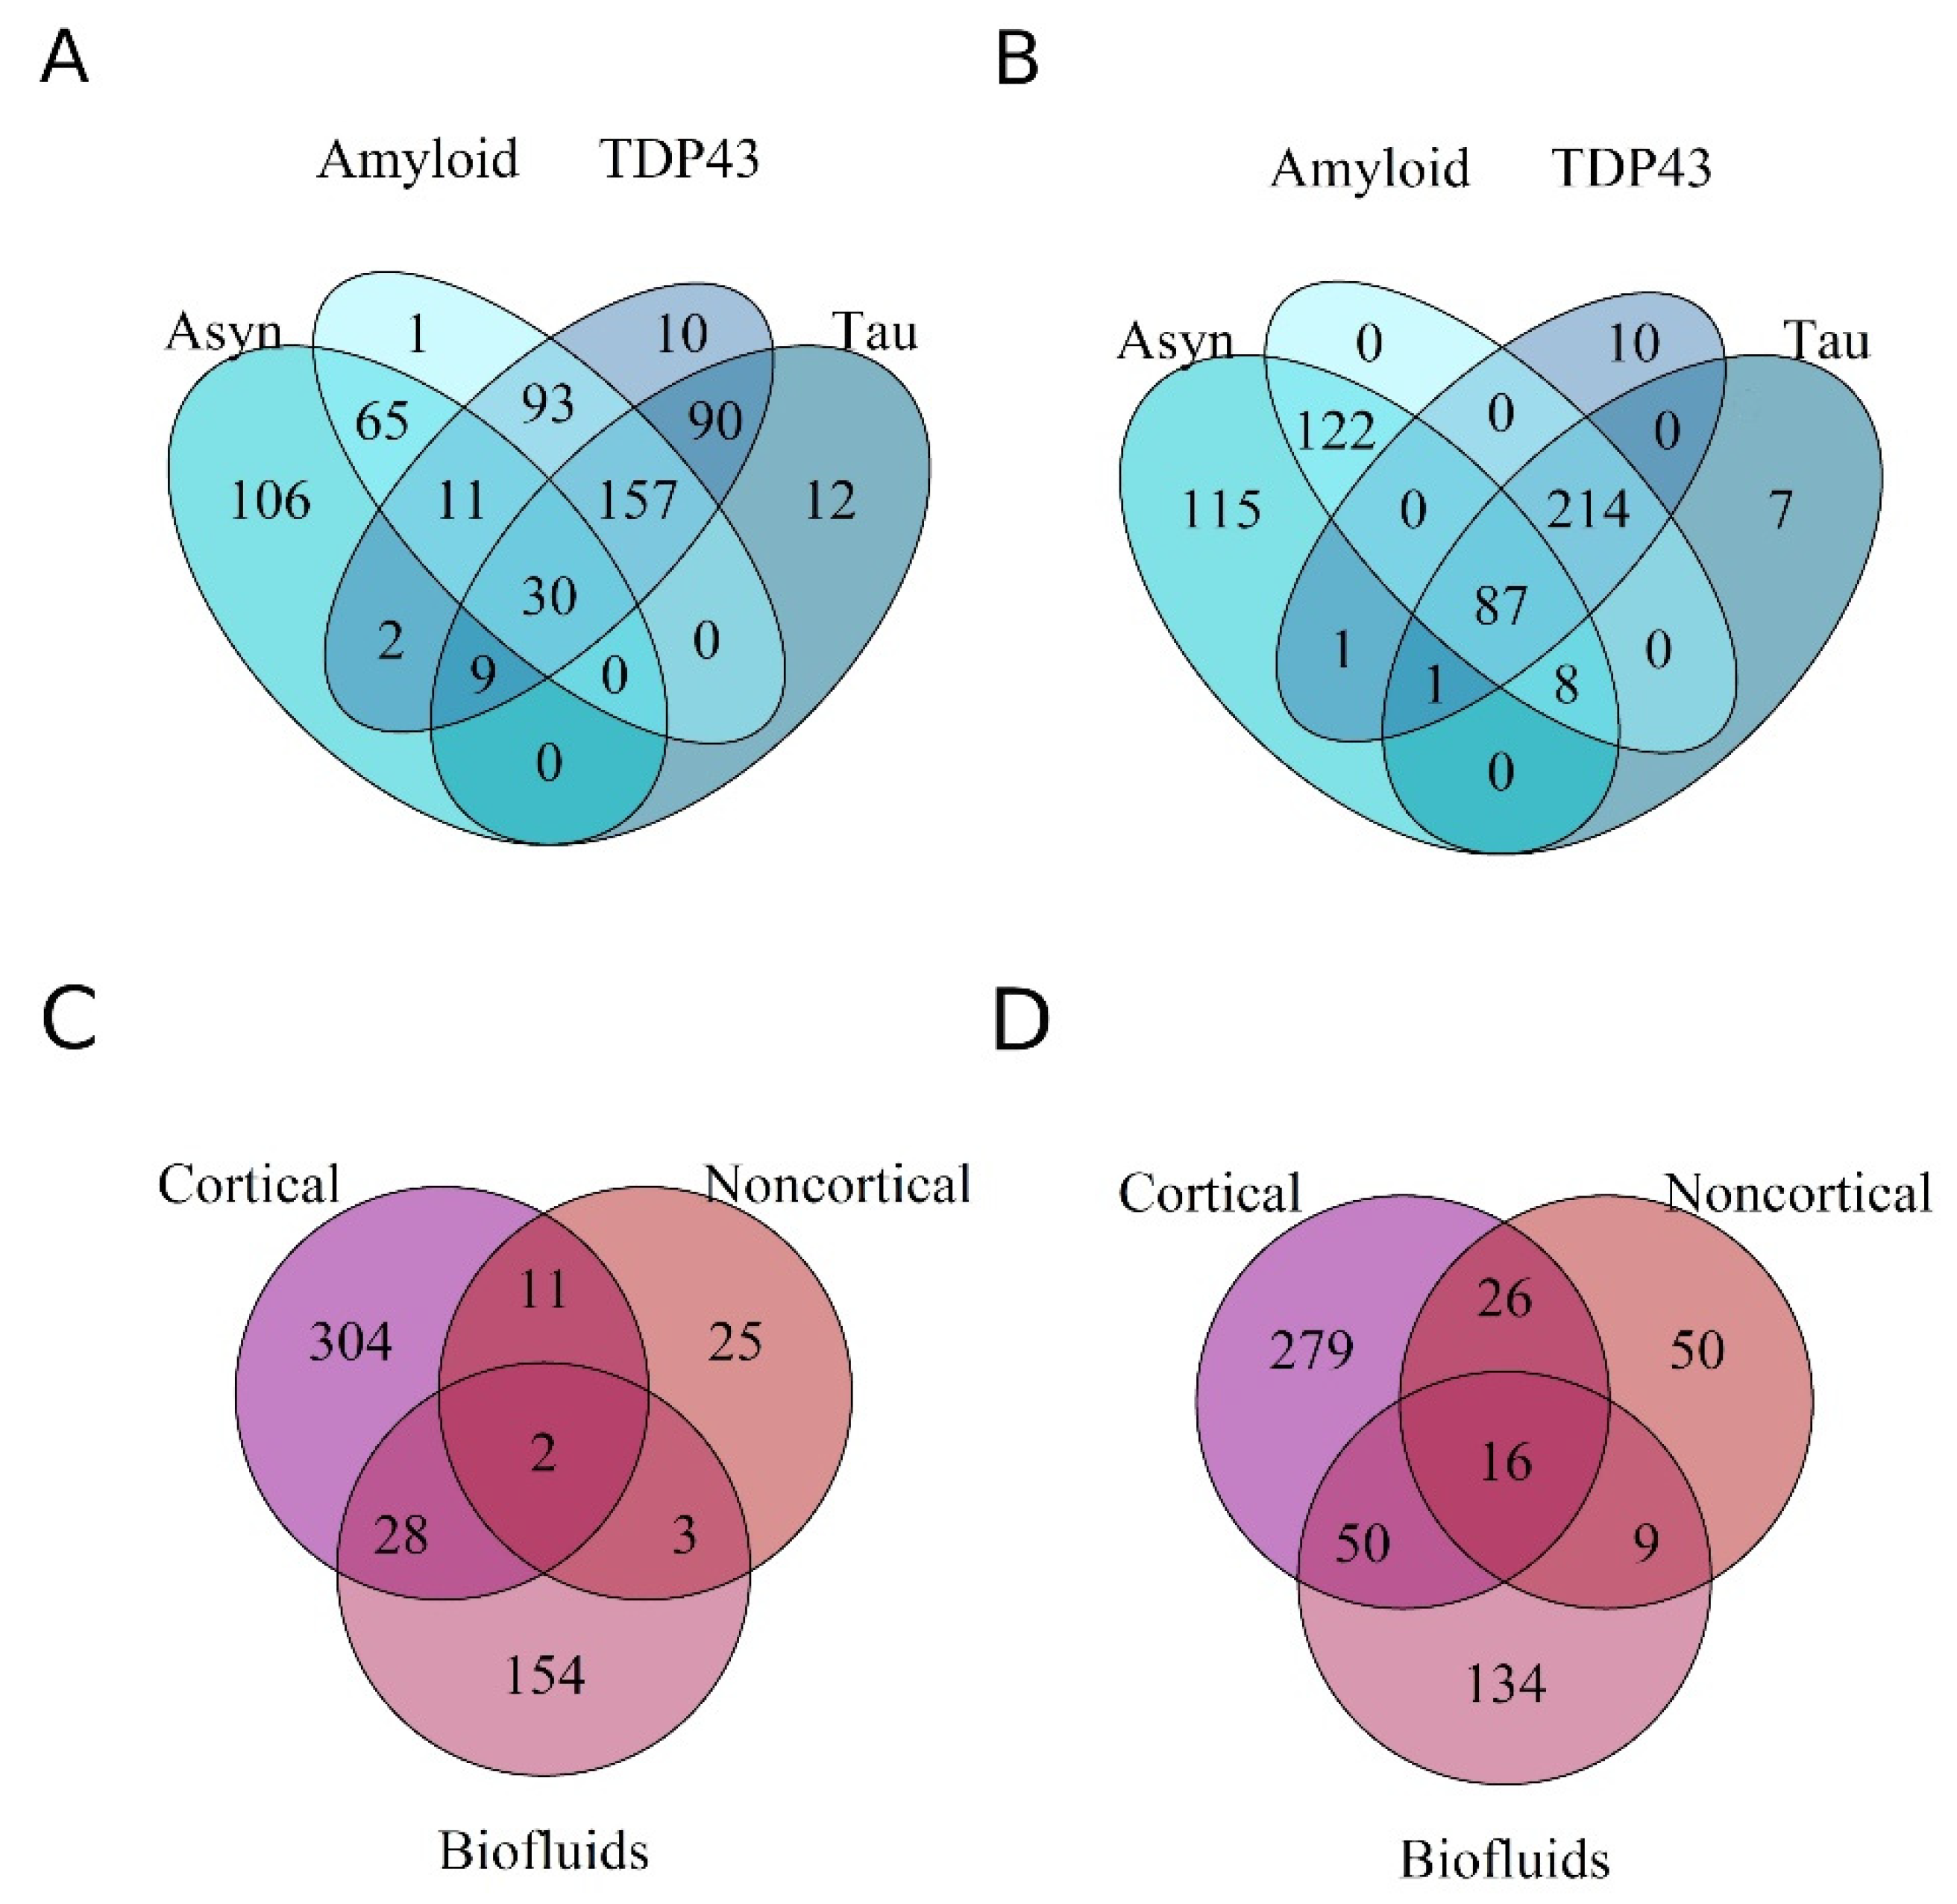
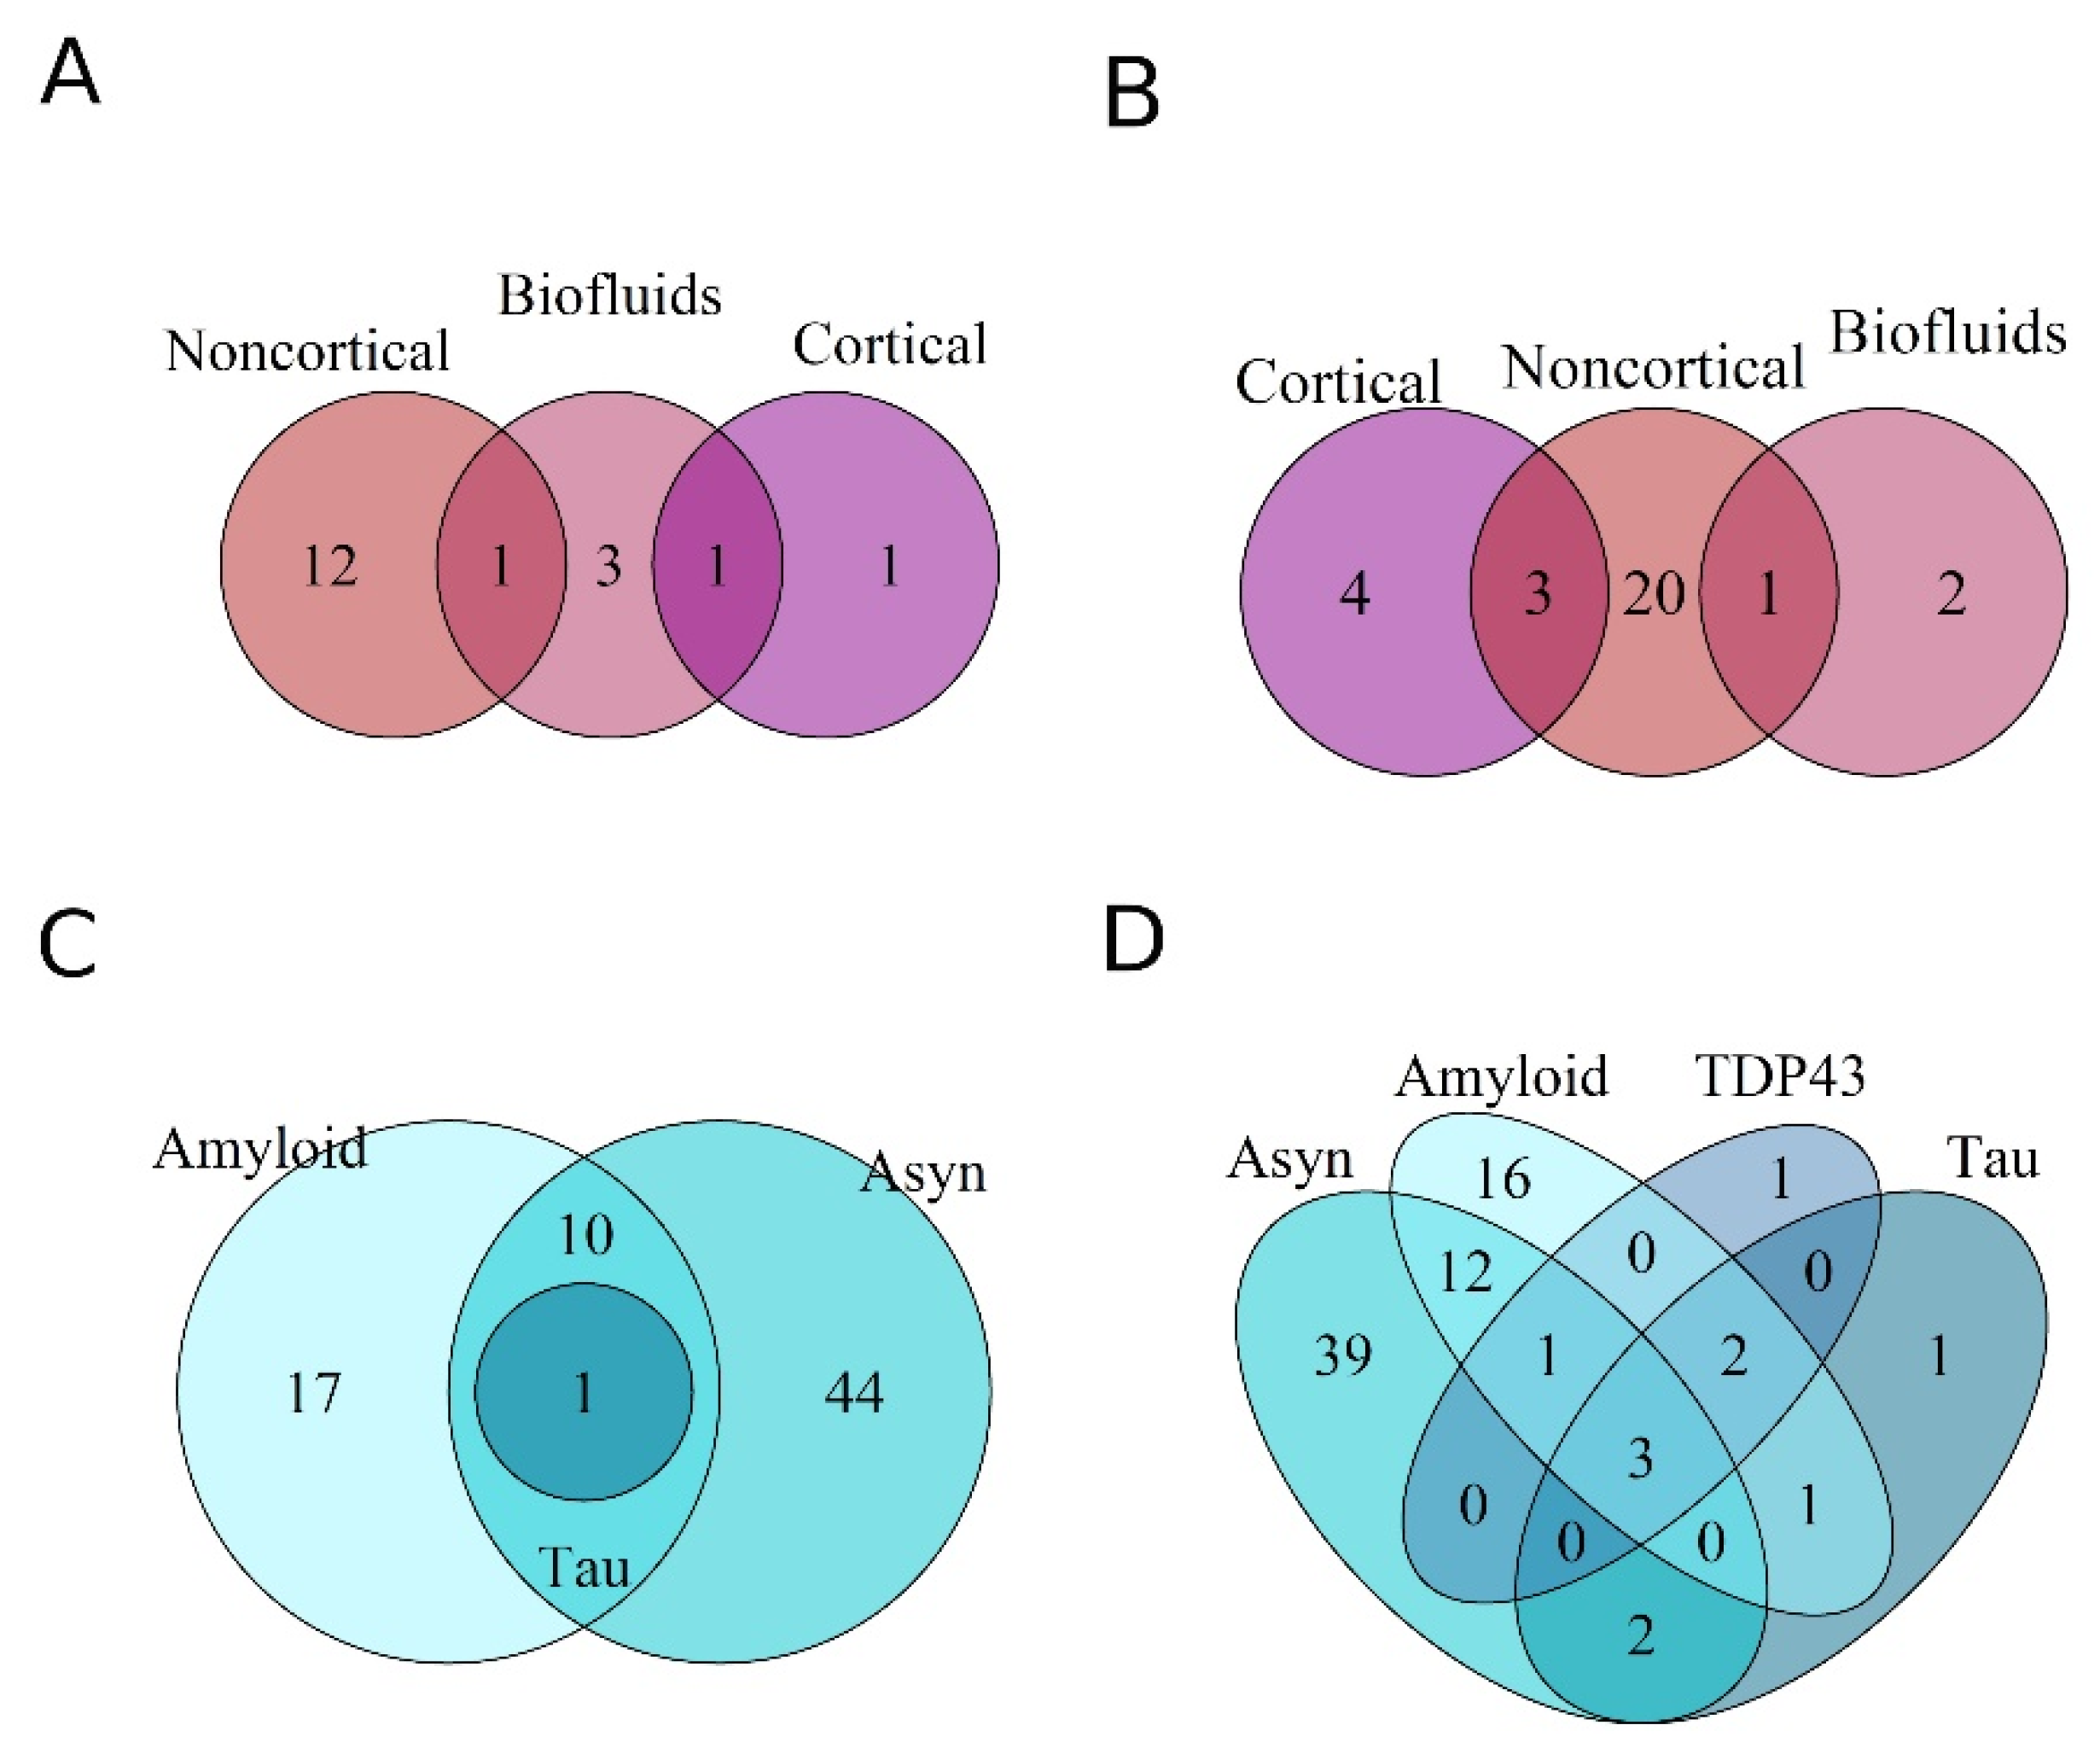
3.3. Differential Expression of miRNAs across Proteinopathies
3.4. Gene Set and Pathway Enrichment Analysis
4. Discussion
Author Contributions
Funding
Institutional Review Board Statement
Informed Consent Statement
Data Availability Statement
Acknowledgments
Conflicts of Interest
References
- Collaborators, G.U.N.D.; Feigin, V.L.; Vos, T.; Alahdab, F.; Amit, A.M.L.; Barnighausen, T.W.; Beghi, E.; Beheshti, M.; Chavan, P.P.; Criqui, M.H.; et al. Burden of Neurological Disorders across the US From 1990–2017: A global burden of disease study. JAMA Neurol. 2021, 78, 165–176. [Google Scholar] [CrossRef]
- Lee, V.M.-Y.; Goedert, M.; Trojanowski, J.Q. Neurodegenerative Tauopathies. Annu. Rev. Neurosci. 2001, 24, 1121–1159. [Google Scholar] [CrossRef] [PubMed]
- Gomperts, S.N.; Locascio, J.J.; Makaretz, S.J.; Schultz, A.; Caso, C.; Vasdev, N.; Sperling, R.; Growdon, J.H.; Dickerson, B.C.; Johnson, K. Tau Positron Emission Tomographic Imaging in the Lewy Body Diseases. JAMA Neurol. 2016, 73, 1334–1341. [Google Scholar] [CrossRef] [PubMed]
- Brück, D.; Wenning, G.; Stefanova, N.; Fellner, L. Glia and α-synuclein in neurodegeneration: A complex interaction. Neurobiol. Dis. 2016, 85, 262–274. [Google Scholar] [CrossRef] [PubMed] [Green Version]
- Prasansuklab, A.; Tencomnao, T. Amyloidosis in Alzheimer’s Disease: The Toxicity of Amyloid β (Aβ), Mechanisms of Its Accumulation and Implications of Medicinal Plants for Therapy. Evid.-Based Complement. Altern. Med. 2013, 2013, 413808. [Google Scholar] [CrossRef] [Green Version]
- Lim, E.W.; Aarsland, D.; Ffytche, D.; Taddei, R.N.; van Wamelen, D.; Wan, Y.M.; Tan, E.K.; Chaudhuri, K.R.; Lim, E.W.; Kings Parcog group MDS Nonmotor Study Group. Amyloid-β and Parkinson’s disease. J. Neurol. 2019, 266, 2605–2619. [Google Scholar] [CrossRef]
- Gomperts, S.N.; Rentz, D.M.; Moran, E.; Becker, J.A.; Locascio, J.J.; Klunk, W.E.; Mathis, C.A.; Elmaleh, D.R.; Shoup, T.; Fischman, A.J.; et al. Imaging amyloid deposition in Lewy body diseases. Neurology 2008, 71, 903–910. [Google Scholar] [CrossRef]
- Van Steenoven, I.; Van Der Flier, W.M.; Scheltens, P.; Teunissen, C.E.; Lemstra, A.W. Amyloid-β peptides in cerebrospinal fluid of patients with dementia with Lewy bodies. Alzheimers Res. Ther. 2019, 11, 83. [Google Scholar] [CrossRef]
- Hasegawa, M.; Arai, T.; Nonaka, T.; Kametani, F.; Yoshida, M.; Hashizume, Y.; Beach, T.G.; Buratti, E.; Baralle, F.; Morita, M.; et al. Phosphorylated TDP-43 in frontotemporal lobar degeneration and amyotrophic lateral sclerosis. Ann. Neurol. 2008, 64, 60–70. [Google Scholar] [CrossRef] [Green Version]
- Josephs, K.A.; Murray, M.; Whitwell, J.L.; Tosakulwong, N.; Weigand, S.D.; Petrucelli, L.; Liesinger, A.M.; Petersen, R.C.; Parisi, J.E.; Dickson, D.W. Updated TDP-43 in Alzheimer’s disease staging scheme. Acta Neuropathol. 2016, 131, 571–585. [Google Scholar] [CrossRef]
- Thal, D.R.; Rüb, U.; Orantes, M.; Braak, H. Phases of Aβ-deposition in the human brain and its relevance for the development of AD. Neurology 2002, 58, 1791–1800. [Google Scholar] [CrossRef] [PubMed]
- Valera, E.; Masliah, E. The neuropathology of multiple system atrophy and its therapeutic implications. Auton. Neurosci. 2018, 211, 1–6. [Google Scholar] [CrossRef] [PubMed] [Green Version]
- Ahmed, Z.; Asi, Y.T.; Sailer, A.; Lees, A.J.; Houlden, H.; Revesz, T.; Holton, J.L. The neuropathology, pathophysiology and genetics of multiple system atrophy. Neuropathol. Appl. Neurobiol. 2012, 38, 4–24. [Google Scholar] [CrossRef] [PubMed]
- Braak, H.; Del Tredici, K.; Rüb, U.; de Vos, R.A.; Steur, E.N.J.; Braak, E. Staging of brain pathology related to sporadic Parkinson’s disease. Neurobiol. Aging 2003, 24, 197–211. [Google Scholar] [CrossRef]
- Braak, H.; Thal, D.R.; Ghebremedhin, E.; Del Tredici, K. Stages of the pathologic process in Alzheimer disease: Age categories from 1 to 100 years. J. Neuropathol. Exp. Neurol. 2011, 70, 960–969. [Google Scholar] [CrossRef] [PubMed]
- Dugger, B.N.; Dickson, D.W. Pathology of Neurodegenerative Diseases. Cold Spring Harb. Perspect. Biol. 2017, 9, a028035. [Google Scholar] [CrossRef]
- Ebashi, M.; Ito, Y.; Uematsu, M.; Nakamura, A.; Hirokawa, K.; Kamei, S.; Uchihara, T. How to demix Alzheimer-type and PSP-type tau lesions out of their mixture -hybrid approach to dissect comorbidity-. Acta Neuropathol. Commun. 2019, 7, 71. [Google Scholar] [CrossRef] [Green Version]
- Ling, H.; Kovacs, G.G.; Vonsattel, J.P.G.; Davey, K.; Mok, K.Y.; Hardy, J.; Morris, H.R.; Warner, T.T.; Holton, J.L.; Revesz, T. Astrogliopathy predominates the earliest stage of corticobasal degeneration pathology. Brain 2016, 139, 3237–3252. [Google Scholar] [CrossRef] [Green Version]
- MacKenzie, I.R.A.; Neumann, M. Molecular neuropathology of frontotemporal dementia: Insights into disease mechanisms from postmortem studies. J. Neurochem. 2016, 138, 54–70. [Google Scholar] [CrossRef]
- Marui, W.; Iseki, E.; Nakai, T.; Miura, S.; Kato, M.; Uéda, K.; Kosaka, K. Progression and staging of Lewy pathology in brains from patients with dementia with Lewy bodies. J. Neurol. Sci. 2002, 195, 153–159. [Google Scholar] [CrossRef]
- Allen, M.; Carrasquillo, M.M.; Funk, C.; Heavner, B.; Zou, F.; Younkin, C.S.; Burgess, J.D.; Chai, H.-S.; Crook, J.; Eddy, J.A.; et al. Human whole genome genotype and transcriptome data for Alzheimer’s and other neurodegenerative diseases. Sci. Data 2016, 3, 160089. [Google Scholar] [CrossRef] [PubMed]
- Hossein-Nezhad, A.; Fatemi, R.P.; Ahmad, R.; Peskind, E.R.; Zabetian, C.P.; Hu, S.-C.; Shi, M.; Wahlestedt, C.; Zhang, J.; Faghihi, M.A. Transcriptomic Profiling of Extracellular RNAs Present in Cerebrospinal Fluid Identifies Differentially Expressed Transcripts in Parkinson’s Disease. J. Park. Dis. 2016, 6, 109–117. [Google Scholar] [CrossRef] [PubMed] [Green Version]
- Jiao, F.; Wang, Q.; Zhang, P.; Bu, L.; Yan, J.; Tian, B. Expression signatures of long non-coding RNA in the substantia nigra of pre-symptomatic mouse model of Parkinson’s disease. Behav. Brain Res. 2017, 331, 123–130. [Google Scholar] [CrossRef]
- Karim, S.; Mirza, Z.; Ansari, S.A.; Rasool, M.; Iqbal, Z.; Sohrab, S.S.; Kamal, M.A.; Abuzenadah, A.M.; Al-Qahtani, M.H. Transcriptomics Study of Neurodegenerative Disease: Emphasis on Synaptic Dysfunction Mechanism in Alzheimer’s Disease. CNS Neurol. Disord.-Drug Targets 2014, 13, 1202–1212. [Google Scholar] [CrossRef] [PubMed]
- Majidinia, M.; Mihanfar, A.; Rahbarghazi, R.; Nourazarian, A.; Bagca, B.; Avci, B. The roles of non-coding RNAs in Parkinson’s disease. Mol. Biol. Rep. 2016, 43, 1193–1204. [Google Scholar] [CrossRef]
- Watson, C.N.; Belli, A.; Di Pietro, V. Small Non-coding RNAs: New Class of Biomarkers and Potential Therapeutic Targets in Neurodegenerative Disease. Front. Genet. 2019, 10, 364. [Google Scholar] [CrossRef]
- Broughton, J.P.; Lovci, M.T.; Huang, J.L.; Yeo, G.W.; Pasquinelli, A.E. Pairing beyond the Seed Supports MicroRNA Targeting Specificity. Mol. Cell 2016, 64, 320–333. [Google Scholar] [CrossRef] [Green Version]
- Ha, M.; Kim, V.N. Regulation of microRNA biogenesis. Nat. Rev. Mol. Cell Biol. 2014, 15, 509–524. [Google Scholar] [CrossRef]
- Vasudevan, S. Posttranscriptional Upregulation by MicroRNAs. Wiley Interdiscip. Rev. RNA 2012, 3, 311–330. [Google Scholar] [CrossRef]
- Krol, J.; Loedige, I.; Filipowicz, W. The widespread regulation of microRNA biogenesis, function and decay. Nat. Rev. Genet. 2010, 11, 597–610. [Google Scholar] [CrossRef]
- Friedman, R.C.; Farh, K.K.-H.; Burge, C.B.; Bartel, D.P. Most mammalian mRNAs are conserved targets of microRNAs. Genome Res. 2009, 19, 92–105. [Google Scholar] [CrossRef] [PubMed] [Green Version]
- Lekka, E.; Hall, J. Noncoding RNA s in disease. FEBS Lett. 2018, 592, 2884–2900. [Google Scholar] [CrossRef] [PubMed]
- Hu, Y.-B.; Li, C.-B.; Song, N.; Zou, Y.; Chen, S.-D.; Ren, R.-J.; Wang, G. Corrigendum: Diagnostic Value of microRNA for Alzheimer’s Disease: A Systematic Review and Meta-Analysis. Front. Aging Neurosci. 2017, 9, 35. [Google Scholar] [CrossRef] [PubMed]
- Moradifard, S.; Hoseinbeyki, M.; Ganji, S.M.; Minuchehr, Z. Analysis of microRNA and Gene Expression Profiles in Alzheimer’s Disease: A Meta-Analysis Approach. Sci. Rep. 2018, 8, 4767. [Google Scholar] [CrossRef]
- Su, L.; Chen, S.; Zheng, C.; Wei, H.; Song, X. Meta-Analysis of Gene Expression and Identification of Biological Regulatory Mechanisms in Alzheimer’s Disease. Front. Neurosci. 2019, 13, 633. [Google Scholar] [CrossRef] [Green Version]
- Takousis, P.; Sadlon, A.; Schulz, J.; Wohlers, I.; Dobricic, V.; Middleton, L.; Lill, C.M.; Perneczky, R.; Bertram, L. Differential expression of microRNAs in Alzheimer’s disease brain, blood, and cerebrospinal fluid. Alzheimer’s Dement. 2019, 15, 1468–1477. [Google Scholar] [CrossRef]
- Zhang, Y.-H.; Bai, S.-F.; Yan, J.-Q. Blood circulating miRNAs as biomarkers of Alzheimer’s disease: A systematic review and meta-analysis. Biomark. Med. 2019, 13, 1045–1054. [Google Scholar] [CrossRef]
- Chi, J.; Xie, Q.; Jia, J.; Liu, X.; Sun, J.; Deng, Y.; Yi, L. Integrated Analysis and Identification of Novel Biomarkers in Parkinson’s Disease. Front. Aging Neurosci. 2018, 10, 178. [Google Scholar] [CrossRef]
- Schulz, J.; Takousis, P.; Wohlers, I.; Itua, I.O.; Dobricic, V.; Rücker, G.; Binder, H.; Middleton, L.; Ioannidis, J.P.; Perneczky, R.; et al. Meta-analyses identify differentially expressed microRNAs in Parkinson’s disease. Ann. Neurol. 2019, 85, 835–851. [Google Scholar] [CrossRef]
- Su, L.; Wang, C.; Zheng, C.; Wei, H.; Song, X. A meta-analysis of public microarray data identifies biological regulatory networks in Parkinson’s disease. BMC Med. Genom. 2018, 11, 40. [Google Scholar] [CrossRef] [Green Version]
- Wang, Q.; Zhang, Y.; Wang, M.; Song, W.-M.; Shen, Q.; McKenzie, A.; Choi, I.; Zhou, X.; Pan, P.-Y.; Yue, Z.; et al. The landscape of multiscale transcriptomic networks and key regulators in Parkinson’s disease. Nat. Commun. 2019, 10, 5234. [Google Scholar] [CrossRef] [PubMed]
- Durrenberger, P.F.; Fernando, F.S.; Kashefi, S.N.; Bonnert, T.P.; Seilhean, D.; Nait-Oumesmar, B.; Schmitt, A.; Gebicke-Haerter, P.J.; Falkai, P.; Grünblatt, E.; et al. Common mechanisms in neurodegeneration and neuroinflammation: A BrainNet Europe gene expression microarray study. J. Neural Transm. 2015, 122, 1055–1068. [Google Scholar] [CrossRef] [PubMed]
- Labadorf, A.; Choi, S.H.; Myers, R.H. Evidence for a Pan-Neurodegenerative Disease Response in Huntington’s and Parkinson’s Disease Expression Profiles. Front. Mol. Neurosci. 2018, 10, 430. [Google Scholar] [CrossRef] [PubMed] [Green Version]
- Noori, A.; Mezlini, A.M.; Hyman, B.T.; Serrano-Pozo, A.; Das, S. Systematic review and meta-analysis of human transcriptomics reveals neuroinflammation, deficient energy metabolism, and proteostasis failure across neurodegeneration. Neurobiol. Dis. 2021, 149, 105225. [Google Scholar] [CrossRef]
- Li, M.D.; Burns, T.C.; Morgan, A.A.; Khatri, P. Integrated multi-cohort transcriptional meta-analysis of neurodegenerative diseases. Acta Neuropathol. Commun. 2014, 2, 93. [Google Scholar] [CrossRef]
- La Manno, G.; Soldatov, R.; Zeisel, A.; Braun, E.; Hochgerner, H.; Petukhov, V.; Lidschreiber, K.; Kastriti, M.E.; Lönnerberg, P.; Furlan, A.; et al. RNA velocity of single cells. Nature 2018, 560, 494–498. [Google Scholar] [CrossRef] [Green Version]
- Zeisel, A.; Muñoz-Manchado, A.B.; Codeluppi, S.; Lönnerberg, P.; La Manno, G.; Juréus, A.; Marques, S.; Munguba, H.; He, L.; Betsholtz, C.; et al. Cell types in the mouse cortex and hippocampus revealed by single-cell RNA-seq. Science (80-) 2015, 347, 1138–1142. [Google Scholar] [CrossRef]
- Kolde, R.; Laur, S.; Adler, P.; Vilo, J. Robust rank aggregation for gene list integration and meta-analysis. Bioinformatics 2012, 28, 573–580. [Google Scholar] [CrossRef] [Green Version]
- R Studio Team. RStudio: Integrated Development for R; RStudio, PBC: Boston, MA, USA, 2020; Available online: http://www.rstudio.com/ (accessed on 16 May 2022).
- Sticht, C.; de la Torre, C.; Parveen, A.; Gretz, N. miRWalk: An online resource for prediction of microRNA binding sites. PLoS ONE 2018, 13, e0206239. [Google Scholar] [CrossRef]
- Mootha, V.K.; Lindgren, C.M.; Eriksson, K.-F.; Subramanian, A.; Sihag, S.; Lehar, J.; Puigserver, P.; Carlsson, E.; Ridderstråle, M.; Laurila, E.; et al. PGC-1α-responsive genes involved in oxidative phosphorylation are coordinately downregulated in human diabetes. Nat. Genet. 2003, 34, 267–273. [Google Scholar] [CrossRef]
- Subramanian, A.; Tamayo, P.; Mootha, V.K.; Mukherjee, S.; Ebert, B.L.; Gillette, M.A.; Paulovich, A.; Pomeroy, S.L.; Golub, T.R.; Lander, E.S.; et al. Gene set enrichment analysis: A knowledge-based approach for interpreting genome-wide expression profiles. Proc. Natl. Acad. Sci. USA 2005, 102, 15545–15550. [Google Scholar] [CrossRef] [PubMed] [Green Version]
- Cogswell, J.P.; Ward, J.; Taylor, I.A.; Waters, M.; Shi, Y.; Cannon, B.; Kelnar, K.; Kemppainen, J.; Brown, D.; Chen, C.; et al. Identification of miRNA Changes in Alzheimer’s Disease Brain and CSF Yields Putative Biomarkers and Insights into Disease Pathways. J. Alzheimer’s Dis. 2008, 14, 27–41. [Google Scholar] [CrossRef] [PubMed]
- Schulze, M.; Sommer, A.; Plötz, S.; Farrell, M.; Winner, B.; Grosch, J.; Winkler, J.; Riemenschneider, M.J. Sporadic Parkinson’s disease derived neuronal cells show disease-specific mRNA and small RNA signatures with abundant deregulation of piRNAs. Acta Neuropathol. Commun. 2018, 6, 58. [Google Scholar] [CrossRef] [PubMed] [Green Version]
- Hoss, A.G.; Labadorf, A.; Beach, T.G.; Latourelle, J.C.; Myers, R.H. microRNA Profiles in Parkinson’s Disease Prefrontal Cortex. Front. Aging Neurosci. 2016, 8, 36. [Google Scholar] [CrossRef] [Green Version]
- Wake, C.; Labadorf, A.; Dumitriu, A.; Hoss, A.G.; Bregu, J.; Albrecht, K.H.; DeStefano, A.L.; Myers, R.H. Novel microRNA discovery using small RNA sequencing in post-mortem human brain. BMC Genom. 2016, 17, 776. [Google Scholar] [CrossRef] [Green Version]
- Ding, H.; Huang, Z.; Chen, M.; Wang, C.; Chen, X.; Chen, J.; Zhang, J. Identification of a panel of five serum miRNAs as a biomarker for Parkinson’s disease. Park. Relat. Disord. 2016, 22, 68–73. [Google Scholar] [CrossRef]
- Dong, H.; Wang, C.; Lu, S.; Yu, C.; Huang, L.; Feng, W.; Xu, H.; Chen, X.; Zen, K.; Yan, Q.; et al. A panel of four decreased serum microRNAs as a novel biomarker for early Parkinson’s disease. Biomarkers 2016, 21, 129–137. [Google Scholar] [CrossRef]
- Botta-Orfila, T.; Morató, X.; Compta, Y.; Lozano, J.J.; Falgàs, N.; Valldeoriola, F.; Pont-Sunyer, C.; Vilas, D.; Mengual, L.; Fernández, M.; et al. Identification of blood serum micro-RNAs associated with idiopathic and LRRK2 Parkinson’s disease. J. Neurosci. Res. 2014, 92, 1071–1077. [Google Scholar] [CrossRef]
- Annese, A.; Manzari, C.; Lionetti, C.; Picardi, E.; Horner, D.S.; Chiara, M.; Caratozzolo, M.F.; Tullo, A.; Fosso, B.; Pesole, G.; et al. Whole transcriptome profiling of Late-Onset Alzheimer’s Disease patients provides insights into the molecular changes involved in the disease. Sci. Rep. 2018, 8, 4282. [Google Scholar] [CrossRef] [Green Version]
- Burgos, K.; Malenica, I.; Metpally, R.; Courtright, A.; Rakela, B.; Beach, T.; Shill, H.; Adler, C.; Sabbagh, M.; Villa, S.; et al. Profiles of Extracellular miRNA in Cerebrospinal Fluid and Serum from Patients with Alzheimer’s and Parkinson’s Diseases Correlate with Disease Status and Features of Pathology. PLoS ONE 2014, 9, e94839, Corrigendum in PLoS ONE 2014, 9, e106174. [Google Scholar] [CrossRef]
- Vallelunga, A.; Ragusa, M.; Di Mauro, S.; Iannitti, T.; Pilleri, M.; Biundo, R.; Weis, L.; Di Pietro, C.S.; De Iuliis, A.; Nicoletti, A.; et al. Identification of circulating microRNAs for the differential diagnosis of Parkinson’s disease and Multiple System Atrophy. Front. Cell. Neurosci. 2014, 8, 156. [Google Scholar] [CrossRef] [PubMed] [Green Version]
- Gui, Y.; Liu, H.; Zhang, L.; Lv, W.; Hu, X. Altered microRNA profiles in cerebrospinal fluid exosome in Parkinson disease and Alzheimer disease. Oncotarget 2015, 6, 37043–37053. [Google Scholar] [CrossRef] [PubMed] [Green Version]
- Kume, K.; Iwama, H.; Deguchi, K.; Ikeda, K.; Takata, T.; Kokudo, Y.; Kamada, M.; Fujikawa, K.; Hirose, K.; Masugata, H.; et al. Serum MicroRNA expression profiling in patients with multiple system atrophy. Mol. Med. Rep. 2018, 17, 852–860. [Google Scholar] [CrossRef] [PubMed]
- Lee, S.-T.; Chu, K.; Jung, K.-H.; Ban, J.-J.; Im, W.-S.; Jo, H.-Y.; Park, J.-H.; Lim, J.-Y.; Shin, J.-W.; Moon, J.; et al. Altered Expression of miR-202 in Cerebellum of Multiple-System Atrophy. Mol. Neurobiol. 2014, 51, 180–186. [Google Scholar] [CrossRef] [PubMed]
- Kim, T.; Valera, E.; Desplats, P. Alterations in Striatal microRNA-mRNA Networks Contribute to Neuroinflammation in Multiple System Atrophy. Mol. Neurobiol. 2019, 56, 7003–7021. [Google Scholar] [CrossRef]
- Wakabayashi, K.; Mori, F.; Kakita, A.; Takahashi, H.; Tanaka, S.; Utsumi, J.; Sasaki, H. MicroRNA expression profiles of multiple system atrophy from formalin-fixed paraffin-embedded samples. Neurosci. Lett. 2016, 635, 117–122. [Google Scholar] [CrossRef]
- Ubhi, K.; Rockenstein, E.; Kragh, C.; Inglis, C.; Spencer, B.; Michael, S.; Mante, M.; Adame, A.; Galasko, D.; Masliah, E. Widespread micro RNA dysregulation in multiple system atrophy—Disease-related alteration in miR-96. Eur. J. Neurosci. 2013, 39, 1026–1041. [Google Scholar] [CrossRef] [Green Version]
- Uwatoko, H.; Hama, Y.; Iwata, I.T.; Shirai, S.; Matsushima, M.; Yabe, I.; Utsumi, J.; Sasaki, H. Identification of plasma microRNA expression changes in multiple system atrophy and Parkinson’s disease. Mol. Brain 2019, 12, 49. [Google Scholar] [CrossRef] [Green Version]
- Tatura, R.; Buchholz, M.; Dickson, D.W.; Van Swieten, J.; McLean, C.; Höglinger, G.; Müller, U. microRNA profiling: Increased expression of miR-147a and miR-518e in progressive supranuclear palsy (PSP). Neurogenetics 2016, 17, 165–171. [Google Scholar] [CrossRef]
- Hébert, S.S.; Wang, W.-X.; Zhu, Q.; Nelson, P.T. A study of small RNAs from cerebral neocortex of pathology-verified Alzheimer’s disease, dementia with lewy bodies, hippocampal sclerosis, frontotemporal lobar dementia, and non-demented human controls. J. Alzheimer’s Dis. 2013, 35, 335–348. [Google Scholar] [CrossRef] [Green Version]
- Chen-Plotkin, A.S.; Unger, T.L.; Gallagher, M.D.; Bill, E.; Kwong, L.K.; Volpicelli-Daley, L.; Busch, J.I.; Akle, S.; Grossman, M.; Van Deerlin, V.; et al. TMEM106B, the Risk Gene for Frontotemporal Dementia, Is Regulated by the microRNA-132/212 Cluster and Affects Progranulin Pathways. J. Neurosci. 2012, 32, 11213–11227. [Google Scholar] [CrossRef] [PubMed]
- Kumar, S.; Vijayan, M.; Reddy, P.H. MicroRNA-455-3p as a potential peripheral biomarker for Alzheimer’s disease. Hum. Mol. Genet. 2017, 26, 3808–3822. [Google Scholar] [CrossRef] [PubMed]
- Lugli, G.; Cohen, A.M.; Bennett, D.A.; Shah, R.C.; Fields, C.J.; Hernandez, A.G.; Smalheiser, N.R. Plasma Exosomal miRNAs in Persons with and without Alzheimer Disease: Altered Expression and Prospects for Biomarkers. PLoS ONE 2015, 10, e0139233. [Google Scholar] [CrossRef] [PubMed] [Green Version]
- Wu, Y.; Xu, J.; Xu, J.; Cheng, J.; Jiao, D.; Zhou, C.; Dai, Y.; Chen, Q. Lower Serum Levels of miR-29c-3p and miR-19b-3p as Biomarkers for Alzheimer’s Disease. Tohoku J. Exp. Med. 2017, 242, 129–136. [Google Scholar] [CrossRef] [PubMed] [Green Version]
- Hara, N.; Kikuchi, M.; Miyashita, A.; Hatsuta, H.; Saito, Y.; Kasuga, K.; Murayama, S.; Ikeuchi, T.; Kuwano, R. Serum microRNA miR-501-3p as a potential biomarker related to the progression of Alzheimer’s disease. Acta Neuropathol. Commun. 2017, 5, 10. [Google Scholar] [CrossRef] [Green Version]
- Nunez-Iglesias, J.; Liu, C.-C.; Morgan, T.E.; Finch, C.E.; Zhou, X.J. Joint Genome-Wide Profiling of miRNA and mRNA Expression in Alzheimer’s Disease Cortex Reveals Altered miRNA Regulation. PLoS ONE 2010, 5, e8898. [Google Scholar] [CrossRef] [Green Version]
- Patrick, E.; Rajagopal, S.; Wong, H.-K.A.; McCabe, C.; Xu, J.; Tang, A.; Imboywa, S.H.; Schneider, J.A.; Pochet, N.; Krichevsky, A.M.; et al. Dissecting the role of non-coding RNAs in the accumulation of amyloid and tau neuropathologies in Alzheimer’s disease. Mol. Neurodegener. 2017, 12, 51. [Google Scholar] [CrossRef]
- Wang, W.-X.; Huang, Q.; Hu, Y.; Stromberg, A.J.; Nelson, P.T. Patterns of microRNA expression in normal and early Alzheimer’s disease human temporal cortex: White matter versus gray matter. Acta Neuropathol. 2010, 121, 193–205. [Google Scholar] [CrossRef] [Green Version]
- Hébert, S.S.; Horré, K.; Nicolaï, L.; Papadopoulou, A.S.; Mandemakers, W.; Silahtaroglu, A.N.; Kauppinen, S.; Delacourte, A.; De Strooper, B. Loss of microRNA cluster miR-29a/b-1 in sporadic Alzheimer’s disease correlates with increased BACE1/β-secretase expression. Proc. Natl. Acad. Sci. USA 2008, 105, 6415–6420. [Google Scholar] [CrossRef] [Green Version]
- van Harten, A.C.; Mulders, J.; Scheltens, P.; van der Flier, W.M.; Oudejans, C.B. Differential Expression of microRNA in Cerebrospinal Fluid as a Potential Novel Biomarker for Alzheimer’s Disease. J. Alzheimer’s Dis. 2015, 47, 243–252. [Google Scholar] [CrossRef]
- Dong, H.; Li, J.; Huang, L.; Chen, X.; Li, D.; Wang, T.; Hu, C.; Xu, J.; Zhang, C.; Zen, K.; et al. Serum MicroRNA Profiles Serve as Novel Biomarkers for the Diagnosis of Alzheimer’s Disease. Dis. Markers 2015, 2015, 1–11. [Google Scholar] [CrossRef] [PubMed]
- Lv, Z.; Hu, L.; Yang, Y.; Zhang, K.; Sun, Z.; Zhang, J.; Zhang, L.; Hao, Y. Comparative study of microRNA profiling in one Chinese Family with PSEN1 G378E mutation. Metab. Brain Dis. 2018, 33, 1711–1720. [Google Scholar] [CrossRef] [PubMed]
- Lau, P.; Bossers, K.; Janky, R.; Salta, E.; Frigerio, C.S.; Barbash, S.; Rothman, R.; Sierksma, A.S.R.; Thathiah, A.; Greenberg, D.; et al. Alteration of the micro RNA network during the progression of Alzheimer’s disease. EMBO Mol. Med. 2013, 5, 1613–1634. [Google Scholar] [CrossRef] [PubMed] [Green Version]
- El Fatimy, R.; Li, S.; Chen, Z.; Mushannen, T.; Gongala, S.; Wei, Z.; Balu, D.T.; Rabinovsky, R.; Cantlon, A.; Elkhal, A.; et al. MicroRNA-132 provides neuroprotection for tauopathies via multiple signaling pathways. Acta Neuropathol. 2018, 136, 537–555. [Google Scholar] [CrossRef] [PubMed] [Green Version]
- Li, X.H.; Fu, N.S.; Xing, Z.M. MiR-100 suppresses inflammatory activation of microglia and neuronal apoptosis following spinal cord injury via TLR4/NF-κB pathway. Eur. Rev. Med. Pharmacol. Sci. 2019, 23, 8713–8720. [Google Scholar] [CrossRef] [PubMed]
- Qian, Y.; Song, J.; Ouyang, Y.; Han, Q.; Chen, W.; Zhao, X.; Xie, Y.; Chen, Y.; Yuan, W.; Fan, C. Advances in Roles of miR-132 in the Nervous System. Front. Pharmacol. 2017, 8, 770. [Google Scholar] [CrossRef]
- Zhang, M.; Bian, Z. Alzheimer’s Disease and microRNA-132: A Widespread Pathological Factor and Potential Therapeutic Target. Front. Neurosci. 2021, 15, 687973. [Google Scholar] [CrossRef]
- Bhinge, A.; Namboori, S.C.; Bithell, A.; Soldati, C.; Buckley, N.J.; Stanton, L.W. MiR-375 is Essential for Human Spinal Motor Neuron Development and May Be Involved in Motor Neuron Degeneration. Stem Cells 2016, 34, 124–134. [Google Scholar] [CrossRef]
- Shen, Z.-L.; Wang, B.; Jiang, K.-W.; Ye, C.-X.; Cheng, C.; Yan, Y.-C.; Zhang, J.-Z.; Yang, Y.; Gao, Z.-D.; Ye, Y.-J.; et al. Downregulation of miR-199b is associated with distant metastasis in colorectal cancer via activation of SIRT1 and inhibition of CREB/KISS1 signaling. Oncotarget 2016, 7, 35092–35105. [Google Scholar] [CrossRef] [Green Version]
- Wang, G.; van der Walt, J.M.; Mayhew, G.; Li, Y.-J.; Züchner, S.; Scott, W.K.; Martin, E.R.; Vance, J.M. Variation in the miRNA-433 Binding Site of FGF20 Confers Risk for Parkinson Disease by Overexpression of α-Synuclein. Am. J. Hum. Genet. 2008, 82, 283–289. [Google Scholar] [CrossRef] [Green Version]
- Zhang, Z.-B.; Xiong, L.-L.; Xue, L.-L.; Deng, Y.-P.; Du, R.-L.; Hu, Q.; Xu, Y.; Yang, S.-J.; Wang, T.-H. MiR-127-3p targeting CISD1 regulates autophagy in hypoxic–ischemic cortex. Cell Death Dis. 2021, 12, 279. [Google Scholar] [CrossRef] [PubMed]
- Nguyen, L.S.; Fregeac, J.; Bole-Feysot, C.; Cagnard, N.; Iyer, A.; Anink, J.; Aronica, E.; Alibeu, O.; Nitschke, P.; Colleaux, L. Role of miR-146a in neural stem cell differentiation and neural lineage determination: Relevance for neu-rodevelopmental disorders. Mol. Autism 2018, 9, 38. [Google Scholar] [CrossRef] [PubMed]


| Upregulated | Downregulated | ||||||
|---|---|---|---|---|---|---|---|
| Neurodegeneration | AD | PD | MSA | Neurodegeneration | AD | PD | MSA |
| hsa-miR-146a-5p | hsa-miR-223-5p | hsa-miR-146a-5p | hsa-miR-1290 | hsa-miR-100 | hsa-miR-132-3p | hsa-miR-132-5p | hsa-miR-129-5p |
| hsa-miR-24 | hsa-miR-548-5p | chr6_novelMiR_46 | hsa-miR-4428 | hsa-miR-146a-5p | hsa-miR-132-5p | hsa-miR-501-3p | hsa-miR-4440 |
| hsa-miR-206 | hsa-miR-1184 | hsa-miR-19a-3p | hsa-miR-4736 | hsa-miR-127-3p | hsa-miR-375 | chr9_novelMiR_225 | hsa-miR-128-3p |
| hsa-miR-223-5p | hsa-miR-34b-3p | hsa-miR-338-3p | hsa-miR-4258 | hsa-miR-139-5p | hsa-miR-139-5p | hsa-miR-1294 | hsa-miR-4726-5p |
| hsa-miR-100 | hsa-miR-455-3p | hsa-miR-7157-5p | hsa-miR-4708-3p | hsa-miR-136-3p | hsa-miR-210 | hsa-miR-16-2-3p | hsa-miR-20b |
| hsa-miR-1249 | hsa-miR-146a-5p | hsa-miR-24-3p | hsa-miR-3622a-5p | hsa-miR-132-3p | hsa-miR-129-5p | hsa-miR-221 | hsa-miR-371b-3p |
| hsa-miR-1290 | hsa-miR-501–3p | hsa-miR-9903 | hsa-miR-371b-5p | hsa-miR-132-5p | hsa-miR-212-3p | hsa-miR-485-5p | hsa-miR-4726-3p |
| hsa-miR-4428 | hsa-miR-941 | hsa-miR-206 | hsa-miR-663a | hsa-miR-129-5p | hsa-miR-140-3p | hsa-miR-451b | hsa-miR-433 |
| hsa-miR-24-3p | hsa-miR-1180-3p | hsa-miR-19b-3p | hsa-miR-148b | hsa-miR-20b | hsa-miR-185-5p | hsa-miR-149-5p | hsa-miR-4667-5p |
| hsa-miR-23a-3p | hsa-miR-152 | hsa-miR-30e-3p | hsa-let-7i | hsa-miR-375 | hsa-miR-501-3p | hsa-miR-129-5p | hsa-miR-339-5p |
| hsa-miR-21-5p | hsa-miR-99b | hsa-miR-223 | hsa-miR-324-3p | hsa-miR-212-5p | hsa-miR-127-3p | hsa-miR-4772-5p | hsa-miR-4325 |
| hsa-miR-4732-5p | hsa-miR-153 | hsa-miR-10a-5p | hsa-miR-522 | hsa-miR-138-5p | hsa-miR-136-3p | hsa-miR-150-5p | hsa-miR-24-3p |
| hsa-miR-199a-5p | hsa-miR-30a-3p | hsa-miR-484 | hsa-miR-433 | hsa-miR-124-3p | hsa-miR-3159 | hsa-miR-370-3p | |
| hsa-miR-151b | hsa-miR-195 | hsa-miR-223 | hsa-miR-212-3p | hsa-miR-182-5p | hsa-miR-10b-5p | hsa-miR-4728-5p | |
| hsa-miR-219a-2-3p | hsa-miR-24 | hsa-miR-4693-3p | hsa-miR-26b | hsa-miR-125b-3p | hsa-miR-1249-3p | hsa-miR-380 | |
| hsa-miR-192-5p | hsa-miR-191 | hsa-miR-103a | hsa-miR-129-2-3p | hsa-miR-212-5p | hsa-miR-3908 | hsa-miR-2392 | |
| hsa-miR-30b-5p | hsa-miR-132-5p | hsa-miR-4298 | hsa-miR-409-5p | hsa-miR-378a-3p | hsa-miR-3607-3p | hsa-miR-4489 | |
| hsa-miR-146b-5p | hsa-miR-1249 | hsa-let-7c | hsa-miR-184 | hsa-miR-132 | hsa-miR-6776-3p | hsa-miR-3912 | |
| hsa-miR-6512-3p | hsa-miR-21-5p | hsa-miR-501-3p | hsa-miR-885-3p | hsa-miR-885-5p | hsa-miR-4722-5p | ||
| hsa-miR-151b | hsa-miR-4732-5p | hsa-miR-484 | bta-miR-2487 | hsa-miR-3653-5p | hsa-miR-3150a-3p | ||
| hsa-miR-192-5p | hsa-miR-199a-5p | hsa-miR-34c-3p | hsa-miR-184 | hsa-miR-1271-5p | hsa-miR-658 | ||
| hsa-miR-3153 | hsa-miR-219a-2-3p | hsa-miR-149-5p | hsa-miR-34c-3p | hsa-miR-497-5p | hsa-miR-4661-3p | ||
| hsa-miR-1301-3p | hsa-miR-30b-5p | hsa-miR-371b-3p | hsa-miR-128 | hsa-miR-3607-5p | hsa-miR-1587 | ||
| hsa-miR-146b-5p | hsa-miR-486-5p | hsa-miR-4726-3p | hsa-miR-487b | hsa-miR-484 | hsa-miR-4270 | ||
| hsa-miR-5193 | hsa-miR-3619-3p | hsa-miR-1271-5p | hsa-miR-370 | hsa-miR-132-3p | hsa-miR-147b | ||
| hsa-miR-30a-5p | hsa-miR-202 | hsa-miR-128-3p | hsa-miR-433 | hsa-miR-5009-5p | hsa-miR-3162-5p | ||
| hsa-miR-1322 | hsa-miR-24-3p | hsa-miR-150-5p | hsa-miR-138-5p | hsa-let-7d-3p | hsa-miR-4428 | ||
| hsa-miR-6850-3p | hsa-miR-612 | hsa-miR-1233-3p | hsa-miR-129-2-3p | hsa-miR-129-1-3p | hsa-miR-4800-5p | ||
| hsa-miR-33a-5p | hsa-miR-23a-3p | hsa-miR-1228-3p | hsa-miR-136-5p | hsa-miR-138-5p | hsa-miR-4795-3p | ||
| hsa-miR-191-5p | hsa-miR-4725-3p | hsa-miR-3928-3p | hsa-miR-495-3p | hsa-miR-6826-5p | hsa-miR-4776-5p | ||
| hsa-miR-302b-3p | hsa-miR-199a-3p | hsa-miR-4739 | hsa-miR-329 | hsa-miR-103a-2-5p | hsa-miR-149-3p | ||
| hsa-let-7d-3p | hsa-miR-181a-5p | hsa-miR-1249-3p | hsa-miR-409-5p | hsa-miR-361-3p | hsa-miR-3939 | ||
| hsa-miR-126-5p | hsa-miR-143 | hsa-miR-487a | hsa-miR-3123 | hsa-miR-671-5p | |||
| hsa-miR-32-5p | hsa-miR-181a-3p | hsa-miR-410 | hsa-miR-409-5p | hsa-miR-920 | |||
| hsa-miR-373-3p | hsa-miR-543 | hsa-miR-1224-5p | hsa-miR-3187-5p | ||||
| hsa-miR-1307-5p | hsa-miR-769-5p | hsa-miR-521 | hsa-miR-3155 | ||||
| hsa-miR-1185-1-3p | hsa-miR-219-2-3p | hsa-miR-212-5p | hsa-miR-3622b-5p | ||||
| hsa-miR-5701 | hsa-miR-425-5p | hsa-miR-129-2-3p | hsa-miR-1228-3p | ||||
| hsa-miR-4472 | hsa-let-7b-3p | hsa-miR-3928-3p | |||||
| hsa-let-7a-3p | hsa-miR-4266 | hsa-miR-98 | |||||
| hsa-miR-1908-3p | hsa-miR-1275 | hsa-miR-1915-3p | |||||
| hsa-miR-100-3p | hsa-miR-640 | hsa-miR-346 | |||||
| hsa-miR-4673 | hsa-miR-1262 | hsa-miR-485-5p | |||||
| hsa-miR-4524b-3p | hsa-miR-6812-5p | hsa-miR-1233-3p | |||||
| hsa-miR-1185-5p | hsa-miR-4506 | hsa-miR-4739 | |||||
| hsa-miR-4268 | hsa-miR-1180-5p | hsa-miR-26b | |||||
| hsa-miR-4691-3p | hsa-miR-5196-3p | hsa-miR-134-5p | |||||
| hsa-miR-1224-3p | hsa-miR-124-5p | hsa-miR-129-2-3p | |||||
| hsa-miR-23c | hsa-miR-6768-5p | hsa-miR-1203 | |||||
| hsa-miR-125b-5p | hsa-miR-4289 | hsa-miR-3663-5p | |||||
| hsa-miR-6769a-3p | hsa-miR-3942-3p | hsa-miR-1826 | |||||
| hsa-miR-302d-3p | hsa-let-7i-3p | hsa-miR-584-5p | |||||
| hsa-miR-767-5p | hsa-miR-128-2-5p | hsa-miR-19b | |||||
| hsa-miR-1273h-3p | hsa-miR-10a-5p | hsa-miR-1910-5p | |||||
| hsa-miR-4262 | hsa-miR-93-3p | hsa-miR-129-3p | |||||
| hsa-miR-4788 | hsa-miR-132-3p | ||||||
| hsa-miR-1285-3p | hsa-miR-675-5p | ||||||
| hsa-miR-410-3p | hsa-miR-1308 | ||||||
| hsa-miR-1303 | |||||||
| hsa-miR-4446-3p | |||||||
| hsa-miR-6509-3p | |||||||
| hsa-let-7e-5p | |||||||
| hsa-miR-6736-3p |
| Downregulated | Upregulated | |||||
|---|---|---|---|---|---|---|
| Synucleinopathy | Amyloidopathy | Tauopathy | TDP-43 Proteinopathy | Synucleinopathy | Amyloidopathy | Tauopathy |
| hsa-miR-16-2-3p | hsa-miR-136-3p | hsa-miR-210 | hsa-miR-378a-3p | hsa-miR-24 | hsa-miR-455-5p | hsa-miR-100 |
| hsa-miR-129-1-3p | hsa-miR-184 | hsa-miR-1290 | hsa-miR-32-5p | |||
| hsa-miR-128-3p | hsa-miR-128 | hsa-miR-223 | hsa-miR-1307-5p | |||
| chr9_novelMiR_225 | hsa-miR-34c-3p | hsa-miR-19a-3p | hsa-miR-126-5p | |||
| hsa-miR-484 | hsa-miR-487b | hsa-miR-338-3p | hsa-miR-363-3p | |||
| hsa-miR-451b | hsa-miR-370 | hsa-miR-4736 | hsa-miR-27a-3p | |||
| hsa-miR-98 | hsa-miR-136-5p | hsa-miR-206 | hsa-let-7f-5p | |||
| hsa-miR-28-5p | hsa-miR-124-3p | hsa-miR-19b-3p | hsa-miR-223-3p | |||
| hsa-miR-10b-5p | hsa-miR-495-3p | hsa-miR-30e-3p | hsa-miR-195-5p | |||
| hsa-miR-26b | hsa-miR-329 | hsa-miR-4524b-3p | hsa-miR-142-3p | |||
| hsa-miR-1826 | hsa-miR-487a | hsa-miR-1 | hsa-miR-150-5p | |||
| hsa-miR-4772-5p | hsa-miR-410 | hsa-miR-3907 | hsa-let-7i-5p | |||
| hsa-miR-19b | hsa-miR-543 | hsa-miR-4262 | hsa-miR-362-3p | |||
| mmu-miR-212-5p | hsa-miR-769-5p | hsa-miR-101-3p | hsa-miR-92b-3p | |||
| hsa-miR-1294 | hsa-miR-219-2-3p | hsa-miR-1306-3p | hsa-miR-199a-3p | |||
| hsa-miR-1308 | hsa-miR-425-5p | hsa-miR-4258 | hsa-miR-199b-3p | |||
| hsa-miR-3159 | hsa-miR-320b | hsa-miR-200a-3p | ||||
| hsa-miR-103a-2-5p | hsa-miR-486-5p | |||||
| hsa-miR-371b-3p | chr6_novelMiR_46 | |||||
| hsa-miR-4726-3p | hsa-miR-7157-5p | |||||
| hsa-miR-1228-3p | hsa-miR-34c-3p | |||||
| hsa-miR-3928-3p | hsa-miR-1301-3p | |||||
| hsa-miR-1915-3p | hsa-miR-612 | |||||
| hsa-miR-346 | hsa-miR-431 | |||||
| hsa-miR-485-5p | hsa-miR-1322 | |||||
| hsa-miR-1233-3p | hsa-miR-9903 | |||||
| hsa-miR-4739 | hsa-miR-6512-3p | |||||
| hsa-miR-134-5p | hsa-miR-663b | |||||
| hsa-miR-1203 | hsa-let-7d-3p | |||||
| hsa-miR-497-5p | hsa-miR-1272 | |||||
| hsa-miR-3663-5p | hsa-miR-1185-1-3p | |||||
| hsa-miR-584-5p | hsa-miR-296-5p | |||||
| hsa-miR-4440 | hsa-miR-3153 | |||||
| hsa-let-7d-3p | hsa-miR-643 | |||||
| hsa-miR-1910-5p | hsa-let-7a-3p | |||||
| hsa-miR-129-3p | hsa-miR-4428 | |||||
| hsa-miR-361-3p | hsa-miR-21-5p | |||||
| hsa-miR-675-5p | hsa-miR-4732-5p | |||||
| hsa-miR-125a-5p | hsa-miR-199a-5p | |||||
| hsa-miR-219a-2-3p | ||||||
| hsa-miR-30b-5p | ||||||
| hsa-miR-3619-3p | ||||||
| hsa-miR-202 | ||||||
| hsa-miR-4725-3p |
Publisher’s Note: MDPI stays neutral with regard to jurisdictional claims in published maps and institutional affiliations. |
© 2022 by the authors. Licensee MDPI, Basel, Switzerland. This article is an open access article distributed under the terms and conditions of the Creative Commons Attribution (CC BY) license (https://creativecommons.org/licenses/by/4.0/).
Share and Cite
Noronha, O.; Mesarosovo, L.; Anink, J.J.; Iyer, A.; Aronica, E.; Mills, J.D. Differentially Expressed miRNAs in Age-Related Neurodegenerative Diseases: A Meta-Analysis. Genes 2022, 13, 1034. https://doi.org/10.3390/genes13061034
Noronha O, Mesarosovo L, Anink JJ, Iyer A, Aronica E, Mills JD. Differentially Expressed miRNAs in Age-Related Neurodegenerative Diseases: A Meta-Analysis. Genes. 2022; 13(6):1034. https://doi.org/10.3390/genes13061034
Chicago/Turabian StyleNoronha, Ocana, Lucia Mesarosovo, Jasper J. Anink, Anand Iyer, Eleonora Aronica, and James D. Mills. 2022. "Differentially Expressed miRNAs in Age-Related Neurodegenerative Diseases: A Meta-Analysis" Genes 13, no. 6: 1034. https://doi.org/10.3390/genes13061034