
Inferring Signatures of Positive Selection in Whole-Genome Sequencing Data: An Overview of Haplotype-Based Methods


Abstract
:
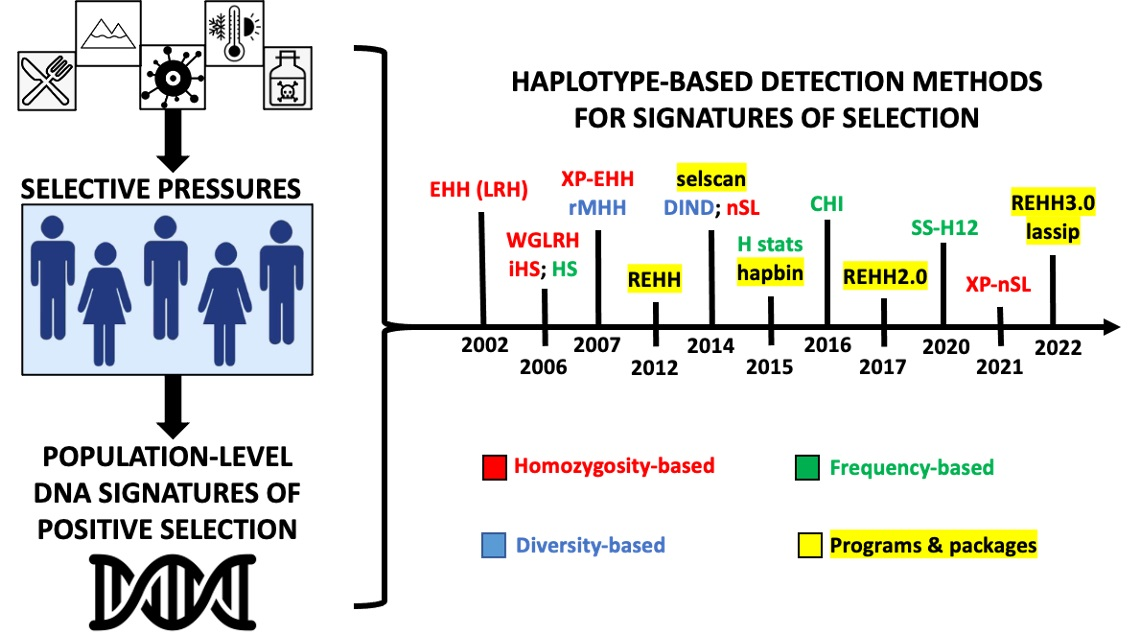
1. Introduction
2. Haplotypes, Population Genomics, and Signatures of Selection
2.1. How Do Haplotypes Arise?
2.2. Haplotypes in the Context of Population Genomics
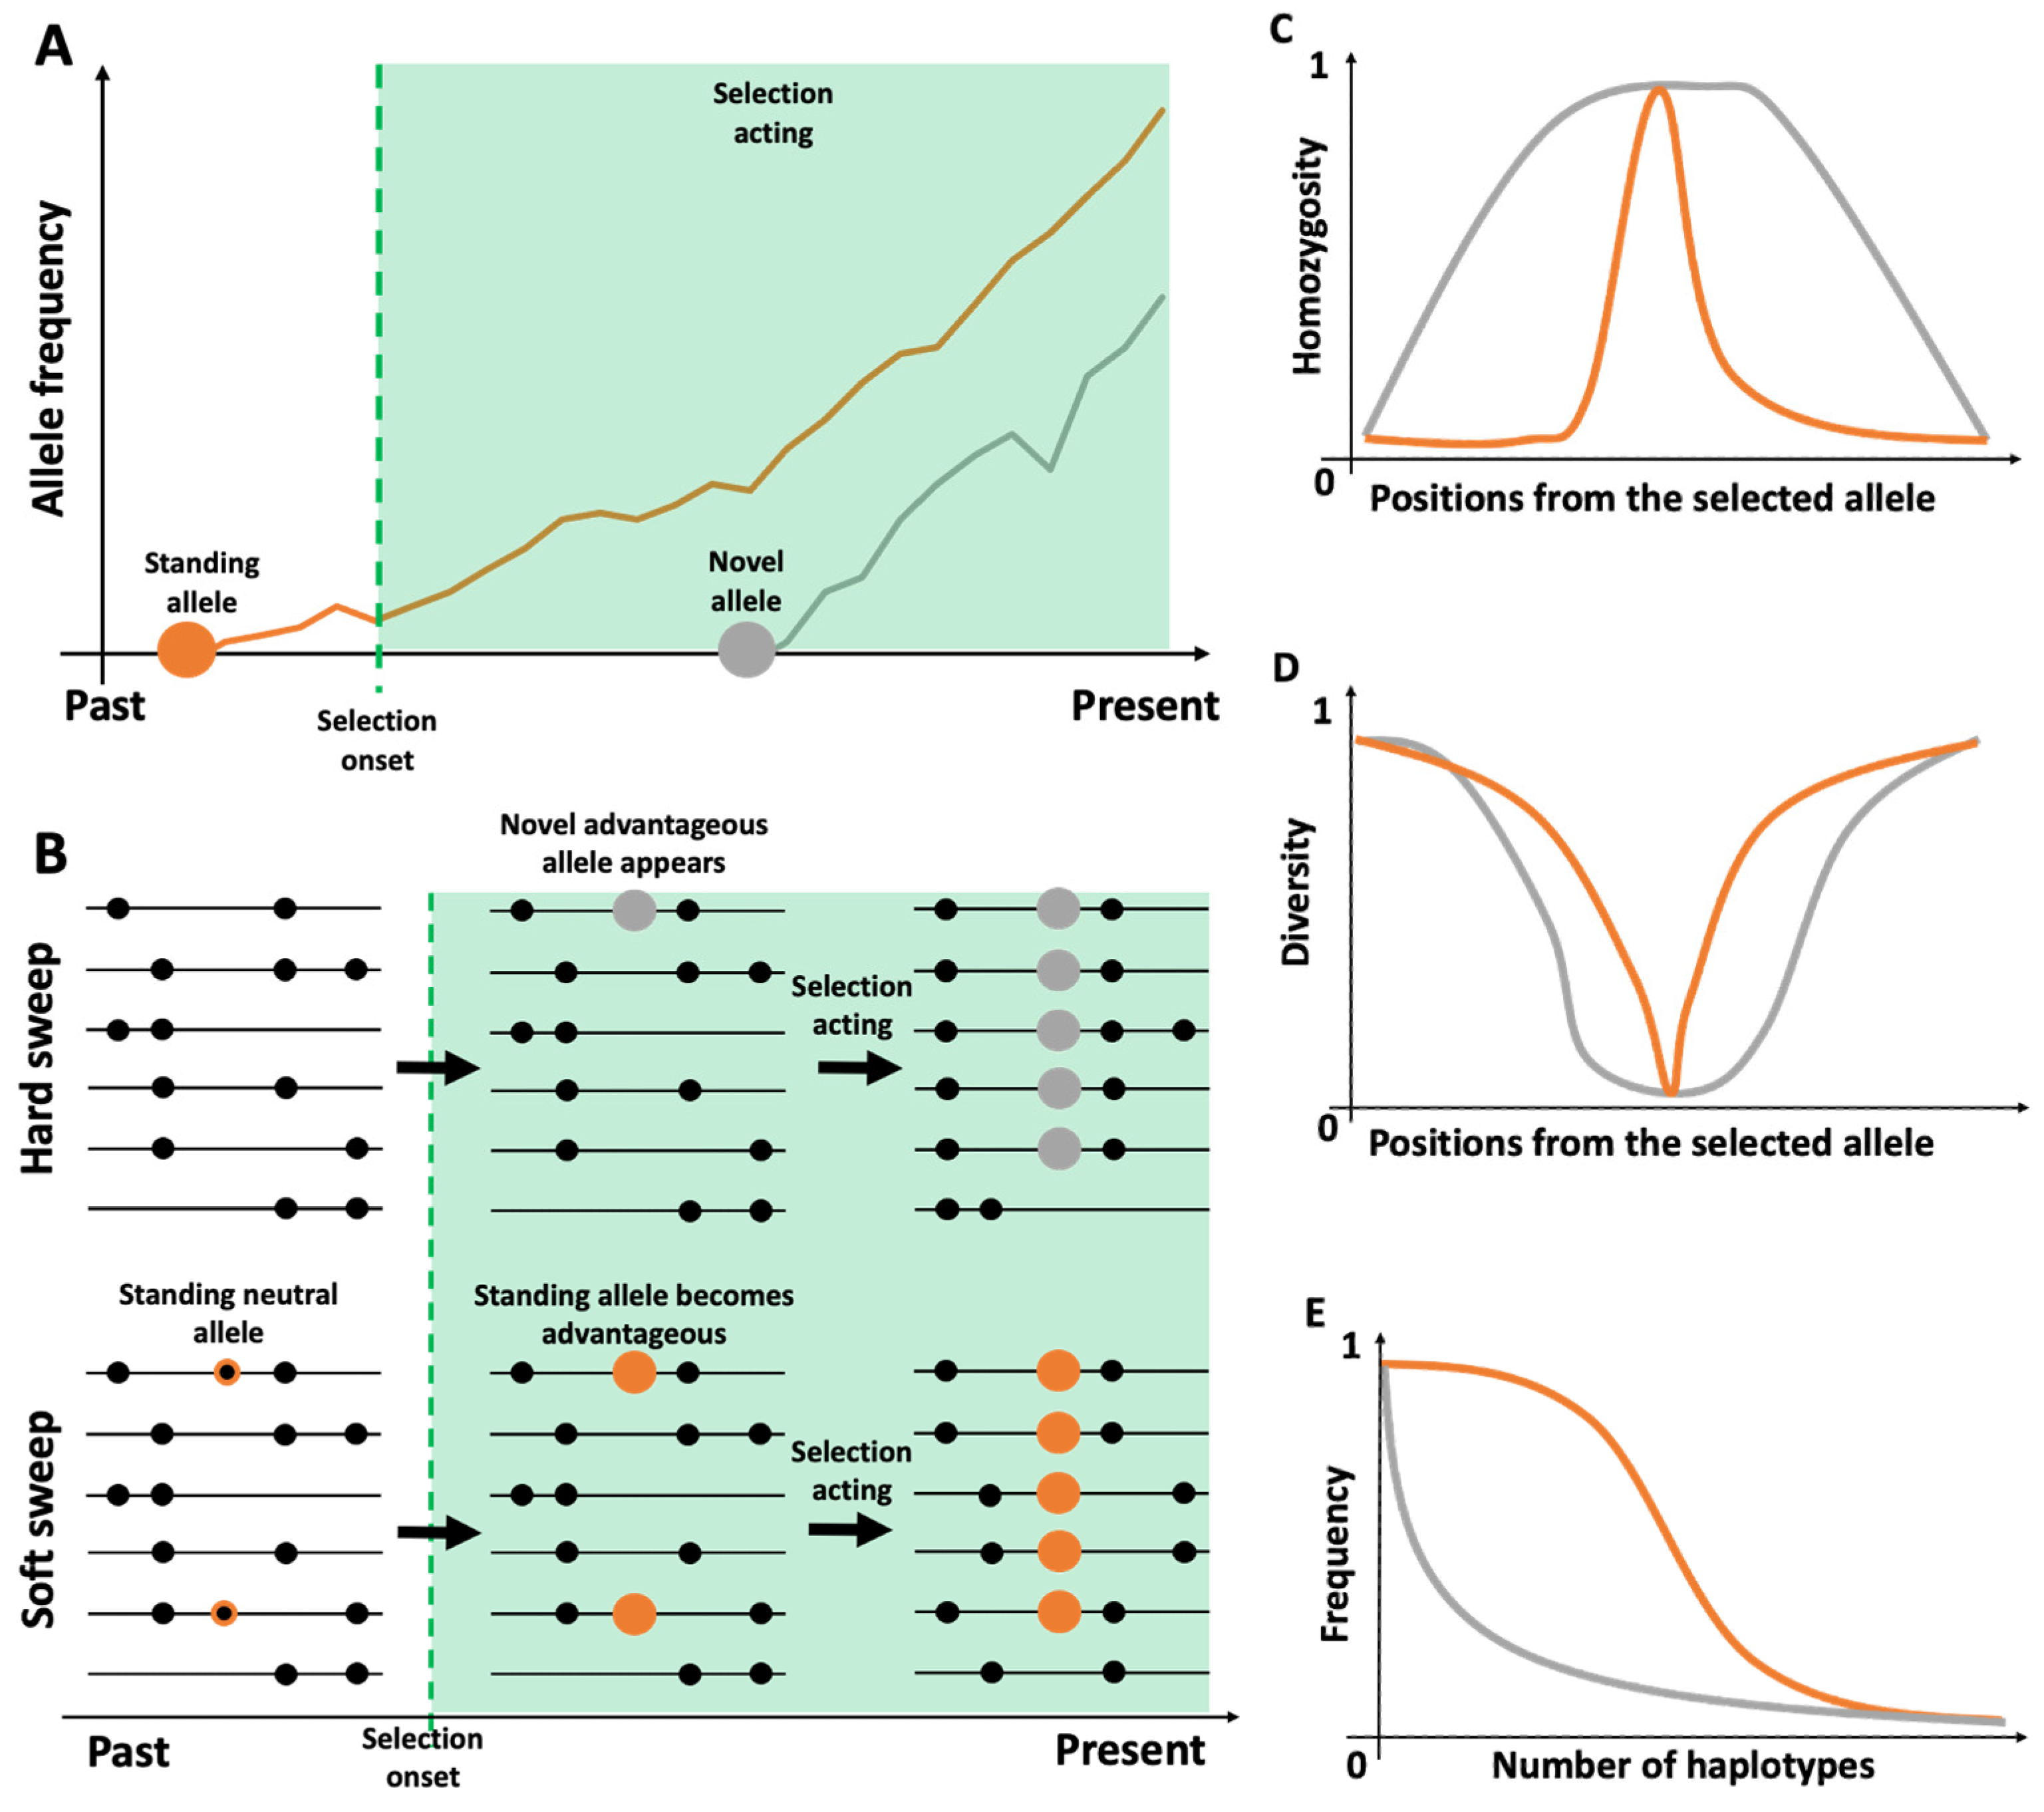
2.3. Haplotypes and Selection Events
3. Investigating the Effect of Positive Selection in a Genomic Region
3.1. Pattern of Haplotype Homozygosity
3.2. Change in Haplotype Composition
3.3. Change in Haplotype Frequency
3.4. Programs and Packages
4. Considerations around Haplotype-Based Tests for Positive Selection
4.1. Appropriateness for Different Types of Genetic Variants
4.2. Applicability across the Tree of Life
4.3. Pertinence to Ancient DNA
4.4. Relevance to Human Medicine and Public Health
Author Contributions
Funding
Institutional Review Board Statement
Informed Consent Statement
Data Availability Statement
Conflicts of Interest
References
- Jeong, C.; Di Rienzo, A. Adaptations to Local Environments in Modern Human Populations. Curr. Opin. Genet. Dev. 2014, 29, 1–8. [Google Scholar] [CrossRef] [PubMed] [Green Version]
- Rees, J.S.; Castellano, S.; Andrés, A.M. The Genomics of Human Local Adaptation. Trends Genet. 2020, 36, 415–428. [Google Scholar] [CrossRef] [PubMed]
- Werren, E.A.; Garcia, O.; Bigham, A.W. Identifying Adaptive Alleles in the Human Genome: From Selection Mapping to Functional Validation. Hum. Genet. 2021, 140, 241–276. [Google Scholar] [CrossRef] [PubMed]
- Stephan, W. Signatures of Positive Selection: From Selective Sweeps at Individual Loci to Subtle Allele Frequency Changes in Polygenic Adaptation. Mol. Ecol. 2016, 25, 79–88. [Google Scholar] [CrossRef]
- Stephan, W. Selective Sweeps. Genetics 2019, 211, 5–13. [Google Scholar] [CrossRef] [Green Version]
- Pollard, T.D.; Earnshaw, W.C.; Lippincott-Schwartz, J.; Johnson, G.T. Cell Biology, 3rd ed.; Elsevier: Philadelphia, PA, USA, 2017; ISBN 978-0-323-34126-4. [Google Scholar]
- Henderson, S.A. The time and place of meiotic crossing-over. Annu. Rev. Genet. 1970, 4, 295–324. [Google Scholar] [CrossRef]
- Henderson, I.R.; Bomblies, K. Evolution and Plasticity of Genome-Wide Meiotic Recombination Rates. Annu. Rev. Genet. 2021, 55, 23–43. [Google Scholar] [CrossRef]
- Myers, S.; Bottolo, L.; Freeman, C.; McVean, G.; Donnelly, P. A Fine-Scale Map of Recombination Rates and Hotspots Across the Human Genome. Science 2005, 310, 321–324. [Google Scholar] [CrossRef]
- Jeffreys, A.J.; Neumann, R.; Panayi, M.; Myers, S.; Donnelly, P. Human Recombination Hot Spots Hidden in Regions of Strong Marker Association. Nat. Genet. 2005, 37, 601–606. [Google Scholar] [CrossRef]
- Jensen-Seaman, M.I.; Furey, T.S.; Payseur, B.A.; Lu, Y.; Roskin, K.M.; Chen, C.-F.; Thomas, M.A.; Haussler, D.; Jacob, H.J. Comparative Recombination Rates in the Rat, Mouse, and Human Genomes. Genom. Res. 2004, 14, 528–538. [Google Scholar] [CrossRef] [Green Version]
- Wang, Y.; Rannala, B. Population Genomic Inference of Recombination Rates and Hotspots. Proc. Natl. Acad. Sci. USA 2009, 106, 6215–6219. [Google Scholar] [CrossRef] [PubMed] [Green Version]
- Stapley, J.; Feulner, P.G.D.; Johnston, S.E.; Santure, A.W.; Smadja, C.M. Variation in Recombination Frequency and Distribution across Eukaryotes: Patterns and Processes. Phil. Trans. R. Soc. B 2017, 372, 20160455. [Google Scholar] [CrossRef] [PubMed]
- Reich, D.E.; Cargill, M.; Bolk, S.; Ireland, J.; Sabeti, P.C.; Richter, D.J.; Lavery, T.; Kouyoumjian, R.; Farhadian, S.F.; Ward, R.; et al. Linkage Disequilibrium in the Human Genome. Nature 2001, 411, 199–204. [Google Scholar] [CrossRef] [PubMed]
- Abecasis, G.R.; Ghosh, D.; Nichols, T.E. Linkage Disequilibrium: Ancient History Drives the New Genetics. Hum. Hered. 2005, 59, 118–124. [Google Scholar] [CrossRef] [PubMed]
- McPeek, M.S.; Strahs, A. Assessment of Linkage Disequilibrium by the Decay of Haplotype Sharing, with Application to Fine-Scale Genetic Mapping. Am. J. Hum. Genet. 1999, 65, 858–875. [Google Scholar] [CrossRef] [Green Version]
- Koch, E.; Ristroph, M.; Kirkpatrick, M. Long Range Linkage Disequilibrium across the Human Genome. PLoS ONE 2013, 8, e80754. [Google Scholar] [CrossRef] [PubMed] [Green Version]
- Pritchard, J.K.; Przeworski, M. Linkage Disequilibrium in Humans: Models and Data. Am. J. Hum. Genet. 2001, 69, 1–14. [Google Scholar] [CrossRef] [Green Version]
- Myers, T.A.; Chanock, S.J.; Machiela, M.J. LDlinkR: An R Package for Rapidly Calculating Linkage Disequilibrium Statistics in Diverse Populations. Front. Genet. 2020, 11, 157. [Google Scholar] [CrossRef] [Green Version]
- Mueller, J.C. Linkage Disequilibrium for Different Scales and Applications. Brief. Bioinform. 2004, 5, 355–364. [Google Scholar] [CrossRef] [Green Version]
- Szpak, M.; Xue, Y.; Ayub, Q.; Tyler-Smith, C. How Well Do We Understand the Basis of Classic Selective Sweeps in Humans? FEBS Lett. 2019, 593, 1431–1448. [Google Scholar] [CrossRef] [Green Version]
- Barton, N.H. Genetic Hitchhiking. Phil. Trans. R. Soc. Lond. B 2000, 355, 1553–1562. [Google Scholar] [CrossRef] [PubMed]
- Kim, Y.; Stephan, W. Joint Effects of Genetic Hitchhiking and Background Selection on Neutral Variation. Genetics 2000, 155, 1415–1427. [Google Scholar] [CrossRef] [PubMed]
- Pfaffelhuber, P.; Lehnert, A.; Stephan, W. Linkage Disequilibrium Under Genetic Hitchhiking in Finite Populations. Genetics 2008, 179, 527–537. [Google Scholar] [CrossRef] [PubMed] [Green Version]
- Smith, J.M.; Haigh, J. The Hitch-Hiking Effect of a Favourable Gene. Genet. Res. 1974, 23, 23–35. [Google Scholar] [CrossRef] [PubMed] [Green Version]
- Novembre, J.; Han, E. Human Population Structure and the Adaptive Response to Pathogen-Induced Selection Pressures. Philos. Trans. R Soc. Lond. B Biol. Sci. 2012, 367, 878–886. [Google Scholar] [CrossRef] [PubMed] [Green Version]
- Höllinger, I.; Pennings, P.S.; Hermisson, J. Polygenic Adaptation: From Sweeps to Subtle Frequency Shifts. PLoS Genet. 2019, 15, e1008035. [Google Scholar] [CrossRef] [PubMed] [Green Version]
- Yeaman, S. Evolution of Polygenic Traits under Global vs Local Adaptation. Genetics 2022, 220, iyab134. [Google Scholar] [CrossRef]
- Pritchard, J.K.; Pickrell, J.K.; Coop, G. The Genetics of Human Adaptation: Hard Sweeps, Soft Sweeps, and Polygenic Adaptation. Curr. Biol. 2010, 20, R208–R215. [Google Scholar] [CrossRef] [Green Version]
- Gnecchi-Ruscone, G.A.; Abondio, P.; De Fanti, S.; Sarno, S.; Sherpa, M.G.; Sherpa, P.T.; Marinelli, G.; Natali, L.; Di Marcello, M.; Peluzzi, D.; et al. Evidence of Polygenic Adaptation to High Altitude from Tibetan and Sherpa Genomes. Genom. Biol. Evol. 2018, 10, 2919–2930. [Google Scholar] [CrossRef]
- Sazzini, M.; Abondio, P.; Sarno, S.; Gnecchi-Ruscone, G.A.; Ragno, M.; Giuliani, C.; De Fanti, S.; Ojeda-Granados, C.; Boattini, A.; Marquis, J.; et al. Genomic History of the Italian Population Recapitulates Key Evolutionary Dynamics of Both Continental and Southern Europeans. BMC Biol. 2020, 18, 51. [Google Scholar] [CrossRef]
- Landini, A.; Yu, S.; Gnecchi-Ruscone, G.A.; Abondio, P.; Ojeda-Granados, C.; Sarno, S.; De Fanti, S.; Gentilini, D.; Di Blasio, A.M.; Jin, H.; et al. Genomic Adaptations to Cereal-Based Diets Contribute to Mitigate Metabolic Risk in Some Human Populations of East Asian Ancestry. Evol. Appl. 2021, 14, 297–313. [Google Scholar] [CrossRef] [PubMed]
- Ojeda-Granados, C.; Abondio, P.; Setti, A.; Sarno, S.; Gnecchi-Ruscone, G.A.; González-Orozco, E.; De Fanti, S.; Jiménez-Kaufmann, A.; Rangel-Villalobos, H.; Moreno-Estrada, A.; et al. Dietary, Cultural, and Pathogens-Related Selective Pressures Shaped Differential Adaptive Evolution among Native Mexican Populations. Mol. Biol. Evol. 2022, 39, msab290. [Google Scholar] [CrossRef] [PubMed]
- Sabeti, P.C.; Reich, D.E.; Higgins, J.M.; Levine, H.Z.P.; Richter, D.J.; Schaffner, S.F.; Gabriel, S.B.; Platko, J.V.; Patterson, N.J.; McDonald, G.J.; et al. Detecting Recent Positive Selection in the Human Genome from Haplotype Structure. Nature 2002, 419, 832–837. [Google Scholar] [CrossRef] [PubMed]
- Zhang, C.; Bailey, D.K.; Awad, T.; Liu, G.; Xing, G.; Cao, M.; Valmeekam, V.; Retief, J.; Matsuzaki, H.; Taub, M.; et al. A Whole Genome Long-Range Haplotype (WGLRH) Test for Detecting Imprints of Positive Selection in Human Populations. Bioinformatics 2006, 22, 2122–2128. [Google Scholar] [CrossRef] [PubMed] [Green Version]
- The International HapMap Consortium; Sabeti, P.C.; Varilly, P.; Fry, B.; Lohmueller, J.; Hostetter, E.; Cotsapas, C.; Xie, X.; Byrne, E.H.; McCarroll, S.A.; et al. Genome-Wide Detection and Characterization of Positive Selection in Human Populations. Nature 2007, 449, 913–918. [Google Scholar] [CrossRef]
- Voight, B.F.; Kudaravalli, S.; Wen, X.; Pritchard, J.K. A Map of Recent Positive Selection in the Human Genome. PLoS Biol 2006, 4, e72. [Google Scholar] [CrossRef] [Green Version]
- Szpiech, Z.A.; Novak, T.E.; Bailey, N.P.; Stevison, L.S. Application of a Novel Haplotype-based Scan for Local Adaptation to Study High-altitude Adaptation in Rhesus Macaques. Evol. Lett. 2021, 5, 408–421. [Google Scholar] [CrossRef]
- Ferrer-Admetlla, A.; Liang, M.; Korneliussen, T.; Nielsen, R. On Detecting Incomplete Soft or Hard Selective Sweeps Using Haplotype Structure. Mol. Biol. Evol. 2014, 31, 1275–1291. [Google Scholar] [CrossRef] [Green Version]
- Fagny, M.; Patin, E.; Enard, D.; Barreiro, L.B.; Quintana-Murci, L.; Laval, G. Exploring the Occurrence of Classic Selective Sweeps in Humans Using Whole-Genome Sequencing Data Sets. Mol. Biol. Evol. 2014, 31, 1850–1868. [Google Scholar] [CrossRef] [Green Version]
- Kimura, R.; Fujimoto, A.; Tokunaga, K.; Ohashi, J. A Practical Genome Scan for Population-Specific Strong Selective Sweeps That Have Reached Fixation. PLoS ONE 2007, 2, e286. [Google Scholar] [CrossRef] [Green Version]
- Hanchard, N.A.; Rockett, K.A.; Spencer, C.; Coop, G.; Pinder, M.; Jallow, M.; Kimber, M.; McVean, G.; Mott, R.; Kwiatkowski, D.P. Screening for Recently Selected Alleles by Analysis of Human Haplotype Similarity. Am. J. Hum. Genet. 2006, 78, 153–159. [Google Scholar] [CrossRef] [PubMed] [Green Version]
- Lange, J.D.; Pool, J.E. A Haplotype Method Detects Diverse Scenarios of Local Adaptation from Genomic Sequence Variation. Mol. Ecol. 2016, 25, 3081–3100. [Google Scholar] [CrossRef] [PubMed] [Green Version]
- Garud, N.R.; Messer, P.W.; Buzbas, E.O.; Petrov, D.A. Recent Selective Sweeps in North American Drosophila Melanogaster Show Signatures of Soft Sweeps. PLoS Genet. 2015, 11, e1005004. [Google Scholar] [CrossRef] [PubMed] [Green Version]
- Harris, A.M.; DeGiorgio, M. Identifying and Classifying Shared Selective Sweeps from Multilocus Data. Genetics 2020, 215, 143–171. [Google Scholar] [CrossRef] [PubMed] [Green Version]
- Gautier, M.; Vitalis, R. Rehh: An R Package to Detect Footprints of Selection in Genome-Wide SNP Data from Haplotype Structure. Bioinformatics 2012, 28, 1176–1177. [Google Scholar] [CrossRef]
- Gautier, M.; Klassmann, A.; Vitalis, R. REHH 2.0: A Reimplementation of the R Package REHH to Detect Positive Selection from Haplotype Structure. Mol. Ecol. Resour. 2017, 17, 78–90. [Google Scholar] [CrossRef]
- Klassmann, A.; Gautier, M. Detecting Selection Using Extended Haplotype Homozygosity (EHH)-Based Statistics in Unphased or Unpolarized Data. PLoS ONE 2022, 17, e0262024. [Google Scholar] [CrossRef]
- Szpiech, Z.A.; Hernandez, R.D. Selscan: An Efficient Multithreaded Program to Perform EHH-Based Scans for Positive Selection. Mol. Biol. Evol. 2014, 31, 2824–2827. [Google Scholar] [CrossRef] [Green Version]
- DeGiorgio, M.; Szpiech, Z.A. A Spatially Aware Likelihood Test to Detect Sweeps from Haplotype Distributions. PLoS Genet. 2022, 18, e1010134. [Google Scholar] [CrossRef]
- Maclean, C.A.; Chue Hong, N.P.; Prendergast, J.G.D. Hapbin: An Efficient Program for Performing Haplotype-Based Scans for Positive Selection in Large Genomic Datasets: Fig. 1. Mol. Biol Evol 2015, 32, 3027–3029. [Google Scholar] [CrossRef] [Green Version]
- Wall, J.D.; Pritchard, J.K. Haplotype Blocks and Linkage Disequilibrium in the Human Genome. Nat. Rev. Genet. 2003, 4, 587–597. [Google Scholar] [CrossRef] [PubMed]
- Sabatti, C.; Risch, N. Homozygosity and Linkage Disequilibrium. Genetics 2002, 160, 1707–1719. [Google Scholar] [CrossRef] [PubMed]
- Garud, N.R.; Messer, P.W.; Petrov, D.A. Detection of Hard and Soft Selective Sweeps from Drosophila Melanogaster Population Genomic Data. PLoS Genet. 2021, 17, e1009373. [Google Scholar] [CrossRef] [PubMed]
- Selscan, a Program to Calculate EHH-Based Scans for Positive Selection in Genomes. Available online: https://github.com/szpiech/selscan (accessed on 2 May 2022).
- Efficient Program for Calculating Extended Haplotype Homozygosity (EHH) and Integrated Haplotype Score (iHS). Available online: https://github.com/evotools/hapbin (accessed on 2 May 2022).
- Rehh: Searching for Footprints of Selection Using ‘Extended Haplotype Homozygosity’ Based Tests. Available online: https://cran.r-project.org/web/packages/rehh/index.html (accessed on 2 May 2022).
- Tang, K.; Thornton, K.R.; Stoneking, M. A New Approach for Using Genome Scans to Detect Recent Positive Selection in the Human Genome. PLoS Biol 2007, 5, e171. [Google Scholar] [CrossRef]
- LASSI-Plus: A Program to Calculate Haplotype Frequency Spectrum Statistics. Available online: https://github.com/szpiech/lassip (accessed on 2 May 2022).
- Harris, A.M.; Garud, N.R.; DeGiorgio, M. Detection and Classification of Hard and Soft Sweeps from Unphased Genotypes by Multilocus Genotype Identity. Genetics 2018, 210, 1429–1452. [Google Scholar] [CrossRef] [Green Version]
- Kauer, M.O.; Dieringer, D.; Schlötterer, C. A Microsatellite Variability Screen for Positive Selection Associated with the “out of Africa” Habitat Expansion of Drosophila Melanogaster. Genetics 2003, 165, 1137–1148. [Google Scholar] [CrossRef]
- Park, S.; Son, S.; Shin, M.; Fujii, N.; Hoshino, T.; Park, S. Transcriptome-Wide Mining, Characterization, and Development of Microsatellite Markers in Lychnis Kiusiana (Caryophyllaceae). BMC Plant. Biol 2019, 19, 14. [Google Scholar] [CrossRef] [Green Version]
- Ranathunge, C.; Chimahusky, M.; Welch, M.E. A Comparative Study of Population Genetic Structure Reveals Patterns Consistent with Selection at Functional Microsatellites in Common Sunflower. bioRxiv 2021. [Google Scholar] [CrossRef]
- Gokcumen, O.; Babb, P.L.; Iskow, R.C.; Zhu, Q.; Shi, X.; Mills, R.E.; Ionita-Laza, I.; Vallender, E.J.; Clark, A.G.; Johnson, W.E.; et al. Refinement of Primate Copy Number Variation Hotspots Identifies Candidate Genomic Regions Evolving under Positive Selection. Genom. Biol. 2011, 12, R52. [Google Scholar] [CrossRef] [Green Version]
- Sudmant, P.H.; Mallick, S.; Nelson, B.J.; Hormozdiari, F.; Krumm, N.; Huddleston, J.; Coe, B.P.; Baker, C.; Nordenfelt, S.; Bamshad, M.; et al. Global Diversity, Population Stratification, and Selection of Human Copy-Number Variation. Science 2015, 349, aab3761. [Google Scholar] [CrossRef] [Green Version]
- Lin, Y.-L.; Gokcumen, O. Fine-Scale Characterization of Genomic Structural Variation in the Human Genome Reveals Adaptive and Biomedically Relevant Hotspots. Genom. Biol. Evol. 2019, 11, 1136–1151. [Google Scholar] [CrossRef] [PubMed]
- Saitou, M.; Gokcumen, O. An Evolutionary Perspective on the Impact of Genomic Copy Number Variation on Human Health. J. Mol. Evol. 2020, 88, 104–119. [Google Scholar] [CrossRef] [PubMed]
- Kuhn, A.; Ong, Y.M.; Cheng, C.-Y.; Wong, T.Y.; Quake, S.R.; Burkholder, W.F. Linkage Disequilibrium and Signatures of Positive Selection around LINE-1 Retrotransposons in the Human Genome. Proc. Natl. Acad. Sci. USA 2014, 111, 8131–8136. [Google Scholar] [CrossRef] [PubMed] [Green Version]
- Rishishwar, L.; Wang, L.; Wang, J.; Yi, S.V.; Lachance, J.; Jordan, I.K. Evidence for Positive Selection on Recent Human Transposable Element Insertions. Gene 2018, 675, 69–79. [Google Scholar] [CrossRef]
- Lerat, E.; Goubert, C.; Guirao-Rico, S.; Merenciano, M.; Dufour, A.-B.; Vieira, C.; González, J. Population-Specific Dynamics and Selection Patterns of Transposable Element Insertions in European Natural Populations. Mol. Ecol. 2019, 28, 1506–1522. [Google Scholar] [CrossRef]
- Geibel, J.; Praefke, N.P.; Weigend, S.; Simianer, H.; Reimer, C. Assessment of Linkage Disequilibrium Patterns between Structural Variants and Single Nucleotide Polymorphisms in Three Commercial Chicken Populations. BMC Genom. 2022, 23, 193. [Google Scholar] [CrossRef]
- Haasl, R.J.; Payseur, B.A. Microsatellites as Targets of Natural Selection. Mol. Biol. Evol. 2013, 30, 285–298. [Google Scholar] [CrossRef] [Green Version]
- Haasl, R.J.; Johnson, R.C.; Payseur, B.A. The Effects of Microsatellite Selection on Linked Sequence Diversity. Genom. Biol. Evol. 2014, 6, 1843–1861. [Google Scholar] [CrossRef] [Green Version]
- Zorc, M.; Škorput, D.; Gvozdanović, K.; Margeta, P.; Karolyi, D.; Luković, Z.; Salajpal, K.; Savić, R.; Muñoz, M.; Bovo, S.; et al. Genetic Diversity and Population Structure of Six Autochthonous Pig Breeds from Croatia, Serbia, and Slovenia. Genet. Sel. Evol. 2022, 54, 30. [Google Scholar] [CrossRef]
- Seo, D.; Lee, D.H.; Jin, S.; Won, J.I.; Lim, D.; Park, M.; Kim, T.H.; Lee, H.K.; Kim, S.; Choi, I.; et al. Long-Term Artificial Selection of Hanwoo (Korean) Cattle Left Genetic Signatures for the Breeding Traits and Has Altered the Genomic Structure. Sci. Rep. 2022, 12, 6438. [Google Scholar] [CrossRef]
- Duarte, I.N.H.; Bessa, A.F.d.O.; Rola, L.D.; Genuíno, M.V.H.; Rocha, I.M.; Marcondes, C.R.; Regitano, L.C.d.A.; Munari, D.P.; Berry, D.P.; Buzanskas, M.E. Cross-Population Selection Signatures in Canchim Composite Beef Cattle. PLoS ONE 2022, 17, e0264279. [Google Scholar] [CrossRef] [PubMed]
- Liu, D.; Chen, Z.; Zhao, W.; Guo, L.; Sun, H.; Zhu, K.; Liu, G.; Shen, X.; Zhao, X.; Wang, Q.; et al. Genome-Wide Selection Signatures Detection in Shanghai Holstein Cattle Population Identified Genes Related to Adaption, Health and Reproduction Traits. BMC Genom. 2021, 22, 747. [Google Scholar] [CrossRef] [PubMed]
- Bao, Q.; Ma, X.; Jia, C.; Wu, X.; Wu, Y.; Meng, G.; Bao, P.; Chu, M.; Guo, X.; Liang, C.; et al. Resequencing and Signatures of Selective Scans Point to Candidate Genetic Variants for Hair Length Traits in Long-Haired and Normal-Haired Tianzhu White Yak. Front. Genet. 2022, 13, 798076. [Google Scholar] [CrossRef] [PubMed]
- Guo, Y.; Liang, J.; Lv, C.; Wang, Y.; Wu, G.; Ding, X.; Quan, G. Sequencing Reveals Population Structure and Selection Signatures for Reproductive Traits in Yunnan Semi-Fine Wool Sheep (Ovis Aries). Front. Genet. 2022, 13, 812753. [Google Scholar] [CrossRef]
- Nolte, W.; Thaller, G.; Kuehn, C. Selection Signatures in Four German Warmblood Horse Breeds: Tracing Breeding History in the Modern Sport Horse. PLoS ONE 2019, 14, e0215913. [Google Scholar] [CrossRef] [Green Version]
- Santos, W.B.; Schettini, G.P.; Maiorano, A.M.; Bussiman, F.O.; Balieiro, J.C.C.; Ferraz, G.C.; Pereira, G.L.; Baldassini, W.A.; Neto, O.R.M.; Oliveira, H.N.; et al. Genome-Wide Scans for Signatures of Selection in Mangalarga Marchador Horses Using High-Throughput SNP Genotyping. BMC Genom. 2021, 22, 737. [Google Scholar] [CrossRef]
- Zhao, J.; Sauvage, C.; Bitton, F.; Causse, M. Multiple Haplotype-Based Analyses Provide Genetic and Evolutionary Insights into Tomato Fruit Weight and Composition. Hortic. Res. 2022, 9, uhab009. [Google Scholar] [CrossRef]
- Kassegne, K.; Komi Koukoura, K.; Shen, H.-M.; Chen, S.-B.; Fu, H.-T.; Chen, Y.-Q.; Zhou, X.-N.; Chen, J.-H.; Cheng, Y. Genome-Wide Analysis of the Malaria Parasite Plasmodium Falciparum Isolates from Togo Reveals Selective Signals in Immune Selection-Related Antigen Genes. Front. Immunol. 2020, 11, 552698. [Google Scholar] [CrossRef]
- Feleke, S.M.; Reichert, E.N.; Mohammed, H.; Brhane, B.G.; Mekete, K.; Mamo, H.; Petros, B.; Solomon, H.; Abate, E.; Hennelly, C.; et al. Plasmodium Falciparum Is Evolving to Escape Malaria Rapid Diagnostic Tests in Ethiopia. Nat. Microbiol. 2021, 6, 1289–1299. [Google Scholar] [CrossRef]
- Lucas, E.R.; Miles, A.; Harding, N.J.; Clarkson, C.S.; Lawniczak, M.K.N.; Kwiatkowski, D.P.; Weetman, D.; Donnelly, M.J. Anopheles gambiae 1000 Genomes Consortium Whole-Genome Sequencing Reveals High Complexity of Copy Number Variation at Insecticide Resistance Loci in Malaria Mosquitoes. Genom. Res. 2019, 29, 1250–1261. [Google Scholar] [CrossRef] [Green Version]
- Schlamp, F.; van der Made, J.; Stambler, R.; Chesebrough, L.; Boyko, A.R.; Messer, P.W. Evaluating the Performance of Selection Scans to Detect Selective Sweeps in Domestic Dogs. Mol. Ecol. 2016, 25, 342–356. [Google Scholar] [CrossRef] [PubMed] [Green Version]
- Liu, Y.-H.; Wang, L.; Zhang, Z.; Otecko, N.O.; Khederzadeh, S.; Dai, Y.; Liang, B.; Wang, G.-D.; Zhang, Y.-P. Whole-Genome Sequencing Reveals Lactase Persistence Adaptation in European Dogs. Mol. Biol. Evol. 2021, 38, 4884–4890. [Google Scholar] [CrossRef] [PubMed]
- Briggs, A.W.; Stenzel, U.; Meyer, M.; Krause, J.; Kircher, M.; Pääbo, S. Removal of Deaminated Cytosines and Detection of in Vivo Methylation in Ancient DNA. Nucleic Acids Res. 2010, 38, e87. [Google Scholar] [CrossRef] [PubMed] [Green Version]
- Dabney, J.; Meyer, M.; Pääbo, S. Ancient DNA Damage. Cold Spring Harb. Perspect Biol. 2013, 5, a012567. [Google Scholar] [CrossRef] [PubMed]
- Skoglund, P.; Northoff, B.H.; Shunkov, M.V.; Derevianko, A.P.; Pääbo, S.; Krause, J.; Jakobsson, M. Separating Endogenous Ancient DNA from Modern Day Contamination in a Siberian Neandertal. Proc. Natl. Acad. Sci. USA 2014, 111, 2229–2234. [Google Scholar] [CrossRef] [Green Version]
- Ausmees, K.; Sanchez-Quinto, F.; Jakobsson, M.; Nettelblad, C. An Empirical Evaluation of Genotype Imputation of Ancient DNA. G3 Genes 2022, jkac089. [Google Scholar] [CrossRef]
- Irving-Pease, E.K.; Muktupavela, R.; Dannemann, M.; Racimo, F. Quantitative Human Paleogenetics: What Can Ancient DNA Tell Us About Complex Trait Evolution? Front. Genet. 2021, 12, 703541. [Google Scholar] [CrossRef]
- Monroy Kuhn, J.M.; Jakobsson, M.; Günther, T. Estimating Genetic Kin Relationships in Prehistoric Populations. PLoS ONE 2018, 13, e0195491. [Google Scholar] [CrossRef] [Green Version]
- Günther, T.; Nettelblad, C. The Presence and Impact of Reference Bias on Population Genomic Studies of Prehistoric Human Populations. PLoS Genet. 2019, 15, e1008302. [Google Scholar] [CrossRef] [Green Version]
- Nesse, R.M. Evolution: Medicine’s Most Basic Science. Lancet 2008, 372, S21–S27. [Google Scholar] [CrossRef]
- Nesse, R.M.; Bergstrom, C.T.; Ellison, P.T.; Flier, J.S.; Gluckman, P.; Govindaraju, D.R.; Niethammer, D.; Omenn, G.S.; Perlman, R.L.; Schwartz, M.D.; et al. Making Evolutionary Biology a Basic Science for Medicine. Proc. Natl. Acad. Sci. USA 2010, 107, 1800–1807. [Google Scholar] [CrossRef] [PubMed] [Green Version]
- Wells, J.C.K.; Nesse, R.M.; Sear, R.; Johnstone, R.A.; Stearns, S.C. Evolutionary Public Health: Introducing the Concept. Lancet 2017, 390, 500–509. [Google Scholar] [CrossRef]
- Benton, M.L.; Abraham, A.; LaBella, A.L.; Abbot, P.; Rokas, A.; Capra, J.A. The Influence of Evolutionary History on Human Health and Disease. Nat. Rev. Genet. 2021, 22, 269–283. [Google Scholar] [CrossRef] [PubMed]


| Within Population | Between Populations | |
|---|---|---|
| Haplotype homozygosity | EEH (LRH) [34] | |
| WGLRH [35] | XP-EHH [36] | |
| iHS [37] | XP-nSL [38] | |
| nSL [39] | ||
| Haplotype diversity | DIND [40] | rMHH [41] |
| Haplotype frequency | HS [42] | CHI [43] |
| H statistics [44] | SS-H12 [45] | |
| Programs and packages | rehh [46,47,48] | |
| selscan [49] | ||
| lassip [50] | ||
| hapbin [51] | ||
Publisher’s Note: MDPI stays neutral with regard to jurisdictional claims in published maps and institutional affiliations. |
© 2022 by the authors. Licensee MDPI, Basel, Switzerland. This article is an open access article distributed under the terms and conditions of the Creative Commons Attribution (CC BY) license (https://creativecommons.org/licenses/by/4.0/).
Share and Cite
Abondio, P.; Cilli, E.; Luiselli, D. Inferring Signatures of Positive Selection in Whole-Genome Sequencing Data: An Overview of Haplotype-Based Methods. Genes 2022, 13, 926. https://doi.org/10.3390/genes13050926
Abondio P, Cilli E, Luiselli D. Inferring Signatures of Positive Selection in Whole-Genome Sequencing Data: An Overview of Haplotype-Based Methods. Genes. 2022; 13(5):926. https://doi.org/10.3390/genes13050926
Chicago/Turabian StyleAbondio, Paolo, Elisabetta Cilli, and Donata Luiselli. 2022. "Inferring Signatures of Positive Selection in Whole-Genome Sequencing Data: An Overview of Haplotype-Based Methods" Genes 13, no. 5: 926. https://doi.org/10.3390/genes13050926