Article

Genomic Analysis of Resistance to Fall Armyworm (Spodoptera frugiperda) in CIMMYT Maize Lines

1
International Maize and Wheat Improvement Center (CIMMYT), Village Market-00621, Nairobi P.O. Box 1041, Kenya
2
Life and Earth Sciences Institute (Including Health and Agriculture), Pan African University, Ibadan 200284, Nigeria
3
Department of Agronomy, University of Ibadan, Ibadan 200284, Nigeria
*
Author to whom correspondence should be addressed.
Genes 2022, 13(2), 251; https://doi.org/10.3390/genes13020251
Submission received: 15 December 2021 / Revised: 19 January 2022 / Accepted: 25 January 2022 / Published: 28 January 2022
(This article belongs to the Special Issue Research on Tropical Food Crop Genomics)

Abstract

:
The recent invasion, rapid spread, and widescale destruction of the maize crop by the fall armyworm (FAW; Spodoptera frugiperda (J.E. Smith)) is likely to worsen the food insecurity situation in Africa. In the present study, a set of 424 maize lines were screened for their responses to FAW under artificial infestation to dissect the genetic basis of resistance. All lines were evaluated for two seasons under screen houses and genotyped with the DArTseq platform. Foliar damage was rated on a scale of 1 (highly resistant) to 9 (highly susceptible) and scored at 7, 14, and 21 days after artificial infestation. Analyses of variance revealed significant genotypic and genotype by environment interaction variances for all traits. Heritability estimates for leaf damage scores were moderately high and ranged from 0.38 to 0.58. Grain yield was negatively correlated with a high magnitude to foliar damage scores, ear rot, and ear damage traits. The genome-wide association study (GWAS) revealed 56 significant marker–trait associations and the predicted functions of the putative candidate genes varied from a defense response to several genes of unknown function. Overall, the study revealed that native genetic resistance to FAW is quantitative in nature and is controlled by many loci with minor effects.

1. Introduction

Maize (Zea mays L.) is a staple food for over 300 million people on the African continent [1]. To achieve maize-based food security in the region by 2050, the current average maize production of about 1.5 tons/ha has to increase to 6.8 tons/ha [2]. In the context of the present and forecasted climatic patterns, overall maize production in the next three decades has been projected to reduce by about 10% [3]. The fall armyworm (FAW) destructive pest, first reported in 2016 in Africa [4] but now confirmed in 46 of Africa’s 54 countries, is likely to establish itself as a multi-generational pest of economic importance in Africa due to its natural distribution capacity, high fecundity level, favorable sub-tropical climates, wide host range, voracious appetite, and migratory activities [5,6].
FAW foliar feeding, especially on the furl and whorl leaves, destroys the plant growing points and retards maize growth and development. Yield reduction has been attributed to both FAW stem tunneling, which disrupts water and nutrient uptake, as well as the extensive leaf feeding damage which causes a direct loss of photosynthates [7]. FAW-damaged ears are also predisposed to fungal attacks, rots, and mycotoxin contamination, which adversely impact grain quantity and quality [8]. Globally, about 6–19% of the total maize production is lost to insect-pests herbivory [9]. Failure to manage the FAW infestation in sub-Saharan Africa is projected to result in an annual loss of approximately 12% of the total area under maize cultivation (~37 million hectares), which translates to economic losses of up to US $6.3 billion per annum [6]. A wide distribution of direct and indirect maize yield losses has been reported throughout the FAW’s native and invasive range [10]. In sub-Saharan Africa for instance, annual losses of up to US$ 13 billion have been estimated in crops such as maize, rice, sorghum, and sugarcane [11,12].
Transgenic Bt crops provide an effective FAW control but impose a high selection pressure which results in the emergence of resistant FAW biotypes [13,14], while the application of synthetic pesticides in FAW control raises environmental toxicity concerns [15] and could also be ineffective in the future due to the emergence of resistant FAW biotypes [16]. The majority of African farmers facing maize yield losses due to FAW infestation are resource-poor and have limited local access to partially effective chemical and biological FAW control measures [17]. These farmers extensively rely on their ecological knowledge to manipulate plant ecology in favor of a few FAW natural predators [18]. The high density of pest populations also renders the eco-friendly, cultural FAW control practices ineffective [19]. The need to protect the maize crop from FAW foliar damage and mitigate yield losses using a multi-pronged strategy that fosters agricultural sustainability is of outmost priority. Cultivating maize varieties endowed with inherent native resistance to foliar damage is not only compatible with biological, chemical, and cultural insect-pest control methods, but is also ecologically and economically sustainable [20].
Host plant resistance is conferred by the plant’s biochemical constituents [21], structural features [22], and genetic composition [23]. The breeding efficiency for trait improvement has increased significantly with the integration of genomic tools such as genomic-wide association studies (GWAS) [24], linkage mapping [25], and genomic selection (GS) [26] with traditional breeding approaches. Genome-wide signals associated with resistance to major lepidopteran pests of maize such as the European corn borer [27], Asian corn borer [28], Southwestern corn borer [29], Sugarcane borer [30], and FAW [31,32] have been detected with improved accuracy and speed in light of the current advances in plant molecular biology, high throughput sequencing technology, and the development of robust statistical data analysis tools. GWAS has received tremendous attention as a quick new alternative for directly scanning diverse sets of maize germplasm for functional polymorphisms at the sequence level [33]. For selecting complex traits like FAW resistance, GS is a promising option. GS can accomplish this by employing genome-wide dense markers for predictions, and therefore can support association analyses to determine the genetic basis of key traits [34].
In the African context, FAW resistance breeding is less well studied [32]. The utilization of African-adapted tropical maize lines developed by CIMMYT could speed up FAW resistance breeding and provide a framework for efficiently pyramiding multiple beneficial alleles [35] in elite but susceptible genotypes. Thus, the objectives of the present study were to (i) assess the genetic architecture of FAW resistance traits such as foliar damage ear damage and grain yield; (ii) identify the significant quantitative trait nucleotides (QTNs) and putative candidate genes for FAW resistance traits in tropical maize germplasm; and (iii) assess the potential of utilizing GS in the improvement of FAW resistance traits. Results from this study could provide baseline information in the genomic-assisted development and release of FAW-resistant maize, which promotes prospects of a better farmer harvest.

2. Materials and Methods

2.1. Plant Material and Experimental Design

A set of 424 DH lines developed by CIMMYT and 11 elite lines were evaluated for their responses to FAW under artificial infestation. All lines were screened for two seasons in screen houses at the Kiboko experimental station (2°15’S and 37°75’ E, 975 m asl) in Kenya in 2020 and 2021. To control random variation, the experiment utilized an α lattice design with two replications. Test plots consisted of single rows 3 m long and 0.75 m apart. Each year by location combination was considered as a separate test environment. Standard agronomic management practices were implemented up to physiological maturity when the ears were harvested.

2.2. Artificial Infestation and Phenotypic Evaluation

Mass FAW rearing was conducted at the insectary within the Kenya Agricultural and Livestock Research Organization, Katumani Agricultural Experimental Station in Machakos county, Kenya using a nutritionally adequate CIMMYT artificial diet [36] under ambient laboratory conditions (temperature of 25 ± 1°C, 12 h day and 12 h dark photoperiod, and relative humidity of 75 ± 5%). Neonate larvae emerged 24 h after eggs hatching. Trial planting dates were adjusted to ensure the desired plant growth stage coincided with peak periods of larvae emergence at the insectary. Eight first instar FAW larvae were manually applied at the furl and whorl leaves of each plant using a camel brush at the V3 stage of maize development [37]. Since leaf tissues are soft at the V3 maize growth stage, it suits the larvae to have them conditioned to the host environment to feed and survive. Fewer FAW larvae have been reported to survive when maize plants were infested at the 12-leaf stage of growth compared to the 8-leaf stage [38]. As the plant growth progresses, leaf tissues become more fibrous and difficult for the larvae to feed on. Previous studies have demonstrated the level of damage sustained by both resistant and susceptible genotypes infested with FAW decline as plants mature [39,40,41]. Therefore, the plants were chosen to be infested with FAW larvae at the V3 stage.
All plots were infested on the same day to ensure the uniformity of infestation. The level of leaf feeding damage for each plant per plot was rated 7, 14, and 21 days after artificial infestation using a visual rating scale of 1–9 [42]. On this scale, 1 = no visible damage, 2 = a few short holes on several leaves, 3 = short holes on several leaves, 4 = several leaves with short holes and a few long lesions, 5 = several holes with long lesions, 6 = several leaves with lesions < 2.5 cm, 7 = long lesions common on one-half of the leaves, 8 = long lesions common on one-half to two-thirds of leaves, and 9 = severe damage, most leaves with long lesions, and complete defoliation. After harvesting, rotten ears were counted per plot and the data were expressed in percentages. FAW-damaged maize kernels are predisposed to infections by Aspergillus flavus; as a result, rots develop on individual kernels or part of the ear and result in rotten ears. Grain yield was obtained from the shelled grain weight adjusted to 15% and converted to tons per hectare. Ear damage was rated on a scale of 1–9, where 1 = no visible damage to the ear, 2 = damage to a few kernels ( < 5) or less than 5% damage to an ear, 3 = damage to a few kernels (6–15) or less than 10% damage to an ear, 4 = damage to (16–30) kernels or less than 15% damage to an ear, 5 = damage to (31–50) kernels or less than 25% damage to an ear, 6 = damage to (51–75) kernels or more than 35% but less than 50% damage to an ear, 7 = damage to (76–100) kernels or more than 50% but less than 60% damage to an ear, 8 = damage to >100 kernels or more than 60% but less than 100% damage to an ear, 9 = almost 100% damage to an ear. Considering each year by location as a separate test environment, phenotypic data were taken in two environments with two replications per environment.

2.3. Phenotypic and Genotypic Data Analyses

Data from each trait met all the assumptions of the applied statistical model, i.e., normally distributed, constant variance, and independent [43]; as a result, no data transformation was applied. Analyses of variance (ANOVA) was performed for each and across environments, and the restricted maximum likelihood (REML) approach was used in the META-R program [44]. Variance components were calculated with a linear mixed model. The following linear mixed-effects model was used to estimate the variance components in a single environment:
Y i j k = μ + B l o c k j R e p i + G e n k + C o v + e i j k
where Y i j k is the trait of interest, µ is the grand mean of the trait, R e p i is the effect of the ith replicate, B l o c k j R e p i is the effect of the jth incomplete block within the ith replicate, G e n k is the effect of the kth genotype, Cov is the covariate, and e i j k is the error term associated with the ith replication, jth incomplete block, and the kth genotype. Blocks were considered as random effects while the replicates and genotypes were considered as fixed effects.
New terms were added to the model when performing trait analysis cross environments. The new linear model used was as follows;
Y i j k l = μ + E n v i + R e p j E n v i + B l o c k k E n v i R e p j + G e n l + E n v i   x   G e n l + C o v + e i j k l  
where the new terms E n v i and E n v i   x   G e n l are the effect of the ith environment and the environment by genotype interaction, respectively. The study treated replication as a fixed effect and all other treatments as random effects. On an entry-mean basis, the broad-sense heritability was estimated using the genotypic to phenotypic variance ratio from the derived variance components. Furthermore, to determine the genotypic effects of the investigated lines for each and across environments, a best linear unbiased estimation (BLUE) and best linear unbiased prediction (BLUP) were obtained.
For GWAS, BLUPs were used. On the other hand, BLUEs were used for GS analyses. Comparisons of variability between entries were made using the least squared differences (LSD) at a 5% significance level. The performance analytics R package [45] was used to compute pairwise Pearson’s correlation coefficients among BLUPs of the phenotypic traits.
Maize leaf tissue samples were collected from eight young, healthy seedlings raised under screen house conditions at the V3 stage (3–4 weeks old). A composite sample of tissues collected from each line was stored at −80 °C and later freeze dried for 72 h. High quality genomic DNA was isolated from freeze-dried tissues using the standard CIMMYT laboratory protocol [46]. The Diversity Array Technology (DArT) marker platform was used to develop 12,906 SNPs. Trait analysis by aSSociation Evolution and Linkage (TaSSEL) [47] was used to summarize genotype data by site, determine the allele frequencies, and implement quality screening. SNP variants that were monomorphic, called at repeat loci, had a heterozygosity of >0.05, and had a minor allele frequency of <0.05 were filtered and 7950 high-quality SNPs were retained for downstream genomic analysis.

2.4. Population Structure, Kinship, Linkage Disequilibrium, and GWAS

Principal component analysis (PCA) was implemented using 7950 markers that were distributed across the ten maize chromosomes. A two-dimensional plot of the first two principal components was generated using the multi-locus random SNP effect mixed linear model ‘mrMLM.GUI’ R package version 4.0.2 [48]. Marker-based kinship analysis was used to account for cryptic relatedness in the association mapping panel. A genomic relationship matrix was constructed using a restricted maximum-likelihood (REML) estimate of probability of two alleles at a locus being identical in state [49]. Estimates of linkage disequilibrium (LD) decay over genetic distances were determined by plotting the squared correlation coefficients (r2) between pairs of SNPs against their pairwise physical distance in base pairs using TaSSEL version 5.2 [50]. A non-linear regression model was fitted in the R environment [51] and a population specific critical value of r2 = 0.1 was taken, beyond which LD could be due to linkage.
Kinship and population structure were incorporated as covariates in the association analyses. The R package ‘FarmCPU-fixed and random model Circulating Probability Unification’ with GAPIT (Genome Association and Prediction Integrated Tool) was used for GWAS analysis [52]. To evaluate the suitability of the GWAS models used, the relationships between the observed and expected theoretical uniform distribution of p-values across all evaluated SNPs were inspected using the diagnostic quantile–quantile plots (Q–Q plots) generated in the R environment using the ‘qqman’ R package [53]. On the Q–Q plots, negative logarithms of the p-values from the model fitted in GWAS were plotted against their expected values under the null hypothesis of no association. To summarize GWAS results per chromosome, Manhattan scatter plots were generated by plotting the genomic positions of the SNPs against their negative log base 10 of the p-values obtained from the GWAS model, and an F-test was conducted for the null hypothesis on the Y-axis. The source sequences of the significantly associated SNPs were used to perform BLAST searches against the B73 maize reference genome version 3 with a view to identify candidate genes located within a 10 kb window. The inferred biological functions of the candidate genes were retrieved from the maize genome database [54] and published literature.
BLUEs across environments for each trait were used in the GS analysis. The ridge-regression BLUP (RR-BLUP) [55] with a fivefold cross-validation for each trait was used for the analysis. A sample of 6400 SNPs with all data values, equally distributed throughout the genome, and MAF > 0.05 were chosen from the DART data. The GWAS panel was sampled to form a training and prediction set. For each trait, 100 iterations were done for the sampling of the training and validation sets. The prediction accuracy was calculated as the correlation between the observed phenotypes and genomic estimated breeding values (GEBVs) divided by the square root of heritability [56].

3. Results

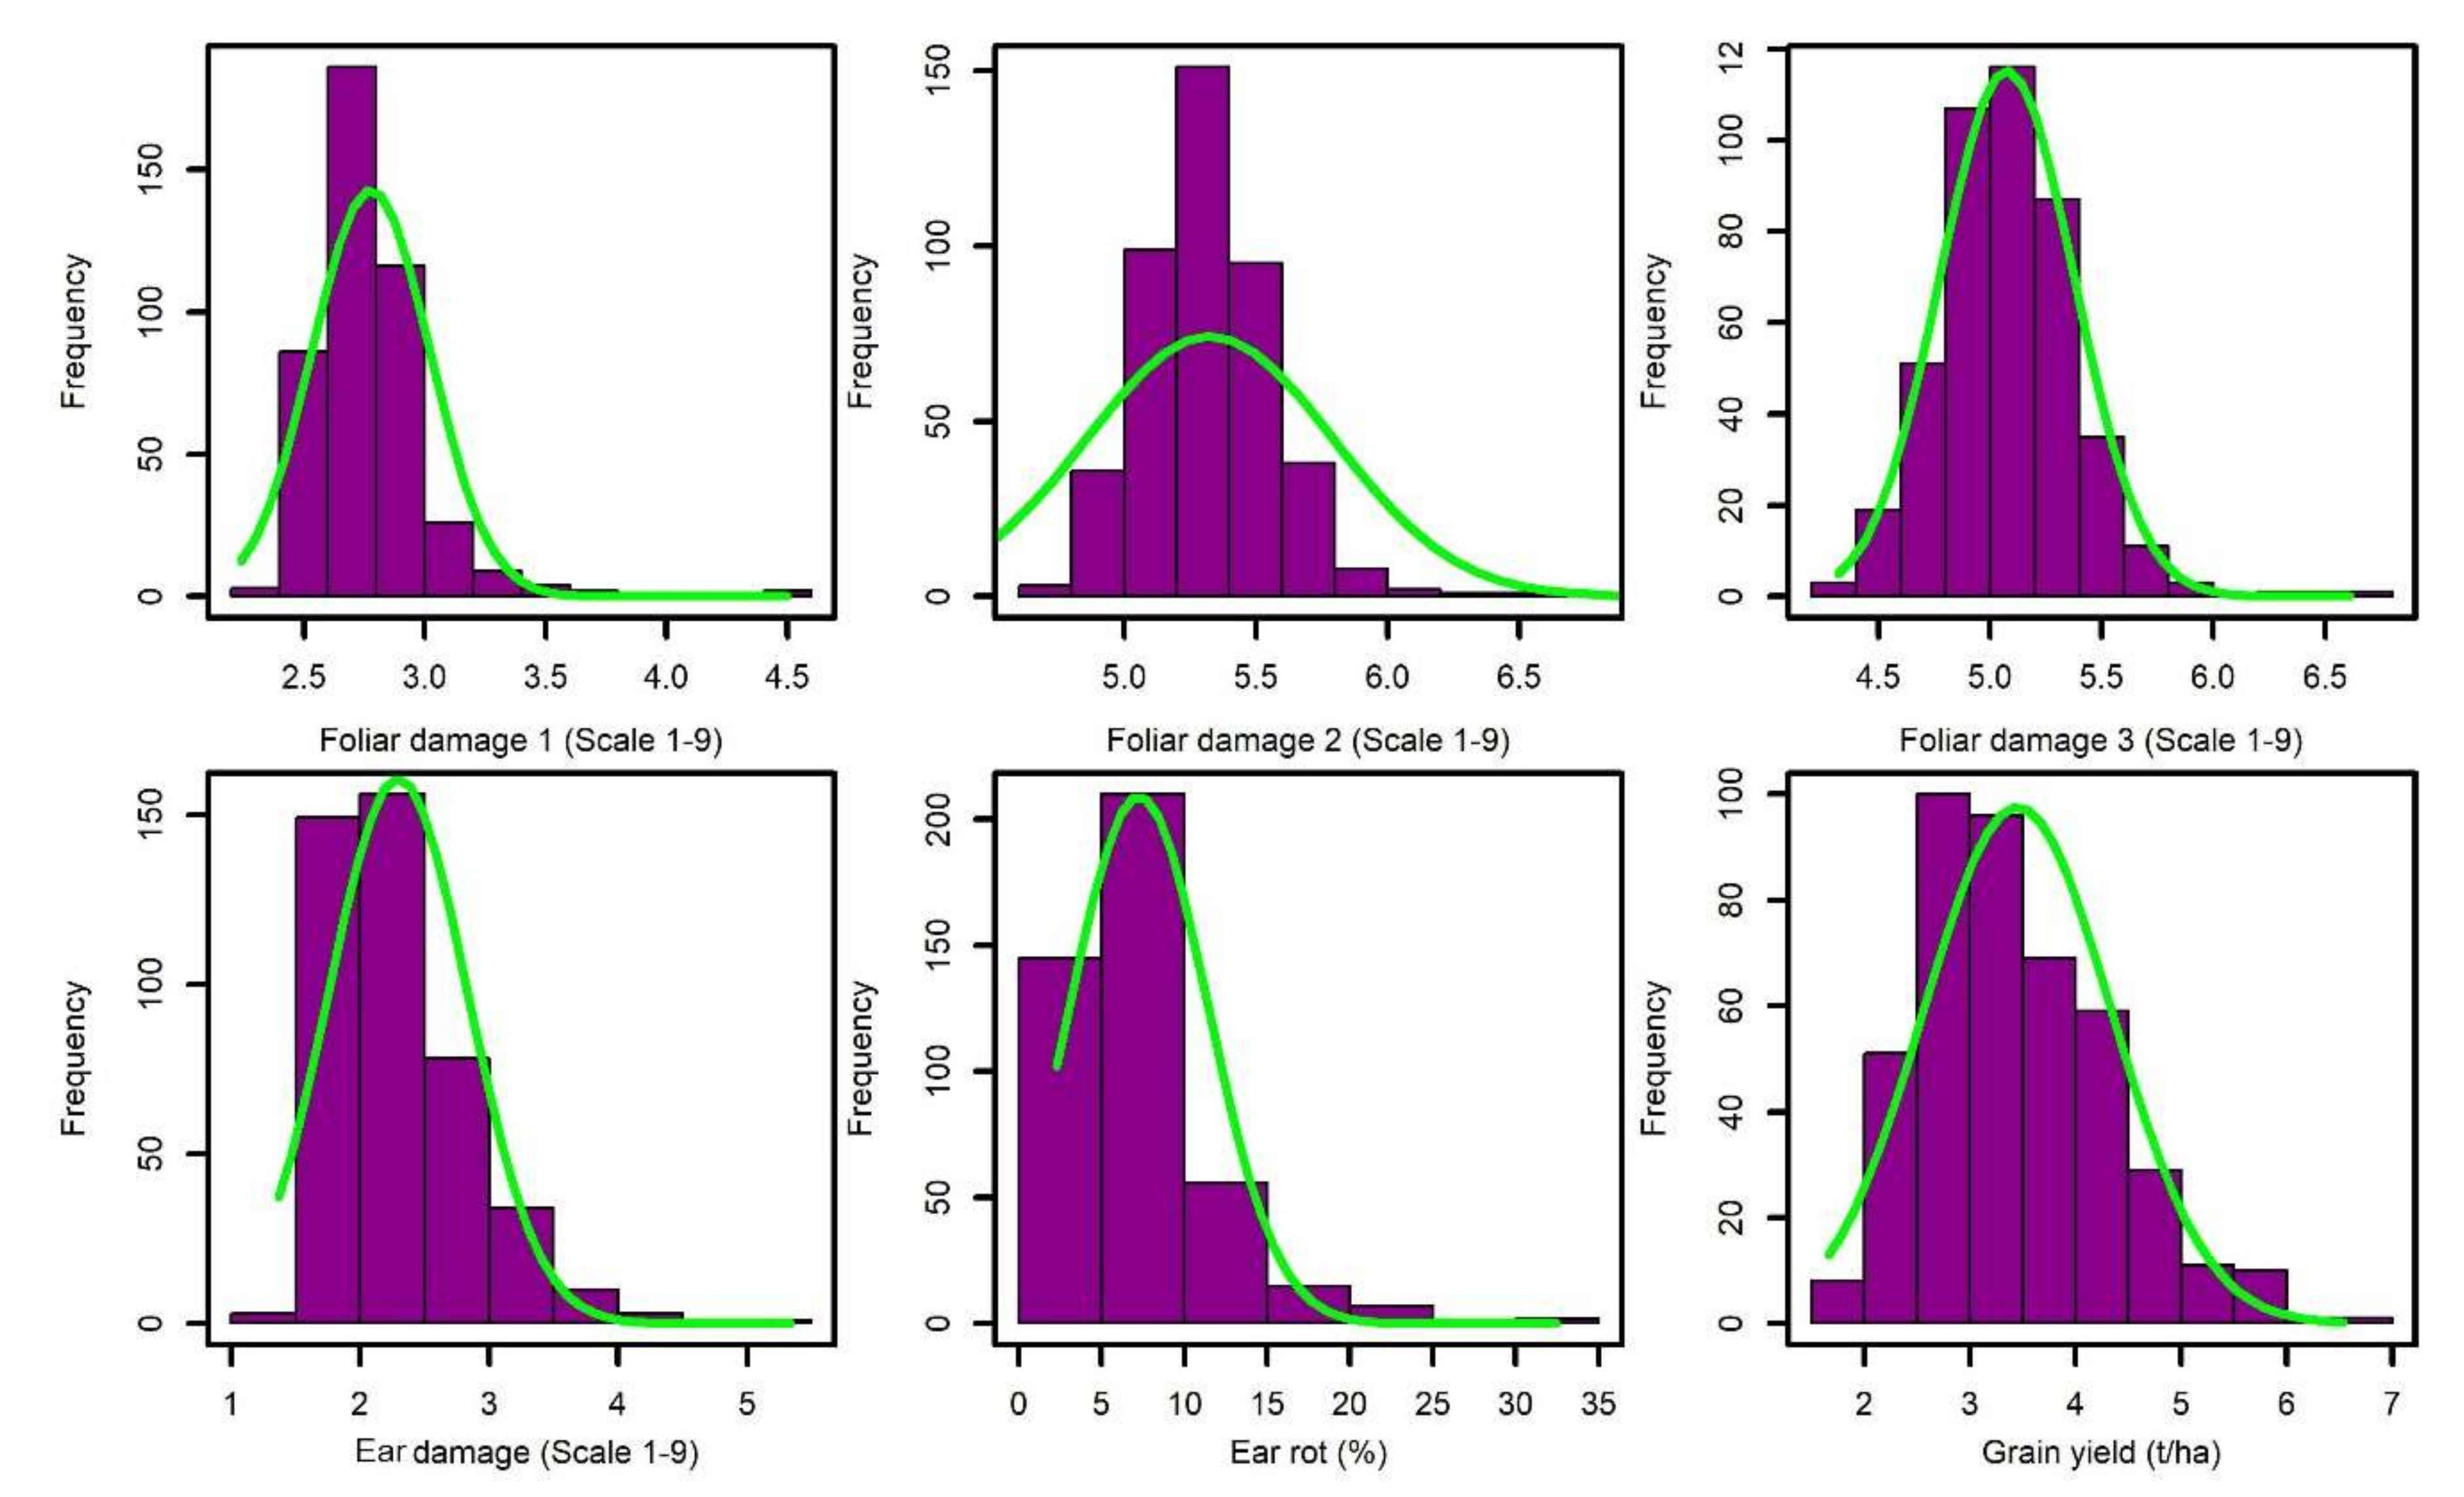
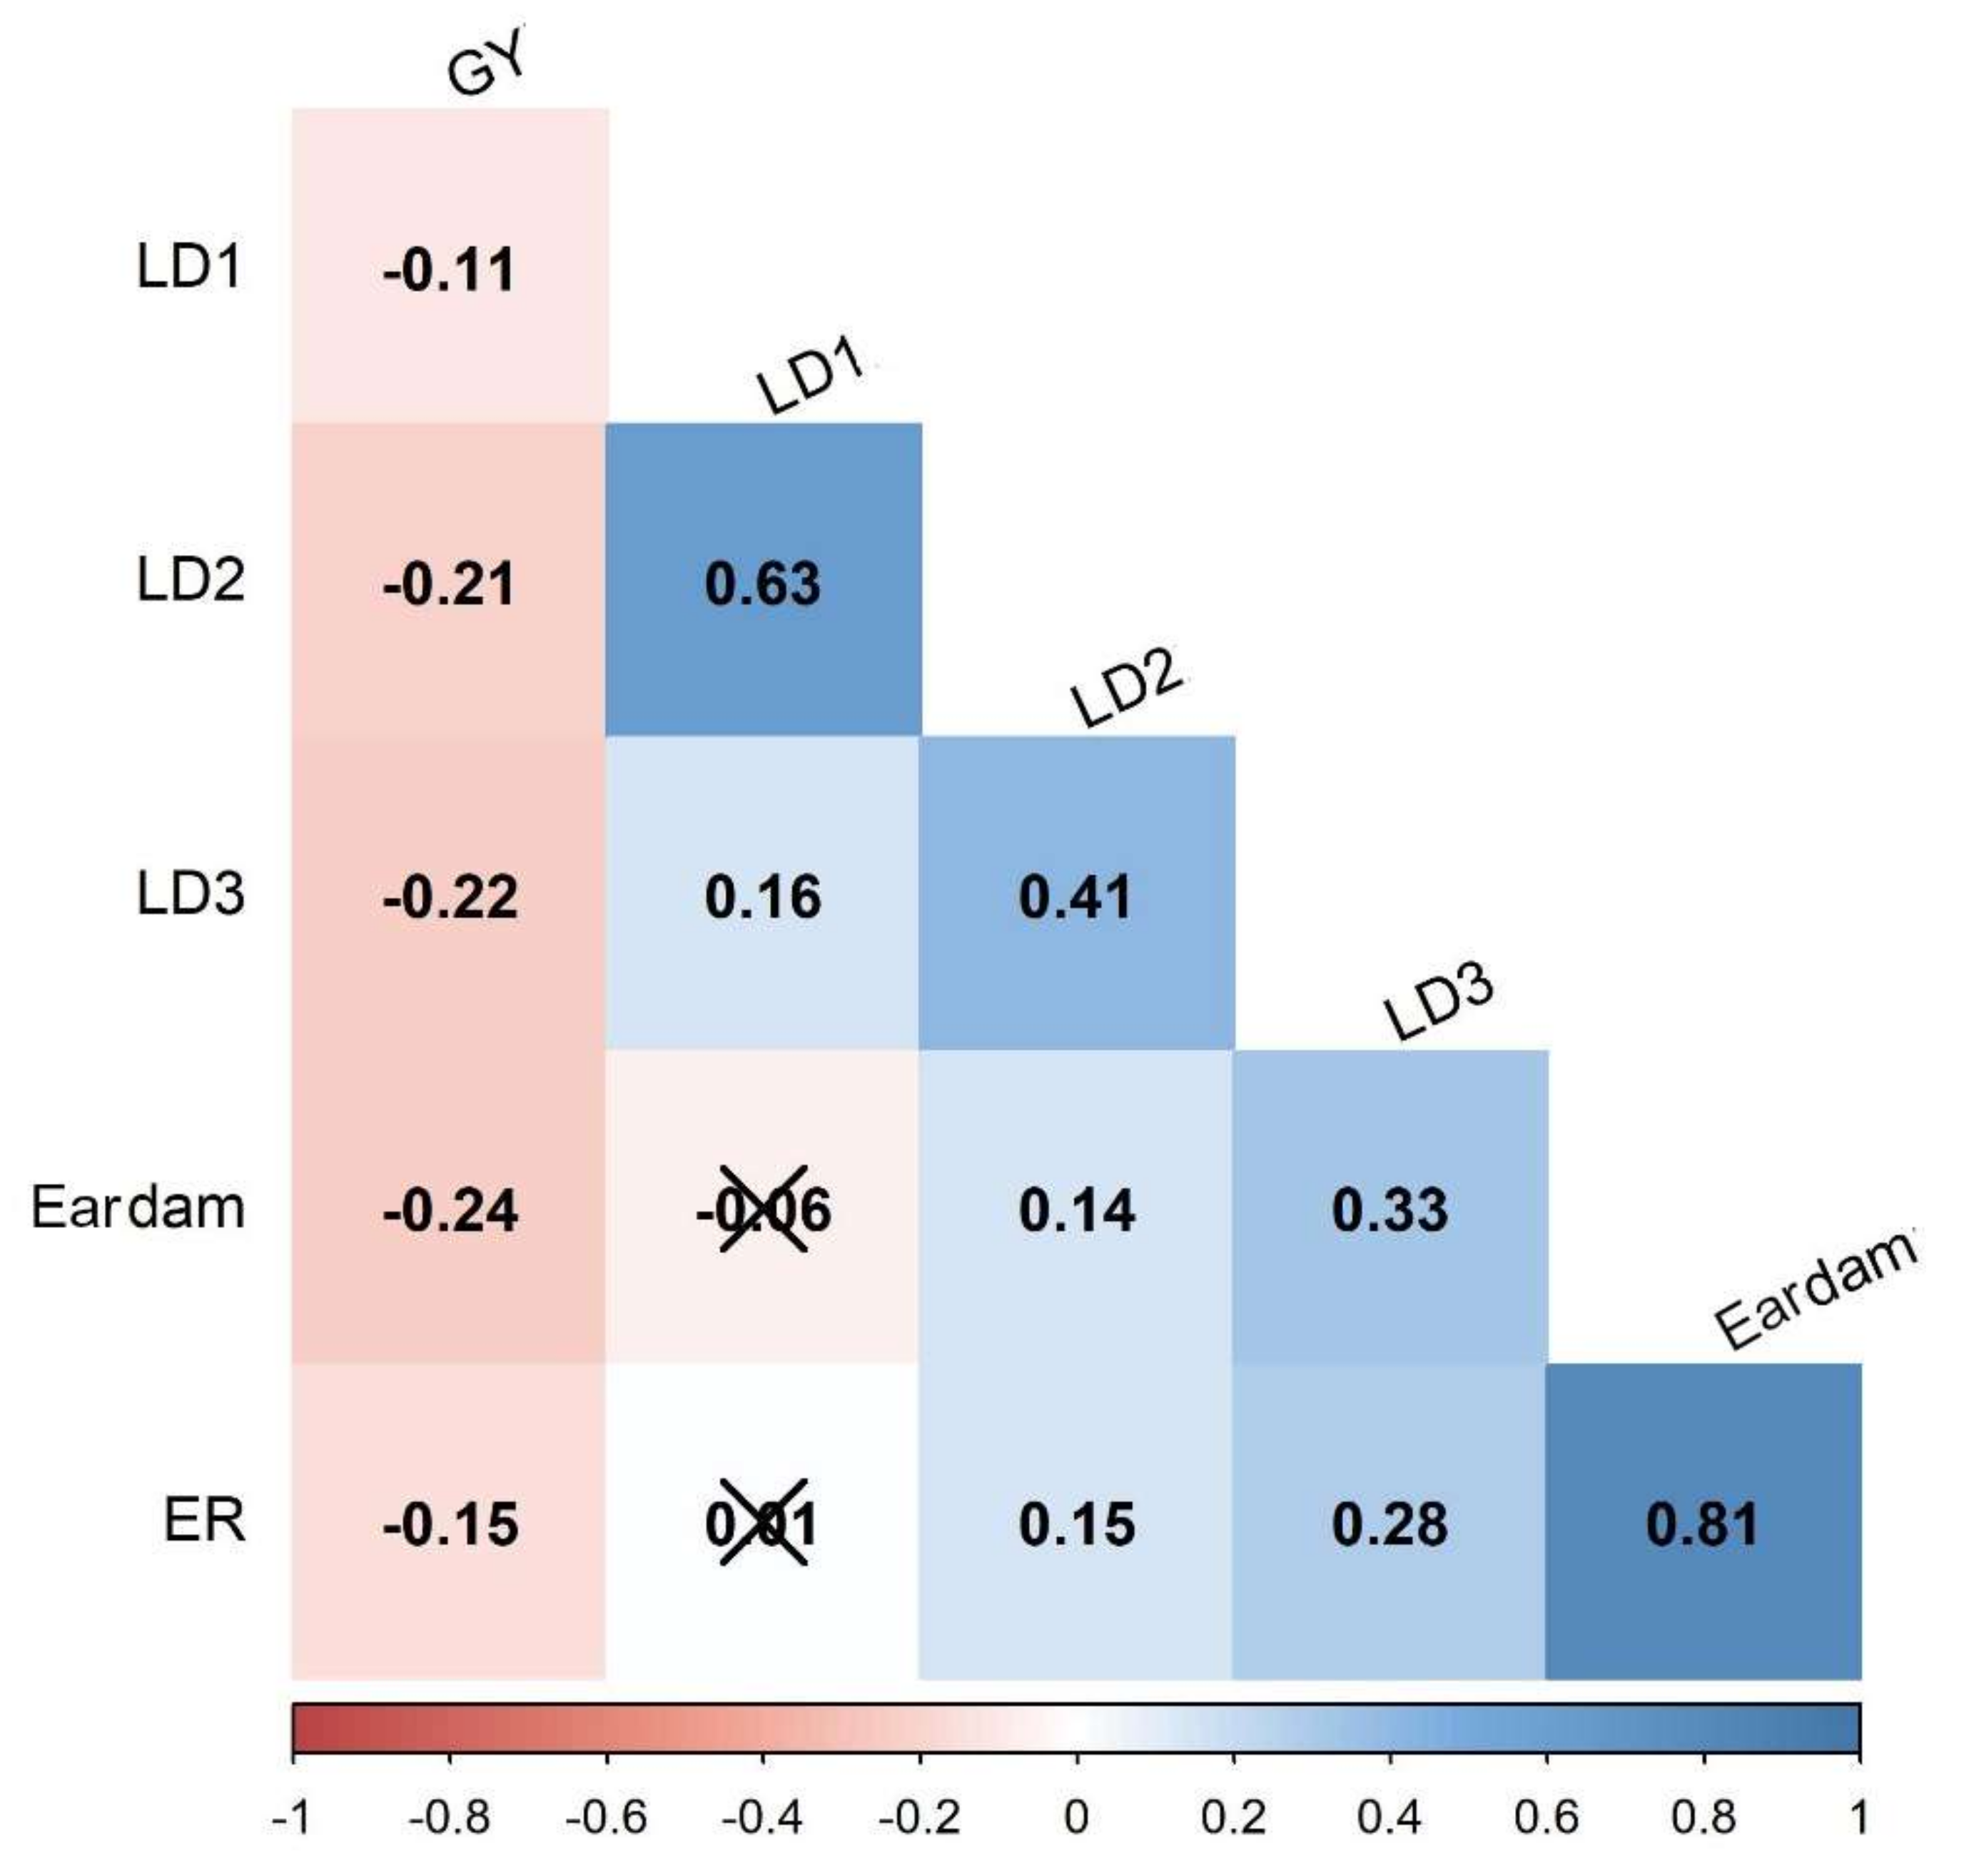
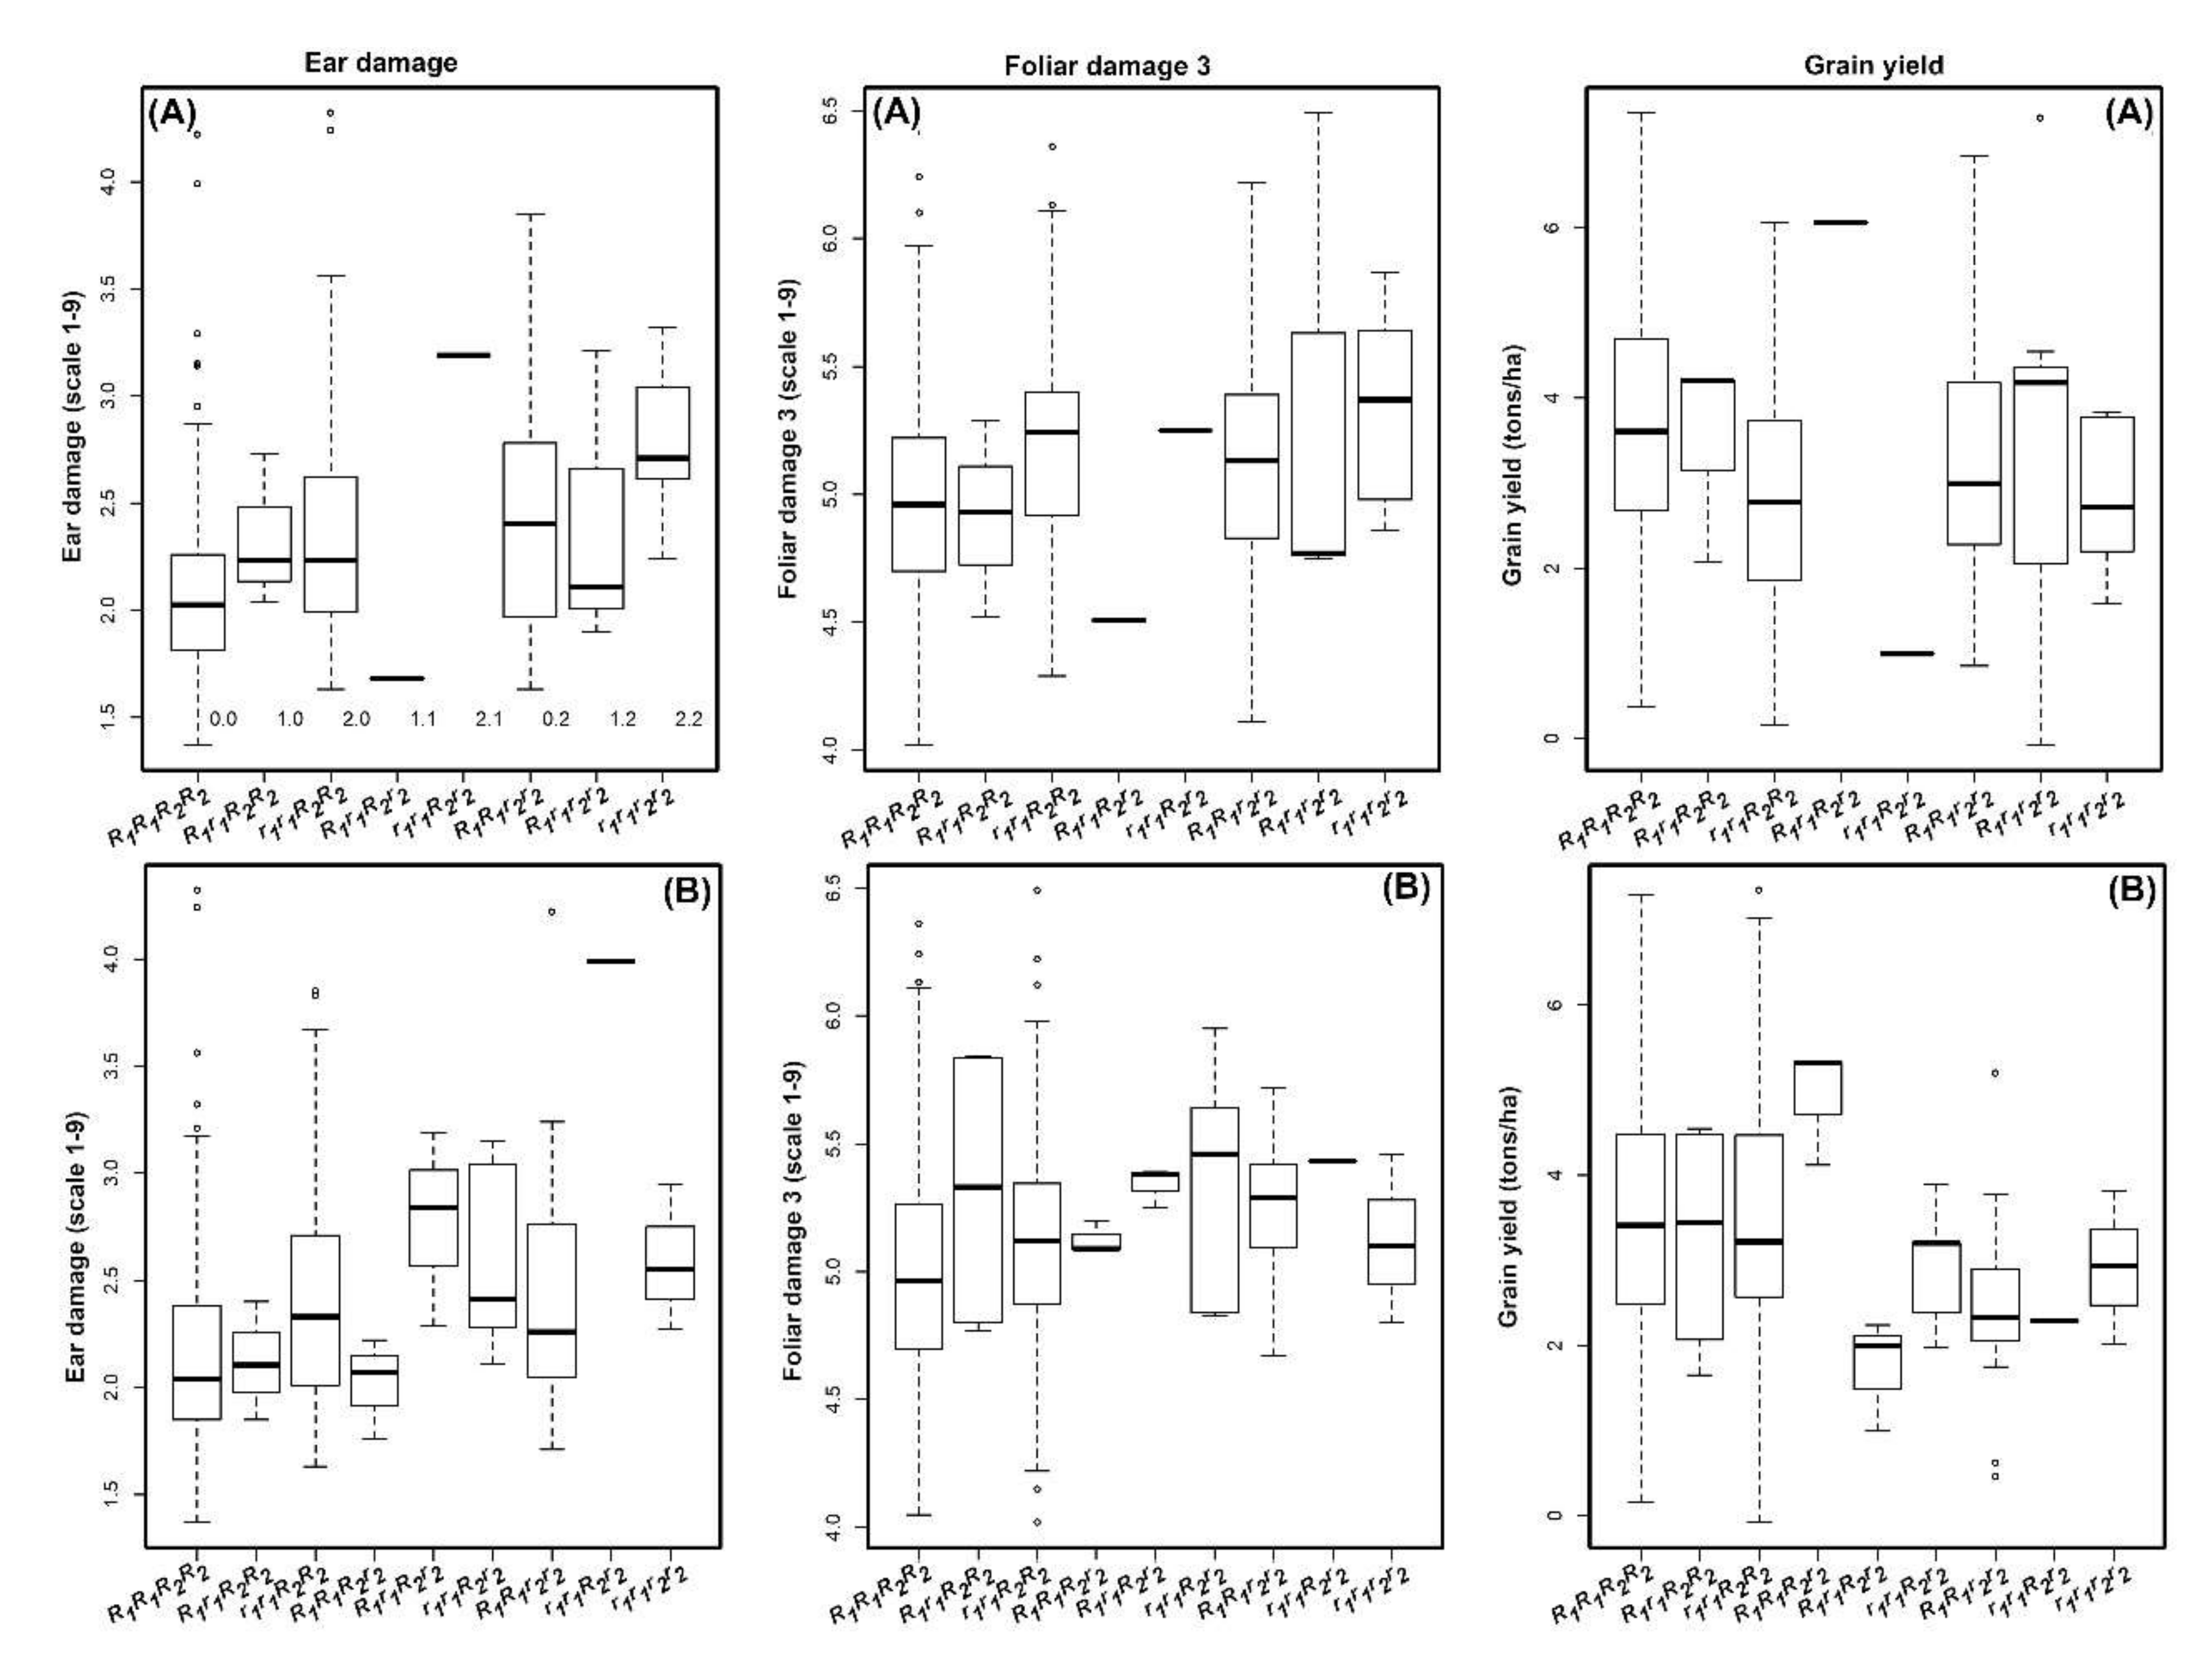
3.1. Phenotypic Data Analyses

The frequency distribution of the BLUEs for foliar damage scores at 7, 14, and 21 days after artificial infestation, ear damage, ear rot, and grain yield exhibited approximately near normal distributions (Figure 1). Evaluation of the frequency distributions of the phenotype data indicated that further parametric tests could therefore be implemented without violating the model assumptions of normality. The best performing lines under the artificial infestation of FAW over two seasons are listed in Table 1. Leaf damage scores 7, 14, and 21 days after artificial FAW infestation averaged 2.8, 5.3, and 5.1, respectively (Table 2). Transgressive segregants were observed in both directions of the injury rating scale. Most lines recorded high injury ratings and were considered as susceptible to FAW leaf feeding damage, while a few lines exhibited injury ratings that were not significantly different from those of the resistant CML71 control. These lines were earmarked as good sources of native resistance to FAW foliar feeding damage. Injury ratings for lines identified as FAW-susceptible were not significantly different to those of the susceptible CML444 control. Most lines did not suffer severe ear damage on a scale of 1–9 and therefore the observed ear damage mean was low (2.3). Ear rot averaged 7.3% while grain yield under artificial FAW infestation had a mean of 3.4 tons/ha with a range from 1.6 to 6.5 tons/ha.
Knowledge on the proportion of genetic variation for the traits of interest is critical to a breeder when formulating an efficient and effective resistance breeding scheme. Analysis of variance (ANOVA) was used to partition total variance into genotypic, phenotypic, and variance due to genotype by environment interaction (Table 1). Across-environment analyses revealed significant (p < 0.01) genotypic and genotype by environment interaction variances for all traits. Heritability (h2) estimates for foliar damage scores were moderate with 0.58, 0.45, and 0.38 at 7, 14, and 21 days after artificial FAW infestation, respectively. Grain yield recorded the highest (0.62) heritability estimate when compared to the rest of the traits. Ear damage, ear rot, and grain yield showed moderately high coefficients of variation estimates, which suggested that the selection of FAW-resistant lines based on these traits could be effective. Pairwise Pearson correlation analysis revealed significant but negative correlations between grain yield and the rest of the traits (Figure 2). Foliar damage scores at 7 days after artificial infestation showed no significant correlation with ear rot and ear damage. The results showed that ear damage was significant and positively correlated (0.81) with ear rot.

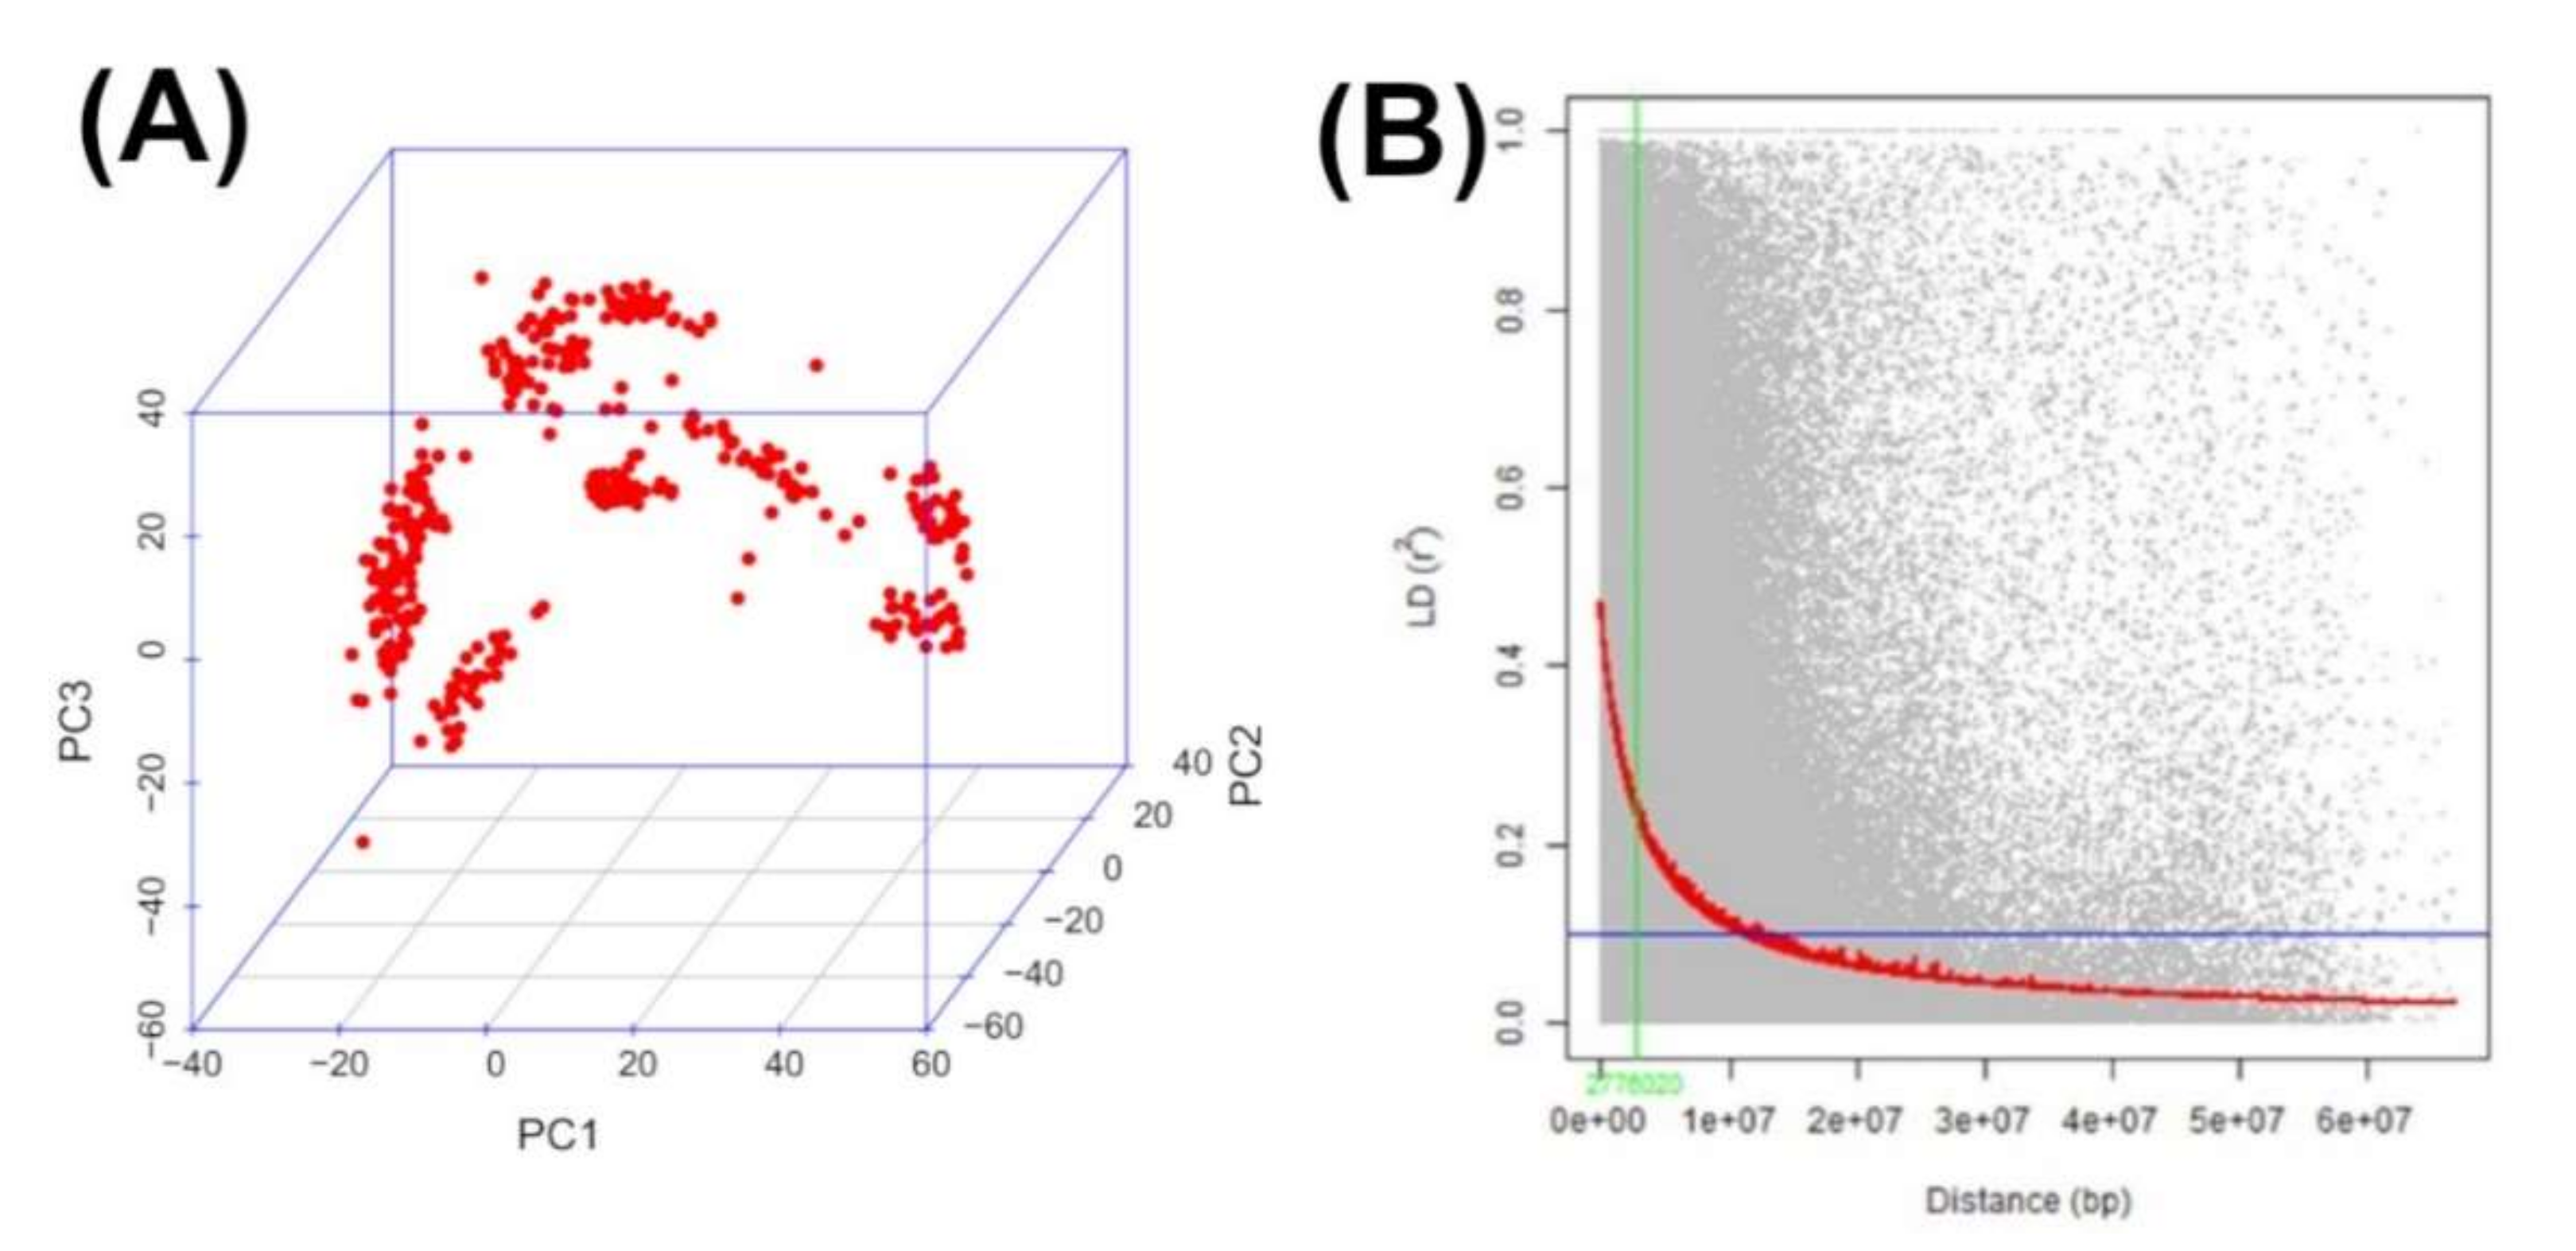
3.2. PCA, Kinship and LD Analysis

GWAS statistical power and resolution is reduced if the phenotypes of interest are significantly correlated with relatedness or population structure [57]. PCA based on the observed genotype data showed no clear pattern of population stratification (Figure 3A). The proportion of total variability explained by the first, second, and third principal components (PC1–3) was 9%, 6%, and 5%, respectively. Figure 3A shows a three-dimensional scatter plot of the first three principal components which together contributed about 20% of the total variation in the data.
Figure 3B shows the extent of the genome-wide distribution of LD. The y-axis values represent the squared correlation coefficient (r2) between pairs of SNPs while the x-axis values represent the physical distance in Mega base pairs (Mbp). The red line is the moving average of the 10 adjacent markers. Each dot represents a pair of distances between two markers on the window and their squared correlation coefficient. Across the ten chromosomes, the magnitude of r2 dropped sharply as the genetic distance between SNP markers increased. At LD cut off points of r2 = 0.1 (threshold value beyond which LD was likely to be caused by linkage), the average physical distance was 10 Mbp.

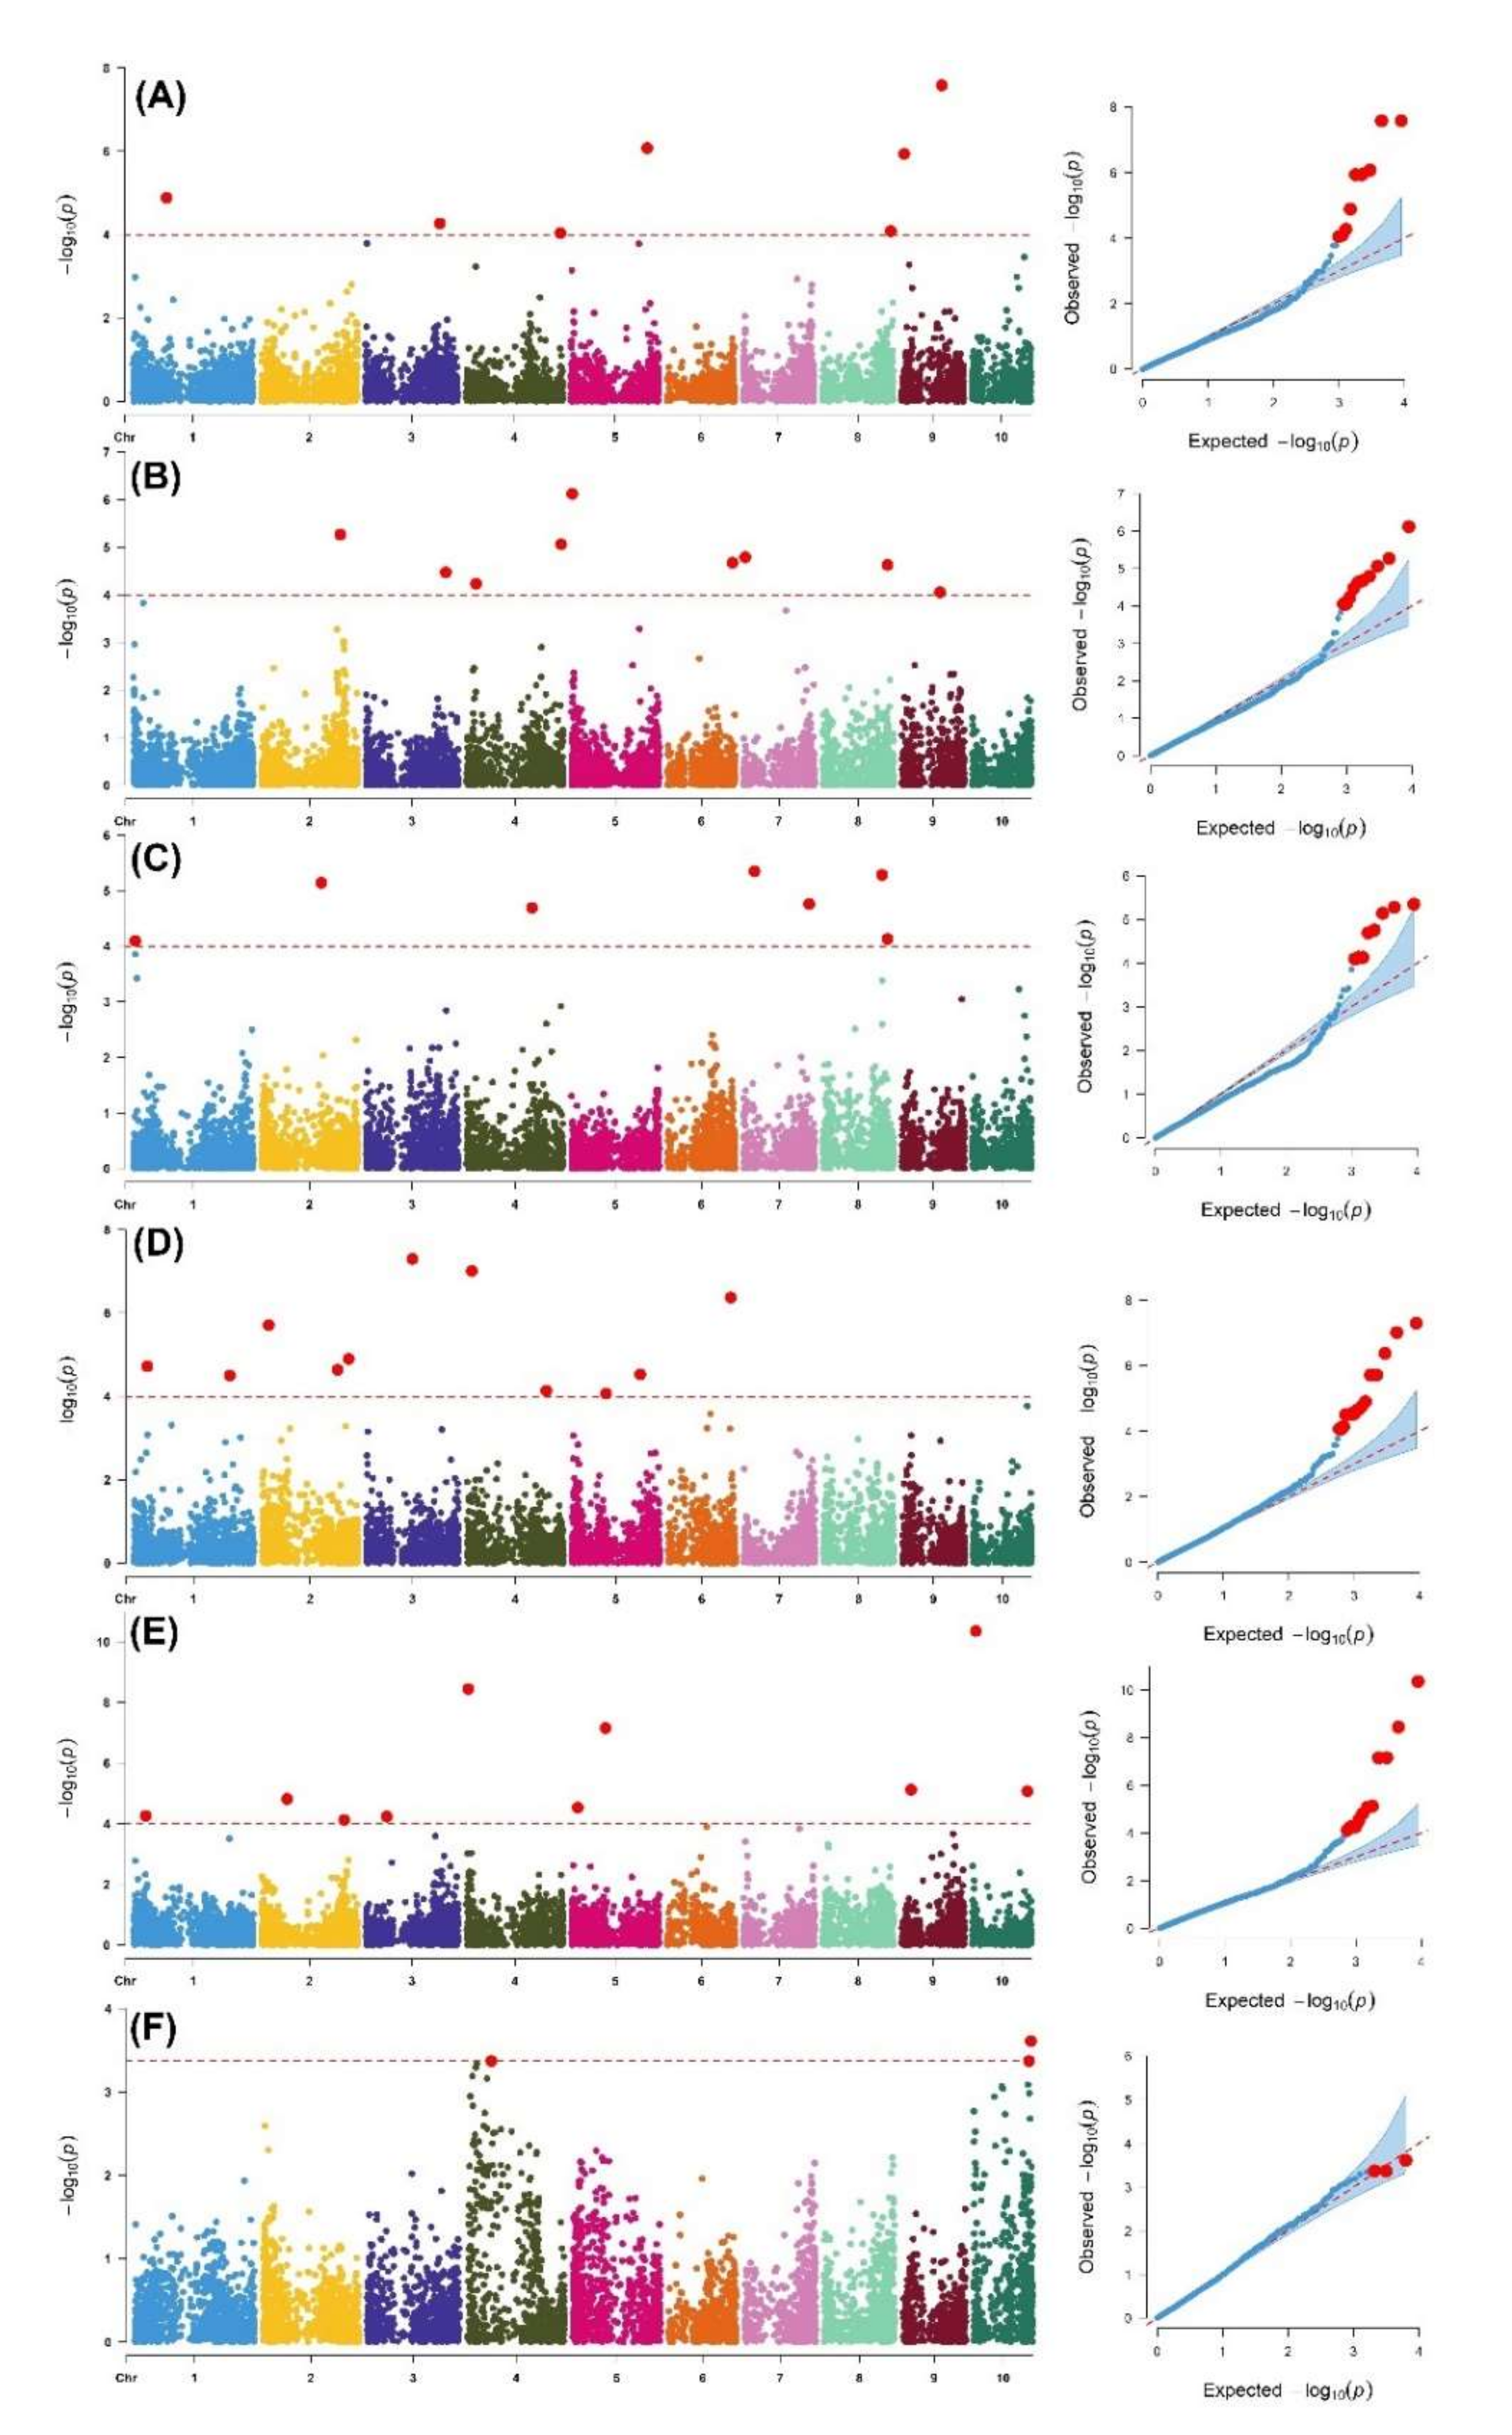
3.3. Genome-Wide Association Analysis

Results from the genome-wide association analysis of the six traits relevant to FAW resistance are presented in Manhattan plots (Figure 4). Diagnostic Q–Q plots displayed beside each Manhattan plot were used to assess the suitability of the GWAS model used. A set of nine SNPs located on chromosomes 1, 3, 4, 5, 8, and 9 were found to be most significantly associated with foliar damage scores 7 days after the artificial infestation of FAW while 11 SNPs distributed across all chromosomes except chromosome 10 were significantly associated with foliar damage scored on the 14th day after infestation (Figure 4, Table 3). A total of eight SNPs distributed on chromosomes 1, 2, 4, 7, and 8 were highly associated with the foliar damage score on the 21st day after artificial FAW infestation. Two SNPs (DT9_102187311 and DT5_193883551) with the strongest association (p = 10–8) with foliar damage scores across all infestation durations were found. For ear damage scores, 13 SNPs distributed on chromosomes 1, 2, 3, 4, 5, 6, and 10 were detected. There were 13 SNPs significantly associated with ear rot resistance distributed across all chromosomes except chromosome 8. SNP DT5_86480332 was commonly detected for both ear damage and ear rot scores. Grain yield under artificial FAW infestation exhibited large peaks of association signals on chromosomes 4 and 10 (Figure 4F, Table 3). There were no common SNPs detected between different foliar damage scores, ear damage, and grain yield data.
The magnitude of the genetic effects of each SNP were determined from the final GWAS model and the signs of the genetic effect were used to identify the allele influencing the trait. The major allele increased the expression of the trait while the minor allele reduced the trait expression. The SNP (DT8_165270110) located on chromosome 8 contributed the strongest estimated effect size (6.50) for the expression of the leaf feeding damage resistance trait. A set of putative candidate genes associated with significant SNPs were identified and their inferred biological functions varied from a defense response to a carbohydrate metabolic process (Table 3).
The phenotypic values of the different allele classes of these SNPs in the association panel for ear damage, foliar damage, and grain yield under FAW infestation are presented in Figure 5. Among several genomic regions identified for ear damage scores, allelic effects on FAW resistance were prominent in four selected SNPs (DT1_34838367 (CC/TT) and DT2_192225273 (AA/CC) and boxplots B with DT5_86480332(AA/TT) and DT6_108383751). Two SNPs DT1_34838367 (CC/TT) and DT2_192225273 (AA/CC) in a combination of favorable alleles resulted in the score of 2.0 and 4.9 for ear damage and foliar damage, respectively (Figure 5A). On the contrary, for the same marker with unfavorable alleles, the scores were increased to 2.8 and 5.5, respectively. Similarly, for the other two SNPs DT5_86480332 (AA/TT) and DT6_108383751, a decrease in ear damage score and foliar damage score and an increase in grain yield were also observed (Figure 5B).
The RR-BLUP model was used to estimate the performance of maize genotypes for FAW resistance-associated traits (Figure 6). Average prediction accuracies across the studied genotypes were higher for the foliar damage score on the 21st day after the artificial infestation of FAW (0.79) and lower for foliar damage on the 7th day after the artificial infestation of FAW (0.48). In the GWAS panel, we observed the prediction accuracy of 0.48, 0.52. 0.79, 0.77, 0.73, and 0.50 for foliar damage on the 7th day, 14th day, and 21st day, ear damage, ear rot, and grain yield under FAW infestation, respectively.

4. Discussion

Inadequate maize production, particularly due to insect-pest infestation, does not only threaten the livelihoods of millions of smallholder farmers who dominate maize agriculture in Africa, but also undermines the hunger reduction plan envisioned in the 2030 sustainable development goals [58]. The need to sustainably protect maize crop from FAW foliar damage and to mitigate subsequent yield losses using a multi-pronged strategy that includes the utilization of maize varieties endowed with native resistance is a prioritized research agenda in Africa [59]. The objectives of the present study were to screen maize lines developed by CIMMYT for their reactions to artificial FAW infestation, identify FAW resistant germplasm for use in future resistance breeding, and investigate the genetic basis of the resistance trait.
A comparison of injury ratings 7, 14, and 21 days after artificial infestation showed intensive FAW foliar feeding during the early to mid-whorl vegetative stage of the maize plant growth and development. This is because FAW feeds intensively during its 5th and 6th growth stages. The most destructive FAW developmental stage may also coincide with the most susceptible maize growth stage. Maize lines that exhibited injury ratings that were not significantly different from those of the resistant control (Table 1) could be utilized in developing novel FAW-resistant populations.
Grain yield, the most important agronomic trait, was low under artificial FAW infestation. This could also be due to the extensive foliar damage which causes a direct loss of photosynthates and alteration of the normal functioning of the remaining leaf tissue [60]. Foliar feeding by FAW reduces maize leaf surface area, which negatively affects the photosynthesis process and assimilate partitioning, both of which are critical in grain filling. Stem tunnelling caused by FAW also disrupts water and nutrients uptake, which could adversely impact grain yield. Estimates of genetic variation among traits of interest provide useful information when formulating a resistance breeding plan. For all traits, phenotypic variances were higher than the corresponding genotypic variances, which suggested the considerable influence of environmental factors as well as genotype by environment interaction on the expression of these traits.
The potential of phenotypic plasticity to evolve [61] in maize lines endowed with native resistance to FAW foliar damage due to the strong influence of genotype by environment (GXE) interaction underscores the importance of conducting multi-year germplasm evaluations when screening maize germplasm for resistance to FAW foliar damage. Previous studies have also concluded that the analysis of genotype by environment interactions could facilitate the identification of cultivars whose yield-stability are related to the linear effect of an environmental index [62]. The moderately high component of heritable variation associated with foliar damage scores 7 and 14 days after artificial infestation indicated that these traits are amenable for improvement. Leaf damage scores 21 days after artificial infestation had the lowest heritability estimate, which suggested the precise evaluation of early-stage foliar damage compared to late-stage foliar damage. Heritability estimates reported in the present work could help optimize the choice of the most progressive breeding method for use in trait improvement. The missing part of heritability [63], however, can be uncovered by utilization of new genetic study designs that incorporate more novel types of genotypes to unravel rare alleles of large effect [64]. Although grain yield under artificial FAW infestation exhibited the highest heritability estimate (0.62), a direct selection of a FAW resistance germplasm based on grain yield component could be ineffective. This is because grain yield is also a complex trait influenced by the interaction of various yield components such as plant height, ear height, and 1000 grain weight [65]. High coefficients of variation for all traits suggested that the selection of FAW-resistant lines based on these traits could be effective.
The magnitude and the direction of the correlations for several FAW resistance indicator traits should be examined to understand the desirability of their relationships with grain yield, which is the most desirable agronomic trait with economic importance. Results from the correlation analysis indicated that grain yield was negatively correlated with a high magnitude to foliar damage scores, ear rot, and ear damage traits. The correlation between ear rot and ear damage was positive, strong, and highly significant (p < 0.01). FAW-damaged ears are predisposed to fungal attacks, rots, and mycotoxin contamination which adversely impact grain quantity and quality [8]. Interestingly, ear damage was not significantly correlated with the early stage of the foliar damage score but was significantly and positively correlated with the foliar damage score recorded at later stages (Figure 2).
In the present study, SNPs considered for GWAS had a fairly even marker distribution spanning the whole maize genome (Supplementary Figure S1). The uneven distribution of markers may contribute to the detection of false positives and biased estimation of population structure and relatedness [66]. In the GWAS association test model implemented, population structure and kinship in the association mapping panel were integrated as covariates to reduce the detection of spurious associations. The assessment of the diagnostic Q–Q plots indicated that population structure and kinship were effectively controlled. PCA and kinship analysis (Supplementary Figure S2) suggested that there was a substantial amount of genetic differentiation in the association mapping panel and weak evidence to explain the presence of a population structure.
The rate of linkage disequilibrium decay provides useful information required to implement meaningful association mapping study [67]. In the present study, LD persisted over a large genetic distance (r2 < 0.1 within 10 Mega base pairs). The high level of homozygosity in the maize lines used in the current study may have rendered recombination ineffective in breaking down LD. Varying estimates of LD decay have been reported in maize, such as 27.31 kb [68] and 14.97 kb in an IMAS panel [69]. These studies indicated a rapid decay in the tropical maize germplasm as compared to the temperate germplasm, which suggests a broader genetic base, resulting from high recombination events [70]. This provides breeders with an opportunity to select germplasm that integrates high grain yield with FAW resistance, disease resistance, and abiotic stress tolerance.
GWAS revealed 56 significant marker–trait associations (Table 3). Chromosome 4 accounted for the highest number (15%) of the SNP markers associated with foliar damage. Chromosomes 4 and 9 have been reported to harbor SNP markers associated with resistance to major lepidopteran pests in maize [71]. One major effect QTL on chromosome 9 in bin 9.03, reported in previous studies [72,73], coincided with SNP DT9_96875821, detected for the foliar damage score on the 14th day after infestation. Another major QTL detected on bin 4.06 coincided with SNP DT4_167218393, detected for the foliar damage score 21 days after infestation.
The shift in allele frequency proportions has been attributed to the natural or artificial selection of variants conferring a selective advantage [74]. The results from this study suggest that the frequency of alleles conferring an increased expression of resistance to FAW foliar damage are rare and could increase over generations to become fixed or common in maize populations due to selection. In the present study, SNP loci with high minor allele frequencies had small effects, while those with low allele frequencies had larger effect sizes. Whereas the effect sizes of individual loci were small, their potential to confer a durable and stable resistance to FAW feeding damage depends on their combined effect sizes [64]. Our results corroborate with previous findings that have linked the genetic basis of pest resistance in maize to multiple genes of small effects that are scattered across the genome [29].
Larger peaks on the Manhattan plots were suggestive of a strong association between the surrounding genomic region and the corresponding phenotypic trait and warrants further validation. Grain yield under artificial FAW infestation, for instance, exhibited peaks of association signals on chromosomes 4 and 10 which could be due to strong selection pressure during the breeding and domestication process [75]. While biological functions of uncharacterized candidate genes could not be inferred, SNP (DT8_165429441), strongly associated (p = 10−5) with leaf damage scores 14 days after infestation, was found within a genomic region containing the GRMZM2G016802 gene that participates in the defense response by restricting injury occurrence and enhancing recovery after injury [23]. The allelic effect of some of the selected markers (two SNPs in boxplots A with DT1_34838367 and DT2_192225273 and boxplots B with DT5_86480332 and DT6_108383751) clearly support the effective role in improving the level of FAW resistance (Figure 5). These consistent regions or SNPs could potentially help the breeders to design an effective strategy to introgress these QTNs in relevant breeding materials through marker-assisted breeding.
Foliar damage in maize triggers a complex cascade of biological pathways mediated by various genetic factors, effector molecules, and signaling components and which leads to the accumulation of secondary metabolites with anti-feedant effects [76]. SNP (DT3_3627288) located in chromosome 3 and significantly associated with late-stage foliar damage scores, for instance, was mapped in a genomic region adjacent to the GRMZM2G045259 gene involved in the phosphorylation–dephosphorylation of proteins in a process catalyzed serine/threonine kinases to effect signal transductions that play a prominent role in plant defense mechanisms [77]. The preferential upregulation of genes was implicated in general stress responses such as receptor kinases and in plants colonized by foliar feeding insects [78]. SNP (DT1_26003816), significantly associated with the ear damage trait, suggested that the putative candidate genes GRMZM2G015804 are involved in the carbohydrate metabolic process. In plants under biotic attack [79], photosynthetic genes involved in metabolic processes have been reported to be downregulated, and this could explain low grain yield under FAW infestation. Compared to plant–pathogen resistance genes, little information exists on plan–-insect resistance genes. To fully elucidate the genetic basis of FAW resistance in maize, further investigations are therefore warranted to functionally validate putative candidate genes with unknown functions reported in this study.
GS facilitates the rapid selection of superior genotypes through ease in genotyping, which captures the maximum favorable alleles. The potential of GS models in identifying lines with favorable alleles in maize for different traits has been studied by different groups [25,69,80]. The moderate to high accuracies observed in this study (Figure 6) for the association panel offer promise in breeding for FAW resistance. The prediction accuracy of the association panel was in agreement with various studies on moderately complex traits such as striga [81], maize chlorotic mottle virus [82], MLN [83], and grey leaf spot [69]. Significant genetic structure and a high LD between adjacent markers of the diversity panel result in a moderate prediction accuracy, which could also be attributed to its moderate heritability [82]. The rapid decline in the cost of genotyping makes it possible to routinely apply GS in breeding, specifically for complex traits such as FAW resistance. Combining GWAS and the predictive capabilities of GS will also improve the prediction accuracy by using information on the major QTLs detected in GWAS. Overall, the predicted accuracies are moderate, and under the assumption of the three cycles per year possibility, a high selection gain for complex traits such as FAW resistance is achievable with optimal resources.

5. Conclusions

To investigate the genetic basis of FAW resistance, we employed a single panel consisting of 423 tropical maize lines for GWAS and genomic prediction. The phenotypic correlations of the FAW resistance traits investigated indicated that this panel can be used to select better-performing lines under FAW infestation. GWAS identified 56 SNPs associated with FAW resistance traits. The genomic regions identified can be used for selection efforts to enhance FAW resistance. Furthermore, the findings showed that including GS in maize breeding can successfully support phenotypic selection to improve maize native genetic resistance. Future work should, therefore, focus on validating the identified SNPs to enhance the efficacy of maize breeding in SSA.

Supplementary Materials

The following are available online at https://www.mdpi.com/article/10.3390/genes13020251/s1, Figure S1: Density plot showing the number SNPs within 1 Mb window size from the studied 7100 markers. The number of SNPs is displayed on a scale from green to red; Figure S2: Kinship analysis of the FAW GWAS panel. The heat map shows the pairwise kinship matrix based on 7100 filtered SNPs.

Author Contributions

Conceptualization, funding acquisition, project and resources administration, B.M.P.; methodology, investigations, formal analysis, and visualization, M.G., B.Y.A., D.M., Y.B., V.O.A. and I.K.; supervision, M.G., B.Y.A. and V.O.A.; original draft preparation, I.K.; writing—review and editing, all authors. All authors have read and agreed to the published version of the manuscript.

Funding

The research was supported by the Bill and Melinda Gates Foundation (B&MGF) and the United States Agency for International Development (USAID) through the Stress Tolerant Maize for Africa (STMA, B&MGF Grant # OPP1134248) Project, AGGMW (Accelerating Genetic Gains in Maize and Wheat for Improved Livelihoods, B&MGF Investment ID INV-003439) project, and the CGIAR Research Program on Maize (MAIZE). MAIZE receives W1 and W2 support from the Governments of Australia, Belgium, Canada, China, France, India, Japan, Korea, Mexico, the Netherlands, New Zealand, Norway, Sweden, Switzerland, the U.K., the U.S., and the World Bank. This study was made possible by a grant from the Bill and Melinda Gates Foundation to CIMMYT and a scholarship award by the Pan African University of Life and Earth Sciences (including Health and Agriculture), Ibadan, Nigeria to I.K.

Data Availability Statement

All datasets generated for this study are included in the article. The DART marker data are available at https://data.cimmyt.org.

Acknowledgments

The authors are grateful to the International Maize and Wheat Improvement Center (CIMMYT) and partner scientists and technicians who generated the germplasm and designed and conducted the experiments which we used to explore our objectives. Research work was generously supported by the CIMMYT, Kenya and the student fellowship for PhD studies for Isaac Kamweru from Pan African University of Life and Earth Sciences (Including Health and Agriculture), Ibadan, Nigeria. The authors highly appreciate the technical support received from the staff members affiliated with the CIMMYT maize research station in Kiboko, Kenya.

Conflicts of Interest

The authors declare no conflict of interest.

References

  1. Shiferaw, B.; Prasanna, B.M.; Hellin, J.; Bänziger, M. Crops That Feed the World 6. Past Successes and Future Challenges to the Role Played by Maize in Global Food Security. Food Secur. 2011, 3, 307–327. [Google Scholar] [CrossRef] [Green Version]
  2. Santpoort, R. The Drivers of Maize Area Expansion in Sub-Saharan Africa. How Policies to Boost Maize Production Overlook the Interests of Smallholder Farmers. Land 2020, 9, 68. [Google Scholar] [CrossRef] [Green Version]
  3. Girvetz, E.; Ramirez-Villegas, J.; Claessens, L.; Lamanna, C.; Navarro-Racines, C.; Nowak, A.; Thornton, P.; Rosenstock, T.S. Future Climate Projections in Africa: Where Are We Headed? In The Climate-Smart Agriculture Papers; Springer: Cham, Switzerland, 2019; pp. 15–27. [Google Scholar]
  4. Goergen, G.; Kumar, P.L.; Sankung, S.B.; Togola, A.; Tamò, M. First Report of Outbreaks of the Fall Armyworm Spodoptera Frugiperda (J.E. Smith) (Lepidoptera, Noctuidae), a New Alien Invasive Pest in West and Central Africa. PLoS ONE 2016, 11, e0165632. [Google Scholar] [CrossRef] [Green Version]
  5. Prasanna, B.M.; Huesing, J.E.; Eddy, R.; Peschke, V.M.; Regina, E.; Virginia, M.P. Fall Armyworm in Africa: A Guide for Integrated Pest Management, 1st ed.; Prasanna, B.M., Regina, E., Virginia, M.P., Eds.; CIMMYT: Queretaro, Mexico, 2018. [Google Scholar]
  6. De Groote, H.; Kimenju, S.C.; Munyua, B.; Palmas, S.; Kassie, M.; Bruce, A. Spread, and impact of fall armyworm (Spodoptera frugiperda J.E. Smith) in maize production areas of Kenya. Agriculture, Ecosystems & Environment 2020, 292, 106804. [Google Scholar] [CrossRef]
  7. Ni, A.; David, G.; Steve, L. Physiological Basis of Fall Armyworm (Lepidoptera: Noctuidae) Resistance in Seedlings of Maize Inbred Lines with Varying Levels of Silk Maysin. Florida Entomol. 2008, 91, 537–545. [Google Scholar] [CrossRef]
  8. Farhan, Y.; Smith, J.L.; Limay-Rios, V.; Schaafsma, A.W. The Effect of Simulated Lepidopteran Ear Feeding Injury on Mycotoxin Accumulation in Grain Corn (Poales: Poaceae). J. Econ. Entomol. 2020, 113, 2187–2196. [Google Scholar] [CrossRef] [PubMed]
  9. Oerke, E.C. Crop Losses to Pests. J. Agric. Sci. 2006, 144, 31–43. [Google Scholar] [CrossRef]
  10. Schlum, K.; Lamour, K.; Tandy, P.; Emrich, S.J.; de Bortoli, C.P.; Rao, T.; Viteri Dillon, D.M.; Linares-Ramirez, A.M.; Jurat-Fuentes, J.L. Genetic Screening to Identify Candidate Resistance Alleles to Cry1F Corn in Fall Armyworm Using Targeted Sequencing. Insects 2021, 12, 618. [Google Scholar] [CrossRef]
  11. Overton, K.; Maino, J.L.; Day, R.; Umina, P.A.; Bett, B.; Carnovale, D.; Ekesi, S.; Meagher, R.; Reynolds, O.L. Global crop impacts, yield losses and action thresholds for fall armyworm (Spodoptera frugiperda): A review. Crop. Prot. 2021, 145, 105641. [Google Scholar] [CrossRef]
  12. Day, R.; Abrahams, P.; Bateman, M.; Beale, T.; Clottey, V.; Cock, M.; Colmenarez, Y.; Corniani, N.; Early, R.; Godwin, J.; et al. Fall armyworm: Impacts and implications for Africa. Outlooks Pest Manag. 2017, 28, 196–201. [Google Scholar] [CrossRef] [Green Version]
  13. Matova, P.M.; Kamutando, C.N.; Magorokosho, C.; Kutywayo, D.; Gutsa, F.; Labuschagne, M. Fall-armyworm invasion, control practices and resistance breeding in Sub-Saharan Africa. Crop. Sci. 2020, 60, 2951–2970. [Google Scholar] [CrossRef] [PubMed]
  14. Storer, N.P.; Kubiszak, M.E.; Ed King, J.; Thompson, G.D.; Santos, A.C. Status of Resistance to Bt Maize in Spodoptera Frugiperda: Lessons from Puerto Rico. J. Invertebr. Pathol. 2012, 110, 294–300. [Google Scholar] [CrossRef]
  15. Farrar, J.J.; Ellsworth, P.C.; Sisco, R.; Baur, M.E.; Crump, A.; Fournier, A.J.; Katie Murray, M.; Jepson, P.C.; Tarutani, C.M.; Dorschner, K.W. Assessing Compatibility of a Pesticide in an IPM Program. J. Integr. Pest Manag. 2018, 9, 1–6. [Google Scholar] [CrossRef] [Green Version]
  16. Zhang, L.; Liu, B.; Zheng, W.; Liu, C.; Zhang, D.; Zhao, S.; Li, Z.; Xu, P.; Wilson, K.; Withers, A.; et al. Genetic Structure and Insecticide Resistance Characteristics of Fall Armyworm Populations Invading China. Mol. Ecol. Resour. 2020, 20, 1682–1696. [Google Scholar] [CrossRef] [PubMed]
  17. Hruska, A.J. Fall Armyworm (Spodoptera frugiperda) Management by Smallholders. CAB Rev. 2019, 14, 1–11. [Google Scholar] [CrossRef] [Green Version]
  18. Khan, Z.R.; Midega, C.A.O.; Amudavi, D.M.; Hassanali, A.; Pickett, J.A. On-Farm Evaluation of the ‘ Push—Pull ’Technology for the Control of Stemborers and Striga Weed on Maize in Western Kenya. Field Crops Res. 2008, 106, 224–233. [Google Scholar] [CrossRef]
  19. Harrison, R.D.; Thierfelder, C.; Baudron, F.; Chinwada, P.; Midega, C.; Schaffner, U.; Van Den Berg, J. Agro-Ecological Options for Fall Armyworm (Spodoptera frugiperda J.E. Smith) Management: Providing Low-Cost, Smallholder Friendly Solutions to an Invasive Pest. J. Environ. Manage. 2019, 243, 318–330. [Google Scholar] [CrossRef]
  20. Sharma, H.C.; Ortiz, R. Host Plant Resistance to Insects: An Eco-Friendly Approach for Pest Management and Environment Conservation. J. Environ. Biol. 2002, 23, 111–135. [Google Scholar]
  21. Ankala, A.; Kelley, R.Y.; Rowe, D.E.; Williams, W.P.; Luthe, D.S. Plant Science Foliar Herbivory Triggers Local and long Distance Defense Responses in Maize. Plant Sci. 2013, 199–200, 103–112. [Google Scholar] [CrossRef]
  22. War, A.R.; Paulraj, M.G.; Ahmad, T.; Buhroo, A.A.; Hussain, B.; Ignacimuthu, S.; Sharma, H.C. Mechanisms of Plant Defense against Insect Herbivores. Plant Signal. Behav. 2012, 7, 1306–1320. [Google Scholar] [CrossRef] [Green Version]
  23. Howe, G.A.; Jander, G. Plant Immunity to Insect Herbivores. Annu. Rev. Plant Biol. 2008, 59, 41–66. [Google Scholar] [CrossRef] [PubMed] [Green Version]
  24. Xiao, Y.; Liu, H.; Wu, L.; Warburton, M.; Yan, J. Genome-Wide Association Studies in Maize: Praise and Stargaze. Mol. Plant. 2017, 10, 359–374. [Google Scholar] [CrossRef] [PubMed] [Green Version]
  25. Gowda, M.; Beyene, Y.; Makumbi, D.; Semagn, K.; Olsen, M.S. Discovery and Validation of Genomic Regions Associated with Resistance to Maize Lethal Necrosis in Four Biparental Populations. Mol. Breeding 2018, 38, 1–16. [Google Scholar] [CrossRef] [PubMed] [Green Version]
  26. Crossa, J.; Pérez-Rodríguez, P.; Cuevas, J.; Montesinos-lópez, O.; Jarquín, D.; Campos, G.D.L.; Burgueño, J.; González-Camacho, J.M.; Pérez-Elizalde, S.; Beyene, Y.; et al. Genomic Selection in Plant Breeding: Methods, Models, and Perspectives. Trends Plant Sci. 2017, 22, 961–975. [Google Scholar] [CrossRef]
  27. Foiada, F.; Westermeier, P.; Kessel, B.; Ouzunova, M.; Wimmer, V.; Mayerhofer, W.; Presterl, T.; Dilger, M.; Kreps, R.; Eder, J.; et al. Improving Resistance to the European Corn Borer: A Comprehensive Study in Elite Maize Using QTL Mapping and Genome-Wide Prediction. Theor. Appl. Genet. 2015, 128, 875–891. [Google Scholar] [CrossRef]
  28. Xia, L.I.; Kang-lai, H.E.; Zhen-ying, W.; Shu-xiong, B.A.I. Quantitative Trait Loci for Asian Corn Borer Resistance in Maize Population. Agric. Sci. China 2010, 9, 77–84. [Google Scholar] [CrossRef]
  29. Khairallah, M.M.; Bohn, M.; Jiang, C.; Deutsch, J.A.; Jewell, D.C.; Mihm, J.A.; Melchinger, A.E.; González-De-León, D.; Hoisington, D.A. Molecular Mapping of QTL for Southwestern Corn Borer Resistance, Plant Height and Flowering in Tropical Maize. Plant Breed. 1998, 117, 309–318. [Google Scholar] [CrossRef]
  30. Bohn, M.; Khairallah, M.M.; González-de-León, D.; Hoisington, D.A.; Utz, H.F.; Deutsch, J.A.; Jewell, D.C.; Mihm, J.A.; Melchinger, A.E. QTL Mapping in Tropical Maize: I. Genomic Regions Affecting Leaf Feeding Resistance to Sugarcane Borer and Other Traits. Crop. Sci. 1996, 36, 1352–1361. [Google Scholar] [CrossRef] [Green Version]
  31. Brooks, T.D.; Shaun Bushman, B.; Paul Williams, W.; McMullen, M.D.; Buckley, P.M. Genetic Basis of Resistance to Fall Armyworm (Lepidoptera: Noctuidae) and Southwestern Corn Borer (Lepidoptera: Crambidae) Leaf-Feeding Damage in Maize. J. Econ. Entomol. 2007, 100, 1470–1475. [Google Scholar] [CrossRef]
  32. Badji, A.; Kwemoi, D.B.; Machida, L.; Okii, D.; Mwila, N.; Agbahoungba, S.; Kumi, F.; Ibanda, A.; Bararyenya, A.; Solemanegy, M. Genetic Basis of Maize Resistance to Multiple Insect Pests: Integrated Genome-Wide Comparative Mapping and Candidate Gene Prioritization. Genes 2020, 11, 689. [Google Scholar] [CrossRef]
  33. Wang, Q.; Tian, F.; Pan, Y.; Buckler, E.S.; Zhang, Z. A SUPER Powerful Method for Genome Wide Association Study. PLoS ONE 2014, 9, e107684. [Google Scholar] [CrossRef] [PubMed]
  34. Bentley, A.R.; Scutari, M.; Gosman, N.; Faure, S.; Bedford, F.; Howell, P.; Cockram, J.; Rose, G.A.; Barber, T.; Irigoyen, J. Applying Association Mapping and Genomic Selection to the Dissection of Key Traits in Elite European Wheat. Theor. Appl. Genet. 2014, 127, 2619–2633. [Google Scholar] [CrossRef] [PubMed]
  35. Kumar Joshi, R.; Nayak, S. Gene Pyramiding-A Broad Spectrum Technique for Developing Durable Stress Resistance in Crops. Biotechnol. Mol. Biol. Rev. 2010, 5, 51–60. [Google Scholar]
  36. Tefera, T.; Mugo, S.; Tende, R.; Likhayo, P. Mass Rearing of Stem Borers. In Maize Weevil, and Larger Grain Borer Insect Pests of Maize; CIMMYT: Nairobi, Kenya, 2010; pp. 9–27. Available online: https://repository.cimmyt.org/bitstream/handle/10883/815/94546.pdf?sequence=1&isAllowed=y (accessed on 14 December 2021).
  37. Abendroth, L.J.; Elmore, R.W.; Boyer, M.J.; Marlay, S.K. Corn Growth and Development; PMR 1009; Iowa State University Extension: Ames, IA, USA, 2011. [Google Scholar]
  38. Wiseman, B.R.; Davis, F.M.; Williams, W.P.; Widstrom, N.W. Resistance of a maize population, FAWCC(C5), to fall armyworm larvae (Lepidoptera: Noctuidae). Florida Entomologist 1996, 79, 329–336. [Google Scholar] [CrossRef]
  39. Williams, P.W.; Buckley, P.M.; Davis, F.M. Larval growth, and behavior of the fall armyworm (Lepidoptera: Noctuidae) on callus initiated from susceptible and resistant corn hybrids1. J. Econ. Entomol. 1985, 78, 951–954. [Google Scholar] [CrossRef]
  40. Videla, G.W.; Davis, F.M.; Williams, P.W.; Seong Ng, S. Fall armyworm (Lepidoptera: Noctuidae) larval growth and survivorship on susceptible and resistant corn at different vegetative growth stages. J. Econ. Entomol. 1992, 85, 2486–2491. [Google Scholar] [CrossRef]
  41. Davis, F.M.; Wiseman, B.R.; Williams, W.P.; Widstrom, N.W. Insect colony, planting date, and plant growth stage effects on screening maize for leaf-feeding resistance to fall armyworm (Lepidoptera: Noctuidae). Florida Entomologist 1996, 79, 317. [Google Scholar] [CrossRef]
  42. Bosque-Perez, N.A.; Dabrowski, Z.T. Toward insect resistant maize for the third world. In Proceedings of the International Symposium on Methodologies for Developing Host Plant Resistance to Maize Insects; CIMMYT: México-Veracruz, Mexico, 1989; Available online: https://repository.cimmyt.org/bitstream/handle/10883/706/15875.pdf?sequence=1&isAllowed=y (accessed on 14 December 2021).
  43. Draper, N.R.; Smith, H. Applied Regression Analysis; John Wiley & Sons: Hoboken, NJ, USA, 1998; Volume 326. [Google Scholar]
  44. Alvarado, G.; López, M.; Vargas, M.; Pacheco, A.; Rodríguez, F. Multi-Environment Trial Analysis with R. Version 6.04”, hdl11529/10201, CIMMYT. Res. Data Softw. Repos. Netw. 2015. Available online: https://data.cimmyt.org/dataset.xhtml?persistentId=hdl:11529/10201 (accessed on 1 November 2021).
  45. Peterson, B.G.; Carl, P.; Boudt, K.; Bennett, R.; Ulrich, J.; Zivot, E.; Cornilly, D.; Hung, E.; Lestel, M.; Balkissoon, K. Econometric Tools for Performance and Risk Analysis. R Packag. ‘PerformanceAnalytics’ Version 2019, 153. [Google Scholar]
  46. CIMMYT. Laboratory Protocols: CIMMYT Applied Molecular Genetics Laboratory, 3rd ed.; CIMMYT: México-Veracruz, Mexico, 2005. [Google Scholar]
  47. Glaubitz, A.J.; Harriman, J.; Casstevens, T. TASSEL 3.0 Genotyping by Sequencing (GBS) Pipeline Documentation. Pipeline Doc. 2012, 1–20. Available online: https://biohpc.cornell.edu/lab/doc/TasselPipelineGBS20120215.pdf (accessed on 1 November 2021).
  48. Wang, S.-B.; Feng, J.-Y.; Ren, W.-L.; Huang, B.; Zhou, L.; Wen, Y.-J.; Zhang, J.; Dunwell, J.M.; Xu, S.; Zhang, Y.-M. Improving Power and Accuracy of Genome-Wide Association Studies via a Multi-Locus Mixed Linear Model Methodology. Sci. Rep. 2016, 6, 1–10. [Google Scholar] [CrossRef] [Green Version]
  49. Stich, B.; Möhring, J.; Piepho, H.P.; Heckenberger, M.; Buckler, E.S.; Melchinger, A.E. Comparison of Mixed-Model Approaches for Association Mapping. Genetics 2008, 178, 1745–1754. [Google Scholar] [CrossRef] [PubMed] [Green Version]
  50. Bradbury, P.J.; Zhang, Z.; Kroon, D.E.; Casstevens, T.M.; Ramdoss, Y.; Buckler, E.S. TASSEL: Software for Association Mapping of Complex Traits in Diverse Samples. Bioinformatics 2007, 23, 2633–2635. [Google Scholar] [CrossRef] [PubMed]
  51. Remington, D.L.; Thornsberry, J.M.; Matsuoka, Y.; Wilson, L.M.; Whitt, S.R.; Doebley, J.; Kresovich, S.; Goodman, M.M.; Buckler IV, E.S. Structure of Linkage Disequilibrium and Phenotypic Associations in the Maize Genome. Proc. Natl. Acad. Sci. USA 2001, 98, 11479–11484. [Google Scholar] [CrossRef] [Green Version]
  52. Tang, Y.; Liu, X.; Wang, J.; Li, M.; Wang, Q.; Tian, F.; Su, Z.; Pan, Y.; Liu, D.; Lipka, A.E.; et al. GAPIT Version 2: An Enhanced Integrated Tool for Genomic Association and Prediction. Plant Genome 2016, 9. [Google Scholar] [CrossRef] [PubMed] [Green Version]
  53. Turner, S.D. Qqman: An R Package for Visualizing GWAS Results Using QQ and Manhattan Plots. J. Open Source Software 2014, 3, 5165. [Google Scholar]
  54. Woodhouse, M.R.; Cannon, E.K.; Portwood, J.L.; Harper, L.C.; Gardiner, J.M.; Schaeffer, M.L.; Andorf, C.M. A Pan-Genomic Approach to Genome Databases Using Maize as a Model System. BMC Plant Biol. 2021, 21, 385. [Google Scholar] [CrossRef] [PubMed]
  55. Zhao, Y.; Gowda, M.; Liu, W.; Würschum, T.; Maurer, H.P.; Longin, F.H.; Ranc, N.; Reif, J.C. Accuracy of Genomic Selection in European Maize Elite Breeding Populations. Theor. Appl. Genet. 2012, 124, 769–776. [Google Scholar] [CrossRef] [PubMed]
  56. Dekkers, J.C.M. Prediction of Response to Marker-Assisted and Genomic Selection Using Selection Index Theory. Clin. Electrophysiol. 2007, 124, 331–341. [Google Scholar] [CrossRef]
  57. Myles, S.; Peiffer, J.; Brown, P.J.; Ersoz, E.S.; Zhang, Z.; Costich, D.E.; Buckler, E. Association Mapping: Critical Considerations Shift from Genotyping to Experimental Design. Plant Cell 2009, 21, 2194–2202. [Google Scholar] [CrossRef] [Green Version]
  58. Fraval, S.; Hammond, J.; Bogard, J.R.; Ng, M.; van Etten, J.; Herrero, M.; Oosting, S.J.; de Boer, I.J.; Lannerstad, M.; Teufel, N.; et al. Food Access Deficiencies in Sub-Saharan Africa: Prevalence and Implications for Agricultural Interventions. Front. Sustain. Food Syst. 2019, 3, 104. [Google Scholar] [CrossRef] [Green Version]
  59. FAO. Multi-Stakeholder Regional Workshop in Africa: Innovations for Smallholder Farmers for Sustainable Management of Fall Armyworm; FAO: Praia, Cabo Verde, 2019. [Google Scholar]
  60. Nabity, P.D.; Zavala, J.A.; DeLucia, E.H. Indirect Suppression of Photosynthesis on Individual Leaves by Arthropod Herbivory. Ann. Bot. 2009, 103, 655–663. [Google Scholar] [CrossRef] [Green Version]
  61. Liu, N.; Du, Y.; Warburton, M.L.; Xiao, Y.; Yan, J. Phenotypic Plasticity Contributes to Maize Adaptation and Heterosis. Mol. Biol. Evol. 2021, 38, 1262–1275. [Google Scholar] [CrossRef] [PubMed]
  62. Kang, M.S.; Aggarwal, V.D.; Chirwa, R.M. Adaptability and Stability of Bean Cultivars as Determined via Yield-Stability Statistic and GGE Biplot Analysis. J. Crop. Improv. 2006, 15, 97–120. [Google Scholar] [CrossRef]
  63. Manolio, T.A.; Collins, F.S.; Cox, N.J.; Goldstein, D.B.; Hindorff, L.A.; Hunter, D.J.; McCarthy, M.I.; Ramos, E.M.; Cardon, L.R.; Chakravarti, A.; et al. Finding the Missing Heritability of Complex Diseases. Nature 2009, 461, 747–753. [Google Scholar] [CrossRef] [PubMed] [Green Version]
  64. Park, J.H.; Gail, M.H.; Weinberg, C.R.; Carroll, R.J.; Chung, C.C.; Wang, Z.; Chanock, S.J.; Fraumeni, J.F.; Chatterjee, N. Distribution of Allele Frequencies and Effect Sizes and Their Interrelationships for Common Genetic Susceptibility Variants. Proc. Natl. Acad. Sci. USA 2011, 108, 18026–18031. [Google Scholar] [CrossRef] [Green Version]
  65. Akinwale, M.G.; Gregorio, G.; Nwilene, F.; Akinyele, B.O.; Ogunbayo, S.A.; Odiyi, A.C. Heritability and Correlation Coefficient Analysis for Yield and Its Components in Rice (Oryza Sativa, L.). Afr. J. plant Sci. 2011, 5, 207–212. [Google Scholar]
  66. Alqudah, A.M.; Sallam, A.; Baenziger, P.S.; Börner, A. GWAS: Fast-Forwarding Gene Identification and Characterization in Temperate Cereals: Lessons from Barley—A Review. J. Adv. Res. 2020, 22, 119–135. [Google Scholar] [CrossRef]
  67. Flint-Garcia, S.A.; Thornsberry, J.M.; Edward, S.B., IV. Structure of Linkage Disequilibrium in Plants. Annu. Rev. Plant Biol. 2003, 54, 357–374. [Google Scholar] [CrossRef] [Green Version]
  68. Badji, A.; Otim, M.; Machida, L.; Odong, T.; Kwemoi, D.B.; Okii, D.; Agbahoungba, S.; Mwila, N.; Kumi, F.; Ibanda, A.; et al. Maize Combined Insect Resistance Genomic Regions and Their Co-Localization with Cell Wall Constituents Revealed by Tissue-Specific QTL Meta-Analyses. Front. Plant Sci. 2018, 9, 895. [Google Scholar] [CrossRef]
  69. Kibe, M.; Nyaga, C.; Nair, S.K.; Beyene, Y.; Das, B.; Suresh, L.M.; Bright, J.M.; Makumbi, D.; Kinyua, J.; Olsen, M.S.; et al. Combination of Linkage Mapping, GWAS, and GP to Dissect the Genetic Basis of Common Rust Resistance in Tropical Maize Germplasm. Int. J. Mol. Sci. 2020, 21, 6518. [Google Scholar] [CrossRef]
  70. Lu, Y.; Yan, J.; Guimarães, C.T.; Taba, S.; Hao, Z.; Gao, S.; Chen, S.; Li, J.; Zhang, S.; Vivek, B.S.; et al. Molecular Characterization of Global Maize Breeding Germplasm Based on Genome-Wide Single Nucleotide Polymorphisms. Theor. Appl. Genet. 2009, 120, 93–115. [Google Scholar] [CrossRef] [PubMed]
  71. Munyiri, S.W.; Mugo, S.N. Quantitative Trait Loci for Resistance to Spotted and African Maize Stem Borers (Chilo partellus and Busseola fusca) in a Tropical Maize (Zea mays L.) Population. Afr. J. Biotechnol. 2017, 16, 1579–1589. [Google Scholar] [CrossRef] [Green Version]
  72. Womack, E.D.; Williams, W.P.; Smith, J.S.; Warburton, M.L.; Bhattramakki, D.; Hesler, L. Mapping Quantitative Trait Loci for Resistance to Fall Armyworm (Lepidoptera: Noctuidae) Leaf-Feeding Damage in Maize Inbred Mp705. J. Econ. Entomol. 2020, 113, 956–963. [Google Scholar] [CrossRef] [PubMed] [Green Version]
  73. Womack, E.D.; Erika, D.; Warburton, M.L.; Williams, W.P. Mapping of quantitative trait loci for resistance to fall armyworm and southwestern corn borer leaf-feeding damage in maize. Crop. Sci. 2018, 58, 529–539. [Google Scholar] [CrossRef]
  74. Navarro, J.A.R.; Willcox, M.; Burgueño, J.; Romay, C.; Swarts, K.; Trachsel, S.; Preciado, E.; Terron, A.; Delgado, H.V.; Vidal, V. A Study of Allelic Diversity Underlying Flowering-Time Adaptation in Maize Landraces. Nat. Genet. 2017, 49, 476–480. [Google Scholar] [CrossRef]
  75. Whitt, S.R.; Wilson, L.M.; Tenaillon, M.I.; Gaut, B.S.; Buckler, E.S., IV. Genetic Diversity and Selection in the Maize Starch Pathway. Proc. Natl. Acad. Sci. USA 2002, 99, 12959–12962. [Google Scholar] [CrossRef] [Green Version]
  76. De Lange, E.S.; Balmer, D.; Mauch-Mani, B.; Turlings, T.C.J. Insect and Pathogen Attack and Resistance in Maize and Its Wild Ancestors, the Teosintes. New Phytol. 2014, 204, 329–341. [Google Scholar] [CrossRef]
  77. Afzal, A.J.; Wood, A.J.; Lightfoot, D.A. Plant Receptor-Like Serine Threonine Kinases: Roles in Signaling and Plant Defense. APS 2008, 21, 507–517. [Google Scholar] [CrossRef] [Green Version]
  78. Palmer, N.A.; Basu, S.; Heng-Moss, T.; Bradshaw, J.D.; Sarath, G.; Louis, J. Fall Armyworm (Spodoptera frugiperda Smith) Feeding Elicits Differential Defense Responses in Upland and Lowland Switchgrass. PLoS ONE 2019, 14, 1–16. [Google Scholar] [CrossRef]
  79. Attaran, E.; Major, I.T.; Cruz, J.A.; Rosa, B.A.; Koo, A.J.K.; Chen, J.; Kramer, D.M.; He, S.Y.; Howe, G.A. Temporal Dynamics of Growth and Photosynthesis Suppression in Response to Jasmonate Signaling 1. Plant Physiol. 2014, 165, 1302–1314. [Google Scholar] [CrossRef] [Green Version]
  80. Beyene, Y.; Gowda, M.; Olsen, M.; Robbins, K.R. Empirical Comparison of Tropical Maize Hybrids Selected Through Genomic and Phenotypic Selections. Front. Plant Sci. 2019, 10, 1–11. [Google Scholar] [CrossRef] [PubMed] [Green Version]
  81. Gowda, M.; Makumbi, D.; Das, B.; Nyaga, C.; Kosgei, T.; Crossa, J.; Beyene, Y.; Montesinos-López, O.A.; Olsen, M.S.; Prasanna, B.M. Genetic Dissection of Striga Hermonthica (Del.) Benth. Resistance via Genome-Wide Association and Genomic Prediction in Tropical Maize Germplasm. Theor. Appl. Genet. 2021, 134, 941–958. [Google Scholar] [CrossRef] [PubMed]
  82. Sitonik, C.; Yoseph, L.M.S.; Michael, B.; Dan, S.O.; Kiplagat, M. Genetic Architecture of Maize Chlorotic Mottle Virus and Maize Lethal Necrosis through GWAS, Linkage Analysis and Genomic Prediction in Tropical Maize Germplasm. Theor. Appl. Genet. 2019, 132, 2381–2399. [Google Scholar] [CrossRef] [PubMed] [Green Version]
  83. Gowda, M.; Das, B.; Makumbi, D.; Babu, R.; Semagn, K.; Prasanna, B.M. Genome—Wide Association and Genomic Prediction of Resistance to Maize Lethal Necrosis Disease in Tropical Maize Germplasm. Theor. Appl. Genet. 2015, 128, 1957–1968. [Google Scholar] [CrossRef] [PubMed] [Green Version]
Figure 1. Frequency distribution of means for foliar damage scores 7, 14, and 21 days after artificial infestation (foliar damage score 1, 2, and 3), ear damage, ear rot (%), and grain yield (t/ha).
Genes 13 00251 g001
Figure 2. Pairwise Pearson correlation analysis for six traits associated with FAW resistance. LD1, LD2, LD3: foliar damage rating 7, 14, and 21 days after artificial FAW infestation, respectively; Eardam—ear damage, ER—ear rot, GY—grain yield.
Genes 13 00251 g002
Figure 3. Population structure analyses of GWAS panel with first three principal components plot (A) based on the observed genotype data and genome wide linkage disequilibrium (LD) plot (B). Horizontal blue line in LD plot represents the 95th percentile of the distribution of unlinked r2 while the inner fitted trend line is the non-linear logarithmic regression curve of r2 on genetic distance.
Genes 13 00251 g003
Figure 4. Manhattan plots and associated Q–Q plots derived from the GWAS analysis of six traits: (A) leaf damage score 1, (B) leaf damage score 2, (C) leaf damage score 3, (D) ear damage, (E) ear rot, and (F) grain yield. On the Manhattan plots, the x-axis shows SNP locations along the 10 chromosomes while the y-axis shows the level of statistical significance as measured by the negative log of the corresponding p-value for each SNP. Genome-wide significance level for marker-trait associations was plotted as the horizontal dotted line on the Manhattan plots. The y-axis on the Q–Q plots represents the observed association p-values while the x-axis represents the expected uniform distribution of p values.
Genes 13 00251 g004
Figure 5. Box plots showing the phenotypic values of the different allele classes with combination of two SNPs in boxplots A with DT1_34838367 (CC/TT = R1R1/r1r1) and DT2_192225273 (AA/CC -R2R2/r2r2) and boxplots B with DT5_86480332 (AA/TT = R1R1/r1r1) and DT6_108383751 (AA/CC = R2R2/r2r2). R for resistance and r is for susceptible to FAW. These SNPs were identified for ear damage score and showed their effect also on foliar damage and grain yield under FAW infestation. The black horizontal lines in the middle of the boxes are the median values for the trait performance in the respective allele classes.
Genes 13 00251 g005
Figure 6. Box plots showing genomic prediction accuracy for six traits evaluated under artificial FAW infestations. LD1, LD2, LD3: foliar damage rating at 7, 14, and 21 days after artificial FAW infestation, respectively; ED—ear damage, ER—ear rot, GY—grain yield.
Genes 13 00251 g006
Table 1. Best performing 15 lines evaluated under artificial infestation of FAW in net houses for two environments.
GenotypeLD1LD2LD3EardamER (%)GY (tons/ha)
CKIR040052.854.834.821.983.166.54
CKDHL19208042.935.414.942.094.146.31
CKDHL19222862.645.094.942.1111.185.99
CKDHL19208772.334.834.452.165.965.95
CKDHL19237593.045.564.741.923.425.84
CKDHL19217552.625.485.492.269.675.80
CKDHL19222452.625.064.892.035.555.63
CKDHL19224282.605.435.022.265.725.57
CKDHL19222662.875.244.982.035.875.57
CKDHL19224672.665.115.222.6813.535.57
CKDHL19207152.474.934.822.014.345.54
CKDHL19205803.085.515.112.218.325.54
CKDHL19243952.775.394.962.9315.315.45
CKDHL19222583.435.814.532.365.865.44
CKDHL19243912.615.275.092.285.155.40
LD1, LD2, LD3 = foliar damage rating at 7, 14, and 21 days after artificial FAW infestation, respectively; Eardam = ear damage, ER= ear rot, GY= grain yield.
Table 2. Genetic parameters for FAW GWAS panel evaluated under artificial infestation of FAW in net houses for two environments.
TraitMeanσ2Gσ2GxEσ2eh2LSD5%CV (%)
LD12.780.06 **0.04 **0.100.580.427.71
LD25.320.09 **0.05 **0.350.450.656.21
LD35.070.08 *0.18 **0.180.380.595.91
Eardam2.280.14 **0.14 **0.190.550.6213.82
ER7.2614.78 **16.19 **21.970.526.6346.44
GY3.450.97 **0.42 **1.540.621.7425.69
σ2G = Genotypic variance; σ2e = error variance; σ2GxE = genotype by environment interaction; h2 = broad-sense heritability; LSD = least square difference; CV = coefficient of variation; LD1, LD2, LD3 = foliar damage rating at 7,14, and 21 days after artificial FAW infestation, respectively; Eardam = ear damage, ER= ear rot, GY= grain yield. *, ** Significant at p < 0.05 and p < 0.01 level, respectively.
Table 3. Significantly associated single-nucleotide polymorphisms (SNPs) along with the predicted gene model and their function detected by genome-wide association studies in CIMMYT association mapping panel for FAW resistance-associated traits.
SNPChrMLM-p ValueMAFAllele EffectPutative Candidate GenesPredicted Function of Candidate Gene
Foliar damage 1
DT1_8615175811.32 × 10−050.34−0.04No hit-
DT3_18978777835.43 × 10−050.17−0.06GRMZM2G024992Uncharacterized
DT3_362738831.63 × 10−040.310.05GRMZM2G045259ATP binding, protein serine threonine kinase activity
DT4_24065742349.17 × 10−050.170.06GRMZM2G124151Transferring glycosyl groups
DT5_19388355158.48 × 10−070.110.08No hit-
DT5_17281847751.67 × 10−040.40−0.04GRMZM2G038536Base excision repair (BER) pathway, by catalyzing the ADP-ribosylation of acceptor proteins involved in chromatin architecture and DNA metabolism.
DT8_17436518388.22 × 10−050.46−0.05GRMZM2G370044Uncharacterized
DT9_10218731192.62 × 10−080.44−0.06GRMZMG036921Transfer RNA intron lyase
DT9_678962091.16 × 10−060.39−0.02GRMZM2G017257Chloroplast accumulation movement, ATP-dependent microtubule motor activity
Foliar damage 2
DT1_2600381611.49 × 10−040.430.04GRMZM2G015804Carbohydrate metabolic process
DT2_20019750825.45 × 10−060.490.04GRMZM2G703307Integral component of membrane
DT3_20354958133.39 × 10−050.14−0.06GRMZM2G078756Phenylalanyl-tRNA aminoacylation
DT4_24132302448.75 × 10−060.480.05GRMZM2G051004NAD binding
DT4_2463957645.93 × 10−050.39−0.04GRMZM2G088169Cell fate determination
DT5_199659657.65 × 10−070.45−0.05GRMZM2G415498DNA-mediated transposition,
DT6_16605889662.12 × 10−050.27−0.04GRMZM2G094892Regulation of long-day photoperiodism, flowering
DT7_477370171.63 × 10−050.390.04GRMZM2G480002Uncharacterized
DT7_10861558672.16 × 10−040.200.06No hit-
DT8_16542944182.36 × 10−050.210.06GRMZM2G016802Defense response
DT9_9687582198.88 × 10−050.400.04GRMZM2GO48919Uncharacterized
Foliar damage 3
DT1_572291718.05 × 10−050.300.07GRMZM2G319022Uncharacterized
DT1_608600711.40 × 10−040.29−0.05GRMZM2G341918Uncharacterized
DT2_15185278527.22 × 10−060.430.06No hit-
DT4_16721839342.04 × 10−050.34−0.07GRMZM2G168369Uncharacterized
DT7_2778765274.50 × 10−060.400.06GRMZM2G097719Uncharacterized
DT7_16753674971.75 × 10−050.23−0.08GRMZM2G017145Protein dimerization activity
DT8_15114921285.24 × 10−060.39−0.07GRMZM2G043117Hydrotropism
DT8_16527011087.42 × 10−050.326.50GRMZM2G114046Cellular macromolecule, metabolic process, integral component of membrane
Ear damage
DT1_3483836711.90 × 10−050.36−0.12No hit-
DT1_24586446813.17 × 10−050.49−0.12No hit-
DT2_1654660021.95 × 10−060.450.00GRMZM2G042756Dehydration responsive element binding protein, DNA-binding transcription factor activity
DT2_22074283121.27 × 10−050.28−0.13GRMZM2G077256Uncharacterized
DT2_19222527322.31 × 10−050.10−0.14No hit-
DT3_11739463135.07 × 10−080.100.20No hit-
DT4_1295408949.87× 10−080.340.16GRMZM2G377115Chlorophyll catabolic process, response to water deprivation
DT4_20243431747.31 × 10−050.41−0.08No hit-
DT5_17401842852.99 × 10−050.270.12No hit-
DT5_8648033258.55 × 10−050.22−0.09No hit-
DT6_15977087964.30 × 10−070.110.12No hit-
DT6_10838375162.65 × 10−040.440.11GRMZM5G809695Regulation of cell growth
DT10_138678949101.71 × 10−040.18−0.09No hit-
Ear rot
DT1_3243989415.56 × 10−050.080.15No hit-
DT2_6433280321.53 × 10−050.45−0.87GRMZM2G373828
DT2_21020583627.53 × 10−050.19−1.06GRMZM2G102138
DT3_5376883235.82 × 10−050.20−0.65No hit-
DT4_480422743.62 × 10−090.331.00AC214255.3_FG008
DT5_8648033257.01 × 10−080.221.37No hit-
DT5_1586921952.93 × 10−050.151.10No hit-
DT6_9974872061.26 × 10−040.17−0.75AC215906.3_FG001
DT7_14285700071.46 × 10−040.220.83GRMZM2G074472
DT9_2321098097.53 × 10−060.360.63No hit-
DT9_13078843392.17 × 10−040.470.39GRMZM2G043295UDP-glycosyltransferase activity
DT10_8711707104.37 × 10−110.15−1.76GRMZM2G167999Transducin/WD40 repeat-like superfamily protein
DT10_140174620108.46 × 10−060.201.01GRMZM5G887345PF00179: Ubiquitin-conjugating enzyme
Grain yield
DT4_6015435544.28 × 10−040.23−0.26No hit-
DT10_145757365102.46 × 10−040.400.25GRMZM2G0101264Uncharacterized
DT10_141438482104.28 × 10−040.42−0.30No hit -
SNP = Single nucleotide polymorphism, Chr = chromosome, MAF = minor allele frequency, p-value = adjusted p-values following a false discovery rate control procedure, Effect = allelic effect estimates per SNP. Code names for markers, e.g., DT4_60154355 indicates a marker in chromosome 4 at position 60154355 base pairs (using B73 maize reference genome version 3); (-) = unknown.
Publisher’s Note: MDPI stays neutral with regard to jurisdictional claims in published maps and institutional affiliations.

