
Additive and Dominance Genomic Analysis for Litter Size in Purebred and Crossbred Iberian Pigs

 , , ,
, , ,
Abstract
:1. Introduction
2. Materials and Methods
3. Results and Discussion
4. Conclusions
Supplementary Materials
Author Contributions
Funding
Institutional Review Board Statement
Informed Consent Statement
Data Availability Statement
Acknowledgments
Conflicts of Interest
References
- Serra, X.; Gil, F.; Pérez-Enciso, M.; Oliver, M.A.; Vázquez, J.M.; Gispert, M.; Díaz, I.; Moreno, F.; Latorre, R.; Noguera, J.L. A comparison of carcass, meat quality and histochemical characteristics of Iberian (Guadyerbas line) and Landrace pigs. Livest. Prod. Sci. 1998, 56, 215–223. [Google Scholar] [CrossRef]
- Serrano, M.P.; Valencia, D.G.; Nieto, M.; Lázaro, R.; Mateos, G.G. Influence of sex and terminal sire line on performance and carcass and meat quality of Iberian pigs reared under intensive production systems. Meat Sci. 2008, 78, 420–428. [Google Scholar] [CrossRef]
- Ministry of Agriculture, Food and Environment. Boletín Oficial del Estado Real Decreto 4/2014 de 10 enero, por el que se aprueba la norma de calidad para la carne, el jamón, la paleta y la caña de lómo ibérico; Ministry of Agriculture, Food and Environment: Madrid, Spain, 2014; pp. 1569–1585.
- Silio, L.; Rodriguez, M.C.; Rodrigañez, J.; Toro, M.A. La selección de cerdos ibéricos. In Porcino Ibérico: Aspectos Claves; Buxade, C., Daza, A., Eds.; Mundi-Press: Madrid, Spain, 2001; pp. 125–149. [Google Scholar]
- Noguera, J.L.; Ibáñez-Escriche, N.; Casellas, J.; Rosas, J.P.; Varona, L. Genetic parameters and direct, maternal and heterosis effects on litter size in a diallel cross among three commercial varieties of Iberian pig. Animal 2019, 13, 2765–2772. [Google Scholar] [CrossRef] [PubMed]
- Comstock, R.E.; Robinson, H.F.; Harvey, P.H. A Breeding Procedure Designed to Make Maximum Use of Both General and Specific Combining Ability. Agron. J. 1949, 41, 360–367. [Google Scholar] [CrossRef]
- Wientjes, Y.C.J.; Calus, M.P.L. BOARD INVITED REVIEW: The purebred-crossbred correlation in pigs: A review of theory, estimates, and implications. J. Anim. Sci. 2017, 95, 3467–3478. [Google Scholar] [CrossRef]
- Vitezica, Z.G.; Varona, L.; Elsen, J.-M.; Misztal, I.; Herring, W.; Legarra, A. Genomic BLUP including additive and dominant variation in purebreds and F1 crossbreds, with an application in pigs. Genet. Sel. Evol. 2016, 48, 6. [Google Scholar] [CrossRef] [PubMed] [Green Version]
- Wang, H.; Misztal, I.; Aguilar, I.; Legarra, A.; Muir, W.M. Genome-wide association mapping including phenotypes from relatives without genotypes. Genet. Res. 2012, 94, 73–83. [Google Scholar] [CrossRef] [PubMed] [Green Version]
- R Core Team. R: A Language and Environment for Statistical Computing; R Foundation for Statistical Computing: Vienna, Austria, 2021; Available online: http://www.R-project.org/ (accessed on 1 November 2021).
- Patterson, H.D.; Thompson, R. Recovery of Inter-Block Information when Block Sizes are Unequal. Biometrika 1971, 58, 545–554. [Google Scholar] [CrossRef]
- Lourenco, D.; Legarra, A.; Tsuruta, S.; Masuda, Y.; Aguilar, I.; Misztal, I. Single-step genomic evaluations from theory to practice: Using snp chips and sequence data in blupf90. Genes 2020, 11, 790. [Google Scholar] [CrossRef]
- Bidanel, J.P. Biology and genetics of reproduction. In The Genetics of the Pig; CABI: Wallingford, UK, 2011; pp. 218–241. [Google Scholar]
- Putz, A.M.; Tiezzi, F.; Maltecca, C.; Gray, K.A.; Knauer, M.T. Variance component estimates for alternative litter size traits in swine. J. Anim. Sci. 2015, 93, 5153–5163. [Google Scholar] [CrossRef]
- Ogawa, S.; Konta, A.; Kimata, M.; Ishii, K.; Uemoto, Y.; Satoh, M. Estimation of genetic parameters for farrowing traits in purebred Landrace and Large White pigs. Anim. Sci. J. 2019, 90, 23–28. [Google Scholar] [CrossRef] [Green Version]
- Fernández, A.; Rodrigáñez, J.; Zuzúarregui, J.; Rodríguez, M.C.; Silió, L. Genetic parameters for litter size and weight at different parities in Iberian pigs. Span. J. Agric. Res. 2008, 6, 98–106. [Google Scholar] [CrossRef] [Green Version]
- García-Casco, J.M.; Fernández, A.; Rodríguez, M.C.; Silió, L. Heterosis for litter size and growth in crosses of four strains of Iberian pig. Livest. Sci. 2012, 147, 1–8. [Google Scholar] [CrossRef]
- Culbertson, M.S.; Mabry, J.W.; Misztal, I.; Gengler, N.; Bertrand, J.K.; Varona, L. Estimation of Dominance Variance in Purebred Yorkshire Swine. J. Anim. Sci. 1998, 76, 448–451. [Google Scholar] [CrossRef]
- Tusell, L.; Gilbert, H.; Vitezica, Z.G.; Mercat, M.J.; Legarra, A.; Larzul, C. Dissecting total genetic variance into additive and dominance components of purebred and crossbred pig traits. Animal 2019, 13, 2429–2439. [Google Scholar] [CrossRef] [PubMed]
- Xiang, T.; Christensen, O.F.; Vitezica, Z.G.; Legarra, A. Genomic evaluation by including dominance effects and inbreeding depression for purebred and crossbred performance with an application in pigs. Genet. Sel. Evol. 2016, 48, 92. [Google Scholar] [CrossRef] [PubMed] [Green Version]
- Quadro, L.; Giordano, E.; Costabile, B.K.; Nargis, T.; Iqbal, J.; Kim, Y.; Wassef, L.; Hussain, M.M. Interplay between β-carotene and lipoprotein metabolism at the maternal-fetal barrier. Biochim. Biophys. Acta—Mol. Cell Biol. Lipids 2020, 1865, 158591. [Google Scholar] [CrossRef]
- Wassef, L.; Spiegler, E.; Quadro, L. Embryonic phenotype, β-carotene and retinoid metabolism upon maternal supplementation of β-carotene in a mouse model of severe vitamin A deficiency. Arch. Biochem. Biophys. 2013, 539, 223–229. [Google Scholar] [CrossRef] [Green Version]
- Leung, K.Y.; De Castro, S.C.P.; Galea, G.L.; Copp, A.J.; Greene, N.D.E. Glycine Cleavage System H Protein Is Essential for Embryonic Viability, Implying Additional Function Beyond the Glycine Cleavage System. Front. Genet. 2021, 12, 625120. [Google Scholar] [CrossRef] [PubMed]
- Kinameri, E.; Inoue, T.; Aruga, J.; Imayoshi, I.; Kageyama, R.; Shimogori, T.; Moore, A.W. Prdm proto-oncogene transcription factor family expression and interaction with the Notch-Hes pathway in mouse neurogenesis. PLoS ONE 2008, 3, e3859. [Google Scholar] [CrossRef] [Green Version]
- Haub, O.; Goldfarb, M. Expression of FGF5 gene in mouse embryo. Development 1991, 406, 397–406. [Google Scholar] [CrossRef]
- Beer, H.D.; Bittner, M.; Niklaus, G.; Munding, C.; Max, N.; Goppelt, A.; Werner, S. The fibroblast growth factor binding protein is a novel interaction partner of FGF-7, FGF-10 and FGF-22 and regulates FGF activity: Implications for epithelial repair. Oncogene 2005, 24, 5269–5277. [Google Scholar] [CrossRef] [PubMed] [Green Version]
- Segura, I.; Essmann, C.L.; Weinges, S.; Acker-Palmer, A. Grb4 and GIT1 transduce ephrinB reverse signals modulating spine morphogenesis and synapse formation. Nat. Neurosci. 2007, 10, 301–310. [Google Scholar] [CrossRef] [PubMed]
- Kim, Y.D.; Lee, J.Y.; Oh, K.M.; Araki, M.; Araki, K.; Yamamura, K.I.; Jun, C.D. NSrp70 is a novel nuclear speckle-related protein that modulates alternative pre-mRNA splicing in vivo. Nucleic Acids Res. 2011, 39, 4300–4314. [Google Scholar] [CrossRef] [PubMed] [Green Version]
- Stam, F.J.; MacGillavry, H.D.; Armstrong, N.J.; De Gunst, M.C.M.; Zhang, Y.; Van Kesteren, R.E.; Smit, A.B.; Verhaagen, J. Identification of candidate transcriptional modulators involved in successful regeneration after nerve injury. Eur. J. Neurosci. 2007, 25, 3629–3637. [Google Scholar] [CrossRef] [PubMed]


| Entrepelado | Crossbred | Retinto | |
|---|---|---|---|
| N 1 (NS) 2 | 2030 (306) | 1958 (333) | 1977 (313) |
| NBA 3 | 7.75 ± 1.85 | 8.57 ± 2.27 | 8.07 ± 2.07 |
| TNB 4 | 8.02 ± 1.89 | 8.80 ± 2.29 | 8.33 ± 2.11 |
| Entrepelado | Crossbred | Retinto | |
|---|---|---|---|
| Entrepelado | 0.248 ± 0.161 | 0.259 ± 0.178 | 0.200 ± 0.135 |
| Crossbred | - | 0.546 ± 0.268 | 0.388 ± 0.170 |
| Retinto | - | - | 0.282 ± 0.146 |
| Entrepelado | Crossbred | Retinto | |
|---|---|---|---|
| Entrepelado | 0.177 ± 0.165 | 0.212 ± 0.171 | 0.166 ± 0.152 |
| Crossbred | - | 0.262 ± 0.210 | 0.202 ± 0.179 |
| Retinto | - | - | 0.172 ± 0.199 |
| Variances 1 | Entrepelado | Crossbred | Retinto |
|---|---|---|---|
| 0.191 ± 0.105 | 0.009 ± 0.029 | 0.268 ± 0.120 | |
| 2.810 ± 0.099 | 4.467 ± 0.155 | 3.534 ± 0.128 |
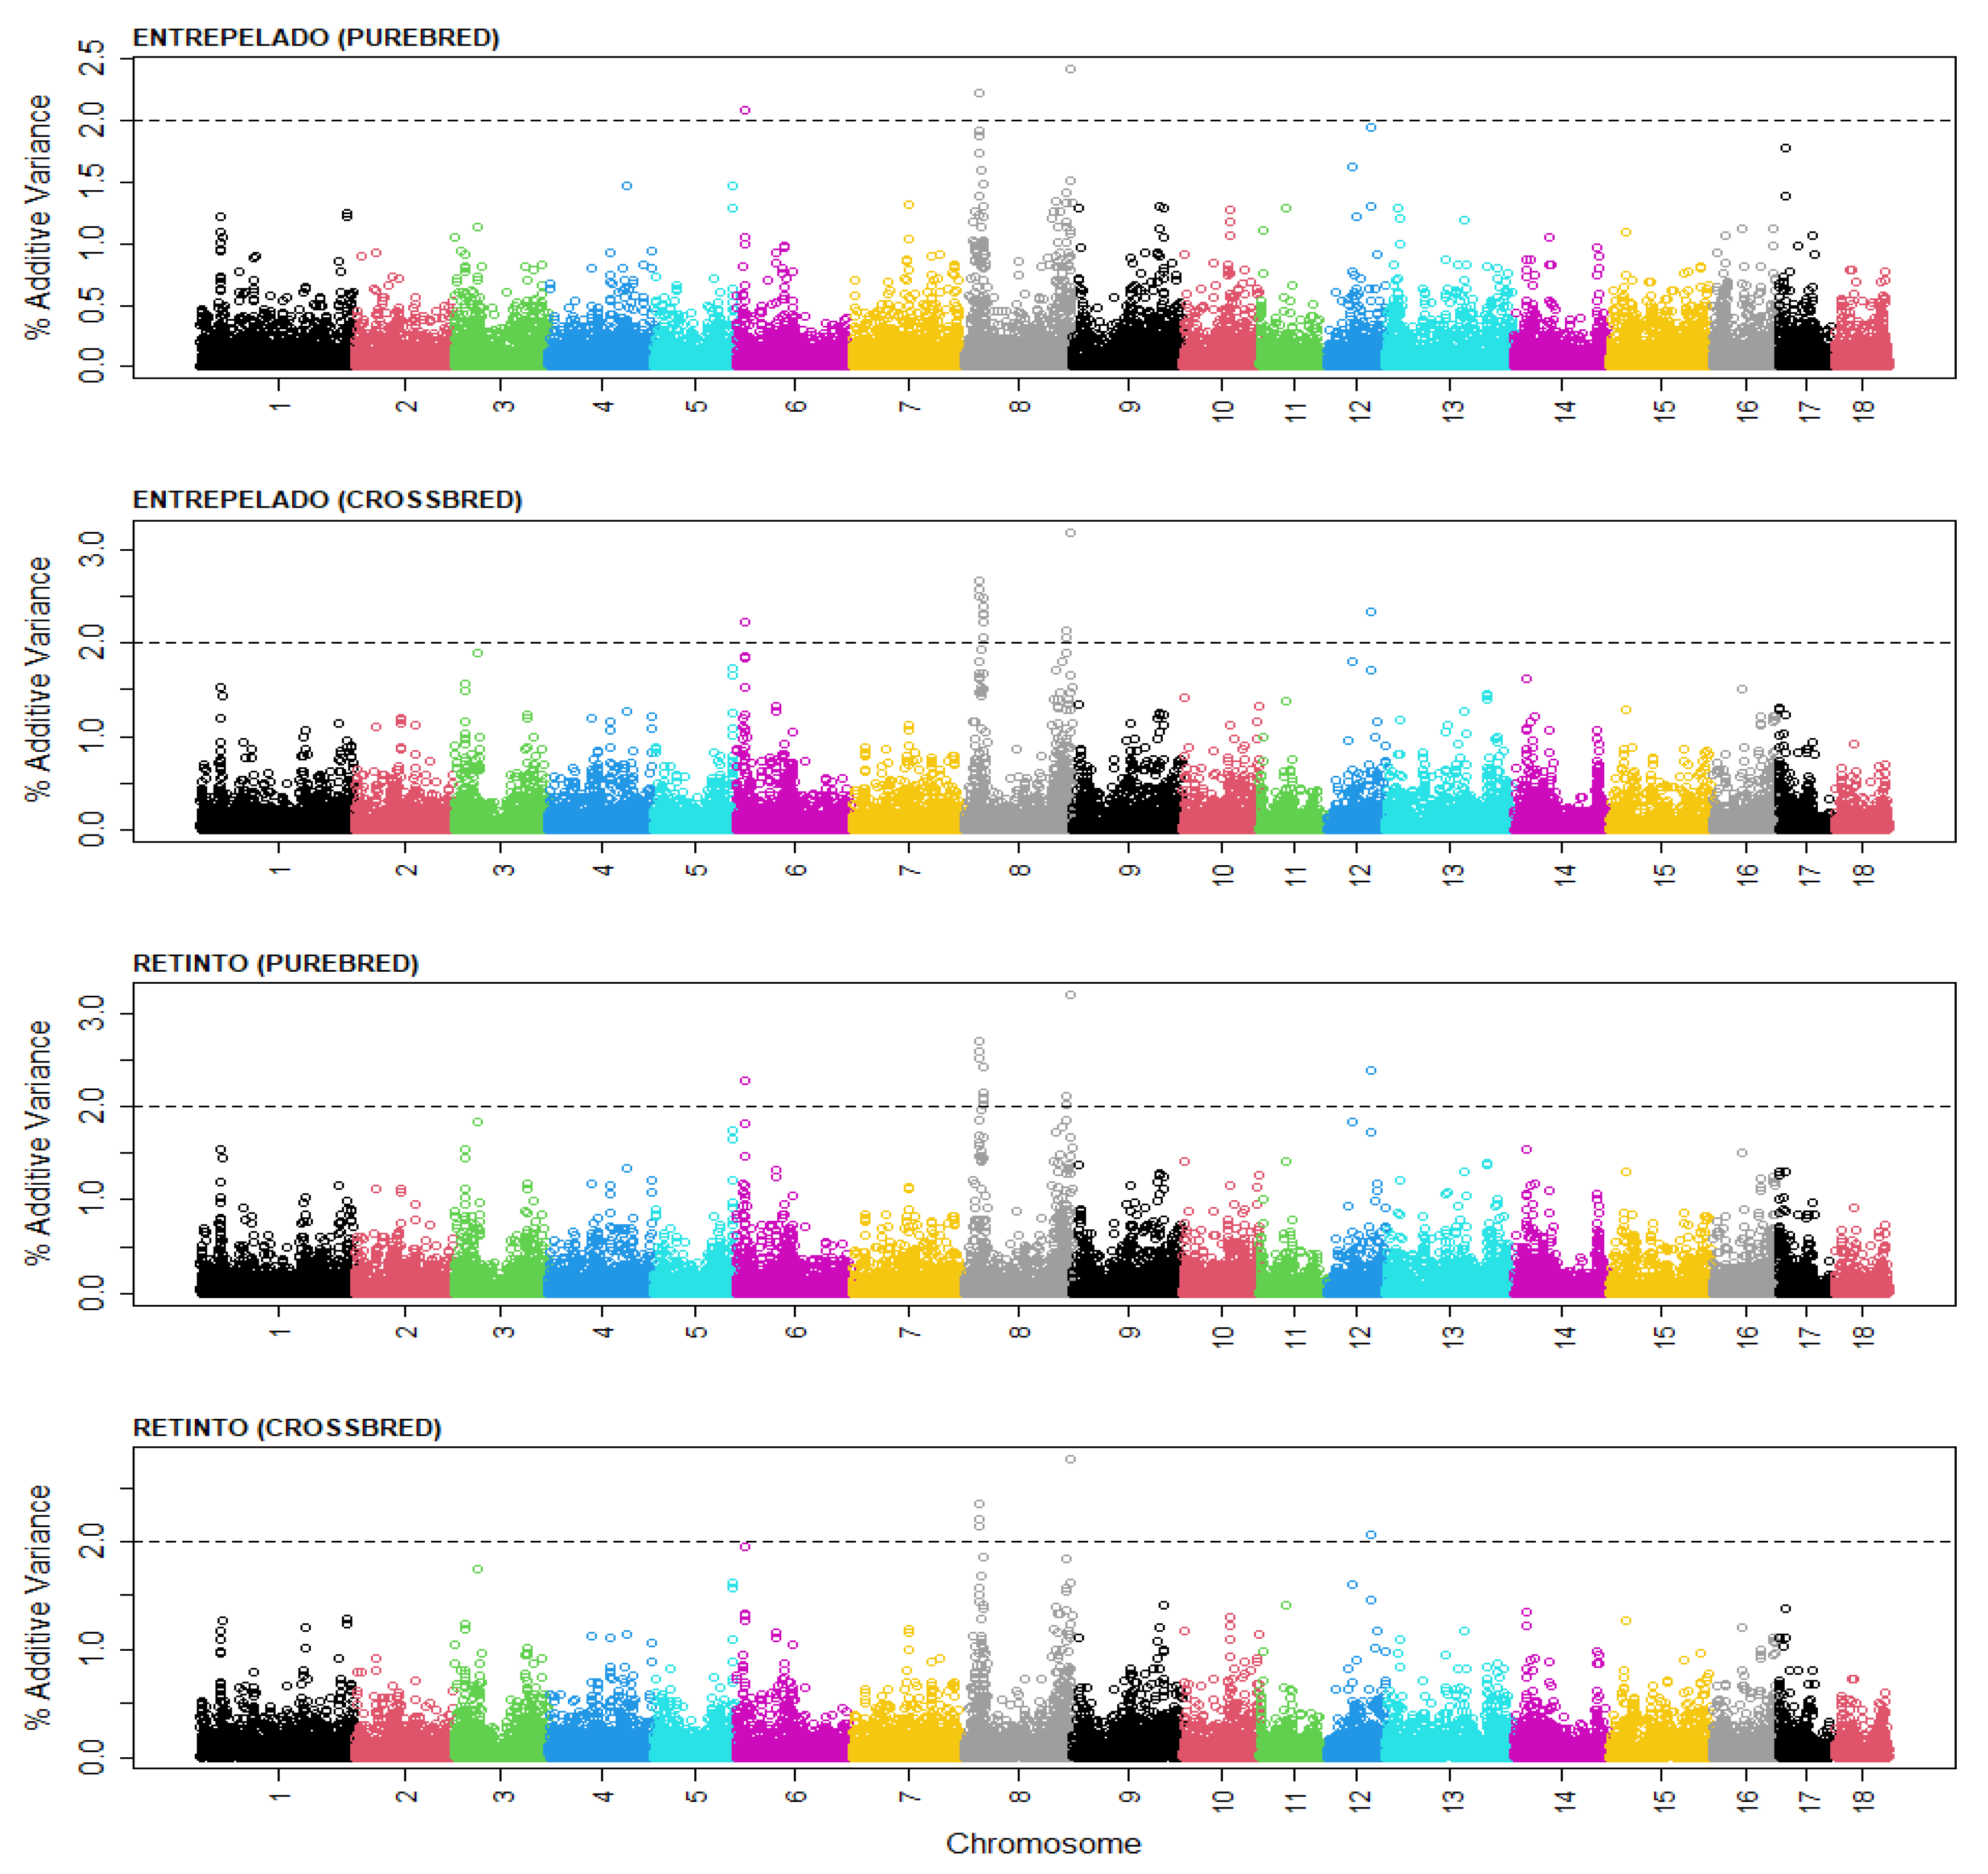
| SNP 1 | SSC 2 | bp 3 | Genes |
|---|---|---|---|
| rs326244568 | 6 | 7,597,405 | BCO1, PKD1L2, GCSH, ATMIN, CENPN, CDYL2, DYNLRB2 |
| rs81401202 | 8 | 11,585,865 | CD38, FGFBP1, PROM1, TAPT1, LDB2 |
| rs81406142 | 8 | 137,540,516 | CFAP299, FGF5, PRDM8, ANTXR2 |
| rs345468811 | 12 | 46,079,417 | TAOK1, ABHD15, TP53I13, GIT1, ANKRD1, CORO6, EFCAB5, NSRP1, SLC6A4, BLMH, TMIGD1, CPD, GOSR1 |
Publisher’s Note: MDPI stays neutral with regard to jurisdictional claims in published maps and institutional affiliations. |
© 2021 by the authors. Licensee MDPI, Basel, Switzerland. This article is an open access article distributed under the terms and conditions of the Creative Commons Attribution (CC BY) license (https://creativecommons.org/licenses/by/4.0/).
Share and Cite
Srihi, H.; Noguera, J.L.; Topayan, V.; Martín de Hijas, M.; Ibañez-Escriche, N.; Casellas, J.; Vázquez-Gómez, M.; Martínez-Castillero, M.; Rosas, J.P.; Varona, L. Additive and Dominance Genomic Analysis for Litter Size in Purebred and Crossbred Iberian Pigs. Genes 2022, 13, 12. https://doi.org/10.3390/genes13010012
Srihi H, Noguera JL, Topayan V, Martín de Hijas M, Ibañez-Escriche N, Casellas J, Vázquez-Gómez M, Martínez-Castillero M, Rosas JP, Varona L. Additive and Dominance Genomic Analysis for Litter Size in Purebred and Crossbred Iberian Pigs. Genes. 2022; 13(1):12. https://doi.org/10.3390/genes13010012
Chicago/Turabian StyleSrihi, Houssemeddine, José Luis Noguera, Victoria Topayan, Melani Martín de Hijas, Noelia Ibañez-Escriche, Joaquim Casellas, Marta Vázquez-Gómez, María Martínez-Castillero, Juan Pablo Rosas, and Luis Varona. 2022. "Additive and Dominance Genomic Analysis for Litter Size in Purebred and Crossbred Iberian Pigs" Genes 13, no. 1: 12. https://doi.org/10.3390/genes13010012