1. Introduction
Single-cell multiomics data analysis is challenging [
1]. There are multiple reasons for this issue. First, it inevitably includes too many missing values. In the usual high-throughput sequencing (HTS), the so-called depth can compensate for this problem. Nevertheless, because of the very limited amount of RNA retrieved from individual cells available, “depth” cannot resolve this missing value problem. Second, too many missing values result in apparent diversity. The primary purpose of single-cell analysis is to identify the diversity of individual cells that cannot be recognized by the tissue-level HTS. Although missing values are random, apparently very variant profiles appear from a single profile, which can be recognized if there is a large enough number of reads available. This compels researchers to distinguish between true biological diversity and apparent diversity caused by missing values [
2].
Finally, single-cell analysis is computationally challenging. Because there are not many samples in the standard HTS, even if the number of features is large, the overall required computational resources decided by the product between the number of features and the number of samples are very limited. Nonetheless, since the number of samples that is the same as that of cells can be huge in single-cell analysis, single-cell analysis can be computationally very challenging.
To resolve these difficulties, we employed tensor-decomposition (TD)-based unsupervised feature extraction (FE) [
3]. Prior to applying TD to multiomics datasets, singular-value decomposition (SVD) was applied to individual omics profiles such that individual omics profiles have common
L singular-value vectors. Then,
K omics profiles are formatted as an
-dimensional tensor, where
M is the number of single cells. Then, higher-order singular-value decomposition (HOSVD), which is a type of TD, is applied to the tensor. UMAP applied to singular-value vectors attributed to single cells by HOSVD successfully generated two-dimensional embedding, coincident with the known classification of single cells.
4. Discussion
In this study, we demonstrated the usefulness of our strategy when it was applied to the integrated analysis of single-cell multiomics datasets composed of gene expression, DNA methylation, and DNA accessibility. One might wonder if other more popular methods can achieve similar performance because our strategy is useless if others can perform comparably. There are several advantages of our method, which other methods do not have.
First, we do not have to fill in the missing values with nonzero values. Single-cell measurements are usually associated with a large number of missing values (
Table 5).
Although gene expression profiles were associated with a relatively small number of missing components, more than 70 % were missing. For DNA methylation and accessibility, the situation was very difficult to treat. Only a few percentages of components had values, while the rest were missing values. To address this problem, especially for DNA methylation and accessibility, heavy preprocessing is usually required. For example, for Dataset 1, statistical tests were applied and regions associated with significant
p-values were selected [
4], which reduced the number of features attributed to DNA methylation and accessibility. Because such a statistical test automatically filters out regions filled in with missing values, the ratio of nonzero components was also reduced as a result. For Dataset 2, the authors restricted the features to only the most variable ones (typically ∼
) and occasionally filled in missing components with Bayesian models [
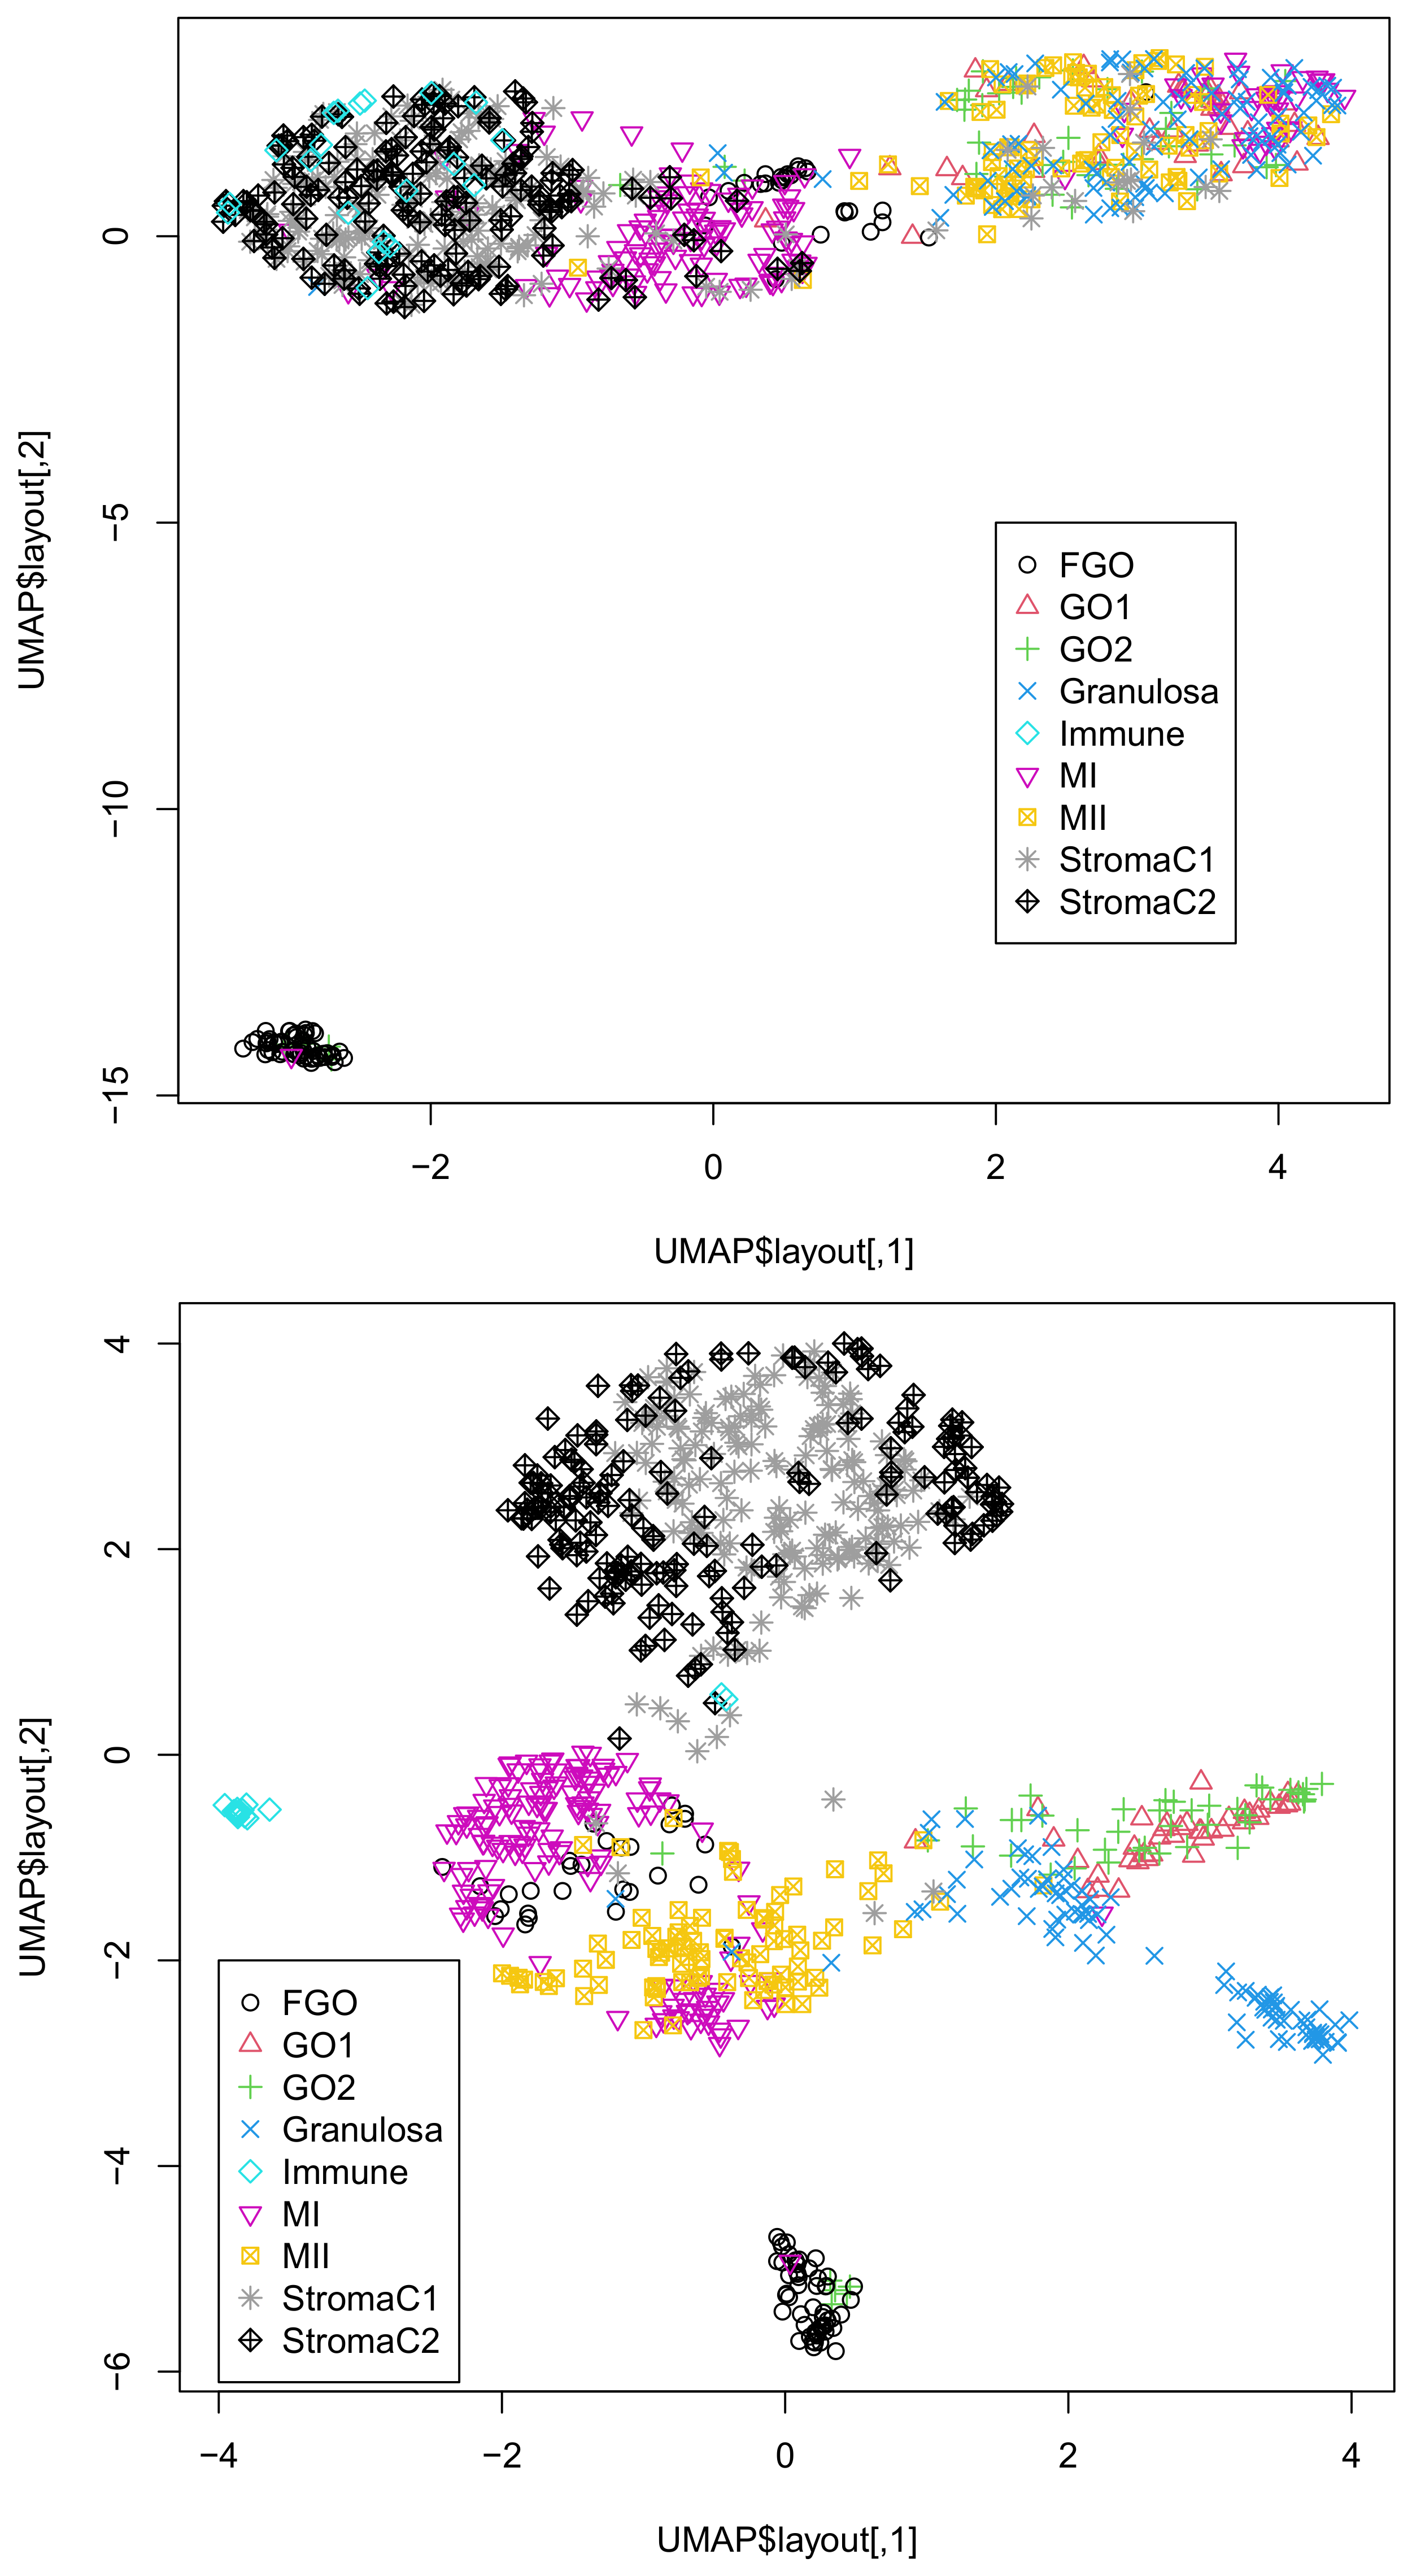
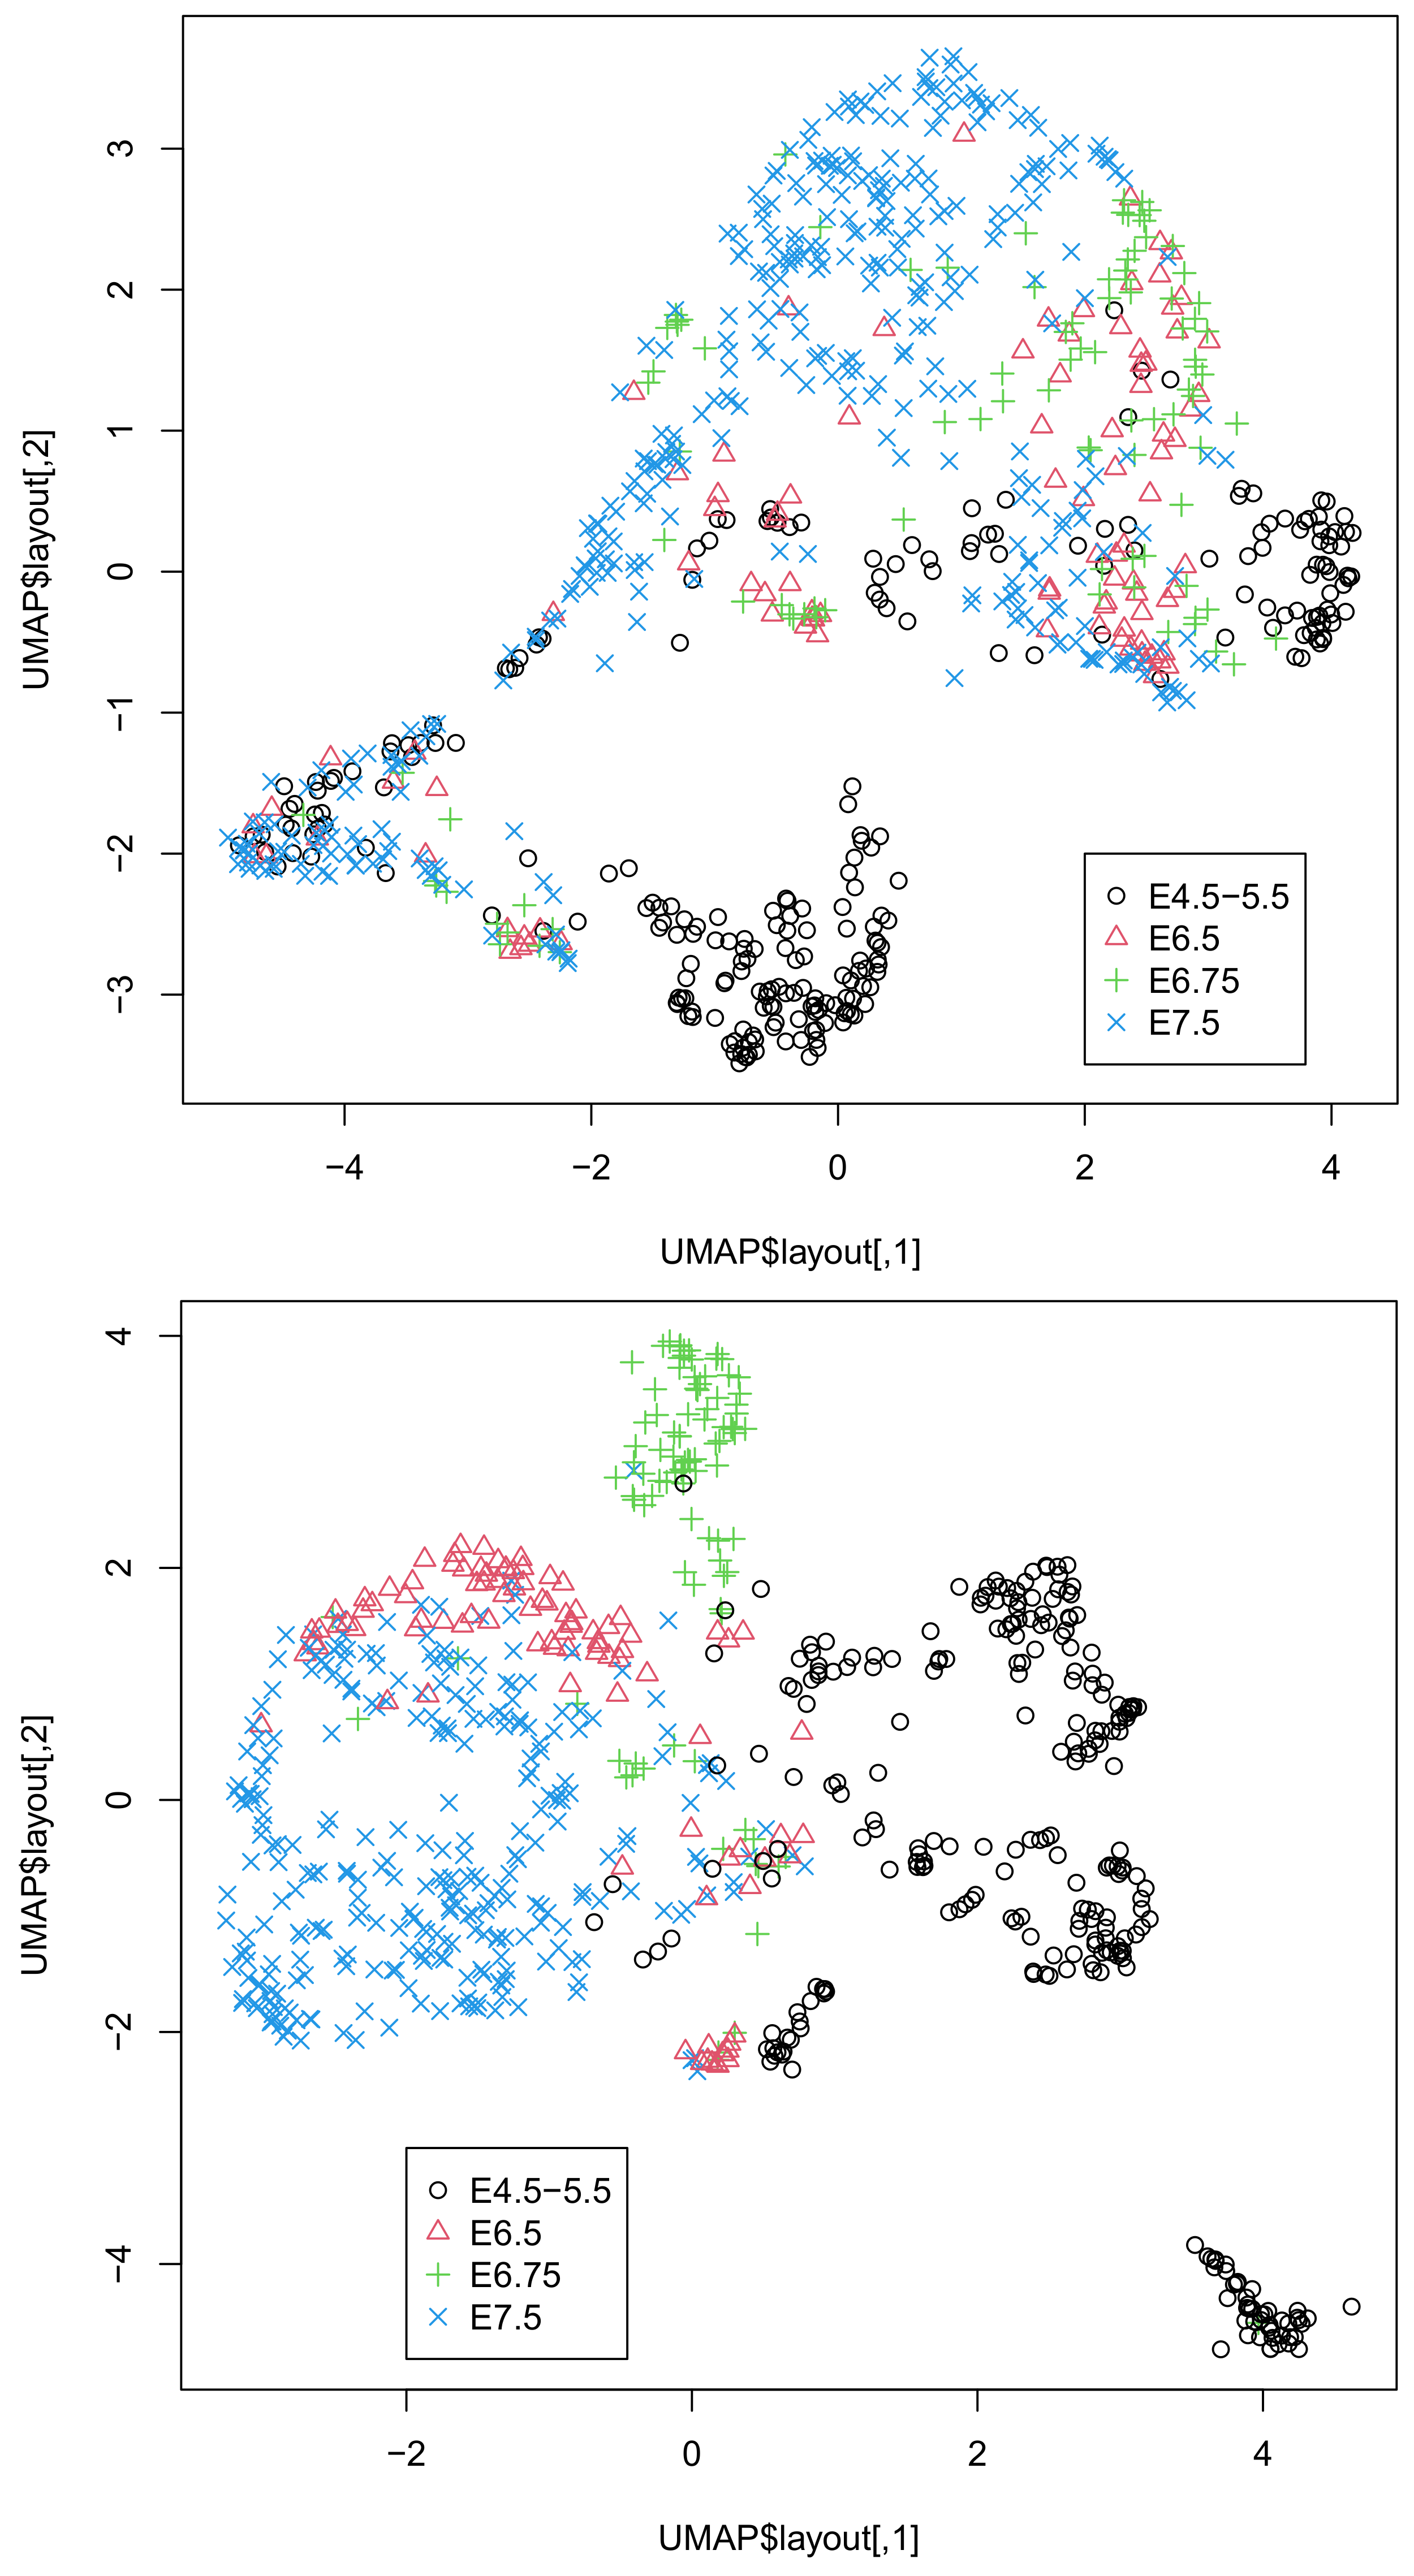
7]. These procedures inevitably introduce arbitrariness to the outcomes, as preprocessing the data might affect the outcome. In contrast to these arbitrary procedures, our method is almost unsupervised. We did not select any features or fill in the missing values. Despite these fully unsupervised strategies, our results were highly coincident with the classification (
Table 3 and
Table 4 and
Figure 1 and
Figure 2). From this perspective, our strategy is superior to the other methods.
Second, our method can deal with massive datasets. For example, although integrated analysis of multiomics data was performed using multiomics factor analysis (MOFA) [
21] in the original studies [
4,
7] of Datasets 1 and 2, MOFA cannot accept
in this study as inputs because MOFA does not implement sparse matrix architecture. During the computation of MOFA, zero values must be filled in with nonzero values to evaluate the convergence; this results in a dense matrix that cannot be stored in the computer memory because the number of components of DNA methylation and accessibility is too large to store them as they are (
Table 5). In our computation, we can apply SVD to these large datasets while keeping them in a sparse matrix format using the irlba package implemented in R. SVD not only reduces the number of features to
L, but also fills in missing values. Thus, we can manage a large matrix as in our implementation.
Third, our method is free from the dividing weight between multiomics datasets; how to weigh individual omics data must be decided based on some criteria outside the datasets available. Nevertheless, in our implementation, the weight of individual omics data is represented by , which is automatically decided by simply applying HOSVD to a multiomics dataset. Thus, from this perspective, our strategy is outstanding.
Although we showed that the integration of all three omics data was superior to that of the integration of DNA methylation and accessibility (
Figure 1 and
Figure 2), one might wonder if the integration of gene expression and DNA methylation or DNA accessibility might be comparable to that of all thee omics datasets. In order to deny this possibility, we also considered these combinations of two of the three omics datasets (
Figures S3 and S4). Although the integration of gene expression and DNA accessibility in Dataset 1 (
Figure S3B) is comparable to that of all three omics data, neither integration of gene expression and DNA methylation (
Figure S4A) nor that of gene expression and DNA accessibility (
Figure S4B) is comparable to that of all three omics data in Dataset 2. Thus, it is obvious that only the integration of the three omics datasets can give us UMAP embedding coincident with the classification regardless of the dataset considered.
As for the comparisons with other methods, as mentioned above, no methods implemented with a sparse matrix architecture and applicable to multiomics datasets exist to our knowledge. Thus, we could not compare our performance to other methods.
Prospective uses of our methods are as follows. First of all, it can integrate gene expression profiles, DNA methylation, and accessibility in single-cell measurements without applying preprocessing; this enables researchers to obtain reasonable results without struggling to convert raw data into treatable formats. In addition to this, since it can save the memories required for analyzing single-cell multiomics datasets, more researchers who do not have massive computational facilities can analyze massive single-cell measurements.


