Identification of Appropriate Reference Genes for Normalizing miRNA Expression in Citrus Infected by Xanthomonas citri subsp. citri


Abstract
:1. Introduction
2. Materials and Methods
2.1. Plant Materials, Growth Conditions, and Bacterial Inoculation
2.2. RNA Isolation and Complementary DNA Synthesis
2.3. Selection of Candidate Reference Genes and Primer Design
2.4. Reverse Transcription-Quantitative PCR Analysis
2.5. Data Analysis
2.6. Reference Gene Validation
3. Results
3.1. Verification of Primer Efficiency for the Candidate Reference Genes
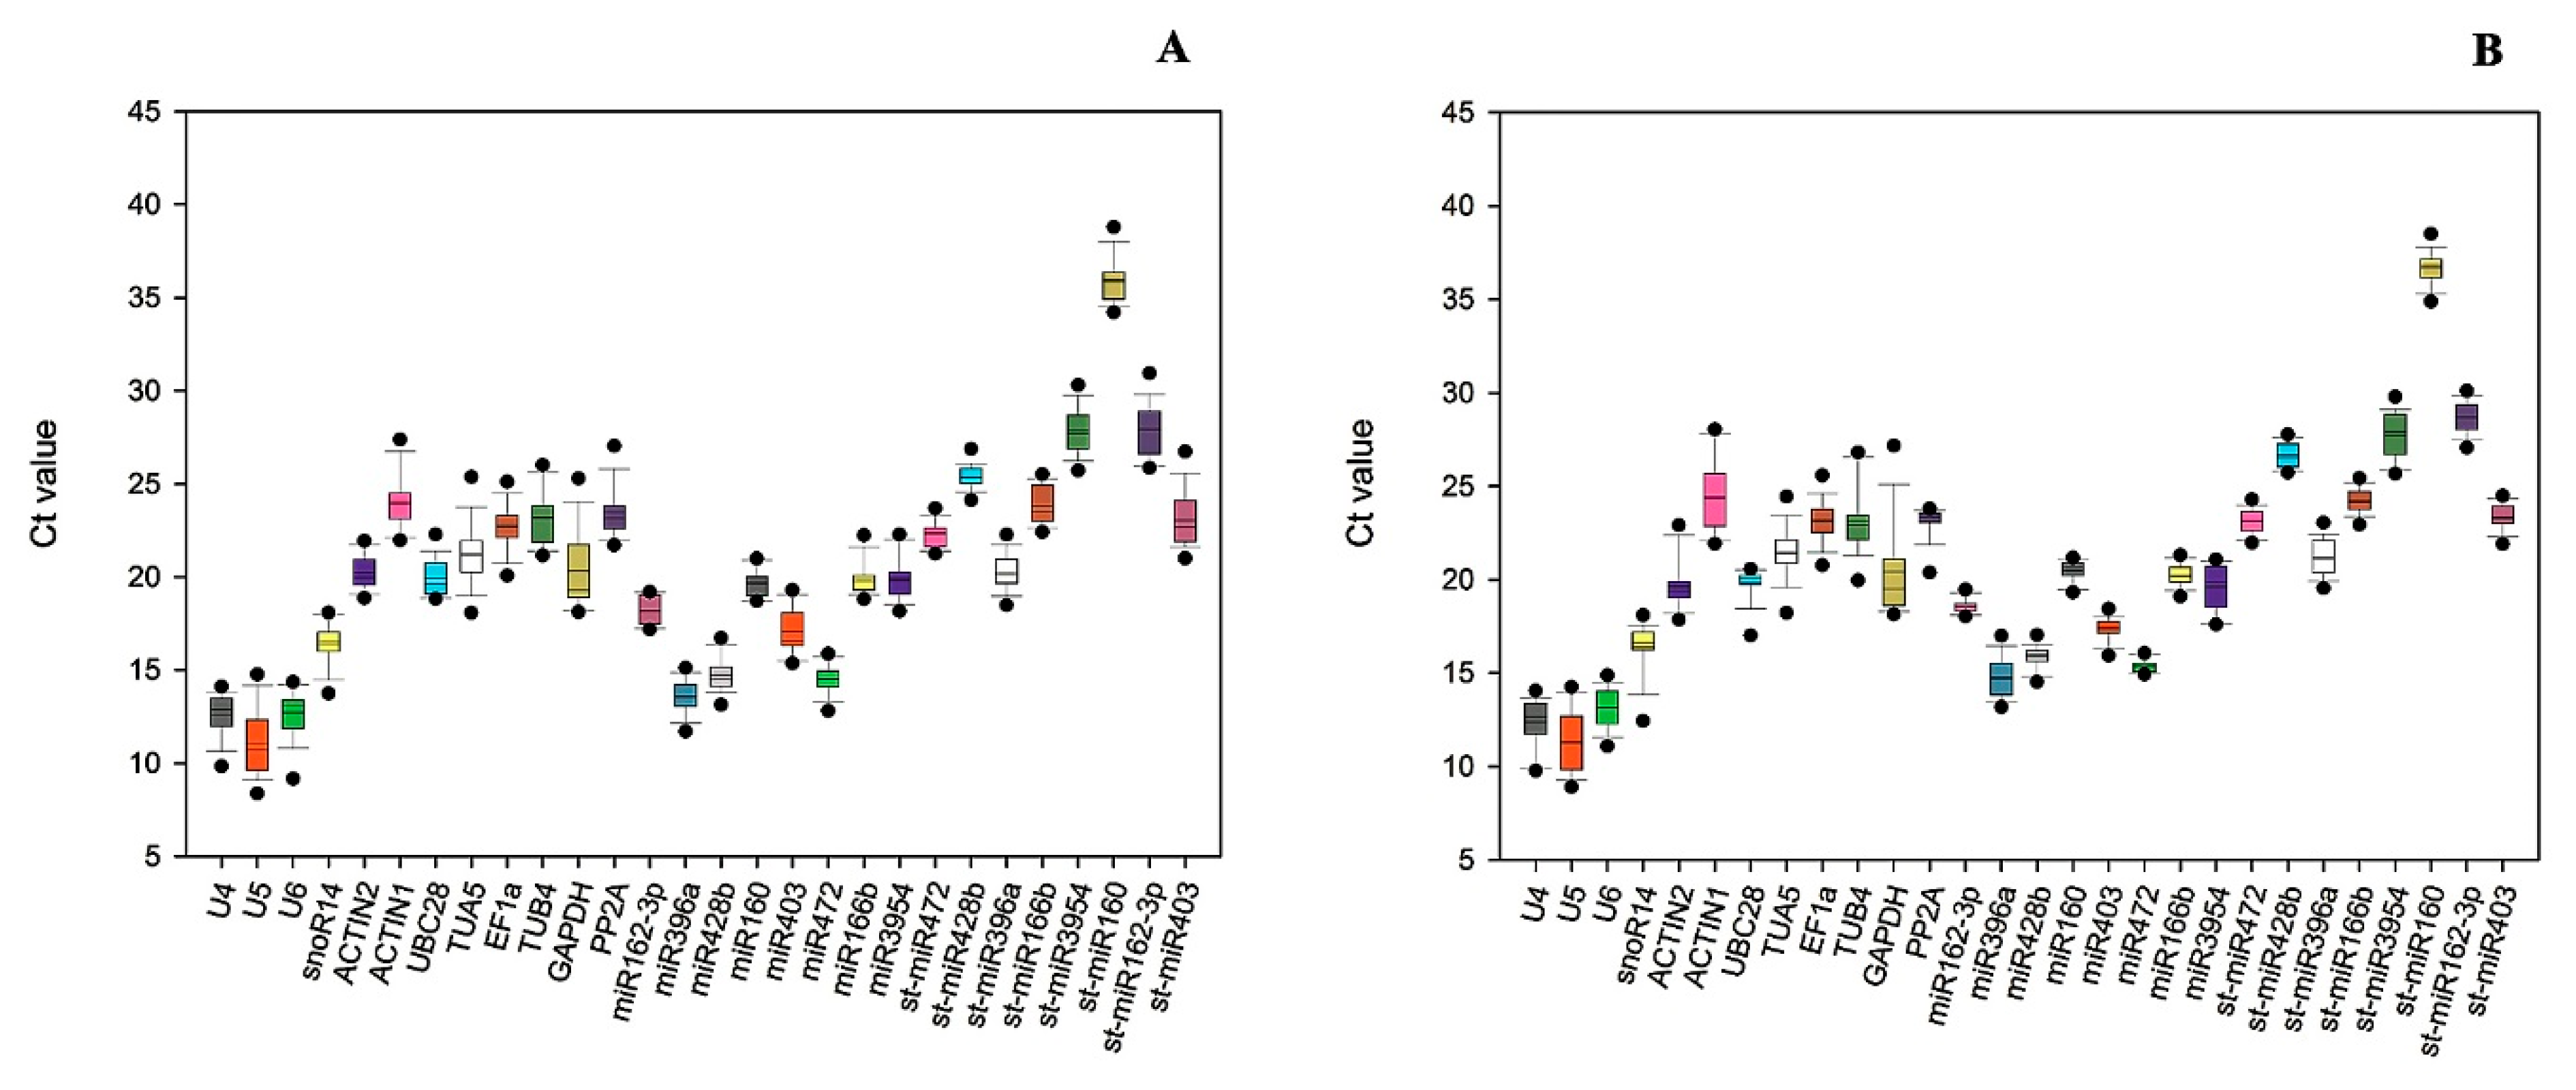
3.2. Ct Value Distribution of Candidate Reference Genes
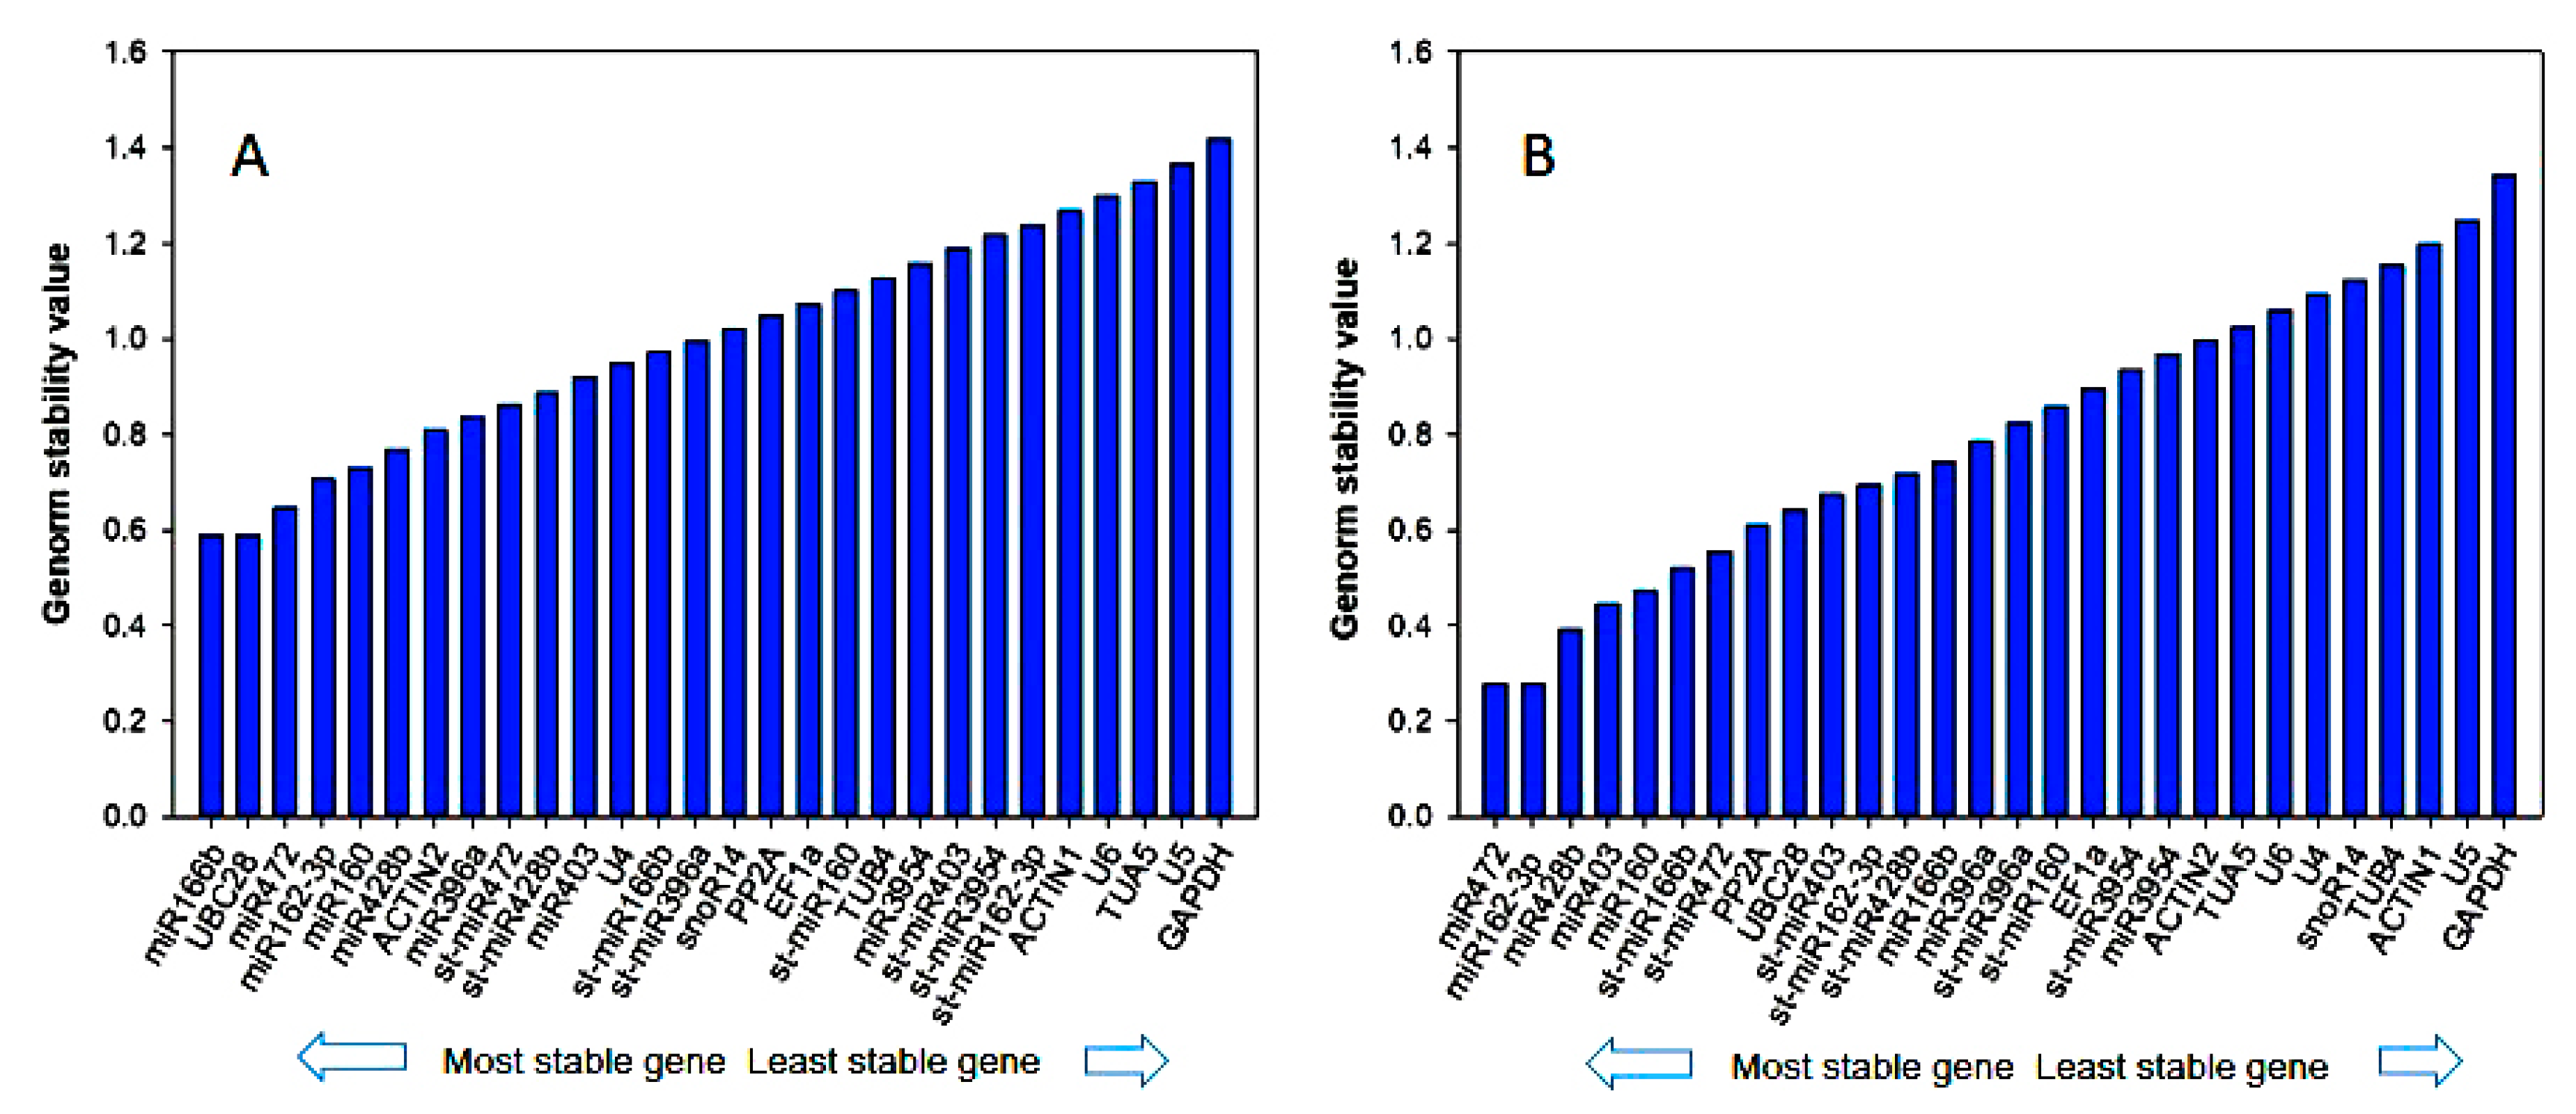
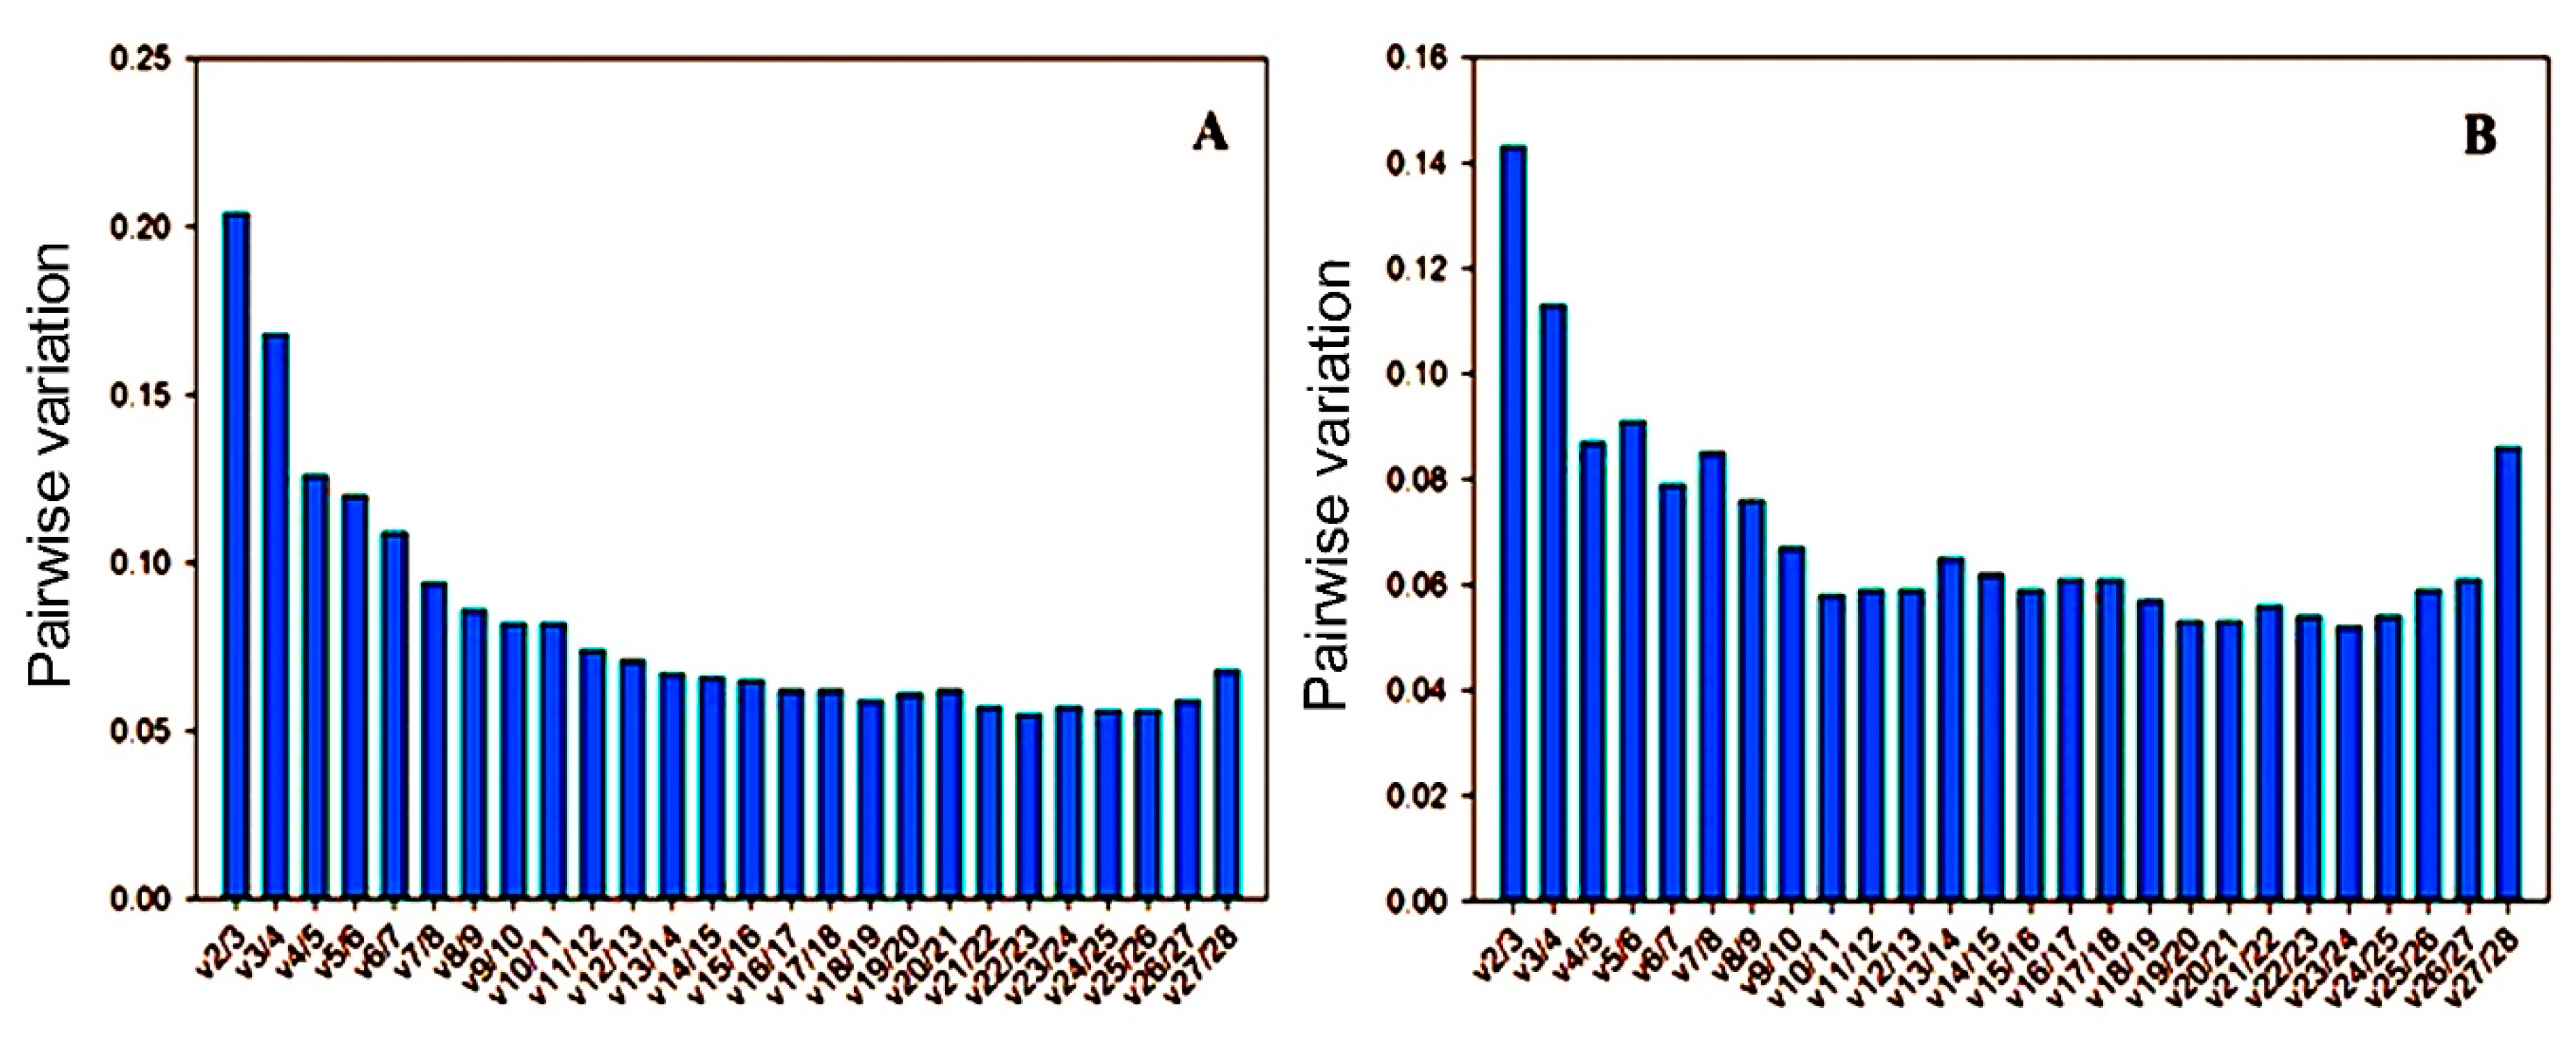
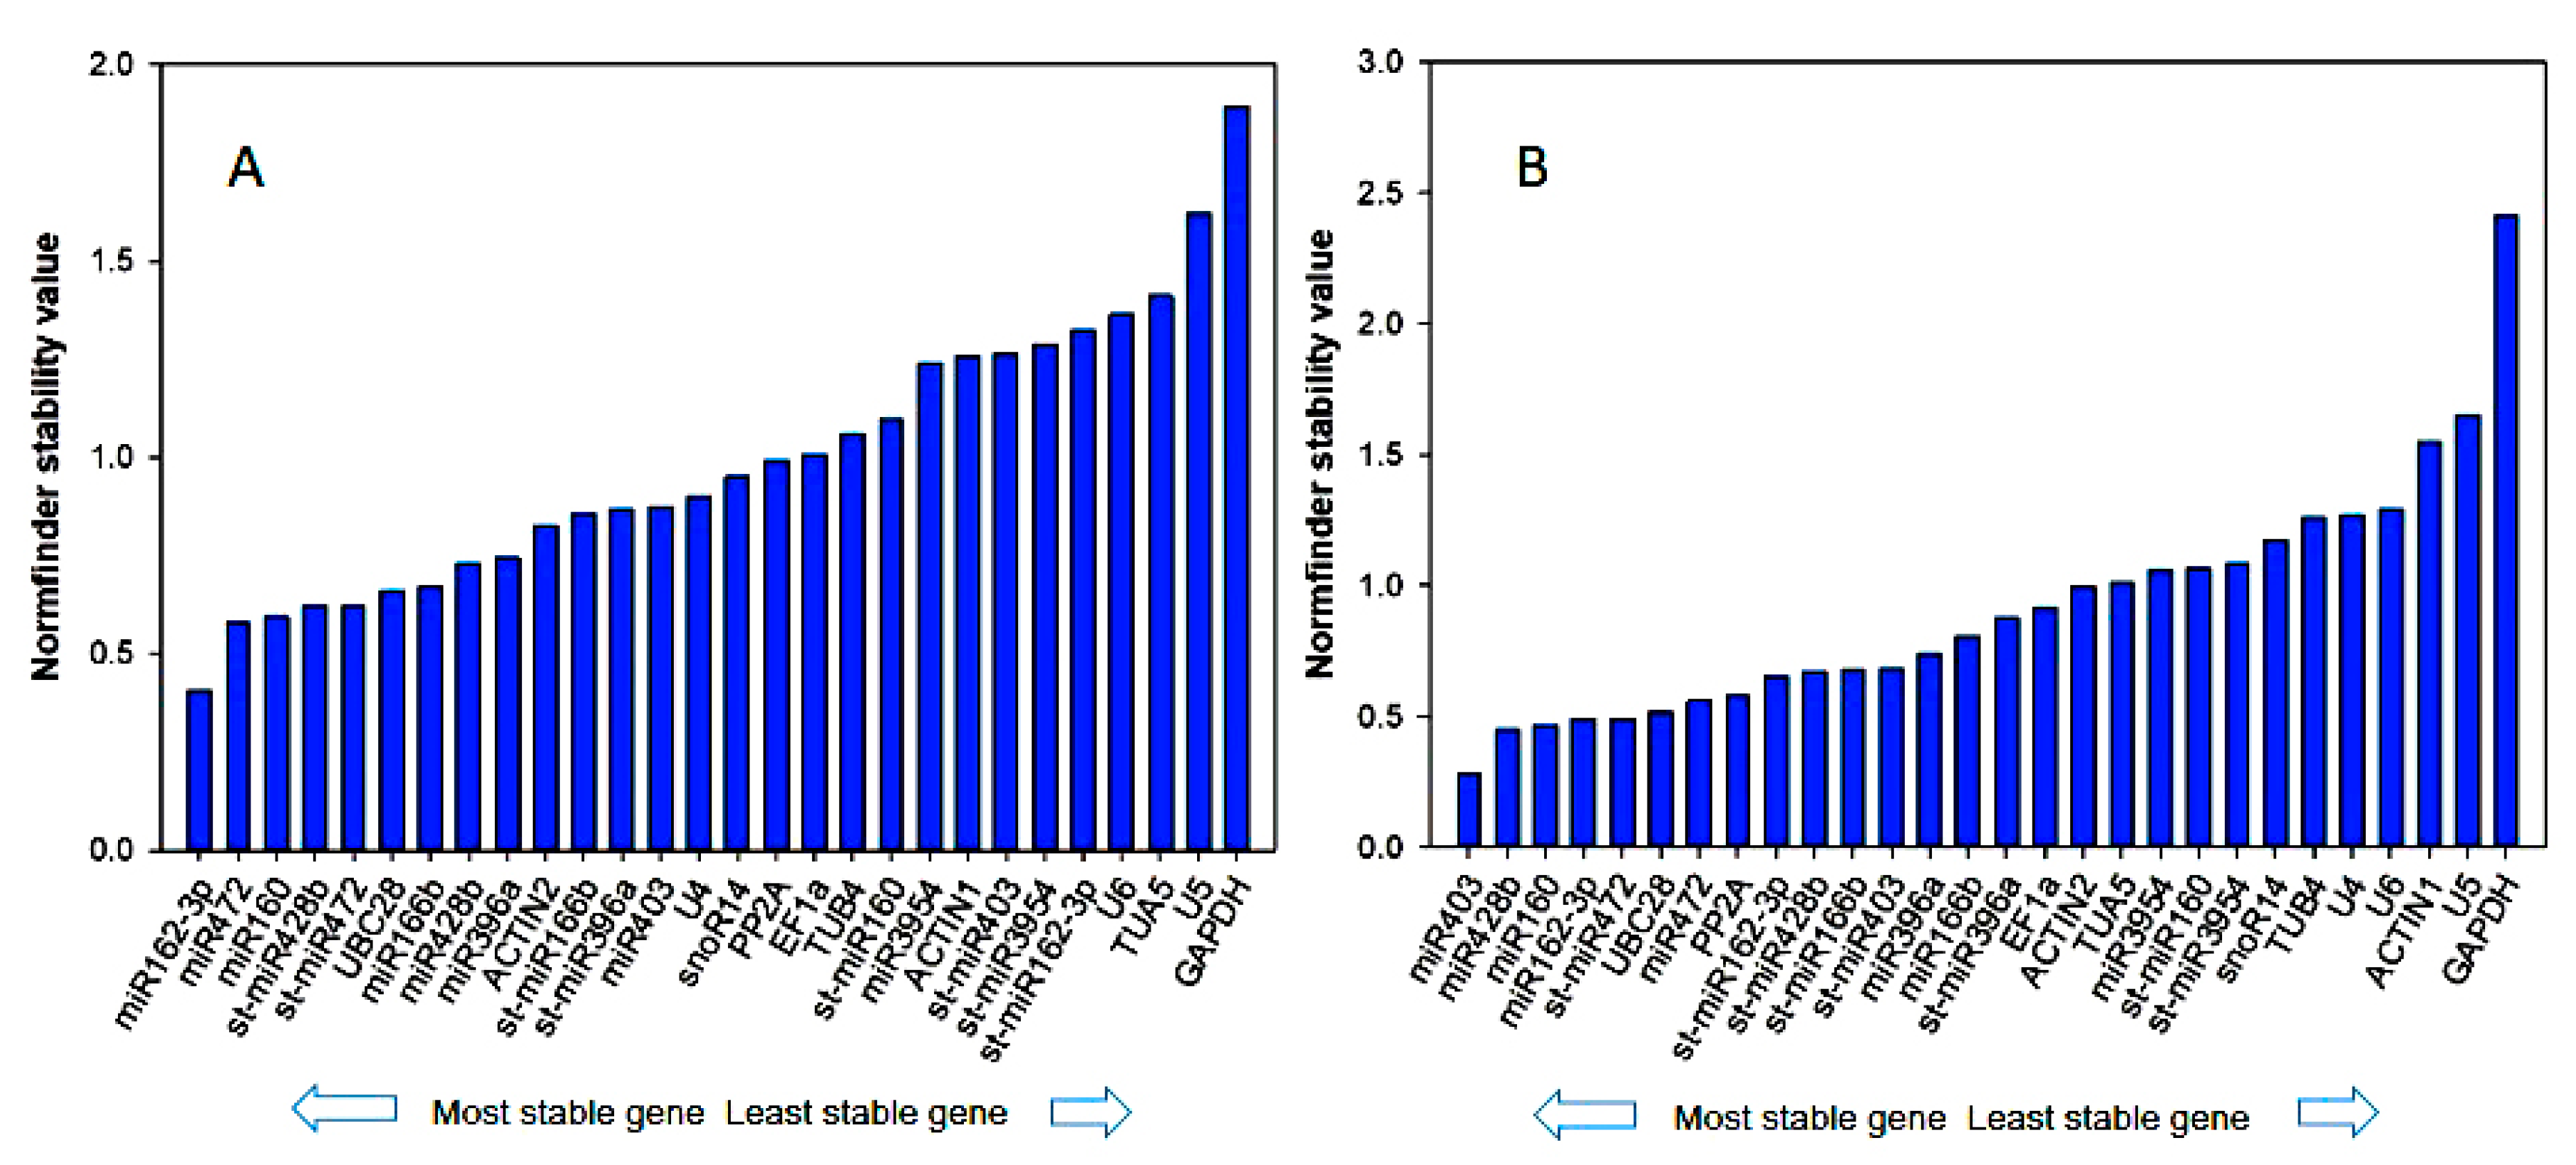
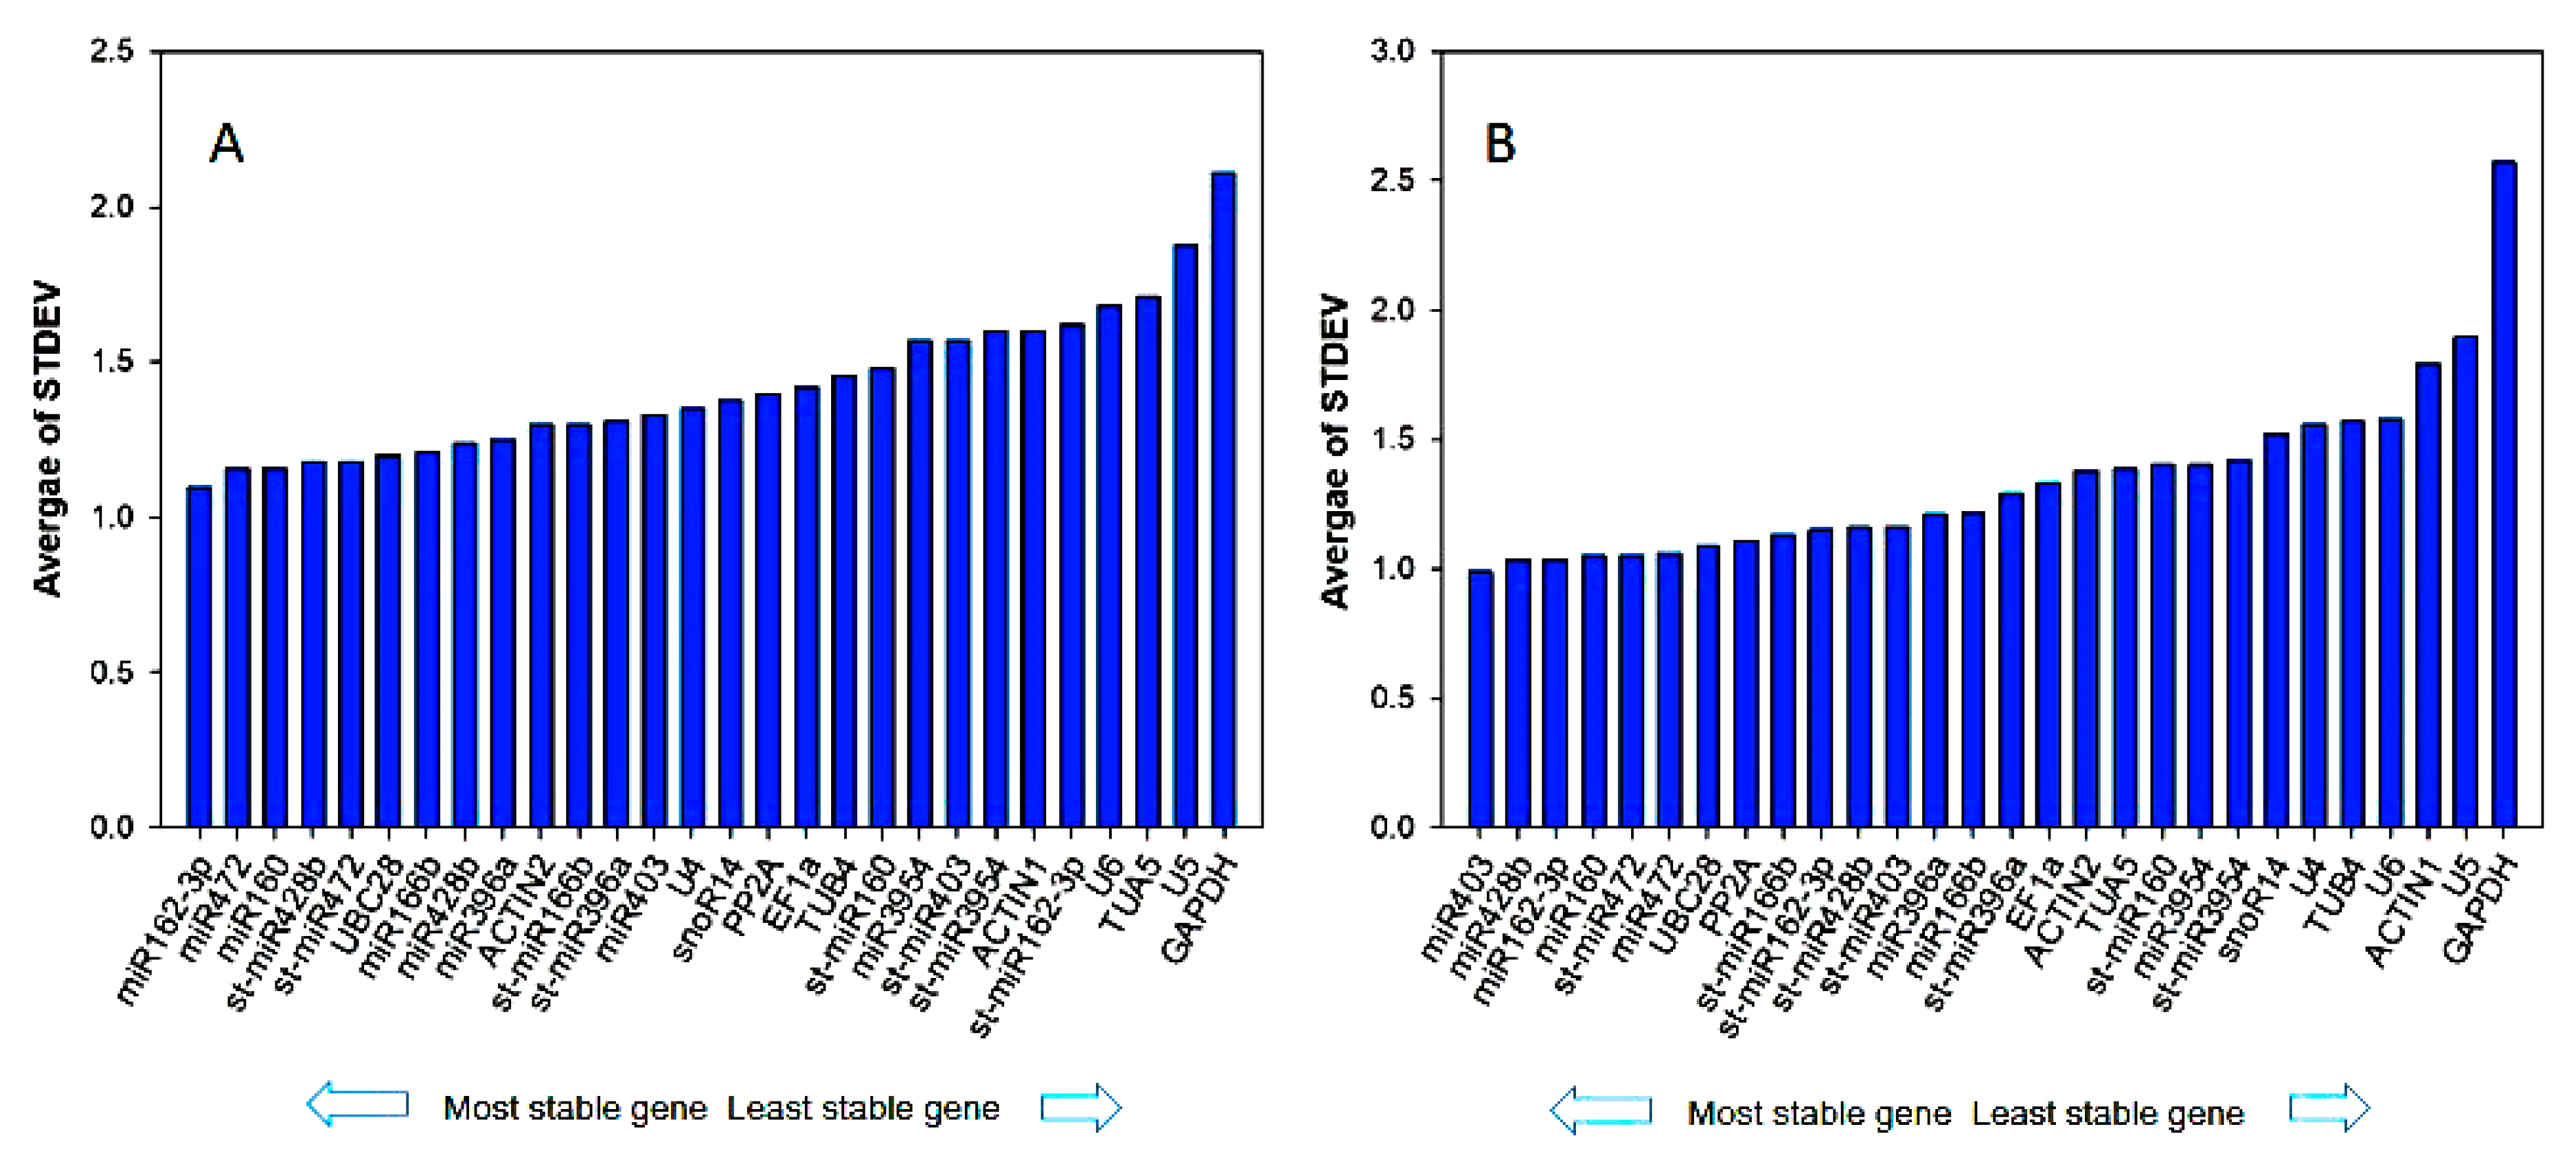
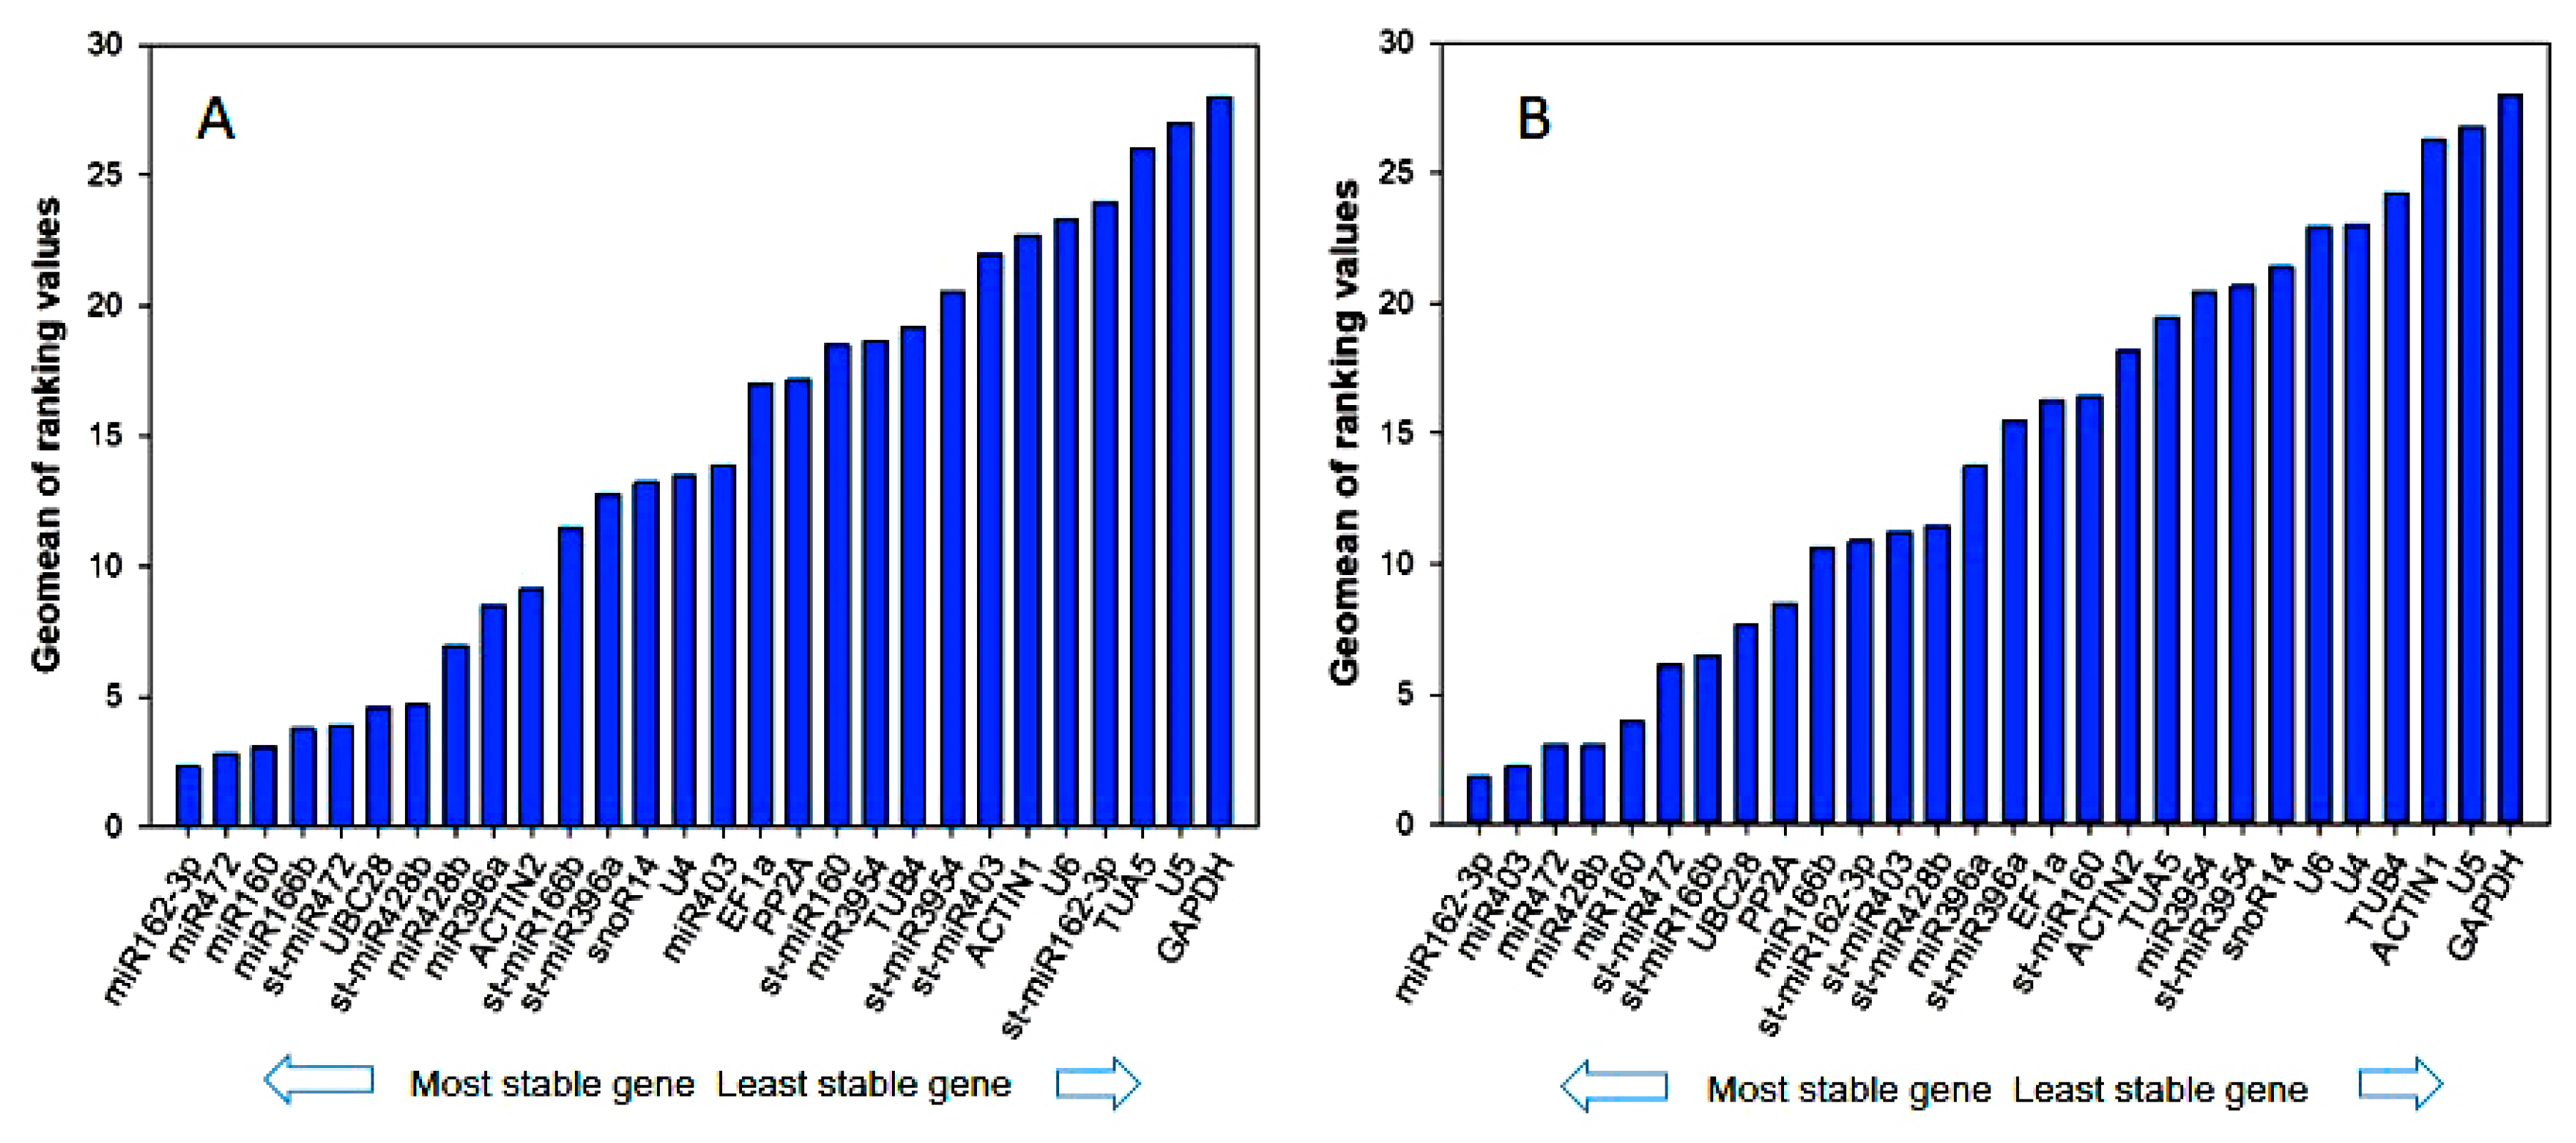
3.3. Reference Gene Stability Analyzed by geNorm, NormFinder, BestKeeper, Delta-Ct Method, and Refinder
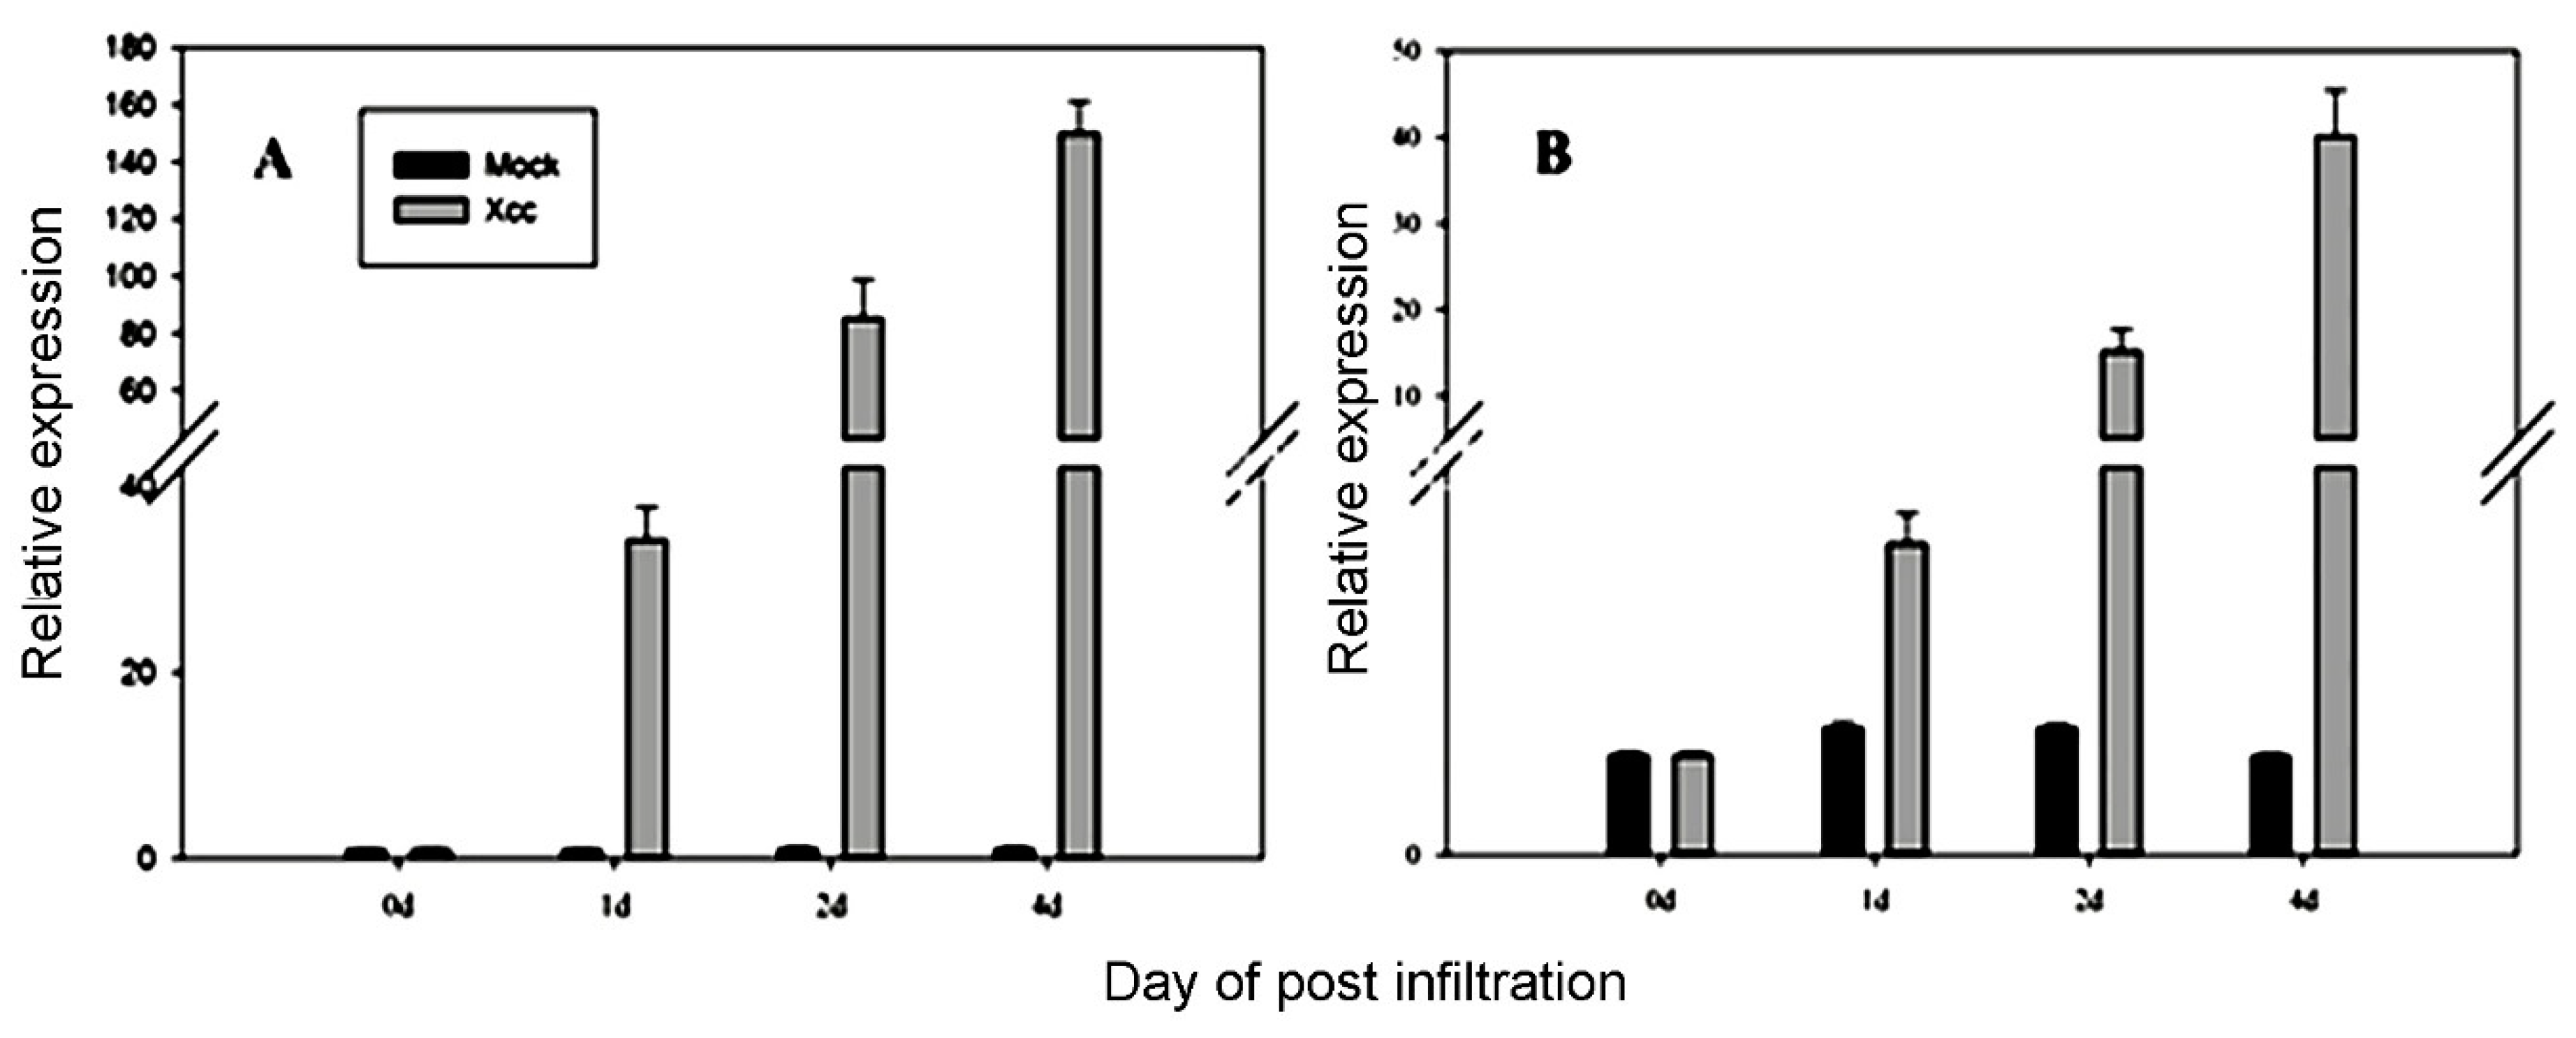
3.4. Validation of Candidate Reference Genes
4. Discussion
5. Conclusions
Supplementary Materials
Author Contributions
Funding
Acknowledgments
Conflicts of Interest
References
- Jia, H.; Zhang, Y.; Orbovic, V.; Xu, J.; White, F.F.; Jones, J.B.; Wang, N. Genome editing of the disease susceptibility gene cslob1 in citrus confers resistance to citrus canker. Plant Biotechnol. J. 2017, 15, 817–823. [Google Scholar] [CrossRef] [PubMed] [Green Version]
- Gottwald, T.R.; Graham, J.H.; Schubert, T.S. Citrus canker: The pathogen and its impact. Plant Health Prog. 2002. [Google Scholar] [CrossRef] [Green Version]
- Riera, N.; Wang, H.; Li, Y.; Li, J.; Pelz-Stelinski, K.; Wang, N. Induced systemic resistance against citrus canker disease by rhizobacteria. Phytopathology 2018, 108, 1038–1045. [Google Scholar] [CrossRef] [PubMed] [Green Version]
- Deng, Z.N.; Xu, L.; Li, D.Z.; Long, G.Y.; Liu, L.P.; Fang, F.; Shu, G.P. Screening citrus genotypes for resistance to canker disease (Xanthomonas axonopodis pv. citri). Plant Breed. 2009, 129, 341–345. [Google Scholar] [CrossRef]
- Pavan, A.; Calixto, M.C.; Cardoso, S.C.; Mendes, B.M.J.; Filho, A.B.; Lopes, J.R.S.; Carvalho, C.R.D.; Filho, F.D.A.A.M. Evaluation of ‘hamlin’ sweet orange + ‘montenegrina’ mandarin somatic hybrid for tolerance to Xanthomonas axonopodis pv. citri and Xylella fastidiosa. Sci. Hortic. 2007, 113, 278–285. [Google Scholar] [CrossRef]
- Cernadas, R.A.; Camillo, L.R.; Benedetti, C.E. Transcriptional analysis of the sweet orange interaction with the citrus canker pathogens Xanthomonas axonopodis pv. citri and Xanthomonas axonopodis pv. Aurantifolii. Mol. Plant Pathol. 2008, 9, 609–631. [Google Scholar] [CrossRef]
- Hu, Y.; Duan, S.; Zhang, Y.; Shantharaj, D.; Jones, J.B.; Wang, N. Temporal transcription profiling of sweet orange in response to ptha4-mediated Xanthomonas citri subsp. citri infection. Phytopathology 2016, 106, 442–451. [Google Scholar] [CrossRef] [Green Version]
- Fu, X.Z.; Gong, X.Q.; Zhang, Y.X.; Wang, Y.; Liu, J.H. Different transcriptional response to Xanthomonas citri subsp. citri between kumquat and sweet orange with contrasting canker tolerance. PLoS ONE 2012, 7, e41790. [Google Scholar] [CrossRef] [Green Version]
- Jia, H.; Orbovic, V.; Wang, N. CRISPR-LbCas12a-mediated modification of citrus. Plant Biotechnol. J. 2019, 17, 1928–1937. [Google Scholar] [CrossRef] [Green Version]
- Khodadadi, E.; Mehrabi, A.A.; Najafi, A.; Rastad, S.; Masoudi-Nejad, A. Systems biology study of transcriptional and post-transcriptional co-regulatory network sheds light on key regulators involved in important biological processes in Citrus sinensis. Physiol. Mol. Biol. Plants 2017, 23, 331–342. [Google Scholar] [CrossRef] [Green Version]
- Obernosterer, G.; Leuschner, P.J.; Alenius, M.; Martinez, J. Post-transcriptional regulation of microRNA expression. RNA 2006, 12, 1161–1167. [Google Scholar] [CrossRef] [PubMed] [Green Version]
- Chekulaeva, M.; Filipowicz, W. Mechanisms of miRNA-mediated post-transcriptional regulation in animal cells. Curr. Opin. Cell Biol. 2009, 21, 452–460. [Google Scholar] [CrossRef] [PubMed]
- Ouyang, S.; Park, G.; Atamian, H.S.; Han, C.S.; Stajich, J.E.; Kaloshian, I.; Borkovich, K.A. MicroRNAs suppress NB domain genes in tomato that confer resistance to Fusarium oxysporum. PLoS Pathog. 2014, 10, e1004464. [Google Scholar] [CrossRef] [PubMed]
- Pritchard, C.C.; Cheng, H.H.; Tewari, M. MicroRNA profiling: Approaches and considerations. Nat. Rev. Genet. 2012, 13, 358–369. [Google Scholar] [CrossRef]
- Khraiwesh, B.; Zhu, J.K.; Zhu, J. Role of miRNAs and siRNAs in biotic and abiotic stress responses of plants. Biochim. Biophys. Acta 2012, 1819, 137–148. [Google Scholar] [CrossRef] [Green Version]
- Fang, Y.; Xie, K.; Xiong, L. Conserved mir164-targeted NAC genes negatively regulate drought resistance in rice. J. Exp. Bot. 2014, 65, 2119–2135. [Google Scholar] [CrossRef] [Green Version]
- Li, Y.; Zhang, Q.; Zhang, J.; Wu, L.; Qi, Y.; Zhou, J.M. Identification of microRNAs involved in pathogen-associated molecular pattern-triggered plant innate immunity. Plant Physiol. 2010, 152, 2222–2231. [Google Scholar] [CrossRef] [Green Version]
- Benes, V.; Castoldi, M. Expression profiling of microRNA using real-time quantitative PCR, how to use it and what is available. Methods 2010, 50, 244–249. [Google Scholar] [CrossRef]
- Babion, I.; Snoek, B.C.; van de Wiel, M.A.; Wilting, S.M.; Steenbergen, R.D.M. A strategy to find suitable reference genes for miRNA quantitative PCR analysis and its application to cervical specimens. J. Mol. Diagn. 2017, 19, 625–637. [Google Scholar] [CrossRef] [Green Version]
- Leitao Mda, C.; Coimbra, E.C.; de Lima Rde, C.; Guimaraes Mde, L.; Heraclio Sde, A.; Silva Neto Jda, C.; de Freitas, A.C. Quantifying mRNA and microRNA with qPCR in cervical carcinogenesis: A validation of reference genes to ensure accurate data. PLoS ONE 2014, 9, e111021. [Google Scholar]
- Wang, X.; Gardiner, E.J.; Cairns, M.J. Optimal consistency in microRNA expression analysis using reference-gene-based normalization. Mol. BioSyst. 2015, 11, 1235–1240. [Google Scholar] [CrossRef] [PubMed]
- Carvalho, K.; de Campos, M.K.; Pereira, L.F.; Vieira, L.G. Reference gene selection for real-time quantitative polymerase chain reaction normalization in “swingle” citrumelo under drought stress. Anal. Biochem. 2010, 402, 197–199. [Google Scholar] [CrossRef] [PubMed]
- Mafra, V.; Kubo, K.S.; Alves-Ferreira, M.; Ribeiro-Alves, M.; Stuart, R.M.; Boava, L.P.; Rodrigues, C.M.; Machado, M.A. Reference genes for accurate transcript normalization in citrus genotypes under different experimental conditions. PLoS ONE 2012, 7, e31263. [Google Scholar] [CrossRef] [PubMed]
- Liu, Z.; Ge, X.-X.; Wu, X.-M.; Kou, S.-J.; Chai, L.-J.; Guo, W.-W. Selection and validation of suitable reference genes for mRNA qRT-PCR analysis using somatic embryogenic cultures, floral and vegetative tissues in citrus. Plant Cell Tiss. Org. Cult. 2013, 113, 469–481. [Google Scholar] [CrossRef]
- Wu, J.X.; Su, S.Y.; Fu, L.L.; Zhang, Y.J.; Chai, L.J.; Yi, H.L. Selection of reliable reference genes for gene expression studies using quantitative real-time PCR in navel orange fruit development and pummelo floral organs. Sci. Hortic. 2014, 176, 180–188. [Google Scholar] [CrossRef]
- Thomson, J.M.; Newman, M.; Parker, J.S.; Morin-Kensicki, E.M.; Wright, T.; Hammond, S.M. Extensive post-transcriptional regulation of microRNAs and its implicaitons for cancer. Genes Dev. 2006, 20, 2202–2207. [Google Scholar] [CrossRef] [Green Version]
- Peltier, H.J.; Latham, G.J. Normalization of microRNA expression levels in quantitative RT-PCR assays: Identification of suitable reference RNA targets in normal and cancerous human solid tissues. RNA 2008, 14, 844–852. [Google Scholar] [CrossRef] [Green Version]
- Chen, C.; Ridzon, D.A.; Broomer, A.J.; Zhou, Z.; Lee, D.H.; Nguyen, J.T.; Barbisin, M.; Xu, N.L.; Mahuvakar, V.R.; Andersen, M.R.; et al. Real-time quantification of microRNAs by stem-loop RT-PCR. Nucleic Acids Res. 2005, 33, e179. [Google Scholar] [CrossRef]
- Fu, H.J.; Zhu, J.; Yang, M.; Zhang, Z.Y.; Tie, Y.; Jiang, H.; Sun, Z.X.; Zheng, X.F. A novel method to monitor the expression of microRNAs. Mol. Biotechnol. 2006, 32, 197–204. [Google Scholar] [CrossRef]
- Cassol, D.; Cruz, F.P.; Espindola, K.; Mangeon, A.; Muller, C.; Loureiro, M.E.; Correa, R.L.; Sachetto-Martins, G. Identification of reference genes for quantitative RT-PCR analysis of microRNAs and mRNAs in castor bean (Ricinus communis L.) under drought stress. Plant Physiol. Biochem. 2016, 106, 101–107. [Google Scholar] [CrossRef]
- Wu, W.; Deng, Q.; Shi, P.; Yang, J.; Hu, Z.; Zhang, M. Identification of appropriate reference genes for normalization of miRNA expression in grafted watermelon plants under different nutrient stresses. PLoS ONE 2016, 11, e0164725. [Google Scholar] [CrossRef] [PubMed]
- Yang, Y.; Zhang, X.; Chen, Y.; Guo, J.; Ling, H.; Gao, S.; Su, Y.; Que, Y.; Xu, L. Selection of reference genes for normalization of microRNA expression by RT-qPCR in sugarcane buds under cold stress. Front. Plant Sci. 2016, 7, 86. [Google Scholar] [CrossRef] [PubMed] [Green Version]
- Fausto, A.K.S.; Silva, T.D.F.; Romanel, E.; Vaslin, M.F.S. MicroRNAs as reference genes for quantitative PCR in cotton. PLoS ONE 2017, 12, e0174722. [Google Scholar] [CrossRef] [PubMed] [Green Version]
- Luo, X.Y.; Shi, T.; Sun, H.L.; Song, J.; Ni, Z.J.; Gao, Z.H. Selection of suitable inner reference genes for normalisation of microRNA expression response to abiotic stresses by RT-qPCR in leaves, flowers and young stems of peach. Sci. Hortic. 2014, 165, 281–287. [Google Scholar] [CrossRef]
- Jones-Rhoades, M.W.; Bartel, D.P. Computational identification of plant microRNAs and their targets, including a stress-induced miRNA. Mol. Cell 2004, 14, 787–799. [Google Scholar] [CrossRef]
- Sunkar, R. Novel and stress-regulated microRNAs and other small rnas from Arabidopsis. Plant Cell 2004, 16, 2001–2019. [Google Scholar] [CrossRef] [Green Version]
- Xie, Z.; Allen, E.; Fahlgren, N.; Calamar, A.; Givan, S.A.; Carrington, J.C. Expression of Arabidopsis miRNA genes. Plant Physiol. 2005, 138, 2145–2154. [Google Scholar] [CrossRef] [Green Version]
- Sunkar, R.; Girke, T.; Jain, P.K.; Zhu, J.K. Cloning and characterization of microRNAs from rice. Plant Cell 2005, 17, 1397–1411. [Google Scholar] [CrossRef] [Green Version]
- Lu, S.; Sun, Y.H.; Shi, R.; Clark, C.; Li, L.; Chiang, V.L. Novel and mechanical stress-responsive microRNAs in Populus trichocarpa that are absent from Arabidopsis. Plant Cell 2005, 17, 2186–2203. [Google Scholar] [CrossRef] [Green Version]
- Yao, Y.; Guo, G.; Ni, Z.; Sunkar, R.; Du, J.; Zhu, J.K.; Sun, Q. Cloning and characterization of microRNAs from wheat (Triticum aestivum L.). Genome Biol. 2007, 8, R96. [Google Scholar] [CrossRef] [Green Version]
- Wu, X.-M.; Liu, M.-Y.; Xu, Q.; Guo, W.-W. Identification and characterization of microRNAs from citrus expressed sequence tags. Tree Genet. Genomes 2010, 7, 117–133. [Google Scholar] [CrossRef]
- Xu, Q.; Liu, Y.; Zhu, A.; Wu, X.; Ye, J.; Yu, K.; Guo, W.; Deng, X. Discovery and comparative profiling of microRNAs in a sweet orange red-flesh mutant and its wild type. BMC Genom. 2010, 11, 246. [Google Scholar] [CrossRef] [PubMed] [Green Version]
- Lu, Y.B.; Yang, L.T.; Qi, Y.P.; Li, Y.; Li, Z.; Chen, Y.B.; Huang, Z.R.; Chen, L.S. Identification of boron-deficiency-responsive microRNAs in Citrus sinensis roots by illumina sequencing. BMC Plant Biol. 2014, 14, 123. [Google Scholar] [CrossRef] [PubMed] [Green Version]
- Huang, J.H.; Qi, Y.P.; Wen, S.X.; Guo, P.; Chen, X.M.; Chen, L.S. Illumina microRNA profiles reveal the involvement of mir397a in citrus adaptation to long-term boron toxicity via modulating secondary cell-wall biosynthesis. Sci. Rep. 2016, 6, 22900. [Google Scholar] [CrossRef] [Green Version]
- Luan, Y.; Cui, J.; Zhai, J.; Li, J.; Han, L.; Meng, J. High-throughput sequencing reveals differential expression of miRNAs in tomato inoculated with Phytophthora infestans. Planta 2015, 241, 1405–1416. [Google Scholar] [CrossRef]
- Qiu, Z.; Li, X.; Zhao, Y.; Zhang, M.; Wan, Y.; Cao, D.; Lu, S.; Lin, J. Genome-wide analysis reveals dynamic changes in expression of microRNAs during vascular cambium development in chinese fir, Cunninghamia lanceolata. J. Exp. Bot. 2015, 66, 3041–3054. [Google Scholar] [CrossRef] [Green Version]
- Yang, L.; Mu, X.; Liu, C.; Cai, J.; Shi, K.; Zhu, W.; Yang, Q. Overexpression of potato mir482e enhanced plant sensitivity to Verticillium dahliae infection. J. Integr. Plant Biol. 2015, 57, 1078–1088. [Google Scholar] [CrossRef]
- Das, A.K. Citrus canker-a review. J. Appl. Hortic. 2003, 5, 52–60. [Google Scholar]
- Song, H.; Zhang, X.; Shi, C.; Wang, S.; Wu, A.; Wei, C. Selection and verification of candidate reference genes for mature microRNA expression by quantitative RT-PCR in the tea plant (Camellia sinensis). Genes 2016, 7, 25. [Google Scholar] [CrossRef] [Green Version]
- Han, R.; Yan, Y.; Zhou, P.; Zhao, H.X. Comparison of two microRNA quantification methods for assaying microRNA expression profiles in wheat (Triticum aestivum L.). J. Integr. Agric. 2014, 13, 733–740. [Google Scholar] [CrossRef] [Green Version]
- Luo, M.; Gao, Z.; Li, H.; Li, Q.; Zhang, C.; Xu, W.; Song, S.; Ma, C.; Wang, S. Selection of reference genes for miRNA qRT-PCR under abiotic stress in grapevine. Sci. Rep. 2018, 8, 4444. [Google Scholar] [CrossRef]
- Kou, S.J.; Wu, X.M.; Liu, Z.; Liu, Y.L.; Xu, Q.; Guo, W.W. Selection and validation of suitable reference genes for miRNA expression normalization by quantitative RT-PCR in citrus somatic embryogenic and adult tissues. Plant Cell Rep. 2012, 31, 2151–2163. [Google Scholar] [CrossRef]
- Czechowski, T.; Stitt, M.; Altmann, T.; Udvardi, M.K.; Scheible, W.R. Genome-wide identification and testing of superior reference genes for transcript normalization in Arabidopsis. Plant Physiol. 2005, 139, 5–17. [Google Scholar] [CrossRef] [PubMed] [Green Version]
- Paolacci, A.R.; Tanzarella, O.A.; Porceddu, E.; Ciaffi, M. Identification and validation of reference genes for quantitative RT-PCR normalization in wheat. BMC Mol. Biol. 2009, 10, 11. [Google Scholar] [CrossRef] [PubMed] [Green Version]
- Marum, L.; Miguel, A.; Ricardo, C.P.; Miguel, C. Reference gene selection for quantitative real-time PCR normalization in Quercus suber. PLoS ONE 2012, 7, e35113. [Google Scholar] [CrossRef]
- Yue, H.; Deng, P.; Liu, S.; Wang, M.; Song, W.; Nie, X. Selection and evaluation of reference genes for quantitative gene expression analysis in broomcorn millet (Panicum miliaceum L.). J. Plant Biol. 2016, 59, 435–443. [Google Scholar] [CrossRef]
- Udvardi, M.K.; Czechowski, T.; Scheible, W.R. Eleven golden rules of quantitative RT-PCR. Plant Cell 2008, 20, 1736–1737. [Google Scholar] [CrossRef] [PubMed] [Green Version]
- Silver, N.; Best, S.; Jiang, J.; Thein, S.L. Selection of housekeeping genes for gene expression studies in human reticulocytes using real-time PCR. BMC Mol. Biol. 2006, 7, 33. [Google Scholar] [CrossRef] [PubMed] [Green Version]
- Vandesompele, J.; De Preter, K.; Pattyn, F.; Poppe, B.; Van Roy, N.; De Paepe, A.; Speleman, F. Accurate normalization of real-time quantitative RT-PCR data by geometric averaging of multiple internal control genes. Genome Biol. 2002, 3, RESEARCH0034-1. [Google Scholar] [CrossRef] [Green Version]
- Andersen, C.L.; Jensen, J.L.; Orntoft, T.F. Normalization of real-time quantitative reverse transcription-PCR data: A model-based variance estimation approach to identify genes suited for normalization, applied to bladder and colon cancer data sets. Cancer Res. 2004, 64, 5245–5250. [Google Scholar] [CrossRef] [Green Version]
- Pfaffl, M.W.; Tichopad, A.; Prgomet, C.; Neuvians, T.P. Determination of stable housekeeping genes, differentially regulated target genes and sample integrity: Bestkeeper—Excel-based tool using pair-wise correlations. Biotechnol. Let. 2004, 26, 509–515. [Google Scholar] [CrossRef] [PubMed]
- Xie, F.; Sun, G.; Stiller, J.W.; Zhang, B. Genome-wide functional analysis of the cotton transcriptome by creating an integrated EST database. PLoS ONE 2011, 6, e26980. [Google Scholar] [CrossRef] [PubMed]
- Hu, Y.; Zhang, J.; Jia, H.; Sosso, D.; Li, T.; Frommer, W.B.; Yang, B.; White, F.F.; Wang, N.; Jones, J.B. Lateral organ boundaries 1 is a disease susceptibility gene for citrus bacterial canker disease. Proc. Natl. Acad. Sci. USA 2014, 111, E521–E529. [Google Scholar] [CrossRef] [PubMed] [Green Version]
- Kulcheski, F.R.; Marcelino-Guimaraes, F.C.; Nepomuceno, A.L.; Abdelnoor, R.V.; Margis, R. The use of microRNAs as reference genes for quantitative polymerase chain reaction in soybean. Anal. Biochem. 2010, 406, 185–192. [Google Scholar] [CrossRef] [PubMed]
- Ruijter, J.M.; Ramakers, C.; Hoogaars, W.M.; Karlen, Y.; Bakker, O.; van den Hoff, M.J.; Moorman, A.F. Amplification efficiency: Linking baseline and bias in the analysis of quantitative PCR data. Nucleic Acids Res. 2009, 37, e45. [Google Scholar] [CrossRef] [Green Version]
- Kozera, B.; Rapacz, M. Reference genes in real-time PCR. J. Appl. Genet. 2013, 54, 391–406. [Google Scholar] [CrossRef] [Green Version]
- Gifford, M.L.; Dean, A.; Gutierrez, R.A.; Coruzzi, G.M.; Birnbaum, K.D. Cell-specific nitrogen responses mediate developmental plasticity. Proc. Natl. Acad. Sci. USA 2008, 105, 803–808. [Google Scholar] [CrossRef] [Green Version]
- Li, J.; Han, X.; Wang, C.; Qi, W.; Zhang, W.; Tang, L.; Zhao, X. Validation of suitable reference genes for RT-qPCR data in Achyranthes bidentata blume under different experimental conditions. Front. Plant Sci. 2017, 8, 776. [Google Scholar] [CrossRef] [Green Version]
- Lin, F.; Jiang, L.; Liu, Y.; Lv, Y.; Dai, H.; Zhao, H. Genome-wide identification of housekeeping genes in maize. Plant Mol. Biol. 2014, 86, 543–554. [Google Scholar] [CrossRef]
- Maroufi, A.; Van Bockstaele, E.; De Loose, M. Validation of reference genes for gene expression analysis in chicory (Cichorium intybus) using quantitative real-time PCR. BMC Mol. Biol. 2010, 11, 15. [Google Scholar] [CrossRef] [Green Version]
- Xiao, Z.; Sun, X.; Liu, X.; Li, C.; He, L.; Chen, S.; Su, J. Selection of reliable reference genes for gene expression studies on Rhododendron molle g. Don. Front. Plant Sci. 2016, 7, 1547. [Google Scholar] [CrossRef] [PubMed] [Green Version]
- Barsalobres-Cavallari, C.F.; Severino, F.E.; Maluf, M.P.; Maia, I.G. Identification of suitable internal control genes for expression studies in Coffea arabica under different experimental conditions. BMC Mol. Biol. 2009, 10, 1. [Google Scholar] [CrossRef] [PubMed] [Green Version]
- Niu, K.; Shi, Y.; Ma, H. Selection of candidate reference genes for gene expression analysis in kentucky bluegrass (Poa pratensis L.) under abiotic stress. Front. Plant Sci. 2017, 8, 193. [Google Scholar] [CrossRef] [PubMed]
- Liu, Y.; Liu, J.; Xu, L.; Lai, H.; Chen, Y.; Yang, Z.; Huang, B. Identification and validation of reference genes for seashore paspalum response to abiotic stresses. Int. J. Mol. Sci. 2017, 18, 1322. [Google Scholar] [CrossRef] [PubMed] [Green Version]
- Niu, X.; Chen, M.; Huang, X.; Chen, H.; Tao, A.; Xu, J.; Qi, J. Reference gene selection for qRT-PCR normalization analysis in kenaf (Hibiscus cannabinus L.) under abiotic stress and hormonal stimuli. Front. Plant Sci. 2017, 8, 771. [Google Scholar] [CrossRef] [PubMed] [Green Version]
- Wu, J.; Zhang, H.; Liu, L.; Li, W.; Wei, Y.; Shi, S. Validation of reference genes for RT-qPCR studies of gene expression in preharvest and postharvest longan fruits under different experimental conditions. Front. Plant Sci. 2016, 7, 780. [Google Scholar] [CrossRef] [PubMed] [Green Version]
- Duan, M.; Wang, J.; Zhang, X.; Yang, H.; Wang, H.; Qiu, Y.; Song, J.; Guo, Y.; Li, X. Identification of optimal reference genes for expression analysis in radish (Raphanus sativus L.) and its relatives based on expression stability. Front. Plant Sci. 2017, 8, 1605. [Google Scholar] [CrossRef] [Green Version]
- Wan, H.; Zhao, Z.; Qian, C.; Sui, Y.; Malik, A.A.; Chen, J. Selection of appropriate reference genes for gene expression studies by quantitative real-time polymerase chain reaction in cucumber. Anal. Biochem. 2010, 399, 257–261. [Google Scholar] [CrossRef]
- Tian, C.; Jiang, Q.; Wang, F.; Wang, G.L.; Xu, Z.S.; Xiong, A.S. Selection of suitable reference genes for qPCR normalization under abiotic stresses and hormone stimuli in carrot leaves. PLoS ONE 2015, 10, e0117569. [Google Scholar] [CrossRef] [Green Version]
- Zhang, S.; Zeng, Y.; Yi, X.; Zhang, Y. Selection of suitable reference genes for quantitative RT-PCR normalization in the halophyte Halostachys caspica under salt and drought stress. Sci. Rep. 2016, 6, 30363. [Google Scholar] [CrossRef] [Green Version]
- Liu, H.H.; Tian, X.; Li, Y.J.; Wu, C.A.; Zheng, C.C. Microarray-based analysis of stress-regulated microRNAs in Arabidopsis thaliana. RNA 2008, 14, 836–843. [Google Scholar] [CrossRef] [PubMed] [Green Version]
- Jia, X.; Wang, W.X.; Ren, L.; Chen, Q.J.; Mendu, V.; Willcut, B.; Dinkins, R.; Tang, X.; Tang, G. Differential and dynamic regulation of mir398 in response to aba and salt stress in Populus tremula and Arabidopsis thaliana. Plant Mol. Biol. 2009, 71, 51–59. [Google Scholar] [CrossRef] [PubMed]
- Zhang, L.W.; Song, J.B.; Shu, X.X.; Zhang, Y.; Yang, Z.M. Mir395 is involved in detoxification of cadmium in Brassica napus. J. Hazard. Mater. 2013, 250, 204–211. [Google Scholar] [CrossRef] [PubMed]
- Ma, C.L.; Qi, Y.P.; Liang, W.W.; Yang, L.T.; Lu, Y.B.; Guo, P.; Ye, X.; Chen, L.S. MicroRNA regulatory mechanisms on Citrus sinensis leaves to magnesium-deficiency. Front. Plant Sci. 2016, 7, 201. [Google Scholar] [CrossRef] [PubMed] [Green Version]
- Mutum, R.D.; Kumar, S.; Balyan, S.; Kansal, S.; Mathur, S.; Raghuvanshi, S. Identification of novel miRNAs from drought tolerant rice variety nagina 22. Sci. Rep. 2016, 6, 30786. [Google Scholar] [CrossRef] [Green Version]
- Xie, R.; Zhang, J.; Ma, Y.; Pan, X.; Dong, C.; Pang, S.; He, S.; Deng, L.; Yi, S.; Zheng, Y.; et al. Combined analysis of mRNA and miRNA identifies dehydration and salinity responsive key molecular players in citrus roots. Sci. Rep. 2017, 7, 42094. [Google Scholar] [CrossRef] [Green Version]
- Naqvi, A.R.; Haq, Q.M.; Mukherjee, S.K. MicroRNA profiling of tomato leaf curl new delhi virus (tolcndv) infected tomato leaves indicates that deregulation of mir159/319 and mir172 might be linked with leaf curl disease. Virol. J. 2010, 7, 281. [Google Scholar] [CrossRef] [Green Version]
- Varallyay, E.; Valoczi, A.; Agyi, A.; Burgyan, J.; Havelda, Z. Plant virus-mediated induction of mir168 is associated with repression of argonaute1 accumulation. EMBO J. 2010, 29, 3507–3519. [Google Scholar] [CrossRef] [Green Version]
- Wu, J.; Yang, R.; Yang, Z.; Yao, S.; Zhao, S.; Wang, Y.; Li, P.; Song, X.; Jin, L.; Zhou, T.; et al. ROS accumulation and antiviral defence control by microRNA528 in rice. Nat. Plants 2017, 3, 16203. [Google Scholar] [CrossRef]
- Perez-Quintero, A.L.; Quintero, A.; Urrego, O.; Vanegas, P.; Lopez, C. Bioinformatic identification of cassava miRNAs differentially expressed in response to infection by Xanthomonas axonopodis pv. Manihotis. BMC Plant Biol. 2012, 12, 29. [Google Scholar] [CrossRef] [Green Version]
- Kurubanjerdjit, N.; Tsai, J.J.; Huang, C.H.; Ng, K.L. Disturbance of Arabidopsis thaliana microrna-regulated pathways by xcc bacterial effector proteins. Amino Acids 2014, 46, 953–961. [Google Scholar] [CrossRef] [PubMed]
- Ma, C.; Lu, Y.; Bai, S.; Zhang, W.; Duan, X.; Meng, D.; Wang, Z.; Wang, A.; Zhou, Z.; Li, T. Cloning and characterization of miRNAs and their targets, including a novel miRNA-targeted NBS-LRR protein class gene in apple (golden delicious). Mol. Plant 2014, 7, 218–230. [Google Scholar] [CrossRef] [PubMed] [Green Version]
- Baldrich, P.; Campo, S.; Wu, M.T.; Liu, T.T.; Hsing, Y.I.; San Segundo, B. MicroRNA-mediated regulation of gene expression in the response of rice plants to fungal elicitors. RNA Biol. 2015, 12, 847–863. [Google Scholar] [CrossRef] [PubMed] [Green Version]
- Luan, Y.; Cui, J.; Wang, W.; Meng, J. Mir1918 enhances tomato sensitivity to Phytophthora infestans infection. Sci. Rep. 2016, 6, 35858. [Google Scholar] [CrossRef] [PubMed] [Green Version]
- Bartel, D.P. MicroRNAs: Target recognition and regulatory functions. Cell 2009, 136, 215–233. [Google Scholar] [CrossRef] [Green Version]
- Zhang, B.; Pan, X.; Cobb, G.P.; Anderson, T.A. Plant microRNA: A small regulatory molecule with big impact. Dev. Biol. 2006, 289, 3–16. [Google Scholar] [CrossRef]
- Selvey, S.; Thompson, E.; Matthaei, K.; Lea, R.; Irving, M.; Griffiths, L. β-Actin-an unsuitable internal control for RT-PCR. Mol. Cell. Probes 2001, 15, 307–311. [Google Scholar] [CrossRef]
- Gutierrez, L.; Mauriat, M.; Guenin, S.; Pelloux, J.; Lefebvre, J.F.; Louvet, R.; Rusterucci, C.; Moritz, T.; Guerineau, F.; Bellini, C.; et al. The lack of a systematic validation of reference genes: A serious pitfall undervalued in reverse transcription-polymerase chain reaction (RT-PCR) analysis in plants. Plant Biotechnol. J. 2008, 6, 609–618. [Google Scholar] [CrossRef] [Green Version]
- Ambroise, V.; Legay, S.; Guerriero, G.; Hausman, J.F.; Cuypers, A.; Sergeant, K. Selection of appropriate reference genes for gene expression analysis under abiotic stresses in Salix viminalis. Int. J. Mol. Sci. 2019, 20, 4210. [Google Scholar] [CrossRef] [Green Version]
- Cao, A.; Shao, D.; Cui, B.; Tong, X.; Zheng, Y.; Sun, J.; Li, H. Screening the reference genes for quantitative gene expression by RT-qPCR during se initial dedifferentiation in four Gossypium hirsutum cultivars that have different se capability. Genes 2019, 10, 497. [Google Scholar] [CrossRef] [Green Version]
- Turner, M.; Nizampatnam, N.R.; Baron, M.; Coppin, S.; Damodaran, S.; Adhikari, S.; Arunachalam, S.P.; Yu, O.; Subramanian, S. Ectopic expression of mir160 results in auxin hypersensitivity, cytokinin hyposensitivity, and inhibition of symbiotic nodule development in soybean. Plant Physiol. 2013, 162, 2042–2055. [Google Scholar] [CrossRef] [PubMed] [Green Version]
- Nizampatnam, N.R.; Schreier, S.J.; Damodaran, S.; Adhikari, S.; Subramanian, S. MicroRNA160 dictates stage-specific auxin and cytokinin sensitivities and directs soybean nodule development. Plant J. 2015, 84, 140–153. [Google Scholar] [CrossRef] [PubMed]
- Liu, Z.; Li, J.; Wang, L.; Li, Q.; Lu, Q.; Yu, Y.; Li, S.; Bai, M.Y.; Hu, Y.; Xiang, F. Repression of callus initiation by the miRNA-directed interaction of auxin-cytokinin in Arabidopsis thaliana. Plant J. 2016, 87, 391–402. [Google Scholar] [CrossRef] [PubMed]
- Xie, Z.; Kasschau, K.D.; Carrington, J.C. Negative feedback regulation of dicer-like1 in Arabidopsis by microRNA-guided mRNA degradation. Curr. Biol. 2003, 13, 784–789. [Google Scholar] [CrossRef] [Green Version]
- Hirsch, J.; Lefort, V.; Vankersschaver, M.; Boualem, A.; Lucas, A.; Thermes, C.; d’Aubenton-Carafa, Y.; Crespi, M. Characterization of 43 non-protein-coding mRNA genes in Arabidopsis, including the mir162a-derived transcripts. Plant Physiol. 2006, 140, 1192–1204. [Google Scholar] [CrossRef] [Green Version]
- Shao, F.; Qiu, D.; Lu, S. Comparative analysis of the dicer-like gene family reveals loss of mir162 target site in smdcl1 from Salvia miltiorrhiza. Sci. Rep. 2015, 5, 9891. [Google Scholar] [CrossRef] [Green Version]
- Eichmeier, A.; Kiss, T.; Penazova, E.; Pecenka, J.; Berraf-Tebbal, A.; Baranek, M.; Pokluda, R.; Cechova, J.; Gramaje, D.; Grzebelus, D. MicroRNAs in Vitis vinifera cv. Chardonnay are differentially expressed in response to diaporthe species. Genes 2019, 10, 905. [Google Scholar] [CrossRef] [Green Version]
- Becker, C.; Hammerle-Fickinger, A.; Riedmaier, I.; Pfaffl, M.W. mRNA and microRNA quality control for RT-qPCR analysis. Methods 2010, 50, 237–243. [Google Scholar] [CrossRef]
- Sirover, M.A. On the functional diversity of glyceraldehyde-3-phosphate dehydrogenase: Biochemical mechanisms and regulatory control. Biochim. Biophys. Acta 2011, 1810, 741–751. [Google Scholar] [CrossRef]
- Tristan, C.; Shahani, N.; Sedlak, T.W.; Sawa, A. The diverse functions of GAPDH: Views from different subcellular compartments. Cell. Signal. 2011, 23, 317–323. [Google Scholar] [CrossRef] [Green Version]
- Sirover, M.A. Subcellular dynamics of multifunctional protein regulation: Mechanisms of GAPDH intracellular translocation. J. Cell. Biochem. 2012, 113, 2193–2200. [Google Scholar] [CrossRef] [PubMed] [Green Version]
- Yan, J.; Yuan, F.; Long, G.; Qin, L.; Deng, Z. Selection of reference genes for quantitative real-time RT-PCR analysis in citrus. Mol. Biol. Rep. 2012, 39, 1831–1838. [Google Scholar] [CrossRef] [PubMed]
- Sinha, P.; Saxena, R.K.; Singh, V.K.; Krishnamurthy, L.; Varshney, R.K. Selection and validation of housekeeping genes as reference for gene expression studies in pigeonpea (Cajanus cajan) under heat and salt stress conditions. Front. Plant Sci. 2015, 6, 1071. [Google Scholar] [CrossRef] [PubMed] [Green Version]
- Martins, P.K.; Mafra, V.; de Souza, W.R.; Ribeiro, A.P.; Vinecky, F.; Basso, M.F.; da Cunha, B.A.; Kobayashi, A.K.; Molinari, H.B. Selection of reliable reference genes for RT-qPCR analysis during developmental stages and abiotic stress in Setaria viridis. Sci. Rep. 2016, 6, 28348. [Google Scholar] [CrossRef] [PubMed] [Green Version]
- Zhang, Y.; Han, X.; Chen, S.; Zheng, L.; He, X.; Liu, M.; Qiao, G.; Wang, Y.; Zhuo, R. Selection of suitable reference genes for quantitative real-time PCR gene expression analysis in Salix matsudana under different abiotic stresses. Sci. Rep. 2017, 7, 40290. [Google Scholar] [CrossRef] [PubMed] [Green Version]
- Zhou, B.; Chen, P.; Khan, A.; Zhao, Y.; Chen, L.; Liu, D.; Liao, X.; Kong, X.; Zhou, R. Candidate reference genes selection and application for RT-qPCR analysis in kenaf with cytoplasmic male sterility background. Front. Plant Sci. 2017, 8, 1520. [Google Scholar] [CrossRef] [Green Version]
- Zeng, L.; Deng, R.; Guo, Z.; Yang, S.; Deng, X. Genome-wide identification and characterization of glyceraldehyde-3-phosphate dehydrogenase genes family in wheat (Triticum aestivum). BMC Genom. 2016, 17, 240. [Google Scholar] [CrossRef] [Green Version]
- Dunnett, H.; van der Meer, D.; Williams, A.G. Evaluation of stem-loop reverse transcription and poly-A tail extension in microRNA analysis of body fluids. MicroRNA 2015, 3, 150–154. [Google Scholar] [CrossRef] [Green Version]
- Kantar, M.; Lucas, S.J.; Budak, H. miRNA expression patterns of Triticum dicoccoides in response to shock drought stress. Planta 2011, 233, 471–484. [Google Scholar] [CrossRef]


| Gene Name | Forward Primer | Reverse Primer | Efficiency (E) (%) | r | Gene Type | Reference |
|---|---|---|---|---|---|---|
| st-miR162-3p | GCGGGCTCGATAAACCTCTGC | GTGCAGGGTCCGAGGT | 104.7 | 0.9999 | miRNA | |
| st-miR166b | AGCGGTCGGACCAGGCTTCAT | GTGCAGGGTCCGAGGT | 87.51 | 0.9976 | miRNA | [31] |
| st-miR396a | CGCGGCTTCCACAGCTTTCTT | GTGCAGGGTCCGAGGT | 86.84 | 0.9988 | miRNA | |
| st-miR472 | CGCGGCTTTTCCCACACCTCC | GTGCAGGGTCCGAGGT | 94.17 | 0.9975 | miRNA | |
| st-miR482b | TCATCTCTTGCCCACCCCTCC | GTGCAGGGTCCGAGGT | 99.57 | 0.998 | miRNA | |
| st-miR3954 | GCGGCGTGGACAGAGAAATCA | GTGCAGGGTCCGAGGT | 87.73 | 0.9992 | miRNA | |
| st-miR403 | GTCGGCTTAGATTCACGCACA | GTGCAGGGTCCGAGGT | 87.86 | 0.9965 | miRNA | |
| st-miR160 | GCGTCGGCCTGGCTCCCTGTA | GTGCAGGGTCCGAGGT | 89.46 | 0.9962 | miRNA | [30,67] |
| csi-miR162-3p | TCGATAAACCTCTGCATCCAG | GATCGCCCTTCTACGTCTAT | 103.00 | 0.9730 | miRNA | |
| csi-miR166b | TCGGACCAGGCTTCATTCCCGT | GATCGCCCTTCTACGTCTAT | 102.51 | 0.9752 | miRNA | |
| csi-miR396a | TTCCACAGCTTTCTTGAACTG | GATCGCCCTTCTACGTCTAT | 99.31 | 0.9912 | miRNA | |
| csi-miR472 | TTTTCCCACACCTCCCATCCC | GATCGCCCTTCTACGTCTAT | 99.30 | 0.9869 | miRNA | |
| csi-miR482b | TCTTGCCCACCCCTCCCATTCC | GATCGCCCTTCTACGTCTAT | 103.59 | 0.9918 | miRNA | |
| csi-miR3954 | TGGACAGAGAAATCACGGTCA | GATCGCCCTTCTACGTCTAT | 99.73 | 0.9896 | miRNA | |
| csi-miR403 | TTAGATTCACGCACAAACTCG | GATCGCCCTTCTACGTCTAT | 103.06 | 0.9968 | miRNA | |
| csi-miR160 | GCCTGGCTCCCTGTATGCCAT | GATCGCCCTTCTACGTCTAT | 101.15 | 0.9878 | miRNA | |
| Csi-U4 * | GCAATGACGCAGCTTATGAGG | CAAAGGGAGCCCTTCCAGAA | 88.64 | 0.9936 | Non-coding RNA | [52] |
| Csi-U5 * | GTGGGCACAGAGCGAACTAT | CGAAGAGAAACCCTCCAAAAA | 89.57 | 0.9978 | Non-coding RNA | [52] |
| Csi-U6 * | ACAGAGAAGATTAGCATGGCC | GACCAATTCTCGATTTGTGCG | 91.56 | 0.9999 | Non-coding RNA | [52] |
| Csi-snoR14 | TTCATGTCTGTCAATCCACTG | AACCTGTCGGGATTCAAGATA | 93.25 | 0.9958 | Non-coding RNA | [52] |
| CsACT1 | ACGCTATCCTTCGTCTTG | GCTTCTCCTTCATATCCCT | 102.25 | 0.9732 | Protein coding RNA | [68] |
| CsACT2 | AGTGCTTGATGGGTGAGTTC | GCAAGGAAGACGGTTGAGTA | 96.29 | 0.9979 | Protein coding RNA | [69] |
| CsEF1α | TGACTGTGCCGTCCTTATC | TCATCGTACCTAGCCTTTG | 103.8 | 0.9796 | Protein coding RNA | [68,70,71] |
| CsGAPDH | CCGTCTGCGATGTTCCACT | TCCAATGGGTCTCCGCTTCC | 91.55 | 0.9972 | Protein coding RNA | [72,73] |
| CsPP2A | TCGTAATCCGCAACCCTAT | ACGGCATCGTTTCACTCTAA | 97.87 | 0.9942 | Protein coding RNA | [74,75] |
| CsTUA5 | CTATCTACCCTTCTCCTCAG | TTAGTGTAAGTTGGCCTCT | 97.79 | 0.9917 | Protein coding RNA | [76,77] |
| CsTUB4 | ATCCCGCCTAAGGGTCTG | CTCGGTGAACTCCATCTCG | 98.64 | 0.9923 | Protein coding RNA | [78,79] |
| CsUBC28 | GGTAGCATTTGCCTTGATA | GCAGTGACCTAACCCATT | 103.65 | 0.9988 | Protein coding RNA | [52,80] |
| Ranking | Delta Ct | BestKeeper | NormFinder | geNorm | RefFinder | Delta Ct | BestKeeper | Normfinder | geNorm | RefFinder |
|---|---|---|---|---|---|---|---|---|---|---|
| 1 | miR162-3p | st-miR472 | miR162-3p | UBC28 | miR162-3p | miR403 | miR162-3p | miR403 | miR162-3p | miR162-3p |
| 2 | miR472 | miR160 | miR472 | miR166b | miR472 | miR428b | miR472 | miR428b | miR472 | miR403 |
| 3 | miR160 | st-miR428b | miR160 | miR472 | miR160 | miR162-3p | st-miR166b | miR160 | miR428b | miR472 |
| 4 | st-miR428b | miR166b | st-miR428b | miR162-3p | miR166b | miR160 | miR160 | miR162-3p | miR403 | miR428b |
| 5 | st-miR472 | miR472 | st-miR472 | miR160 | st-miR472 | st-miR472 | miR166b | st-miR472 | miR160 | miR160 |
| 6 | UBC28 | miR428b | UBC28 | miR428b | UBC28 | miR472 | miR403 | UBC28 | st-miR166b | st-miR472 |
| 7 | miR166b | miR162-3p | miR166b | ACTIN2 | st-miR428b | UBC28 | miR428b | miR472 | st-miR472 | st-miR166b |
| 8 | miR428b | miR396a | miR428b | miR396a | miR428b | PP2A | st-miR472 | PP2A | PP2A | UBC28 |
| 9 | miR396a | snoR14 | miR396a | st-miR472 | miR396a | st-miR166b | UBC28 | st-miR162-3p | UBC28 | PP2A |
| 10 | ACTIN2 | ACTIN2 | ACTIN2 | st-miR428b | ACTIN2 | st-miR162-3p | PP2A | st-miR428b | st-miR403 | miR166b |
| 11 | st-miR166b | st-miR166b | st-miR166b | miR403 | st-miR166b | st-miR428b | st-miR403 | st-miR166b | st-miR162-3p | st-miR162-3p |
| 12 | st-miR396a | UBC28 | st-miR396a | U4 | st-miR396a | st-miR403 | st-miR160 | st-miR403 | st-miR428b | st-miR403 |
| 13 | miR403 | st-miR396a | miR403 | st-miR166b | snoR14 | miR396a | st-miR428b | miR396a | miR166b | st-miR428b |
| 14 | U4 | U4 | U4 | st-miR396a | U4 | miR166b | st-miR162-3p | miR166b | miR396a | miR396a |
| 15 | snoR14 | miR3954 | snoR14 | snoR14 | miR403 | st-miR396a | miR396a | st-miR396a | st-miR396a | st-miR396a |
| 16 | PP2A | st-miR3954 | PP2A | PP2A | EF1a | EF1a | EF1a | EF1a | st-miR160 | EF1a |
| 17 | EF1a | EF1a | EF1a | EF1a | PP2A | ACTIN2 | st-miR396a | ACTIN2 | EF1a | st-miR160 |
| 18 | TUB4 | st-miR160 | TUB4 | st-miR160 | st-miR160 | TUA5 | snoR14 | TUA5 | st-miR3954 | ACTIN2 |
| 19 | st-miR160 | U6 | st-miR160 | TUB4 | miR3954 | st-miR160 | ACTIN2 | miR3954 | miR3954 | TUA5 |
| 20 | miR3954 | miR403 | miR3954 | miR3954 | TUB4 | miR3954 | U6 | st-miR160 | ACTIN2 | miR3954 |
| 21 | st-miR403 | PP2A | ACTIN1 | st-miR403 | st-miR3954 | st-miR3954 | TUA5 | st-miR3954 | TUA5 | st-miR3954 |
| 22 | st-miR3954 | TUB4 | st-miR403 | st-miR3954 | st-miR403 | snoR14 | U4 | snoR14 | U6 | snoR14 |
| 23 | ACTIN1 | ACTIN1 | st-miR3954 | st-miR162-3p | ACTIN1 | U4 | st-miR3954 | TUB4 | U4 | U6 |
| 24 | st-miR162-3p | st-miR403 | st-miR162-3p | ACTIN1 | U6 | TUB4 | miR3954 | U4 | snoR14 | U4 |
| 25 | U6 | st-miR162-3p | U6 | U6 | st-miR162-3p | U6 | TUB4 | U6 | TUB4 | TUB4 |
| 26 | TUA5 | TUA5 | TUA5 | TUA5 | TUA5 | ACTIN1 | U5 | ACTIN1 | ACTIN1 | ACTIN1 |
| 27 | U5 | U5 | U5 | U5 | U5 | U5 | ACTIN1 | U5 | U5 | U5 |
| 28 | GAPDH | GAPDH | GAPDH | GAPDH | GAPDH | GAPDH | GAPDH | GAPDH | GAPDH | GAPDH |
| Geo Mean (Ct) | AR Mean (Ct) | Min (Ct) | Max (Ct) | Std dev (± Ct) | CV (% Ct) | Min (x-fold) | Max (x-fold) | Std. dev. (± x-fold) | Coeff. of corr. (r) | p-Value | |
|---|---|---|---|---|---|---|---|---|---|---|---|
| U4 | 12.57 | 12.61 | 9.83 | 14.11 | 0.83 | 6.6 | −6.66 | 2.92 | 1.78 | 0.669 | 0.005 |
| U5 | 10.96 | 11.08 | 8.38 | 14.76 | 1.44 | 12.95 | −5.97 | 13.96 | 2.7 | 0.555 | 0.026 |
| U6 | 12.66 | 12.72 | 9.16 | 14.35 | 0.96 | 7.53 | −11.29 | 3.23 | 1.94 | 0.271 | 0.309 |
| snoR14 | 16.37 | 16.41 | 13.75 | 18.08 | 0.74 | 4.53 | −6.16 | 3.27 | 1.67 | 0.58 | 0.019 |
| ACTIN2 | 20.2 | 20.22 | 18.86 | 21.93 | 0.75 | 3.7 | −2.54 | 3.31 | 1.68 | 0.447 | 0.083 |
| ACTIN1 | 24.03 | 24.07 | 21.96 | 27.39 | 1.04 | 4.31 | −4.19 | 10.29 | 2.05 | 0.556 | 0.025 |
| UBC28 | 19.91 | 19.93 | 18.82 | 22.28 | 0.78 | 3.93 | −2.12 | 5.18 | 1.72 | 0.769 | 0.001 |
| TUA5 | 21.16 | 21.22 | 18.06 | 25.37 | 1.17 | 5.5 | −8.6 | 18.45 | 2.25 | 0.575 | 0.02 |
| EF1a | 22.7 | 22.73 | 20.06 | 25.12 | 0.94 | 4.12 | −6.24 | 5.35 | 1.91 | 0.575 | 0.02 |
| TUB4 | 23.13 | 23.17 | 21.15 | 26.01 | 1.02 | 4.39 | −3.94 | 7.36 | 2.02 | 0.632 | 0.009 |
| GAPDH | 20.23 | 20.33 | 18.11 | 25.3 | 1.74 | 8.57 | −4.34 | 33.66 | 3.35 | 0.582 | 0.018 |
| PP2A | 23.44 | 23.47 | 21.71 | 27.04 | 0.97 | 4.14 | −3.31 | 12.13 | 1.96 | 0.754 | 0.001 |
| miR162-3p | 18.17 | 18.19 | 17.18 | 19.18 | 0.67 | 3.68 | −1.99 | 2.01 | 1.59 | 0.809 | 0.001 |
| miR396a | 13.53 | 13.56 | 11.7 | 15.1 | 0.73 | 5.35 | −3.57 | 2.96 | 1.65 | 0.584 | 0.018 |
| miR428b | 14.71 | 14.73 | 13.13 | 16.71 | 0.66 | 4.5 | −2.99 | 4 | 1.58 | 0.535 | 0.033 |
| miR160 | 19.71 | 19.72 | 18.7 | 20.99 | 0.48 | 2.43 | −2.01 | 2.43 | 1.39 | 0.621 | 0.01 |
| miR403 | 17.04 | 17.08 | 15.36 | 19.28 | 0.97 | 5.69 | −3.2 | 4.73 | 1.96 | 0.709 | 0.002 |
| miR472 | 14.5 | 14.52 | 12.81 | 15.87 | 0.61 | 4.17 | −3.23 | 2.58 | 1.52 | 0.685 | 0.003 |
| miR166b | 19.87 | 19.89 | 18.82 | 22.23 | 0.58 | 2.91 | −2.07 | 5.13 | 1.49 | 0.668 | 0.005 |
| miR3954 | 19.93 | 19.96 | 18.16 | 22.27 | 0.87 | 4.38 | −3.41 | 5.06 | 1.83 | 0.249 | 0.352 |
| st-miR472 | 22.55 | 22.55 | 21.61 | 23.75 | 0.42 | 1.86 | −1.91 | 2.3 | 1.34 | 0.331 | 0.21 |
| st-miR428b | 25.41 | 25.42 | 24.01 | 27.08 | 0.51 | 2 | −2.65 | 3.18 | 1.42 | 0.543 | 0.03 |
| st-miR396a | 20.34 | 20.36 | 18.96 | 22.38 | 0.81 | 3.99 | −2.6 | 4.11 | 1.76 | 0.458 | 0.075 |
| st-miR166b | 23.78 | 23.8 | 22.79 | 25.58 | 0.75 | 3.15 | −1.99 | 3.48 | 1.68 | 0.387 | 0.138 |
| st-miR3954 | 27.93 | 27.95 | 25.65 | 30.44 | 0.92 | 3.28 | −4.85 | 5.71 | 1.89 | 0.153 | 0.573 |
| st-miR160 | 36.04 | 36.06 | 34.41 | 39.03 | 0.96 | 2.65 | −3.09 | 7.95 | 1.94 | 0.495 | 0.051 |
| st-miR162-3p | 28.09 | 28.13 | 25.83 | 31.31 | 1.12 | 4 | −4.79 | 9.32 | 2.18 | 0.438 | 0.089 |
| st-miR403 | 23.02 | 23.06 | 21.61 | 26.97 | 1.04 | 4.52 | −2.67 | 15.41 | 2.06 | 0.421 | 0.105 |
| Geo Mean (Ct) | AR Mean (Ct) | Min (Ct) | Max (Ct) | Std (± Ct) | CV (% Ct) | Min (x-fold) | Max (x-fold) | Std dev (± x-fold) | Coeff. of corr. (r) | p-Value | |
|---|---|---|---|---|---|---|---|---|---|---|---|
| U4 | 12.33 | 12.39 | 9.77 | 14.05 | 0.95 | 7.67 | −5.91 | 3.29 | 1.93 | 0.296 | 0.266 |
| U5 | 11.22 | 11.33 | 8.9 | 14.24 | 1.31 | 11.55 | −4.98 | 8.13 | 2.48 | 0.339 | 0.199 |
| U6 | 13.1 | 13.14 | 11.08 | 14.87 | 0.89 | 6.75 | −4.05 | 3.41 | 1.85 | 0.001 | 0.843 |
| snoR14 | 16.34 | 16.39 | 12.43 | 18.09 | 0.85 | 5.21 | −14.98 | 3.38 | 1.81 | 0.595 | 0.015 |
| ACTIN2 | 19.6 | 19.63 | 17.85 | 22.9 | 0.86 | 4.36 | −3.35 | 9.88 | 1.81 | 0.631 | 0.009 |
| ACTIN1 | 24.38 | 24.44 | 21.91 | 28.04 | 1.53 | 6.26 | −5.54 | 12.65 | 2.89 | 0.694 | 0.003 |
| UBC28 | 19.81 | 19.83 | 17.01 | 20.56 | 0.5 | 2.52 | −6.96 | 1.68 | 1.41 | 0.803 | 0.001 |
| TUA5 | 21.42 | 21.46 | 18.22 | 24.45 | 0.9 | 4.18 | −9.21 | 8.15 | 1.86 | 0.722 | 0.002 |
| EF1a | 23.08 | 23.11 | 20.77 | 25.58 | 0.79 | 3.44 | −4.97 | 5.65 | 1.73 | 0.579 | 0.019 |
| TUB4 | 23.06 | 23.12 | 19.95 | 26.8 | 1.11 | 4.8 | −8.65 | 13.34 | 2.16 | 0.823 | 0.001 |
| GAPDH | 20.29 | 20.43 | 18.14 | 27.17 | 1.95 | 9.54 | −4.43 | 117.99 | 3.86 | 0.506 | 0.046 |
| PP2A | 23.11 | 23.13 | 20.37 | 23.8 | 0.5 | 2.18 | −6.69 | 1.61 | 1.42 | 0.706 | 0.002 |
| miR162−3p | 18.58 | 18.58 | 18.03 | 19.46 | 0.25 | 1.33 | −1.46 | 1.84 | 1.19 | 0.415 | 0.11 |
| miR396a | 14.75 | 14.78 | 13.18 | 16.98 | 0.78 | 5.28 | −2.97 | 4.7 | 1.72 | 0.698 | 0.003 |
| miR428b | 15.88 | 15.89 | 14.52 | 17.02 | 0.44 | 2.77 | −2.56 | 2.21 | 1.36 | 0.687 | 0.003 |
| miR160 | 20.49 | 20.49 | 19.31 | 21.16 | 0.42 | 2.07 | −2.26 | 1.6 | 1.34 | 0.627 | 0.009 |
| miR403 | 17.35 | 17.36 | 15.93 | 18.43 | 0.44 | 2.52 | −2.68 | 2.11 | 1.35 | 0.851 | 0.001 |
| miR472 | 15.37 | 15.37 | 14.92 | 16.06 | 0.26 | 1.66 | −1.36 | 1.62 | 1.19 | 0.206 | 0.444 |
| miR166b | 20.23 | 20.23 | 19.09 | 21.29 | 0.43 | 2.15 | −2.2 | 2.09 | 1.35 | 0.04 | 0.883 |
| miR3954 | 19.57 | 19.61 | 17.6 | 21.07 | 1.04 | 5.29 | −3.93 | 2.82 | 2.05 | 0.496 | 0.051 |
| St-miR472 | 23.4 | 23.41 | 22.19 | 24.36 | 0.45 | 1.93 | −2.31 | 1.94 | 1.37 | 0.54 | 0.031 |
| St-miR428b | 26.71 | 26.72 | 25.72 | 27.79 | 0.68 | 2.54 | −1.98 | 2.12 | 1.6 | 0.43 | 0.097 |
| st-miR396a | 21.46 | 21.48 | 20.01 | 23.24 | 0.83 | 3.86 | −2.73 | 3.43 | 1.78 | 0.389 | 0.136 |
| st-miR166b | 24.32 | 24.32 | 23.32 | 25.46 | 0.41 | 1.67 | −2 | 2.21 | 1.33 | 0.18 | 0.504 |
| st-miR3954 | 27.97 | 27.99 | 25.9 | 30 | 0.99 | 3.52 | −4.18 | 4.09 | 1.98 | 0.315 | 0.235 |
| st-miR160 | 36.87 | 36.88 | 34.82 | 38.74 | 0.65 | 1.77 | −4.14 | 3.65 | 1.57 | 0.001 | 0.928 |
| st-miR162-3p | 28.92 | 28.93 | 26.95 | 30.16 | 0.7 | 2.44 | −3.91 | 2.36 | 1.63 | 0.648 | 0.007 |
| st-miR403 | 23.52 | 23.53 | 22.27 | 24.53 | 0.6 | 2.53 | −2.38 | 2.01 | 1.51 | 0.348 | 0.187 |
| Ranking | Sweet Orange | Ponkan | Protein Coding | |||
|---|---|---|---|---|---|---|
| Poly(A) RT | Stem-loop RT | Poly(A) RT | Stem-Loop RT | Sweet Orange | Ponkan | |
| 1 | miR162-3p | st-miR396a | miR160 | st-miR472 | UBC28 | UBC28 |
| 2 | miR160 | st-miR162-3p | miR162-3p | st-miR403 | PP2A | PP2A |
| 3 | miR472 | st-miR166b | miR472 | st-miR162-3p | EF1a | EF1a |
| 4 | miR166b | st-miR472 | miR403 | st-miR166b | ACTIN2 | TUA5 |
| 5 | miR396a | st-miR428b | miR428b | st-miR160 | ACTIN1 | ACTIN2 |
| 6 | miR428b | st-miR403 | miR166b | st-miR428b | TUB4 | TUB4 |
| 7 | miR403 | st-miR160 | miR396a | st-miR396a | TUA5 | ACTIN1 |
| 8 | miR3954 | st-miR3954 | miR3954 | st-miR3954 | GAPDH | GAPDH |
© 2019 by the authors. Licensee MDPI, Basel, Switzerland. This article is an open access article distributed under the terms and conditions of the Creative Commons Attribution (CC BY) license (http://creativecommons.org/licenses/by/4.0/).
Share and Cite
Lyu, S.; Yu, Y.; Xu, S.; Cai, W.; Chen, G.; Chen, J.; Pan, D.; She, W. Identification of Appropriate Reference Genes for Normalizing miRNA Expression in Citrus Infected by Xanthomonas citri subsp. citri. Genes 2020, 11, 17. https://doi.org/10.3390/genes11010017
Lyu S, Yu Y, Xu S, Cai W, Chen G, Chen J, Pan D, She W. Identification of Appropriate Reference Genes for Normalizing miRNA Expression in Citrus Infected by Xanthomonas citri subsp. citri. Genes. 2020; 11(1):17. https://doi.org/10.3390/genes11010017
Chicago/Turabian StyleLyu, Shiheng, Ying Yu, Shirong Xu, Weiwei Cai, Guixin Chen, Jianjun Chen, Dongming Pan, and Wenqin She. 2020. "Identification of Appropriate Reference Genes for Normalizing miRNA Expression in Citrus Infected by Xanthomonas citri subsp. citri" Genes 11, no. 1: 17. https://doi.org/10.3390/genes11010017