Article

SNP Diversity in CD14 Gene Promoter Suggests Adaptation Footprints in Trypanosome Tolerant N’Dama (Bos taurus) but not in Susceptible White Fulani (Bos indicus) Cattle

by
Olanrewaju B. Morenikeji
1,
Anna L. Capria
1,
Olusola Ojurongbe
2 and
Bolaji N. Thomas
1,*
1
Department of Biomedical Sciences, Rochester Institute of Technology, Rochester, NY 14623, USA
2
Department of Medical Microbiology and Parasitology, Ladoke Akintola University of Technology, Osogbo P.M.B 4000, Nigeria
*
Author to whom correspondence should be addressed.
Genes 2020, 11(1), 112; https://doi.org/10.3390/genes11010112
Submission received: 5 December 2019 / Revised: 23 December 2019 / Accepted: 13 January 2020 / Published: 19 January 2020
(This article belongs to the Section Animal Genetics and Genomics)

Abstract

:
Immune response to infections has been shown to be mediated by genetic diversity in pattern recognition receptors, leading to disease tolerance or susceptibility. We elucidated naturally occurring variations within the bovine CD14 gene promoter in trypanosome-tolerant (N’Dama) and susceptible (White Fulani) cattle, with genomic and computational approaches. Blood samples were collected from White Fulani and N’Dama cattle, genomic DNA extracted and the entire promoter region of the CD14 gene amplified by PCR. We sequenced this region and performed in silico computation to identify SNP variants, transcription factor binding sites, as well as micro RNAs in the region. CD14 promoter sequences were compared with the reference bovine genome from the Ensembl database to identify various SNPs. Furthermore, we validated three selected N’Dama specific SNPs using custom Taqman SNP genotyping assay for genetic diversity. In all, we identified a total of 54 and 41 SNPs at the CD14 promoter for N’Dama and White Fulani respectively, including 13 unique SNPs present in N’Dama only. The significantly higher SNP density at the CD14 gene promoter region in N’Dama may be responsible for disease tolerance, possibly an evolutionary adaptation. Our genotype analysis of the three loci selected for validation show that mutant alleles (A/A, C/C, and A/A) were adaptation profiles within disease tolerant N’Dama. A similar observation was made for our haplotype analysis revealing that haplotypes H1 (ACA) and H2 (ACG) were significant combinations within the population. The SNP effect prediction revealed 101 and 89 new transcription factor binding sites in N’Dama and White Fulani, respectively. We conclude that disease tolerant N’Dama possessing higher SNP density at the CD14 gene promoter and the preponderance of mutant alleles potentially confirms the significance of this promoter in immune response, which is lacking in susceptible White Fulani. We, therefore, recommend further in vitro and in vivo study of this observation in infected animals, as the next step for understanding genetic diversity relating to varying disease phenotypes in both breeds.

1. Introduction

In recent years, the increasing availability of extensive sequencing data for livestock species due to the reduction in genome sequencing cost has provided an opportunity for comprehensive elucidation of genetic diversity and selection sweeps among and between species [1,2]. Identification of single nucleotide polymorphisms (SNP) has been a beneficial strategy to unravel selection footprints within genomic regions that are potentially associated with phenotypic variation due to evolutionary adaptation [3]. Cattle breeds with differing genetic diversities have evolved due to different environmental pressures, including heat stress, infectious diseases, and harsh climate, to the end, developing unique gene variants or footprints of adaptation allowing them to cope with environmental or disease challenges [4,5,6]. It is now known that host response to pathogenic insults can result in adaptation or counter-adaptation, requiring the immune system to respond to intruding pathogens [5,7]. Some studies have shown that bovine disease tolerance comprises a better capacity to control parasitemia and limit anemia development [8,9], which we postulate to be the opposite in susceptible cattle breeds.
A proper innate immune response is imperative to overcome a pathogenic challenge or confer disease tolerance. Therefore, variants of the genes mediating innate immune pathway may play a crucial role in tolerance or susceptibility to disease. The cluster differentiation antigen 14 (CD14) gene serves as a pattern recognition receptor for lipopolysaccharide (LPS) and acts in concert with Toll-like receptors (TLRs) to facilitate detection of bacterial molecules [10]. CD14 is a 55kD glycosyl phosphatidylinositol-anchored surface protein majorly expressed on monocytes, polymorphonuclear leucocytes, and macrophages [11,12]. Published reports have revealed the importance of CD14 polymorphisms as candidates for studying diseases such as bovine tuberculosis and mastitis [13,14,15]. Studies have localized bovine health-related quantitative trait loci (QTL) to the genomic region of the CD14 loci [13,15]. In addition, results from malaria studies have shown CD14 promoter polymorphism to mediate an adaptive protective mechanism against severe disease [16,17], including regulation of parasitemia [18].
Cattle provide an important source of income to small-holder farmers in sub-Saharan Africa, however infectious diseases pose a major challenge to the industry through economic losses and concerns on human health [9,19]. Certain indigenous cattle breeds have acquired tolerance to a number of diseases through a better capacity to control parasitemia and limit anemia development [4,8]. An in-depth understanding of the genetic diversity inherent responsible for providing tolerance or susceptibility to indigenous breeds will provide an opportunity to elucidate mechanisms of resistance to trypanosomosis and develop marker-assistant selection strategies to develop more tolerant cattle. For example, N’Dama cattle (taurine) are naturally tolerant to the pathogenic consequences of trypanosomosis, by a better capacity to control parasitemia and limit anemia development, while White Fulani cattle (indicine) on the other hand, are comparatively more susceptible to disease development [4,6]. To initiate a proper innate immune response to infection, pattern recognition receptors such as CD14, and signaling molecules such as Toll-like receptors (TLR’s), are of significant importance, with the former presenting either as mCD14, expressed primarily on macrophages, dendritic cells and neutrophils, or sCD14 expressed in serum [20]. The expression regulation of CD14 gene is therefore critical for the recognition of bacterial lipopolysaccharide during innate immunity [13,15], particularly since CD14 mutant variant (-159T/T) expresses significantly higher soluble CD14 levels in serum than the homozygous or heterozygous genotypes [21]. We have utilized qualitative data on CD14 gene promoter to decipher immune response and susceptibility to malaria infection [18], showing a defective response by mutant variants, driving a cascade that worsens disease and multiple deleterious outcomes [22,23,24]. In addition, we have also shown that there are evolutionarily conserved microRNAs involved in the CD14-mediated immune response during bovine trypanosomosis [25], demonstrating their significance in regulating gene expression [26]. Hence, there is a need to identify and characterize naturally occurring variations within the bovine CD14 promoter of cattle breeds that may be associated with disease tolerance or susceptibility. To this end, we elucidated the signatures of adaptation within the CD14 gene promoter of trypanotolerant N’Dama and trypanosusceptible White Fulani cattle breeds.

2. Materials and Methods

2.1. Animal Sampling

We sampled at random a herd of apparently healthy animals (n = 40; ~4–5 years old, raised in the same location, fed the same food and similar environmental exposure), comprising of 25 trypanosusceptible White Fulani and 15 trypanotolerant N’Dama cattle from south-western Nigeria. Blood samples collected from these animals for routine monitoring, Teaching and Research farm, Federal University of Technology and Federal College of Agriculture, Akure were utilized for our study.

2.2. Genomic DNA Extraction, PCR, and DNA Sequencing

We extracted genomic DNA from 200µL of whole blood utilizing the Isolate II Genomic DNA extraction kit (Bioline USA Inc., Swedesboro, NJ, USA), following the manufacturer’s instructions; a final volume of 100 µL eluted DNA was stored at 4 °C until use and concentration was quantified with a spectrometer (PG Instruments Ltd, England, UK). Specific primer pairs were designed with Primer Express (version 4.0) to amplify the ~1.6 kB promoter region of bovine CD14 gene (Supplementary Table S1). Using primer pairs and EconoTaq Plus Green 2X PCR master mix (Lucigen Corporation, Middleton, WI, USA), we amplified 1 μL of genomic DNA, optimizing reactions to a final volume of 25 μL [16]. The PCR conditions were programmed as follows: 94 °C for 2 min, and 35 cycles of 94 °C for 30 s, 59 °C for 30 s, 72 °C for 50 s, then the final extension for 5 min at 72 °C. Five microliters of amplified products were examined and band size was determined with a GeneRuler 100bp Plus DNA ladder (Supplementary Table S1). Amplified PCR products (n = 40) were purified with QIAquick PCR purification kit (Qiagen Inc., Valencia, CA, USA), and 2 μL of purified products were prepared for Sanger sequencing (Genewiz, South Plainfield, NJ, USA).

2.3. Sequence Processing and Alignment

Gene sequences from individual animals were processed and assembled with Lasergene program, version 4.0 (DNAStar, Madison, WI, USA). Sequence contigs were submitted to the GenBank and assigned accession numbers: MK358466 for N’Dama and MK358467 for White Fulani. A BLAST search of contigs from both breeds was carried out using Ensembl BLAST/BLAT genomic sequence tool (http://www.ensembl.org/Tools/Blast/GenomicSeq) to locate the genomic position of our sequences on the bovine genome ARS-UCD1.2 assembly of the Ensembl database. Sequence alignment was performed to identify regions of similarity, indicative of functional, structural, or evolutionary relationships, between CD14 gene promoter regions of both breeds with the Ensembl program alignment tool [27].

2.4. Variant Analysis, Prediction of Transcription Factor Binding Sites, and miRNAs

We identified common and unique variants between N’Dama and White Fulani contigs, as well as putative single nucleotide polymorphisms through alignment (Table 1) and visual inspection using variant finders in the Ensembl browser and the Genomatix variance analysis software, version 3.10 (Genomatix, Munich, Germany). To identify functional elements such as transcription factor binding sites (TFBSs) and micro RNAs (miRNAs), we predict the effect of each identified single nucleotide polymorphism and TFBS from the sequences with the variant analysis and MatInspector program (http://www.genomatix.de/matinspector). With the CD14 gene promoter region as target, we predict the possible miRNAs binding sites within the core promoter region with miRWalk [28,29]. We confirmed the identified miRNAs with two other prediction algorithms and databases; miRBase [30] and TargetScan [31]. We selected candidate miRNAs from these databases to analyze further, as previously described [25,26].

2.5. Functional Analysis of miRNAs at the Core Promoter of CD14 Gene

In order to identify the functions and examine the possible variations in the biological process regulated by CD14 promoter miRNAs between the two breeds, we identified miRNAs and their functions using mirPath v.3. This is a web server that provides accurate prediction for both experimentally validated miRNA and target gene interactions [32,33]. Furthermore, we searched the gene ontology database with each miRNA to ascertain relevant biological processes.

2.6. Validation of Selected CD14 Gene Polymorphism by Taqman SNP Genotyping Assay

In further analysis, we randomly selected three specific SNPs (rs721906237 [C/A], rs723566082 [G/C], and rs799300279 [A/G]) from N’Dama’s CD14 promoter sequences and custom Taqman SNP genotyping assays were designed (Thermo Fisher Scientific, Waltham MA). A total of 103 DNA samples from unrelated N’Dama animals were genotyped using the Taqman assays. Briefly, 10 µL total reaction mixture, prepared as instructed, were amplified on a CFXconnect real time PCR machine (Bio-Rad, Hercules, CA, USA), with the reaction condition as: 90 °C for 10 min, 90 °C for another 30 s, annealing at 56 °C for 30 s, extension at 72 °C for 50 s, and the final extension at 72 °C for 5 min. The CFX Manager software was used to call the allele genotypes in the samples.

2.7. Statistics

We performed allelic and genotypic frequency estimates from the Taqman SNP genotyping assay results using SNPStats, and tested for deviation from Hardy–Weinberg equilibrium, as described [34]. In addition, we estimated haplotype frequencies among the three loci in N’Dama CD14 promoter.

3. Results

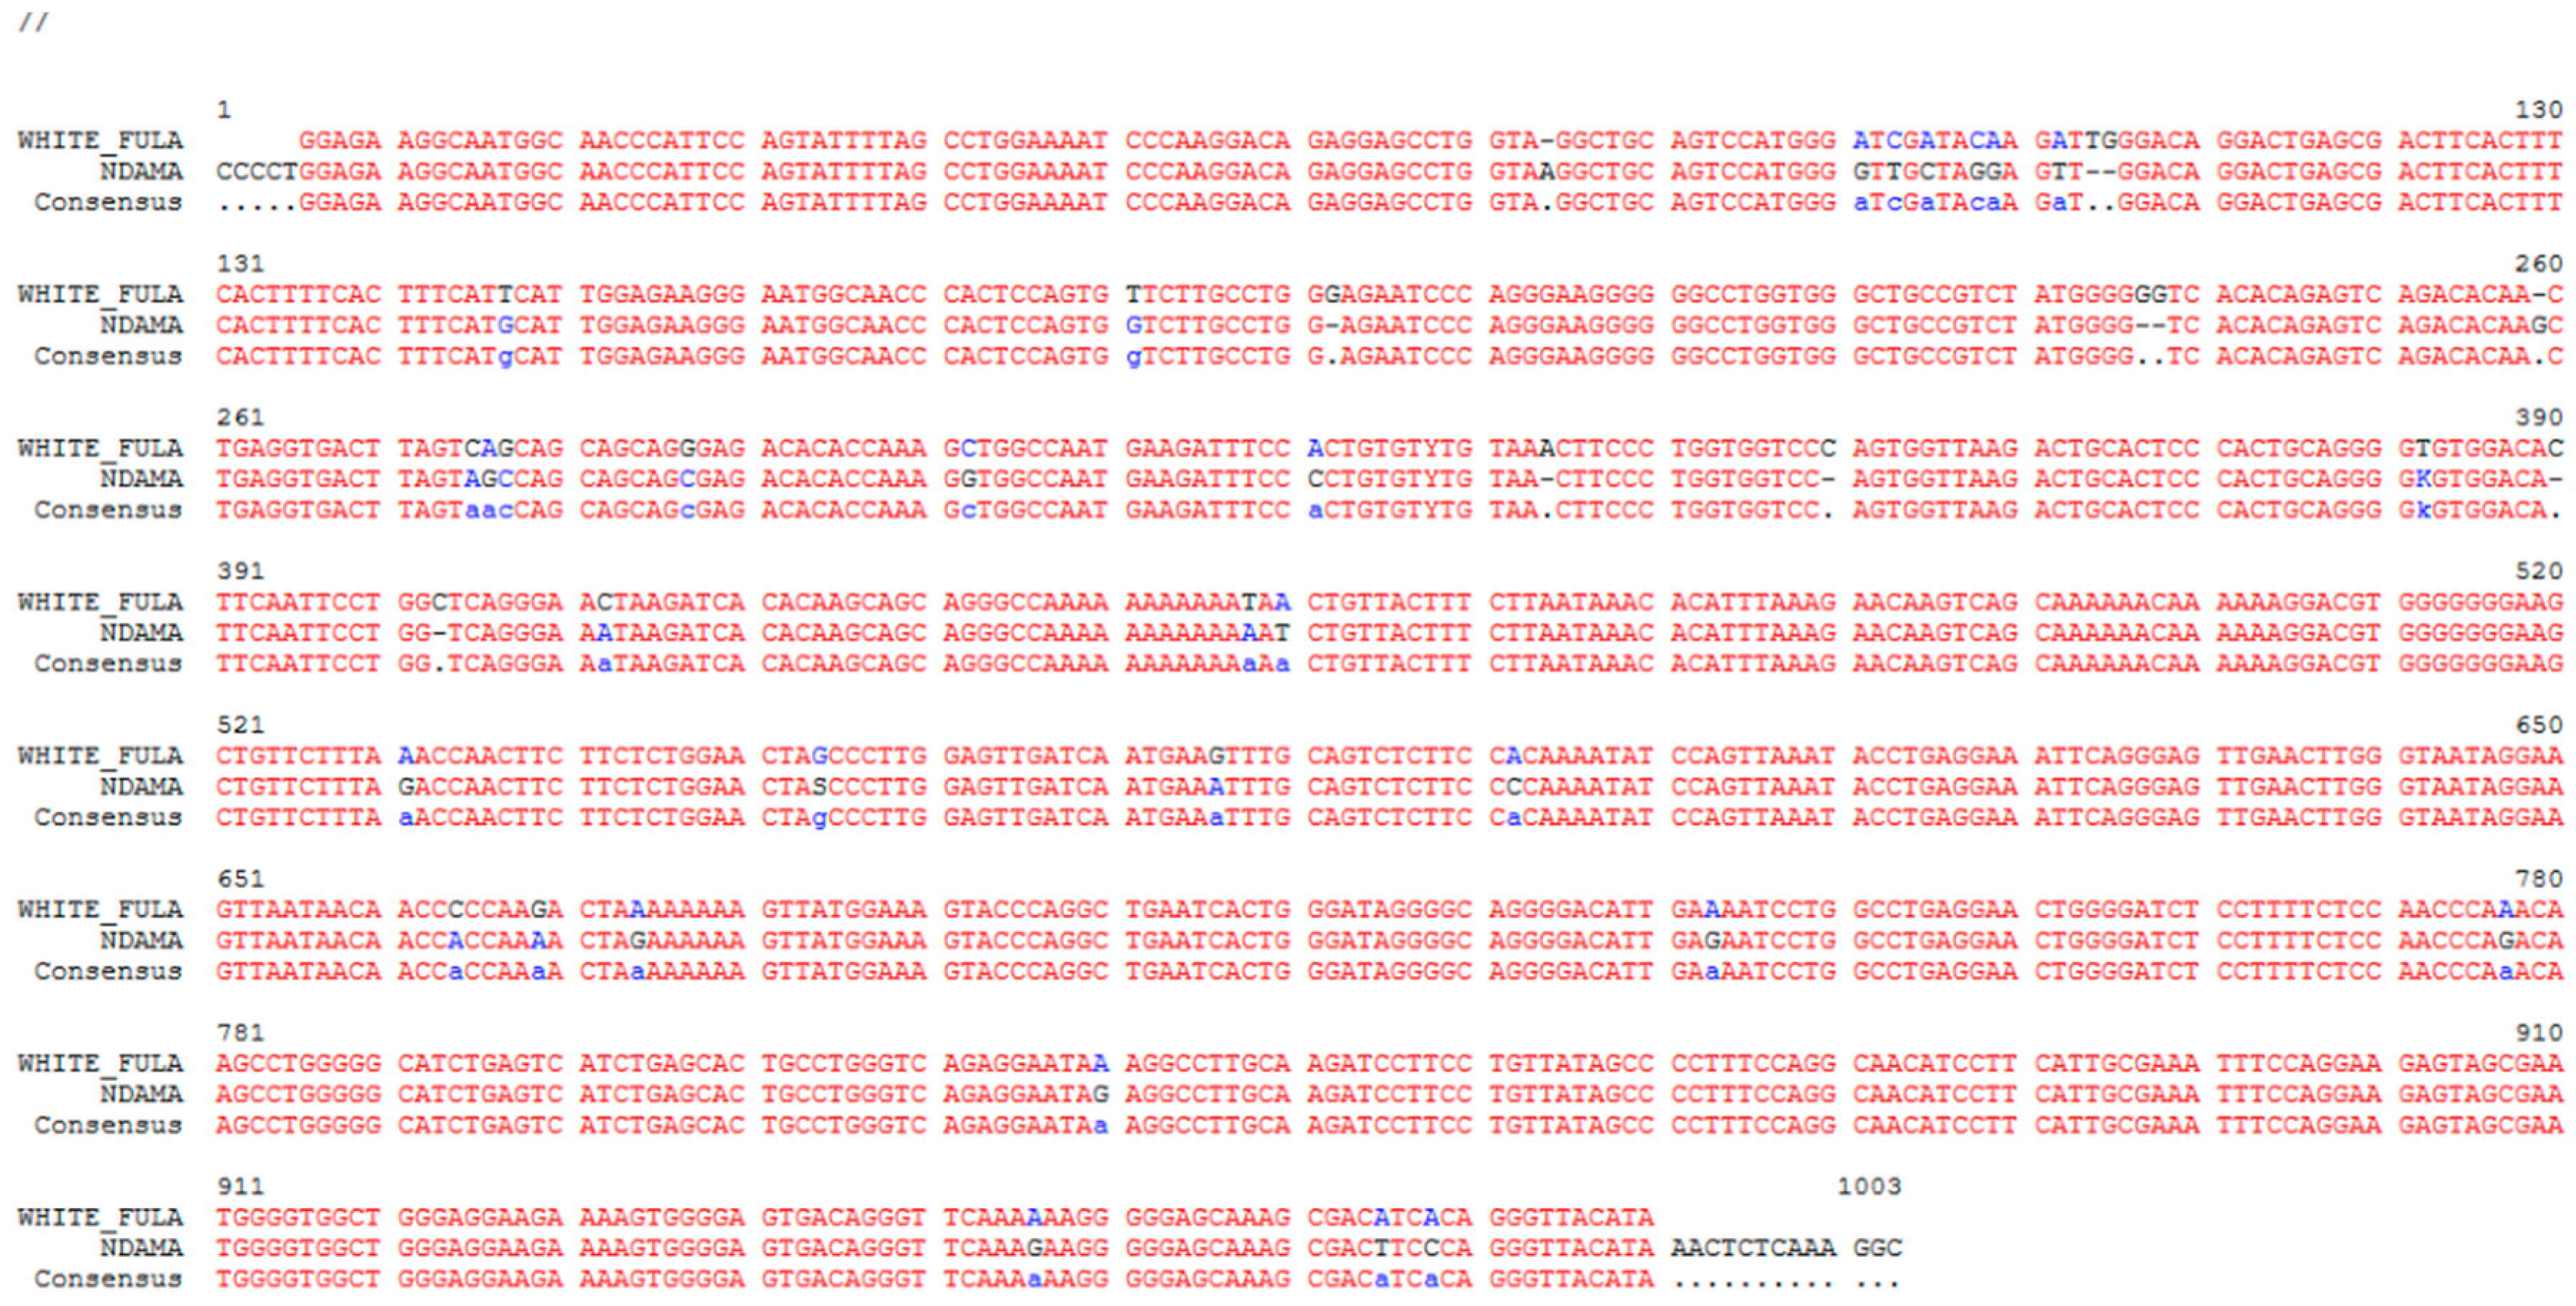
3.1. Sequence Quality Control and Alignments

CD14 promoter raw sequences trimmed to remove low quality sequence calls were removed. Forward and reverse sequences from N’Dama and White Fulani were individually processed, assembled, and contigs were made with SeqMan Pro of the Lasergene program, version 4.0 (DNAStar, Madison WI, USA). The contigs from both breeds were individually used to search the bovine genome ARS-UCD1.2 assembly [26] (Figure 1).

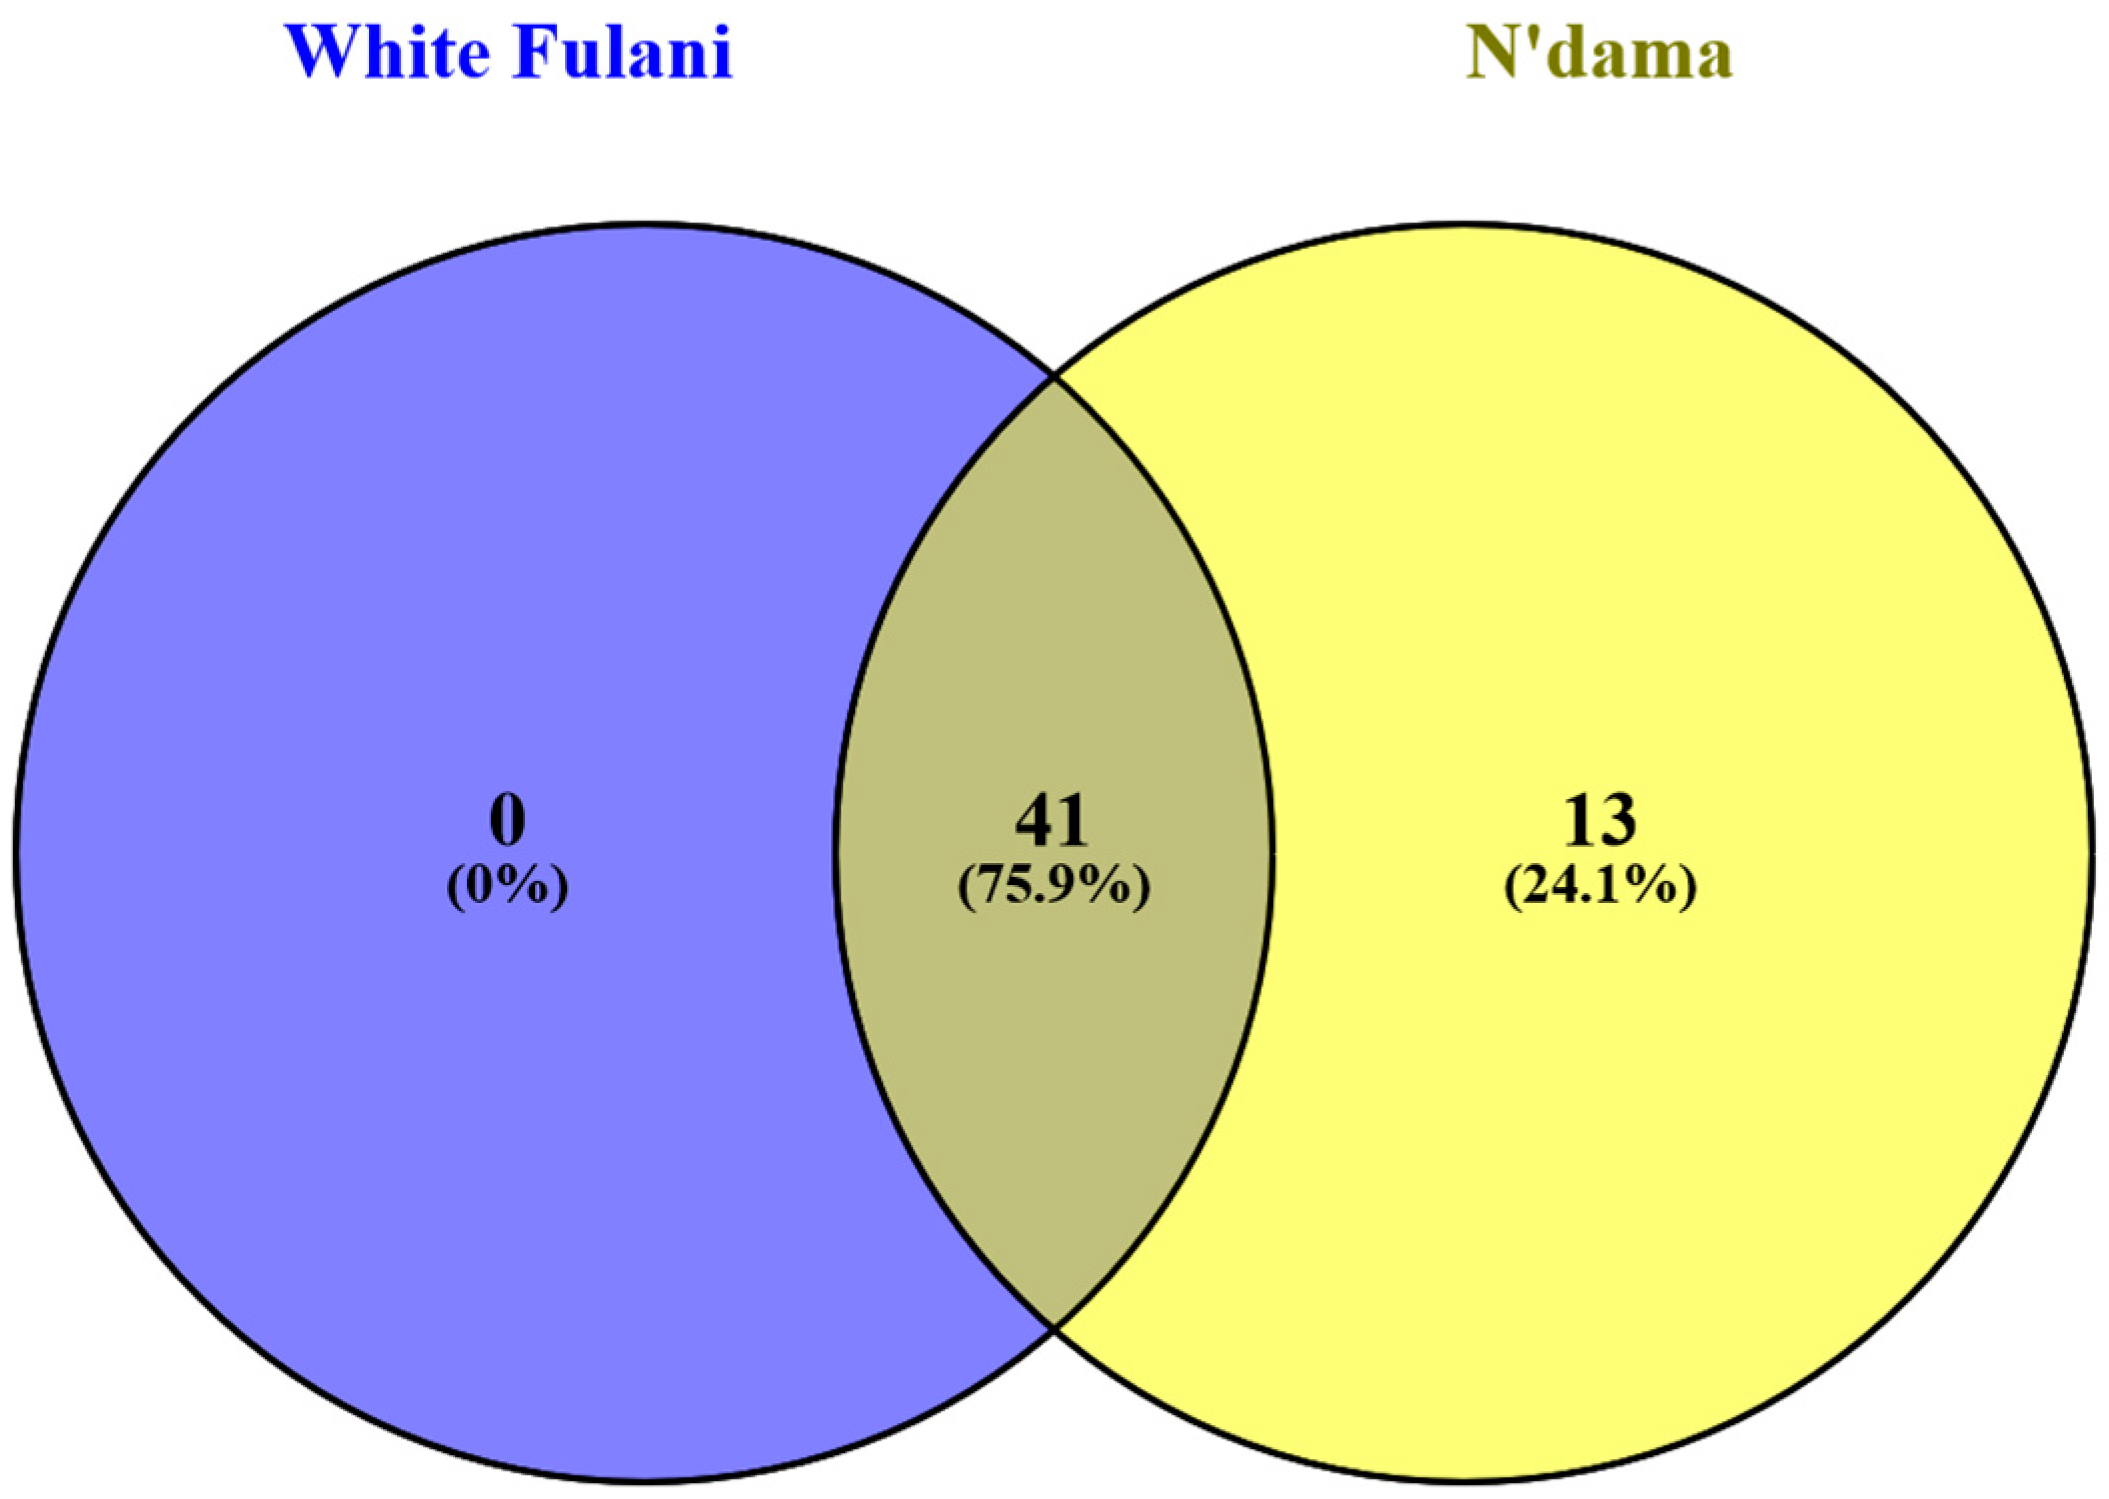
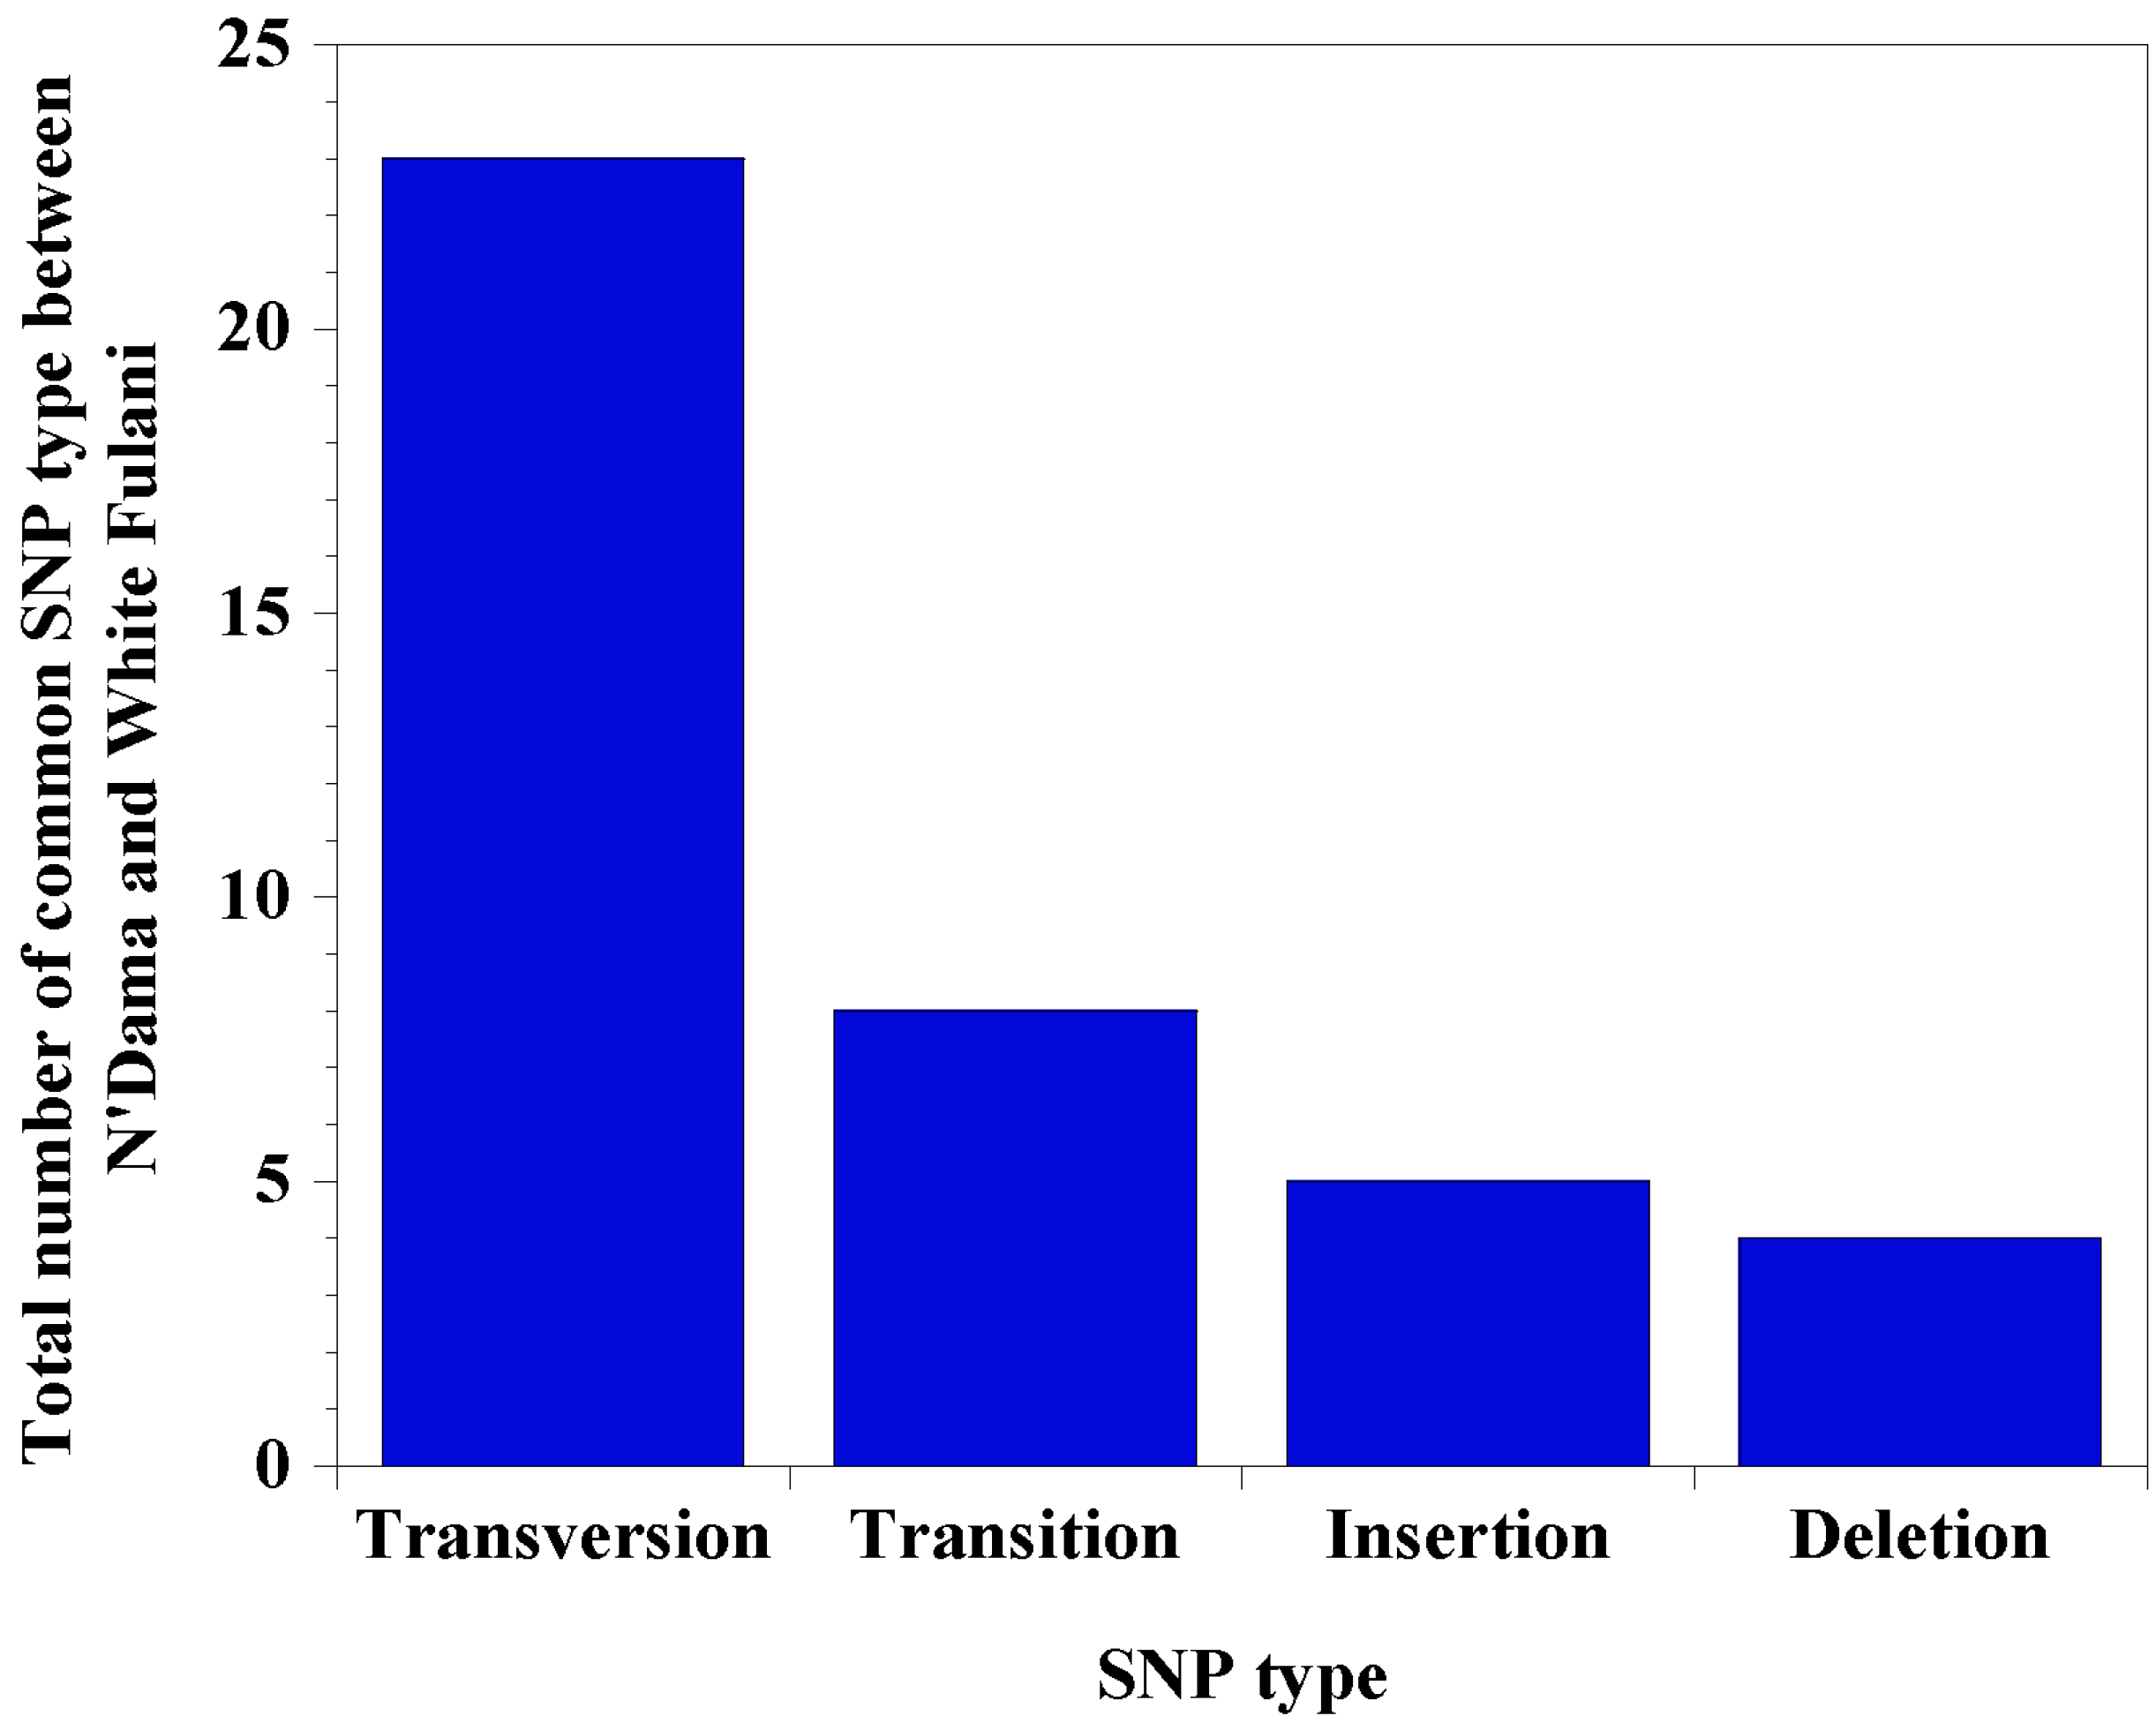
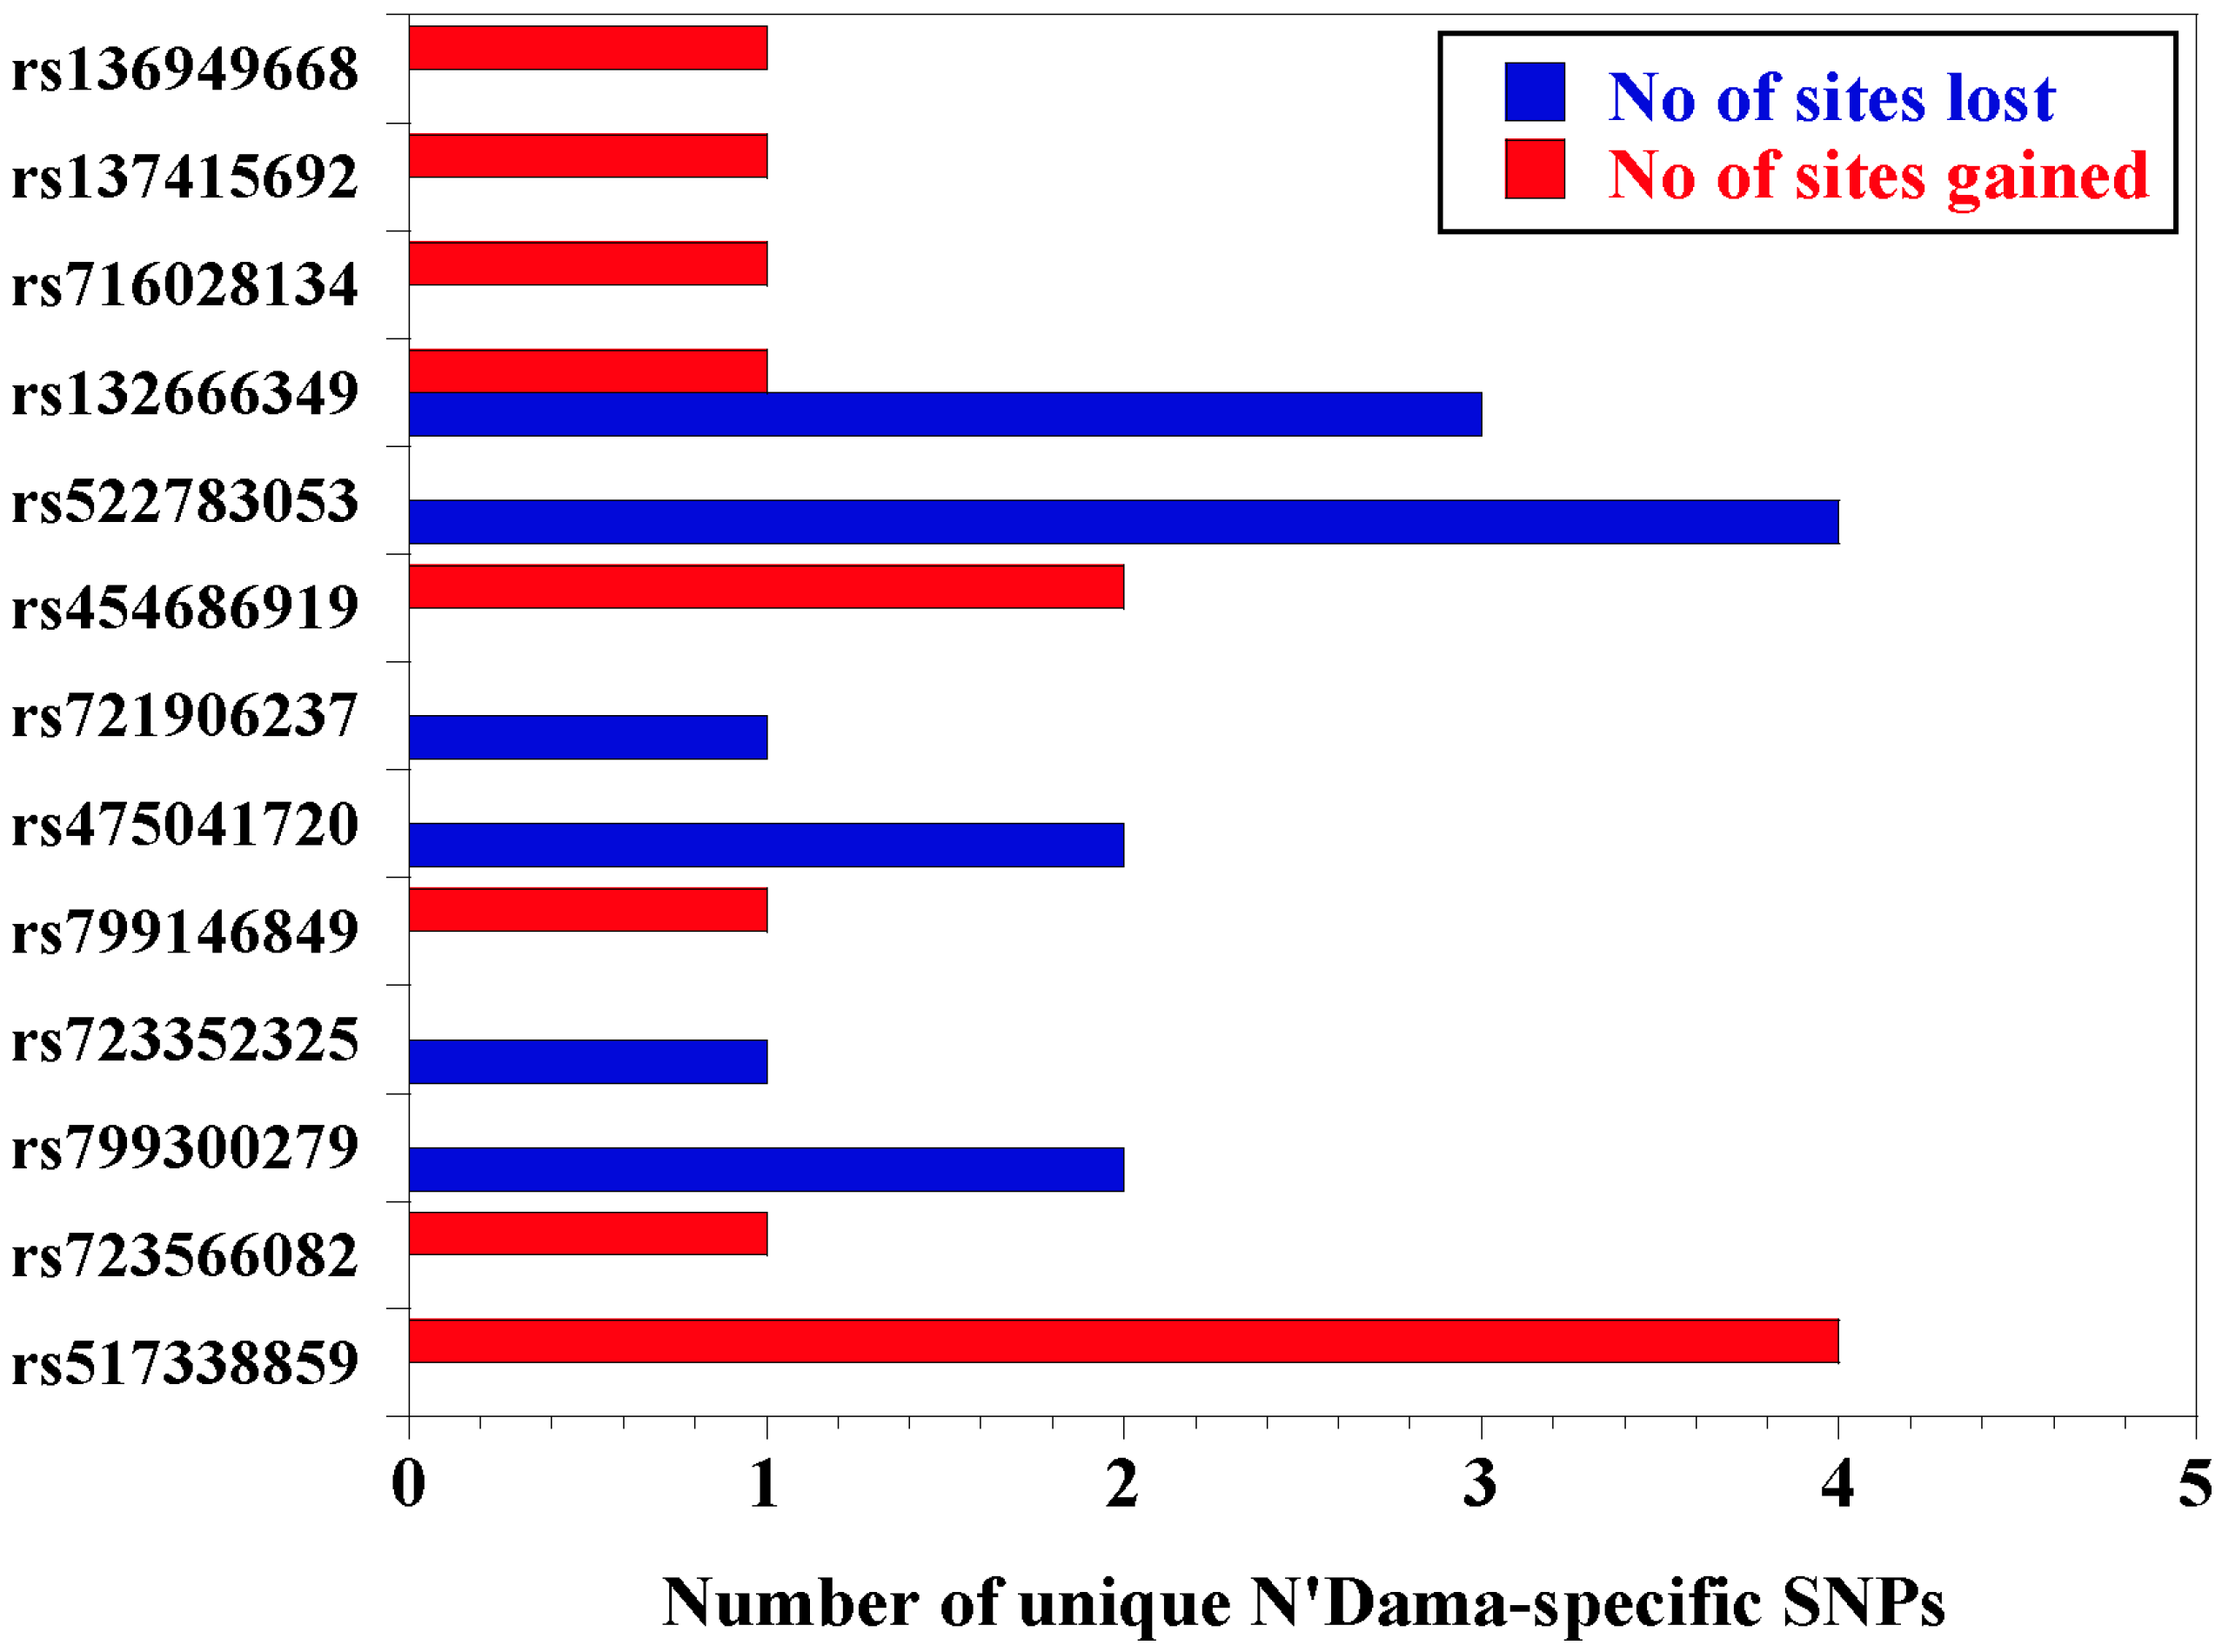
3.2. Nucleotide Mapping, SNP Identification, and Classification

N’Dama CD14 promoter region was found on ARS-UCD1.2: 7:51765824-51766809 while that of White Fulani was located on ARS-UCD1.2 7:51765824-51766419. Both were found on chromosome 7 of the bovine genome ARS-UCD1.2 assembly of the Ensembl database. Our search for variations within the CD14 gene promoter revealed a total of 54 and 41 variants at the CD14 promoter region for N’Dama and White Fulani, compared to the reference genome, respectively (Table 1), with N’Dama presenting with significantly more variants. A total of 41 variants were common among both breeds, with N’Dama possessing additional 13 unique variants that were completely absent in White Fulani (Figure 2). These unique SNPs and their positions on the ARS-UCD1.2 genome assembly are shown in (Table 2). All the detected SNPs (common and unique) were found at the upstream region of the CD14 gene. Using sequence ontology (http://www.sequenceontology.org/) classification, upstream gene variants are those located at the 5’ of a gene, classified as intergenic (SO:0001631), and subsequently subdivided into 2 KB upstream variant (SO:0001636) and 5 KB upstream variant (SO:0001635). The variants found in this study are classified under the 2 KB upstream type, belonging to structural variants, which change one or more sequence features.

3.3. Prediction of SNP Effects, Nucleotide Diversity, and Transcription Factor Binding Sites

We determined the distribution of single nucleotide polymorphisms within the sequence and predicted the potential effects on transcription factor binding sites. Distribution of common variants reveal that there are 78% single nucleotide polymorphisms (n = 32), 10% deletions (n = 4), and 12% insertions (n = 5) in White Fulani, whereas N’Dama specific variants have 92% single nucleotide polymorphisms (n = 12), 8% deletions (n = 1), and no insertions. Among the common SNPs, nucleotide substitution showed that there were more transversions (70.9%) than transitions (29.3%) (Figure 3), with a similar trend observed for N’Dama specific SNPs. We report a total of 69 and 89 transcription factor binding sites lost and gained, respectively, due to the common SNPs at the CD14 promoter region of both N’Dama and White Fulani (Table 1). However, N’Dama specific single nucleotide polymorphisms produced a total of 13 transcription factor binding sites lost and 12 new ones gained (Figure 4; Table 3). In all, N’Dama has a total of 101 new transcription factor binding sites and lost 82. Interestingly, we found the effect of some SNPs having overlapping transcription factor binding sites. A list of the common transcription factor binding sites in both breeds is presented (Supplementary Table S2), with significantly related N’Dama-specific binding sites listed in Table 3. Higher new transcription factor binding sites found in both breeds are attributed to high transverse mutations among the identified single nucleotide polymorphisms. By computational prediction, six of such polymorphisms with dbSNP numbers; rs440282053, rs450747566, rs482000686, rs459318293, rs442402639, and rs456854916, have a higher number of newly formed transcription factor binding sites ranging from 6 to 12.

3.4. miRNAs Identification and Functional Classification

To infer potential miRNAs and their functions at the promoter region of both breeds, we carried out prediction of miRNA binding sites within the core promoter region of the CD14 gene. We found two common miRNA binding sites (bta-miR-2381 and bta-miR-2340) for the two animals, in addition to bta-miR-12032 which is specific for N’Dama, and bta-miR-22-5p and bta-miR-22-3p that are specific for White Fulani (Table 4). Moreover, we examined the presence of single nucleotide polymorphism within each mature miRNA sequences. We found that bta-miR-2381 is highly polymorphic having seven nucleotide variants. On the other hand, N’Dama-specific miRNA (bta-miR-12032) possessed only one variant, and none for White Fulani. Altogether, these variants are regarded as mature miRNA variants, or transcript variants, due to their location within the sequence of mature miRNA. Gene ontology shows that these miRNAs are implicated in various biological processes including the downregulation of gene expression through RNA-induced silencing complex.

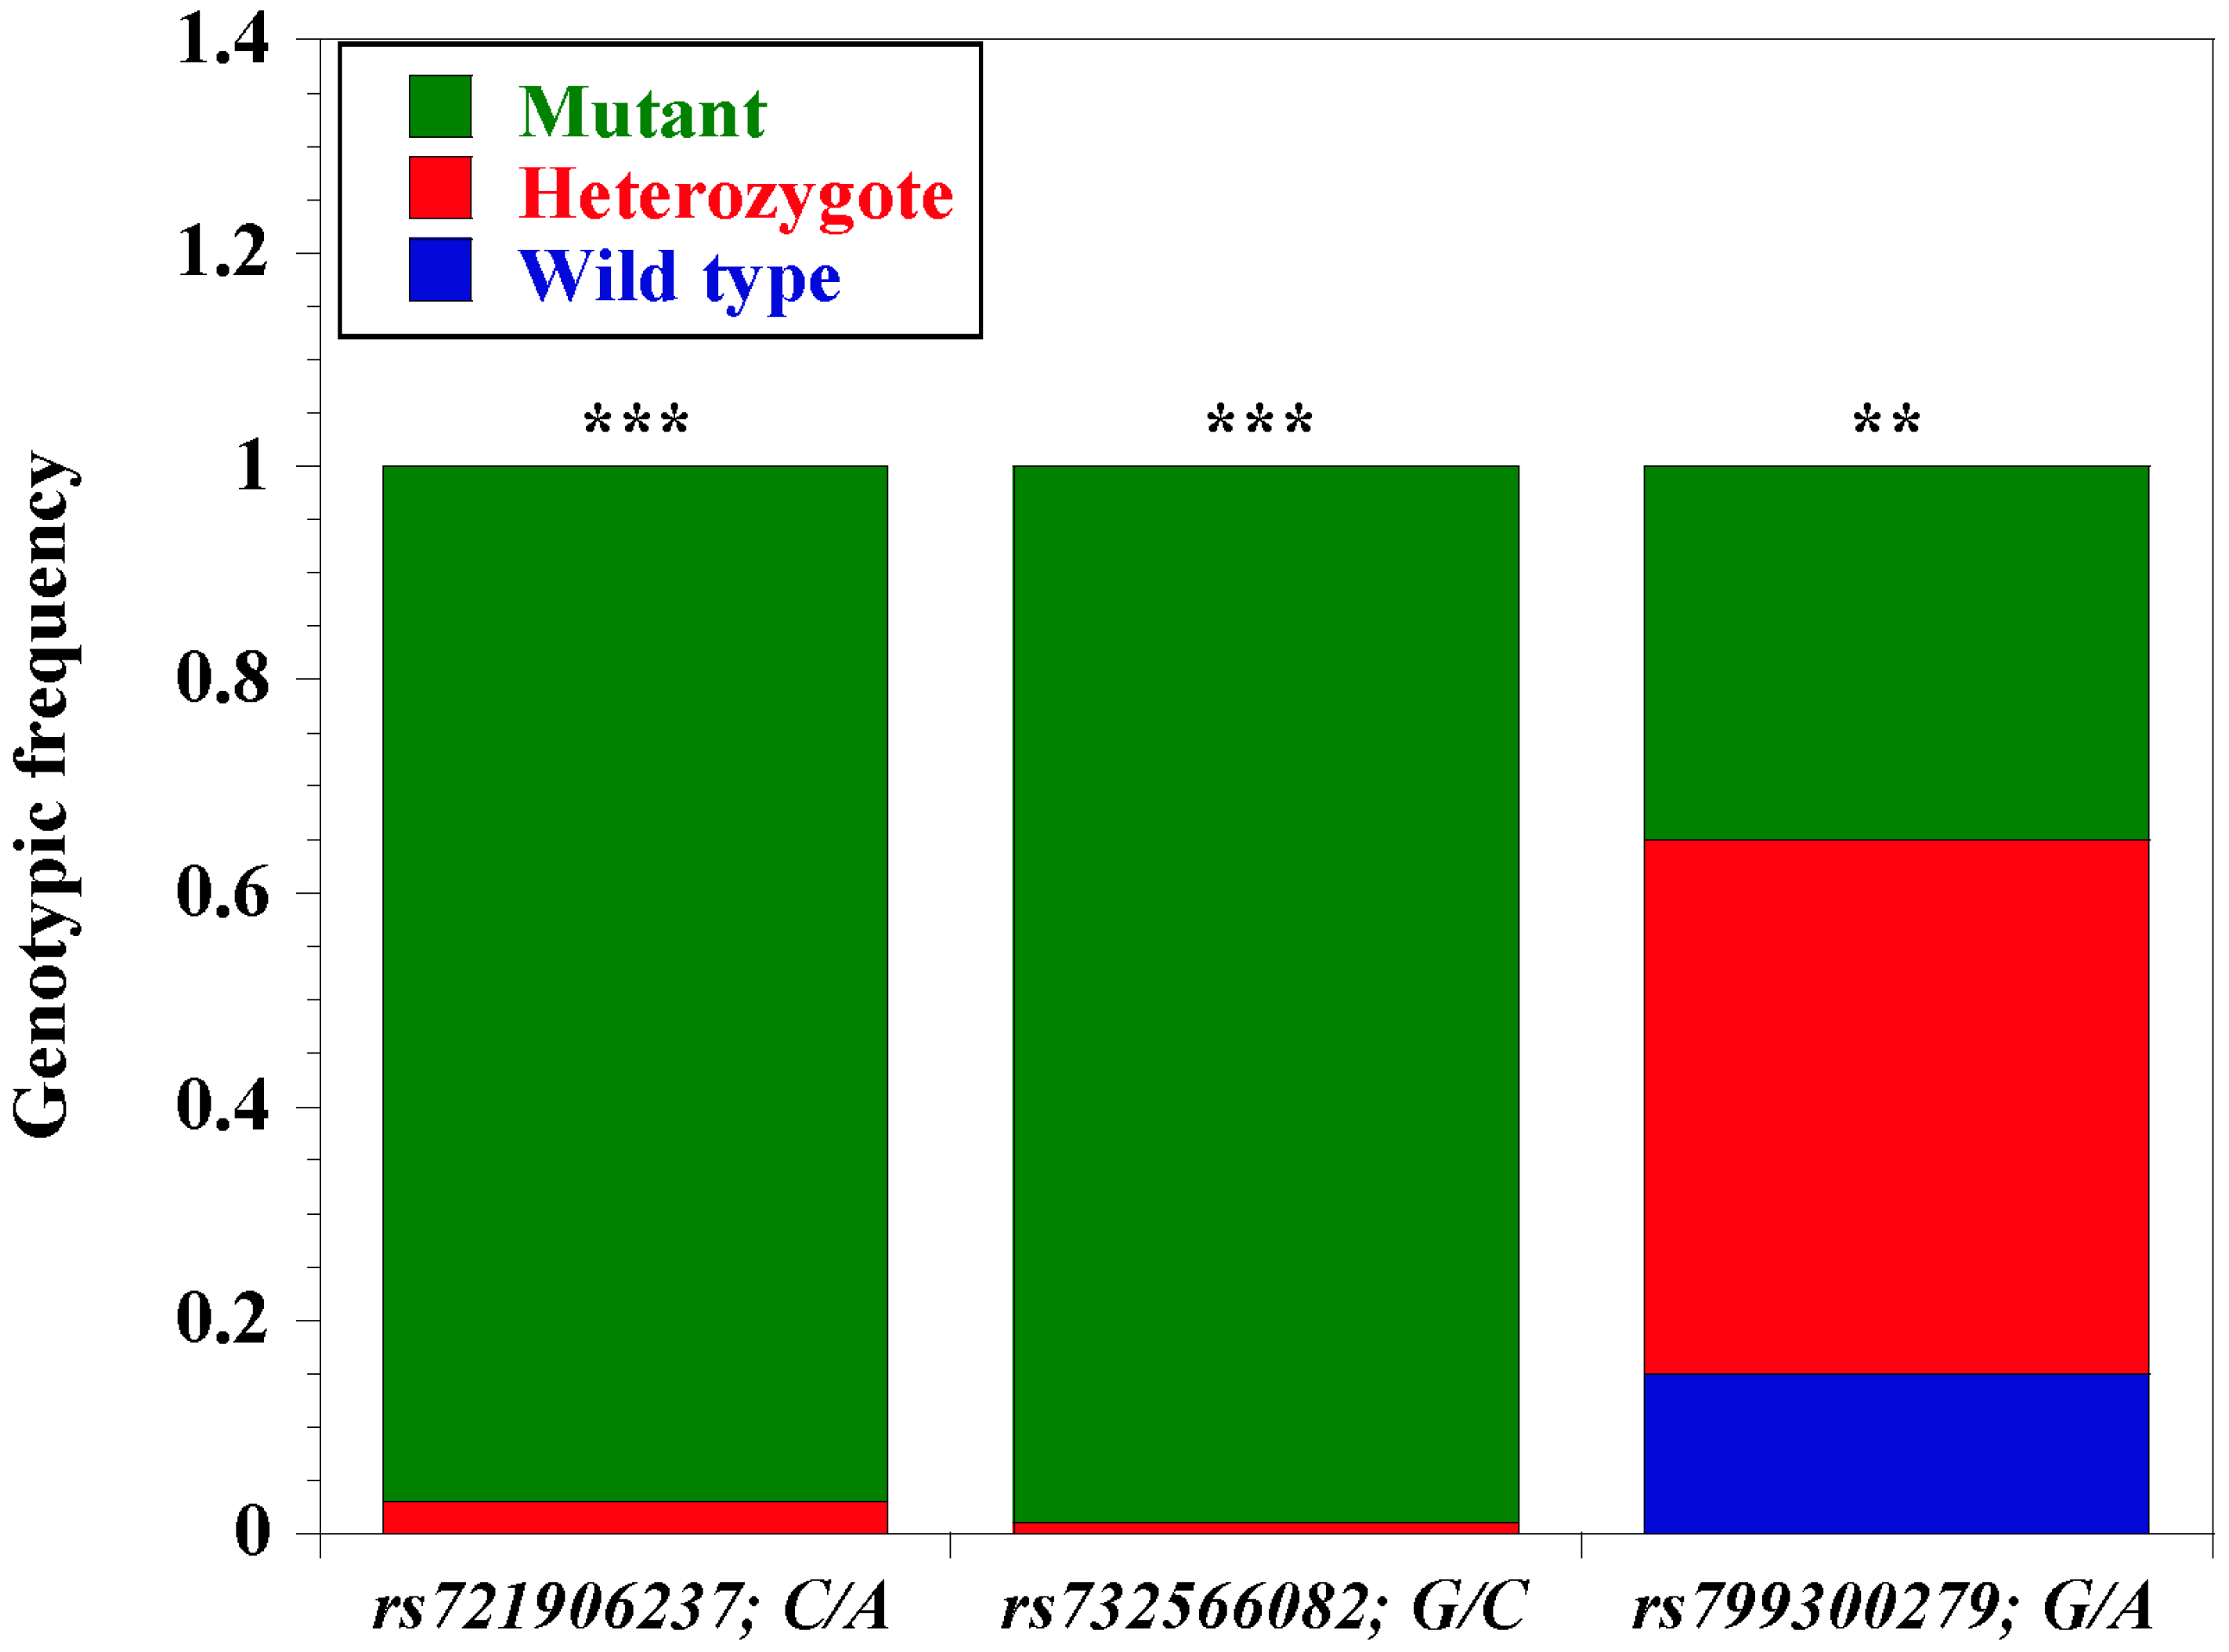
3.5. Allelic, Genotypic, and Haplotype Estimates of Three Loci in N’Dama CD14 Promoter

To understand the distribution of allelic frequencies, three loci were randomly chosen for subsequent TaqMan real-time PCR analysis of an unrelated N’Dama population. As shown in Table 5, a general observation from our analysis showed a predominance of the mutant variant from all the three loci. For the SNP locus rs721906237; C > A, mutant allele A has a higher frequency of 0.97 (195) compared to the wild type allele C with 0.03 (7). Likewise, locus rs723566082; G > C presents a higher frequency of the mutant variant C at 0.99 (205) as compared to the wild type allele G with 0.01 (1). It is also observed that locus rs799300279; G > A presents 0.6 (121) mutant allele A and 0.4 (81) wild type allele G. Furthermore, Table 5 showed a significant genotypic diversity among the three loci. We observed that there is complete lack of the wild genotype C/C (rs721906237; C > A) and G/G (rs723566082; G > C) from the two CD14 promoter loci in all the N’Dama animal samples. The two loci present higher frequencies of homozygous mutant genotypes A/A and C/C with an estimate of 0.97 and 0.99, respectively (Figure 5). On the other hand, rs799300279; G > A locus has 0.35 homozygous mutant genotype A/A, 0.5 heterozygote genotypes A/G, and 0.15 wild type genotype G/G. Notably, heterozygote genotype A/G is significantly higher compared to the other types. To examine the relationship/co-occurrence of the three loci for evolutionary inference, haplotype estimates were constructed for the three single nucleotide polymorphism loci. Overall, five haplotype groups (H1 to H5) were constructed from the analysis. Haplotype combination H1 (ACA) and H2 (ACG) were significant within the population while H5 (CCG) is a rare combination (Table 6).

4. Discussion

Gene promoter regions have been tagged as significant players determining the steady-state accumulation of mRNA with differences attributed to SNPs and regulatory elements. CD14 gene is a major part of the innate immune system, and one of essential receptors needed to initiate an adequate response to infection [13,14,15]. Encounter with antigens trigger innate immune responses mediated by host genetic variations alongside additional benefits arising from prior exposure to such stimuli that may direct tolerance or susceptibility [18,35]. In this study, we dissected the genetic variation within the core promoter region of bovine CD14 gene to elucidate a deeper understanding of trypanosomosis tolerance in cattle. We present possible evidence of selection signature within the CD14 gene promoter region in disease tolerant N’Dama that is not seen in susceptible White Fulani.
We identified a total of 54 single nucleotide polymorphisms within the CD14 gene promoter region of the animals, which were mapped to the recent Bos taurus genome in the Ensembl database (also available in the dbSNP database). The high SNP density in this region is not unusual, considering the plasticity of noncoding regions compared to coding regions. Reports have shown that human CD14 gene promoter is significantly polymorphic, and this polymorphism has been shown to influence its biological activities, including disease susceptibility [36,37]. Likewise, there are a handful of reports linking CD14 gene polymorphism with disease susceptibility in cattle [14,38,39,40]. To this end, we postulate that the extensive polymorphisms observed in this report will play significant roles in gene expression, regulation of bovine CD14, and possibly disease tolerance. In addition, we report 13 N’Dama-specific CD14 gene promoter variants that were not found in trypanosusceptible White Fulani, revealing possible evidence of localized selective sweep between the animal breeds, and potentially related to disease tolerability. Notably, the fact that almost all N’Dama animals were genotyped with predominantly mutant alleles from the 2 loci (rs721906237; C/A and rs723566082; G/C) indicate a complete mutation at this region, possibly due to its earlier exposure to disease on introduction to sub-Saharan Africa, potentially traceable to development of tolerance. Although locus rs799300279; G > A showed an incomplete mutation as there were more heterozygote alleles, this possibly indicates that the locus is still under selection pressure. As previously argued [4,6,8], this is an indication of an evolutionary adaptation event in N’Dama that is not observed in White Fulani.
SNP diversities are valuable tools for understanding mutational molecular mechanisms and identification of disease susceptibility [3]. Our report shows that the majority of identified SNP variations are transversions (70.9%) rather than transitions (29.3%) [41]. The variations at both coding and noncoding regions of CD14 gene have been reported to affect its surface expression on neutrophils and monocytes [13,15]. Although both SNP types in our study are regarded as point mutations from the regulatory region, transverse mutations at the coding region are known to significantly alter gene or protein expression than transition mutations [13,36]. The high frequency of transversions observed possibly indicates these SNPs are likely to cause pronounced effect on regulatory elements at the promoter region, resulting in changes in CD14 expression, supporting DNA variability in the promoter region and association with disease tolerance [36,37]. This form of variation is potentially of the radical rather than conservative type, and evidence of selection, whereby transversions are more detrimental than transitions and predictive of mutational fitness effects [41,42,43], justifying our hypothesis. Therefore, these results provide additional evidence that polymorphisms of the CD14 gene promoter may be one of the adaptation mediators of immune response to trypanosomosis.
Published reports have shown that sequence changes at gene promoter regions are critically associated with disease phenotype, due to molecular evolution [36,37,44]. Our current result is contrary to reports in humans [36,44], where more transitional mutations (71%; C > T and G > A) than transversions (27%) were found, possibly a result of evolutionary diversity between the two species (cattle and humans). We have recently shown an extensively diverse CD14 interactome with other immune-related genes among mammalian species [45]. As shown from our result, there is significant SNP diversity at the promoter region of CD14 gene, indicating selection sweep between the disease tolerant N’Dama and susceptible White Fulani cattle. Other reports have shown significant association of CD14 gene polymorphism with varying disease phenotypes, including monocyte surface expression in Canadian Holstein and Jersey cows during bovine mastitis [13], and in Chinese Holstein cows during bovine tuberculosis [15,38,46,47].
It is well known that gene promoter regions contain several transcription factor binding sites (TFBS) [48,49,50], and we hypothesized that higher SNP density reported in this region might cause loss of TFBS or generation of new ones, with possible biological impact, hence the need to predict the effects of each SNP on the TFBSs. Our in silico analysis reveal 37 out of 54 SNPs had significant impact on the predicted transcription factor binding sites, with 12% specifically found in N’Dama, which is expected, considering more SNPs were found in this animal. This breed-specific regulatory difference may interfere with the transcriptional control of CD14 gene during downstream regulation in the animals [13,21]. We also found that some SNPs generated more TFBS than others, and as such likely to affect transcriptional activities, producing significantly more biological variations. An excellent strategy to further explore this observation would be to perform in vitro studies that investigate individual SNP effect on TFBS and gene expression during infection. There is a possibility that some SNPs with overlapping TFBS in these animals may have similar effects, with no biological relevance. However, some of the TFBS have been found to influence the expression of the adjacent or surrounding genes in some other systems [49,50,51]. Additionally, it has been suggested that sequence diversity in promoter regions might be an evolutionary indication, representing signatures of selection due to selective pressure [52,53,54]. Altogether, the presence of mutant alleles and regulatory motifs in N’Dama but not White Fulani strongly indicate an evolutionary adaptation of CD14 gene for disease tolerance, and may be the underlying basis for disease susceptibility in White Fulani.
Ibeagha-Awemu et al. [13] reported that nucleotide changes at the noncoding untranslated regions (UTR) increases the surface expression of CD14 on monocytes and neutrophils among Canadian cattle. As reported in our miRNA prediction data, the core promoter region of CD14 in both breeds contain miRNA binding sites, which are known to regulate the mRNA expression of the target gene [55]. Although predicted SNPs are present in the common bta-miR-2381 and N’Dama-specific bta-miR-12032, their effect on gene expression/regulation is unclear and may require an in vitro validation. Notably, gene ontology showed that these miRNAs are involved in multiple biological processes, including RNA-induced silencing and downregulation of gene expression. Several studies have shown the importance of miRNAs, including altering the expression of two or more target genes, miRNAs could induce translational repression or switch to translational activation [25,48,49,50]. Notably, we have earlier shown that CD14 gene co-regulates or co-expresses with a list of other innate and adaptive immune system genes in cattle [40,56]. For example, CD14 together with TNF, LY96, LBP, MYD88, TLR-2, IL-18, TLR-4, CXCL8, CCL2, IFNγ, and IL-6 have been reported to initiate cellular response to bacterial lipopolysaccharide (LPS), cytokine production, regulation of immune system process, and chemokine metabolic process, etc. [8,40]. It is imperative therefore to examine the important pathways involved in host immune response for disease tolerance in cattle, since receptor activation and cytokine production are important for protection against disease.
Other evidence has shown that regions of mutation are extremely sensitive, with genes and gene products that are functionally related [36,53,57,58,59]. The significant interactions of CD14 gene with other functionally related genes indicate its importance in mediating immune response during disease condition in cattle. The predominant mutant allele in N’Dama animal may be a key to proper expression of CD14 gene which is lacking in White Fulani. Therefore, such CD14 molecule will provide an optimal and effective immune response against infection. On the other hand, a wild type CD14 gene, as seen in White Fulani, establishes the foundation for lack of adaptation and subsequent inadequate immune response, and susceptibility to disease. This is a significant evidence that the wild type CD14 allele in N’Dama animal may have undergone a complete mutation upon exposure to diseases at the earlier stages of life, which is lacking in White Fulani. There is the possibility that this variation may be responsible for the CD14 expression and the subsequence activation/driver of other innate immune response gene such as Toll-like receptors. We expect that the higher mutant allele frequenting for the three loci of CD14 gene promoter as seen in N’Dama is associated with a locally adapted immune response, primarily upon exposure to pathogen.

5. Conclusions

Taken together, we conclude that the genetic diversity observed in the CD14 promoter are attributable to selective sweep due to natural selection between the two breeds in this study. A better understanding of the underlying mechanism of immune response, potentially driven by evolutionary adaptation to an endemic environment is needed. CD14 gene promoter region is important in regulating gene expression, which in turn drives the expression of other associated genes. This observation could be useful for possible drug or vaccine design purposes, or serve as basis for marker-assisted selection, providing useful information for conservation studies and selective breeding of cattle with increased resistance to infectious diseases.

Supplementary Materials

The following are available online at https://www.mdpi.com/2073-4425/11/1/112/s1, Table S1: Primer sequences for the genomic amplification of CD14 gene promoter, Table S2: List of common transcription factor binding sites associated with CD14 gene promoter region in both animals.

Author Contributions

Conceptualization, O.B.M. and B.N.T.; methodology, O.B.M. and B.N.T.; validation, O.B.M., A.L.C., O.O. and B.N.T.; formal analysis, O.B.M. and B.N.T.; investigation, O.B.M., A.L.C. and B.N.T.; resources, B.N.T.; data curation, O.B.M. and B.N.T.; writing—O.B.M.; writing—review and editing, O.B.M., A.L.C., O.O. and B.N.T.; visualization, O.B.M. and B.N.T.; supervision, O.B.M. and B.N.T.; project administration, O.B.M. and B.N.T.; funding acquisition, B.N.T. All authors have read and agreed to the published version of the manuscript.

Funding

This research was funded through Faculty Development Award, College of Health Sciences and Technology, Rochester Institute of Technology and The APC was funded by College of Health Sciences and Technology, Rochester Institute of Technology.

Acknowledgments

We acknowledge ongoing support from the College of Health Sciences and Technology, Rochester Institute of Technology. O.B.M. was supported through the American Association of Immunologists Careers in Immunology Fellowship Program. The funders had no role in study design, data collection and analysis, decision to publish, or preparation of the manuscript.

Conflicts of Interest

Authors declare we have no competing financial or personal interest.

References

  1. Bai, Y.; Sartor, M.; Cavalcoli, J. Current status and future perspectives for sequencing livestock genomes. J. Anim. Sci. Biotechnol. 2012, 3, 8. [Google Scholar] [CrossRef] [PubMed] [Green Version]
  2. Goddard, M.E. Uses of genomics in livestock agriculture. Anim. Prod. Sci. 2012, 52, 73–77. [Google Scholar] [CrossRef] [Green Version]
  3. Zwane, A.A.; Schnabel, R.D.; Hoff, J.; Choudhury, A.; Makgahlela, M.L.; Maiwashe, A.; Van Marle-Koster, E.; Taylor, J.F. Genome-Wide SNP Discovery in Indigenous Cattle Breeds of South Africa. Front. Genet. 2019, 10, 273. [Google Scholar] [CrossRef] [PubMed]
  4. Kim, S.J.; Ka, S.; Ha, J.W.; Kim, J.; Yoo, D.; Kim, K.; Lee, H.K.; Lim, D.; Cho, S.; Hanotte, O.; et al. Cattle genome-wide analysis reveals genetic signatures in trypanotolerant N’Dama. BMC Genom. 2017, 18, 371. [Google Scholar] [CrossRef]
  5. Smetko, A.; Soudre, A.; Silbermayr, K.; Müller, S.; Brem, G.; Hanotte, O.; Boettcher, P.J.; Stella, A.; Mészáros, G.; Wurzinger, M.; et al. Trypanosomosis: Potential driver of selection in African cattle. Front. Genet 2015, 6, 137. [Google Scholar] [CrossRef] [Green Version]
  6. Tijjani, A.; Utsunomiya, Y.T.; Ezekwe, A.G.; Nashiru, O.; Hanotte, O. Genome Sequence Analysis Reveals Selection Signatures in Endangered Trypanotolerant West African Muturu Cattle. Front. Genet 2019, 10, 442. [Google Scholar] [CrossRef]
  7. Lemecha, H.; Mulatu, W.; Hussein, I.; Rege, E.; Tekle, T.; Abdicho, S.; Ayalew, W. Response of four indigenous cattle breeds tsetse to natural Ethiopia trypanosomosis challenge in the Ghibe valley of of Ethiopia. Vet. Parasitol. 2006, 141, 165–176. [Google Scholar] [CrossRef]
  8. Noyes, H.; Brass, A.; Obara, I.; Anderson, S.; Archibald, A.L.; Bradley, D.G.; Fisher, P.; Freeman, A.; Gibson, J.; Gicheru, M.; et al. Genetic and expression analysis of cattle identifies candidate genes in pathways responding to Trypanosoma congolense infection. Proc. Natl. Acad. Sci. USA 2011, 108, 22. [Google Scholar] [CrossRef] [Green Version]
  9. Auty, H.; Torr, S.J.; Michoel, T.; Jayaraman, S.; Morrison, L.J. Cattle trypanosomosis: The diversity of trypanosomes and implications for disease epidemiology and control. Rev. Sci. Tech. Off. Int. Epiz. 2015, 34, 587–598. [Google Scholar] [CrossRef]
  10. Zanoni, I.; Granucci, F. Role of CD14 in host protection against infections and in metabolism regulation. Front. Cell. Infect. Microbiol. 2013, 3, 32. [Google Scholar] [CrossRef] [Green Version]
  11. Baumann, C.L.; Aspalter, I.M.; Sharif, O.; Pichlmair, A.; Bluml, S.; Grebien, F.; Bruckner, M.; Pasierbek, P.; Aumayr, K.; Planyavsky, M.; et al. CD14 is a coreceptor of Toll-like receptors 7 and 9. J. Exp. Med. 2010, 207, 2689–2701. [Google Scholar] [CrossRef] [PubMed]
  12. Da Silva, T.A.; Zorzetto-Fernandes, A.L.V.; Cecílio, N.T.; Sardinha-Silva, A.; Fernandes, F.F.; Roque-Barreira, M.C. CD14 is critical for TLR2-mediated M1 macrophage activation triggered by N-glycan recognition. Sci. Rep. 2017, 7, 7083. [Google Scholar] [CrossRef] [PubMed]
  13. Ibeagha-Awemu, E.M.; Lee, J.W.; Ibeagha, A.E.; Zhao, X. Bovine CD14 gene characterization and relationship between polymorphisms and surface expression on monocytes and polymorphonuclear neutrophils. BMC Genet. 2008, 9, 50–59. [Google Scholar] [CrossRef] [PubMed] [Green Version]
  14. Selvan, A.S.; Gupta, I.D.; Verma, A.; Chaudhari, M.V.; Magotra, A. Molecular characterization and combined genotype association study of bovine cluster of differentiation 14 gene with clinical mastitis in crossbred dairy cattle. Vet World 2016, 9, 680–684. [Google Scholar] [CrossRef] [PubMed] [Green Version]
  15. Xue, Y.; Gao, W.N.; Chen, F.; Ma, B.B.; Zhou, F.; Hu, Z.G.; Long, T.; Zhao, Z.Q. CD14 gene polymorphisms associated with increased risk of bovine tuberculosis in Chinese Holstein cows. Vet. J. 2018, 232, 1–5. [Google Scholar] [CrossRef] [PubMed]
  16. Oakley, M.S.; Majam, V.; Mahajan, B.; Gerald, N.; Anantharaman, V.; Ward, J.M.; Faucette, L.J.; McCutchan, T.F.; Zheng, H.; Terabe, M.; et al. Pathogenic roles of CD14, galectin-3 and OX40 during experimental cerebral malaria in mice. PLoS ONE 2009, 4, e6793. [Google Scholar] [CrossRef] [Green Version]
  17. Liu, H.H.; Hu, Y.; Zheng, M.; Suhoski, M.M.; Engleman, E.G.; Dill, D.L.; Hudnall, M.; Wang, J.; Spolski, R.; Leonard, W.J.; et al. Cd14 SNPs regulate the innate immune response. Mol. Immunol. 2012, 51, 112–127. [Google Scholar] [CrossRef] [Green Version]
  18. Ojurongbe, O.; Funwei, R.I.; Snyder, T.; Aziz, N.; Li, Y.; Falade, C.; Thomas, B.N. Genetic diversity of CD14 promoter gene polymorphism (rs2569190) is associated with regulation of parasitemia but not susceptibility to Plasmodium falciparum infection. Infect. Dis. 2017, 10, 1–6. [Google Scholar] [CrossRef] [Green Version]
  19. Ashley, K.; Harrison, H.; Chan, P.H.; Sothoeun, S.; Young, J.R.; Windsor, P.A.; Bush, R.D. Livestock and livelihoods of smallholder cattle-owning households in Cambodia: The contribution of on-farm and off-farm activities to income and food security. Trop. Anim. Health Prod. 2018, 50, 1747–1761. [Google Scholar] [CrossRef]
  20. Vercelli, D.; Baldini, M.; Martinez, F.D. The monocyte/IgE connection: May polymorphisms in the CD14 gene teach us about IgE regulation? Int. Arch. Allergy Immunol. 2001, 124, 20–24. [Google Scholar] [CrossRef]
  21. Baldini, M.; Lohman, I.C.; Halonen, M.; Erickson, R.P.; Holt, P.G.; Martinez, F.D. A polymorphism in the 5’flanking region of the CD14 gene is associated with circulating soluble CD14 levels and with total serum immunoglobulin E. Am. J. Respir. Cell. Mil. Biol. 1999, 20, 976–983. [Google Scholar] [CrossRef] [PubMed]
  22. Thomas, B.N.; Diallo, D.A.; Moulds, J.M. Circulating immune complex levels are associated with disease severity and seasonality in children with malaria from Mali. Biomark. Insights. 2012, 7, 81–86. [Google Scholar] [CrossRef] [PubMed]
  23. Thomas, B.N.; Petrella, C.R.; Thakur, T.J.; Crespo, S.R.; Diallo, D.A. Genetic polymorphism of Plasmodium falciparum merozoite surface protein-1 and 2 and diversity of drug resistance genes in blood donors from Bamako, Mali. Infect. Dis. 2012, 6, 49–57. [Google Scholar] [CrossRef]
  24. Duru, K.C.; Thomas, B.N. Stability and genetic diversity of glutamate-rich protein (GLURP) in Plasmodium falciparum isolates from sub-Saharan Africa. Micro. Insig. 2014, 7, 35–39. [Google Scholar] [CrossRef] [Green Version]
  25. Zhao, Y.; Wang, F.; Chen, S.; Wan, J.; Wang, G. Methods of MicroRNA promoter prediction and transcription factor mediated regulatory network. BioMed Res. Int. 2017. [Google Scholar] [CrossRef]
  26. Morenikeji, O.B.; Hawkes, M.E.; Hudson, A.O.; Thomas, B.N. Computational Network Analysis Identifies Evolutionarily Conserved miRNA Gene Interactions Potentially Regulating Immune Response in Bovine Trypanosomosis. Front. Microbiol. 2019, 10, 2010. [Google Scholar] [CrossRef] [Green Version]
  27. Madeira, F.; Park, Y.M.; Lee, J.; Buso, N.; Gur, T.; Madhusoodanan, N.; Basutkar, P.; Tivey, A.R.N.; Potter, S.C.; Finn, R.D.; et al. The EMBL-EBI search and sequence analysis tools APIs in 2019. Nucleic Acids Res. 2019, 47, W636–W641. [Google Scholar] [CrossRef] [Green Version]
  28. Dweep, H.; Sticht, C.; Pandey, P.; Gretz, N. miRWalk--database: Prediction of possible miRNA binding sites by walking the genes of three genomes. J Biomed. Inform. 2011, 44, 839–847. [Google Scholar] [CrossRef] [Green Version]
  29. Sticht, C.; De La Torre, C.; Parveen, A.; Gretz, N. Mirwalk: An online resource for prediction of microRNA binding sites. PLoS ONE 2018, 13, e0206239. [Google Scholar] [CrossRef]
  30. Kozomara, A.; Griffiths-Jones, S. Mirbase: Anointing high confidence microRNAs using deep sequencing data. Nucelic Acids Res. 2014, 42, D68–D73. [Google Scholar] [CrossRef] [Green Version]
  31. Agarwal, V.; Bell, G.W.; Nam, J.; Bartel, D.P. Predicting effective microRNA target sites in mammalian mRNAs. eLife 2015, 4, e05005. [Google Scholar] [CrossRef] [PubMed]
  32. Vlachos, I.S.; Zagganas, K.; Paraskevopoulou, M.D.; Georgakilas, G.; Karagkouni, D.; Vergoulis, T.; Dalamagas, T.; Hatzigeorgiou, A.G. DIANA-miRPath v3.0: Deciphering microRNA function with experimental support. Nucleic Acids Res. 2015, 43, W460–W466. [Google Scholar] [CrossRef] [PubMed]
  33. Zhang, Y.; Fan, M.; Zhang, X.; Huang, F.; Wu, K.; Zhang, J.; Liu, J.; Huang, Z.; Luo, H.; Tao, L.; et al. Cellular microRNAs up-regulate transcription via interaction with promoter TATA-box motifs. RNA 2014, 20, 1878–1889. [Google Scholar] [CrossRef] [PubMed] [Green Version]
  34. Solé, X.; Guinó, E.; Valls, J.; Iniesta, R.; Moreno, V. SNPStats: A web tool for the analysis of association studies. Bioinformatics 2006, 22, 1928–1929. [Google Scholar] [CrossRef] [Green Version]
  35. Bahbahani, H.; Tijjani, A.; Mukasa, C.; Wragg, D.; Almathen, F.; Nash, O.; Akpa, G.N.; Mbole-Kariuki, M.; Malla, S.; Woolhouse, M.; et al. Signatures of selection for environmental adaptation and zebu × taurine hybrid fitness in east african shorthorn zebu. Front. Genet. 2017, 8, 68. [Google Scholar] [CrossRef] [Green Version]
  36. Sinnett, D.; Beaulieu, P.; Bélanger, H.; Lefebvre, J.F.; Langlois, S.; Théberge, M.C.; Drouin, S.; Zotti, C.; Hudson, T.J.; Labuda, D. Detection and characterization of DNA variants in the promoter regions of hundreds of human disease candidate genes. Genomics 2006, 87, 704–710. [Google Scholar] [CrossRef] [Green Version]
  37. Maurano, M.T.; Humbert, R.; Rynes, E.; Thurman, R.E.; Haugen, E.; Wang, H.; Reynolds, A.P.; Sandstrom, R.; Qu, H.; Brody, J.; et al. Systematic localization of common disease-associated variation in regulatory DNA. Science 2012, 337, 1190–1195. [Google Scholar] [CrossRef] [Green Version]
  38. Beecher, C.; Daly, M.; Childs, S.; Berry, D.P.; Magee, D.A.; McCarthy, T.V.; Giblin, L. Polymorphisms in bovine immune genes and their associations with somatic cell count and milk production in dairy cattle. BMC Genet. 2010, 11, 99. [Google Scholar] [CrossRef] [Green Version]
  39. Pal, A.; Sharma, A.; Bhattacharya, T.K.; Chatterjee, P.N.; Chakravarty, A.K. Molecular characterization and SNP detection of CD14 gene of crossbred cattle. Mol. Bio. Inter. 2011, 507, 346. [Google Scholar] [CrossRef] [Green Version]
  40. Morenikeji, O.B.; Thomas, B.N. Disease tolerance and immune response in bovine trypanosomiasis is mediated by CD14 promoter gene. J. Immunol. 2019, 73, 17. [Google Scholar]
  41. Lyons, D.M.; Lauring, A.S. Evidence for the selective basis of transition-to-transversion substitution bias in two RNA viruses. Mol. Biol. Evol. 2017, 34, 3205–3215. [Google Scholar] [CrossRef] [PubMed] [Green Version]
  42. Doud, M.B.; Bloom, J.D. Accurate measurement of the effects of all amino-acid mutations on influenza hemagglutinin. Viruses 2016, 8, 155. [Google Scholar] [CrossRef] [Green Version]
  43. Haddox, H.K.; Dingens, A.S.; Bloom, J.D. Experimental estimation of the effects of all amino-acid mutations to HIV’s envelope protein on viral replication in cell culture. PLoS Pathog. 2016, 12, e1006114. [Google Scholar] [CrossRef] [Green Version]
  44. Zhao, Z.; Fu, Y.X.; Hewett-Emmett, D.; Boerwinkle, E. Investigating single nucleotide polymorphism (SNP) density in the human genome and its implications for molecular evolution. Gene 2003, 312, 207–213. [Google Scholar] [CrossRef]
  45. Morenikeji, O.B.; Thomas, B.N. In silico analyses of CD14 molecule reveal significant evolutionary diversity, potentially associated with speciation and variable immune response in mammals. PeerJ 2019, 7, e7325. [Google Scholar] [CrossRef] [PubMed]
  46. Xue, Y.; Zhao, Z.Q.; Chen, F.; Zhang, L.; Li, G.D.; Ma, K.W.; Bai, X.F.; Zuo, Y.J. Polymorphisms in the promoter of the CD14 gene and their associations with susceptibility to pulmonary tuberculosis. Tissue Antigens 2012, 80, 437–443. [Google Scholar] [CrossRef]
  47. Yuan, Q.; Chen, H.; Zheng, X.; Chen, X.; Li, Q.; Zhang, Y.; Shi, T.; Zhou, J.; Chen, Q.; Yu, S. The association between C-159T polymorphism in CD14 gene and susceptibility to tuberculosis: A meta-analysis. Mol. Biol. Rep. 2014, 41, 7623–7629. [Google Scholar] [CrossRef] [PubMed]
  48. Lomelin, D.; Jorgenson, E.; Risch, N. Human genetic variation recognizes functional elements in noncoding sequence. Genome Res. 2009, 20, 311–319.33. [Google Scholar] [CrossRef] [Green Version]
  49. Jim, J.L.; Shaun, E.G.; Shannon, M.H.; Elisabeth, A.G.; Qin, W. Characterization of cis-Regulatory Elements and Transcription Factor Binding: Gel Mobility Shift Assay. Method. Mol. Biol. 2007, 366, 183–201. [Google Scholar] [CrossRef]
  50. Natalia, J.; Martinez, A.; Albertha, J.M.W. The interplay between transcription factors and microRNAs in genome-scale regulatory networks. Bioessays 2009, 31, 435–445. [Google Scholar] [CrossRef] [Green Version]
  51. Tomso, D.J.; Bell, D.A. Sequence context at human single nucleotide polymorphisms: Overrepresentation of CpG dinucleotide at polymorphic sites and suppression of variation in CpG islands. J. Mol. Biol. 2003, 327, 303–308. [Google Scholar] [CrossRef]
  52. Adefenwa, M.A.; Agaviezor, B.O.; Peters, S.O.; Wheto, M.; Ekundayo, O.J.; Okpeku, M.; Oboh, B.O.; Adekoya, K.O.; Ikeobi, C.O.N.; De Donato, M.; et al. Novel intron 2 polymorphism in the melanophilin gene is in Hardy-Weinberg equilibrium and not associated with coat color in goats. Open J. Genet. 2013, 3, 195–200. [Google Scholar] [CrossRef] [Green Version]
  53. Chuang, J.H.; Li, H. Functional bias and spatial organization of genes in mutational hot and cold regions in the human genome. PLoS Biol. 2004, 10, 1371. [Google Scholar] [CrossRef]
  54. Gibbs, R.A.; Taylor, J.F.; Van Tassell, C.P.; Barendse, W.; Eversole, K.A.; Gill, C.A.; Gill, C.A.; Green, R.D.; Hamernik, D.L.; Kappes, S.M.; et al. Genome-wide survey of SNP variation uncovers the genetic structure of cattle breeds. Science 2009, 324, 528–532. [Google Scholar] [CrossRef] [Green Version]
  55. Bartel, D.P. MicroRNAs: Target recognition and regulatory functions. Cell 2009, 136, 215–233. [Google Scholar] [CrossRef] [Green Version]
  56. Schröder, N.W.; Opitz, B.; Lamping, N.; Michelsen, K.S.; Zähringer, U.; Göbel, U.B.; Schumann, R.R. Involvement of lipopolysaccharide binding protein, CD14, and Toll-like receptors in the initiation of innate immune responses by Treponema glycolipids. J. Immunol. 2000, 165, 2683–2693. [Google Scholar] [CrossRef] [Green Version]
  57. Karki, R.; Pandya, D.; Elston, R.C.; Ferlini, C. Defining mutation and polymorphism in the era of personal genomics. BMC Med. Genom. 2015, 8, 37. [Google Scholar] [CrossRef] [Green Version]
  58. Huang, J.; Liu, L.; Wang, H.; Zhang, C.; Ju, Z.; Wang, C.; Zhong, J. Variants and gene expression of the TLR2 gene and susceptibility to mastitis in cattle. Asian J. Anim. Vet. Adv. 2011, 6, 51–61. [Google Scholar] [CrossRef]
  59. Zhang, Z.; Wang, X.; Li, R.; Ju, Z.; Qi, C.; Zhang, Y.; Guo, F.; Luo, G.; Li, Q.; Wang, C.; et al. Genetic mutations potentially cause two novel NCF1 splice variants upregulated in the mammary gland, blood and neutrophil of cows infected by Escherichia coli. Microbiol. Res. 2015, 174, 24–32. [Google Scholar] [CrossRef]
Figure 1. Alignment of the CD14 gene promoter nucleotide sequences of N’Dama and White Fulani. Blue letters within alignment indicate sites of sequence diversity between animal breeds.
Genes 11 00112 g001
Figure 2. SNP overlap of the CD14 gene promoter between White Fulani and N’Dama cattle. Forty -one SNPs were concomitant between White Fulani and N’Dama cattle while 13 were unique for N’Dama. No unique SNPs were identified for White Fulani.
Genes 11 00112 g002
Figure 3. Total number of common SNP types between N’Dama and White Fulani. SNP types in the study include transversions (56.1%), followed by transitions (19.5%), insertions (12.2%), and deletions (9.8%). One SNP (2.4%) is a tandem repeat (not shown).
Genes 11 00112 g003
Figure 4. Effect of identified N’Dama-specific single nucleotide polymorphisms on transcription factor binding sites.
Genes 11 00112 g004
Figure 5. Genotypic frequency of three selected N’Dama-specific CD14 gene promoter single nucleotide polymorphism. We elucidated the genetic diversity of three (out of 13) selected N’Dama-specific SNPs (n = 103) using Taqman SNP genotyping assay (ThermoFisher). Blue bars: Wild type variant; red bar: Heterozygotes; green bars: Mutant variants. The three SNPs are rs721906237; C/A; rs732566082, G/C; and rs799300279, G/A; *** significant (p < 0.0001); ** (p < 0.001); * (p < 0.01).
Genes 11 00112 g005
Table 1. Common single nucleotide polymorphisms (SNPs) information at the CD14 gene promoter region between N’Dama and White Fulani cattle.
S/NSNP IDPositionMutationSubstitution TypeConsequence on Transcription Sites
Number of Sites LostNumber of Sites Gained
1rs47106968753449742C → ATransversion23
2rs43845085053449670C → TTransversion10
3rs47294722853449666C → ATransversion01
4rs45298732253449661G → CTransversion30
5rs51714886553449741G → CTransversion11
6rs44245426853449654G → ATransition22
7rs52298765151766435-/CInsertion01
8rs52098506751766431T/-Deletion10
9rs47391941153449641T → ATransversion24
10rs45509248253449635A → TTransversion42
11rs43813935453449628A → CTransversion42
12rs46954742553449627G → CTransversion41
13rs45265287153449622T → CTransition12
14rs51598845151766408-/GInsertion--
15rs52383382251766400T/-Deletion--
16rs51892657951766395-/GInsertion--
17rs52676820151766392T/-Deletion--
18rs45233133753449596G → TTransversion10
19rs44307121851766373(T)12/(T)13/(T)14Tandem repeat--
20rs43948412751766372-/TInsertion--
21rs73087855751766372T/-Deletion--
22rs44028205353449583A → TTransversion17
23rs79736807651766324-/TInsertion--
24rs21010906453449421G → ATransition21
25rs47318509153449334C → TTransition11
26rs52136037453449277C → TTransition12
27rs45485816053449264G → TTransversion01
28rs43237157053449221C → ATransversion13
29rs46688014553449214A → CTransversion32
30rs44694791553449212T → CTransition33
31rs48161732853449165T → GTransversion11
32rs46788992153449162G → TTransversion14
33rs45074756653449152G → TTransversion011
34rs48200068653449147G → CTransversion59
35rs45885372353449144T → GTransversion52
36rs43867080253449139G → TTransversion51
37rs47946810553449129A → TTransversion10
38rs45931829353449109T → CTransition27
39rs44240263953449098A → CTransversion16
40rs47393033953449097C → ATransversion52
41rs45685491653449093T → CTransition512
Total: 69Total: 89
Table 2. N’Dama-specific single nucleotide polymorphisms identified at the CD14 gene promoter region.
S/NoSNP IDPositionMutationSubstitution TypeConsequences on Transcription Sites
Number of Sites LostNumber of Sites Gained
1rs51733885953449994G → ATransition04
2rs72356608251766726G → CTransversion01
3rs79930027951766718A → GTransition20
4rs72335232551766710C → TTransversion10
5rs79914684951766708A → GTransition01
6rs47504172051766680G → CTransversion20
7rs72190623751766666C → ATransversion10
8rs45468691951766632C → ATransversion02
9rs52278305351766588G → TTransversion40
10rs13266634953449790C → TTransition31
11rs71602813453449782T → GTransversion01
12rs13741569253449769A → CTransversion01
13rs13694966851766556A/-Deletion01
Total: 13Total: 12
Table 3. List of transcription factor binding sites associated with N’Dama-specific CD14 gene promoter SNPs.
TFBSTFBS InformationPositionStrandMatrix SimulationSequence
IRF2.01Interferon regulatory factor 2122(−)0.945caatgaatgaaagtGAAAagtgaaa
ZNF219.0Kruppel-like zinc finger protein 219213(−)0.920caggcCCCCcttccctgggattc
GCM1.03Glial cells missing homolog 1 (secondary DNA binding preference)222(−)0.851gtgacCCCCcataga
PLAGL1.02Pleiomorphic adenoma gene-like 1 (secondary DNA binding preference)225(+)0.816atggGGGGtcacacagagtcaga
KLF12.01Krueppel-like factor 12 (AP-2rep)338(+)0.938ggtcccaGTGGttaagact
HMBOX.01Homeobox containing 1340(+)0.834tcccagtgGTTAagact
ZTRE.01Zinc transcriptional regulatory element358(−)0.963gtgGGAGtgcagtctta
E2F.02E2F, involved in cell cycle regulation, interacts with Rb p107 protein420(+)0.849cagcagggcCAAAaaaa
OVOL1.01Zinc finger transcription factor OVO homolog-like 1438(+)0.891aaatctGTTActttc
CP2.02LBP-1c (leader-binding protein-1c), LSF (late SV40 factor), CP2, SEF (SAA3 enhancer factor)442(+)0.846aACTGttactttcttaata
CEBP.01CCAAT/Enhancer Binding Protein453(−)0.941tttattaaGAAAgta
HMX2.03Hmx2/Nkx5-2 homeodomain transcription factor466(−)0.822tgttctTTAAatgtgttta
HNF4.02Hepatic nuclear factor 4, DR2 sites519(−)0.775gaagttggtctAAAGaacagcttcc
STAT6.01STAT6: signal transducer and activator of transcription 6529(−)0.899stagTTCCagagaagaagt
RREB1.01Ras-responsive element binding protein 1588(+)0.840cCCCAaaatatccag
AIRE2.02Autoimmune regulatory element binding factor589(−)0.885actggatattTTGGg
BTEB3.01Basic transcription element (BTE) binding protein, BTEB3, FKLF-2610(+)0.948ggaaattcagGGAGttgaa
RU49.04Zinc finger transcription factor RU49, zinc finger proliferation 1 - Zipro1683(+)1.000aAGTAcc
CEBPB.01CCAAT/enhancer binding protein beta873(−)0.966gaaatttcGCAAtga
Abbreviations; TFBS: Transcription Factor Binding Sites. The red colors in the TFBS sequences are the conserved motifs in the binding sites that specifically binds to the transcription factors.
Table 4. List of micro RNAs (miRNAs) and associated SNP variants identified at the CD14 gene promoter region.
miRNA Variantsno of SNPPositionSequenceAccession NumberVariants IDs
bta-miR-2381C/A
C/G
T/A/C
T/G
C/G
T/G
G/C
71-19CAGGCUGCUCUGUGCUUGGCUMIMAT0011929rs472162209
rs442506482
rs462738247
rs476414754
rs438710923
rs458831864
rs478292631
bta-miR-2340--3-17GGACUUCCCUGGUGGUCUUGUGMIMAT0011875N/A
bta-miR-12032T/G1180-200UCUGGCCUGGAGAAGCCCUGGMIMAT0046725rs438484117
bta-miR-22-5p--15-36AGUUCUUCAGUGGCAAGCUUUAMIMAT0003826N/A
bta-miR-22-3p--53-73AAGCUGCCAGUUGAAGAACUGMIMAT0012536N/A
Abbreviations; N/A: Not applicable. Red letters indicate SNP position in the miRNA sequence. miRNAs: micro ribonucleic acids; red color nucleotides depict the mutation spots within the miRNA sequences.
Table 5. Genetic diversity of selected N’Dama-specific polymorphisms in the CD14 gene promoter region.
PolymorphismGenotypeGenotypic Count (n = 103)FrequencySignificance
rs721906237C/C00NS
C/A70.03*
A/A940.97***
rs732566082G/G00NS
C/G10.01NS
C/C1020.99***
rs799300279G/G150.15*
G/A510.50***
A/A350.35**
AlleleAllelic CountFrequencySignificance
rs721906237C70.03***
A1950.97***
rs732566082G10.01***
C2050.99***
rs799300279G810.40***
A1210.60***
NS: Not significant; *** significant (p < 0.0001); ** (p < 0.001); * (p < 0.01).
Table 6. Estimated haplotype frequencies of selected N’Dama-specific CD14 gene promoter SNPs.
HaplotypeHaplotype DefinitionHaplotype Frequencyp Value
rs721906237
(C/A)
rs723566082
(G/C)
rs799300279
(A/G)
H1ACA0.55940.002
H2ACG0.40120.046
H3CCA0.03460.990
H4AGA0.00490.068
H5CCG0NS
Abbreviations: NS: Not significant. SNPs at the three loci rs721906237, rs723566082, and rs799300279 define five different haplotypes. C/A, G/C, and A/G denote the alleles at the three loci.

