Article

The Pituitary Transcriptional Response Related to Feed Conversion in Pigs

by
Katarzyna Piórkowska
1,*,
Kacper Żukowski
2,
Mirosław Tyra
3,
Magdalena Szyndler-Nędza
3,
Karolina Szulc
4,
Ewa Skrzypczak
4 and
Katarzyna Ropka-Molik
1
1
Department of Animal Molecular Biology, National Research Institute of Animal Production, 31-047 Cracow, Poland
2
Department of Cattle Breeding, National Research Institute of Animal Production, 31-047 Cracow, Poland
3
Department of Pig Breeding, National Research Institute of Animal Production, 31-047 Cracow, Poland
4
Department of Animal Breeding and Product Quality Assessment, Poznań University of Life Sciences, 60-637 Poznań, Poland
*
Author to whom correspondence should be addressed.
Genes 2019, 10(9), 712; https://doi.org/10.3390/genes10090712
Submission received: 31 July 2019 / Revised: 11 September 2019 / Accepted: 12 September 2019 / Published: 14 September 2019
(This article belongs to the Section Animal Genetics and Genomics)

Abstract

:
Over the decades, pig breeding objectives have focused on improving the meat content in the carcass without taking into consideration the more effective fattening indicators that affect feed conversion. At present, pig growth traits associated particularly with animal feeding have become crucial due to their economic significance. This is especially evident in countries where pigs are maintained on large farms. The present study indicates that pituitary differentially expressed genes (DEGs) are activated in response to variable feed conversion (FC) in pigs. The experiment included two native Polish breeds: Puławska and Złotnicka White (ZW). The whole pituitary transcriptome was sequenced using next-generation sequencing (NGS) technology. The RNA-seq method identified over 500 and 300 DEGs in the pituitaries of the ZW and the Puławska pig populations, respectively, that were associated with hormonal regulation, notch signaling, and Wnt pathways. Lower FC in the ZW pigs favoured increased fat content in the body and significantly higher prolactin expression. The obtained results indicate that low FC values in pigs are related to slower growth or increased fat content, which suggests various pituitary responses. Therefore, the identified candidate genes were not directly associated with feed conversion values but with other factors. However, the present study delivers new insights into pituitary regulation in pigs.

1. Introduction

Over the years, pig breeding objectives have focused on improving the content of meat in the carcass, and significant progress in this area has been achieved [1,2]. In Poland, no actions have yet been undertaken to develop the effectiveness of fattening indicators that impact feed conversion (FC). Today, the largest share of pig maintenance costs, 80%, is for feeding, including forage expenses. A few years ago, pig feeding costs were difficult to estimate due to the ‘homemade’ fodders used in small farms. At present, farm structures have significantly transformed, with the fattening bases of purchased components forming a low share of self-produced cereals. Therefore, feed conversion has become an essential factor in countries where large pig farms are prevalent. Moreover, feed conversion is an economic factor included in breeding programs and is significant in the whole utility model [3].
The pituitary is an overarching endocrine gland controlling various bodily functions and playing a role in balancing hormone levels. It is located in a small bony cavity of the skull below the hypothalamus. The pituitary manages energy balance, the body’s water level and temperature, heartbeat, urination, sleep, hunger, and thirst [4] and is composed of two essential lobes—anterior and posterior. The anterior pituitary has five types of endocrine cells, which secrete thyroid-stimulating hormone (TSH), adrenocorticotropic hormone (ACTH), follicle-stimulating hormone (FSH), luteinizing hormone (LH), growth hormone (GH), and prolactin (PRL). In turn, the posterior lobe releases oxytocin and antidiuretic hormones on demand [5]. The pituitary is believed to be the most important endocrine organ promoting animal postnatal growth [6]. This action is associated with the GH level induced by the growth hormone-releasing hormone (GHRH) signal or the paracrine LH stimulation that modulates GH expression, hormone synthesis, and secretion [7]. Nutritional signals, such as insulin, leptin, insulin-like growth factor I (IGF-I), and specific metabolites, like glucose and free fatty acids (FFA), can modulate GH and LH secretions [8].
In turn, new technology used in molecular biology for next-generation sequencing (NGS) enables a more comprehensive analysis of cell or tissue states. Moreover, due to the NGS, the differentially expressed genes (DEGs) involved in crucial molecular processes can be recognized. The pituitary genes’ expression was examined in various contexts, such as carcinogenesis [9,10], the identification of pituitary stem cells [11], the interpretation of behaviour [12], and the explanation of metabolic disorder bases [13]. Because the pituitary is the predominant gland determining body growth, its transcriptome profiling also served to identify the candidate genes for postnatal development in miniature pigs [14].
The present study aimed to indicate the pituitary candidate genes for feed conversion because it is one of the most important economic factors determining the cost of pig breeding. This research included two native Polish pig breeds, Puławska and Złotnicka White, that are in the national conservation program and were not selected.

2. Materials and Methods

2.1. Ethics Approval and Consent to Participate

The research was performed on biological material derived from pigs maintained and slaughtered in the Pig Test Station (National Research Institute of Animal Production). In the Pig Testing Station, pigs are slaughtered, dissected and, after carcass evaluation, meat is intended for consumption. Therefore, our research does not require the approval of the Animal Experimentation Committee.

2.2. Animals

The study included Złotnicka White (ZW, n = 16) and Puławska (n = 16) female pigs. For each breed, the gilts differed in their feed conversion (FC) and showed high and low feed conversion values. The pigs came from different farms and were unrelated. The tests were performed in the Pig Test Station (PTS) of the National Research Institute of Animal Production in Chorzelów where all animals were maintained under the same housing and feeding conditions. The PTS test began when the pigs reached 30 kg and finished when the pigs reached 100 ± 2.5 kg of body weight and had an age of 184 ± 26 days. During the experiment, the growth traits were recorded according to the PTS procedure. After the trial, the pigs were slaughtered and dissected 24 h later. The pig carcass traits were measured according to Tyra and Żak [15]. Up to 20 min after slaughter, whole pituitaries were collected and stabilized by an RNA-later solution (Ambion, Cambridge, UK), and then they were frozen at −20 °C after 24 h chilling at 4 °C. The differences in body composition between the analysed pig groups with variable FCs were estimated by an ANOVA test (SAS Enterprise v. 7.1 with default settings; SAS Institute, Cary, NC, USA).

2.3. cDNA Library Construction

The whole pituitaries were homogenized with a bead method using Bullet Blender24 (Next, Advance, Troy, MI, USA). The RNA was isolated by a PureLink™ RNA Mini Kit (Ambion, Cambridge, UK) according to the manufacturer’s recommendations. The concentration and quality of the RNA were estimated using TapeStation2200 (Agilent, Palo Alto, CA, USA). The RIN parameter values for all the RNA samples were over 7. The TruSeq RNA Sample Preparation Kit v2 (Illumina, San Diego, CA, USA) was used for cDNA library preparation, with 300 ng of RNA as the input amount according to the supplied protocol. The reverse transcription during the procedure was non-strand-specific. Flowcell clustering was performed using the TruSeq SR Cluster Kit v3-cBot HS (Illumina, San Diego, CA, USA). The sequencing was conducted on a HiScanSQ System (Illumina, San Diego, CA, USA) in single 85 bp cycles (four technical replicates) using TruSeq Kit v3-HS chemistry (Illumina, San Diego, CA, USA), as described by Piórkowska et al. [16].

2.4. Raw Read Processing

The raw reads were processed using the FastQC and Flexbar with default parameters. The cleaned reads with a quality higher than 20 (score Q) and more than 36 base pairs were aligned to the Sus_scrofa 11.1 genome assembly (GCA_000003025.6) with reference annotation containing the 22,452 genes listed in the Ensembl database using Bowtie 2 v. 2.3.5.1 and represented by the Fragments Per Kilobase of transcript per Million mapped reads (FPKM) value. The alignment was performed using RNA-Seq by Expectation Maximization (RSEM, v. 1.3.0) supported by the Spliced Transcripts Alignment to a Reference (STAR) aligner, and the statistics were generated by RNA-SeQC v1.1.8; all used default parameters. The sequence data (GSE122343—Puławska, GSE132522—Złotnicka White) has been submitted to the Gene Expression Omnibus (GEO).

2.5. Analysis of Differentially Expressed Genes (DEGs)

The analysis of differentially expressed genes (DEGs) was performed using DESeq2 [17] at a false discovery rate (FDR) ≤0.05 (default setting). For each breed, the pituitary DEGs (fold-change ≥1.3) in response to the variable FC were estimated. The STRING functional protein association networks v. 11.0 and PANTHER databases were used for the functional analysis based on the Sus scrofa reference applying FDR ≤ 0.05 correction and default parameters. The gene co-expression within the DEGs was estimated using Cytoscape v. 3.7.1 using a CytoHubba plugin analysis, with the top 5 nodes ranked by a Maximal Clique Centrality (MCC) test and the STRING gene network (default settings).

2.6. Validation of RNA-Seq Results and Estimation of Transcript Abundance

The qPCR validation included seven genes and RPS29 and OAZ1 as housekeeping controls [18] as well as all the pigs used in the RNA-seq analysis. The genes for validation were chosen based on their relationship to hormonal regulation. Table S1 shows the primers, probes, and assays used in the qPCR method. The similarity between the qPCR and RNA-seq results were calculated using Pearson’s correlation (SAS Enterprise). The gene expression levels were calculated using the delta-delta CT method, as described by Pfaffl [19].
The significant differences between the gene expression levels were estimated using an ANOVA test (Duncan’s post hoc test; SAS Enterprise v. 7.1 with default settings; SAS Institute, Cary, NC, USA).

3. Results

3.1. Animal Traits

Both of the investigated pig populations belong to native breeds that are in the national conservation program. In this experiment, pigs were selected based on their feed conversion values, and they were qualified into two feed conversion groups (high feed conversion (HFC) and low feed conversion (LFC)). The fattening measurements showed that, within the Puławska breed, HFC animals took more feed per day compared to the LFC gilts. In ZW pigs, this effect was not observed. In turn, carcass measurements indicated that HFC pigs achieved 100 kg of body mass later, and their ham mass was lower compared to that of the LFC pigs. Within the Złotnicka White group, a higher FC favoured increased fat content. In Puławska pigs, this effect was not observed because the slower-growing pigs were lean (Table 1).

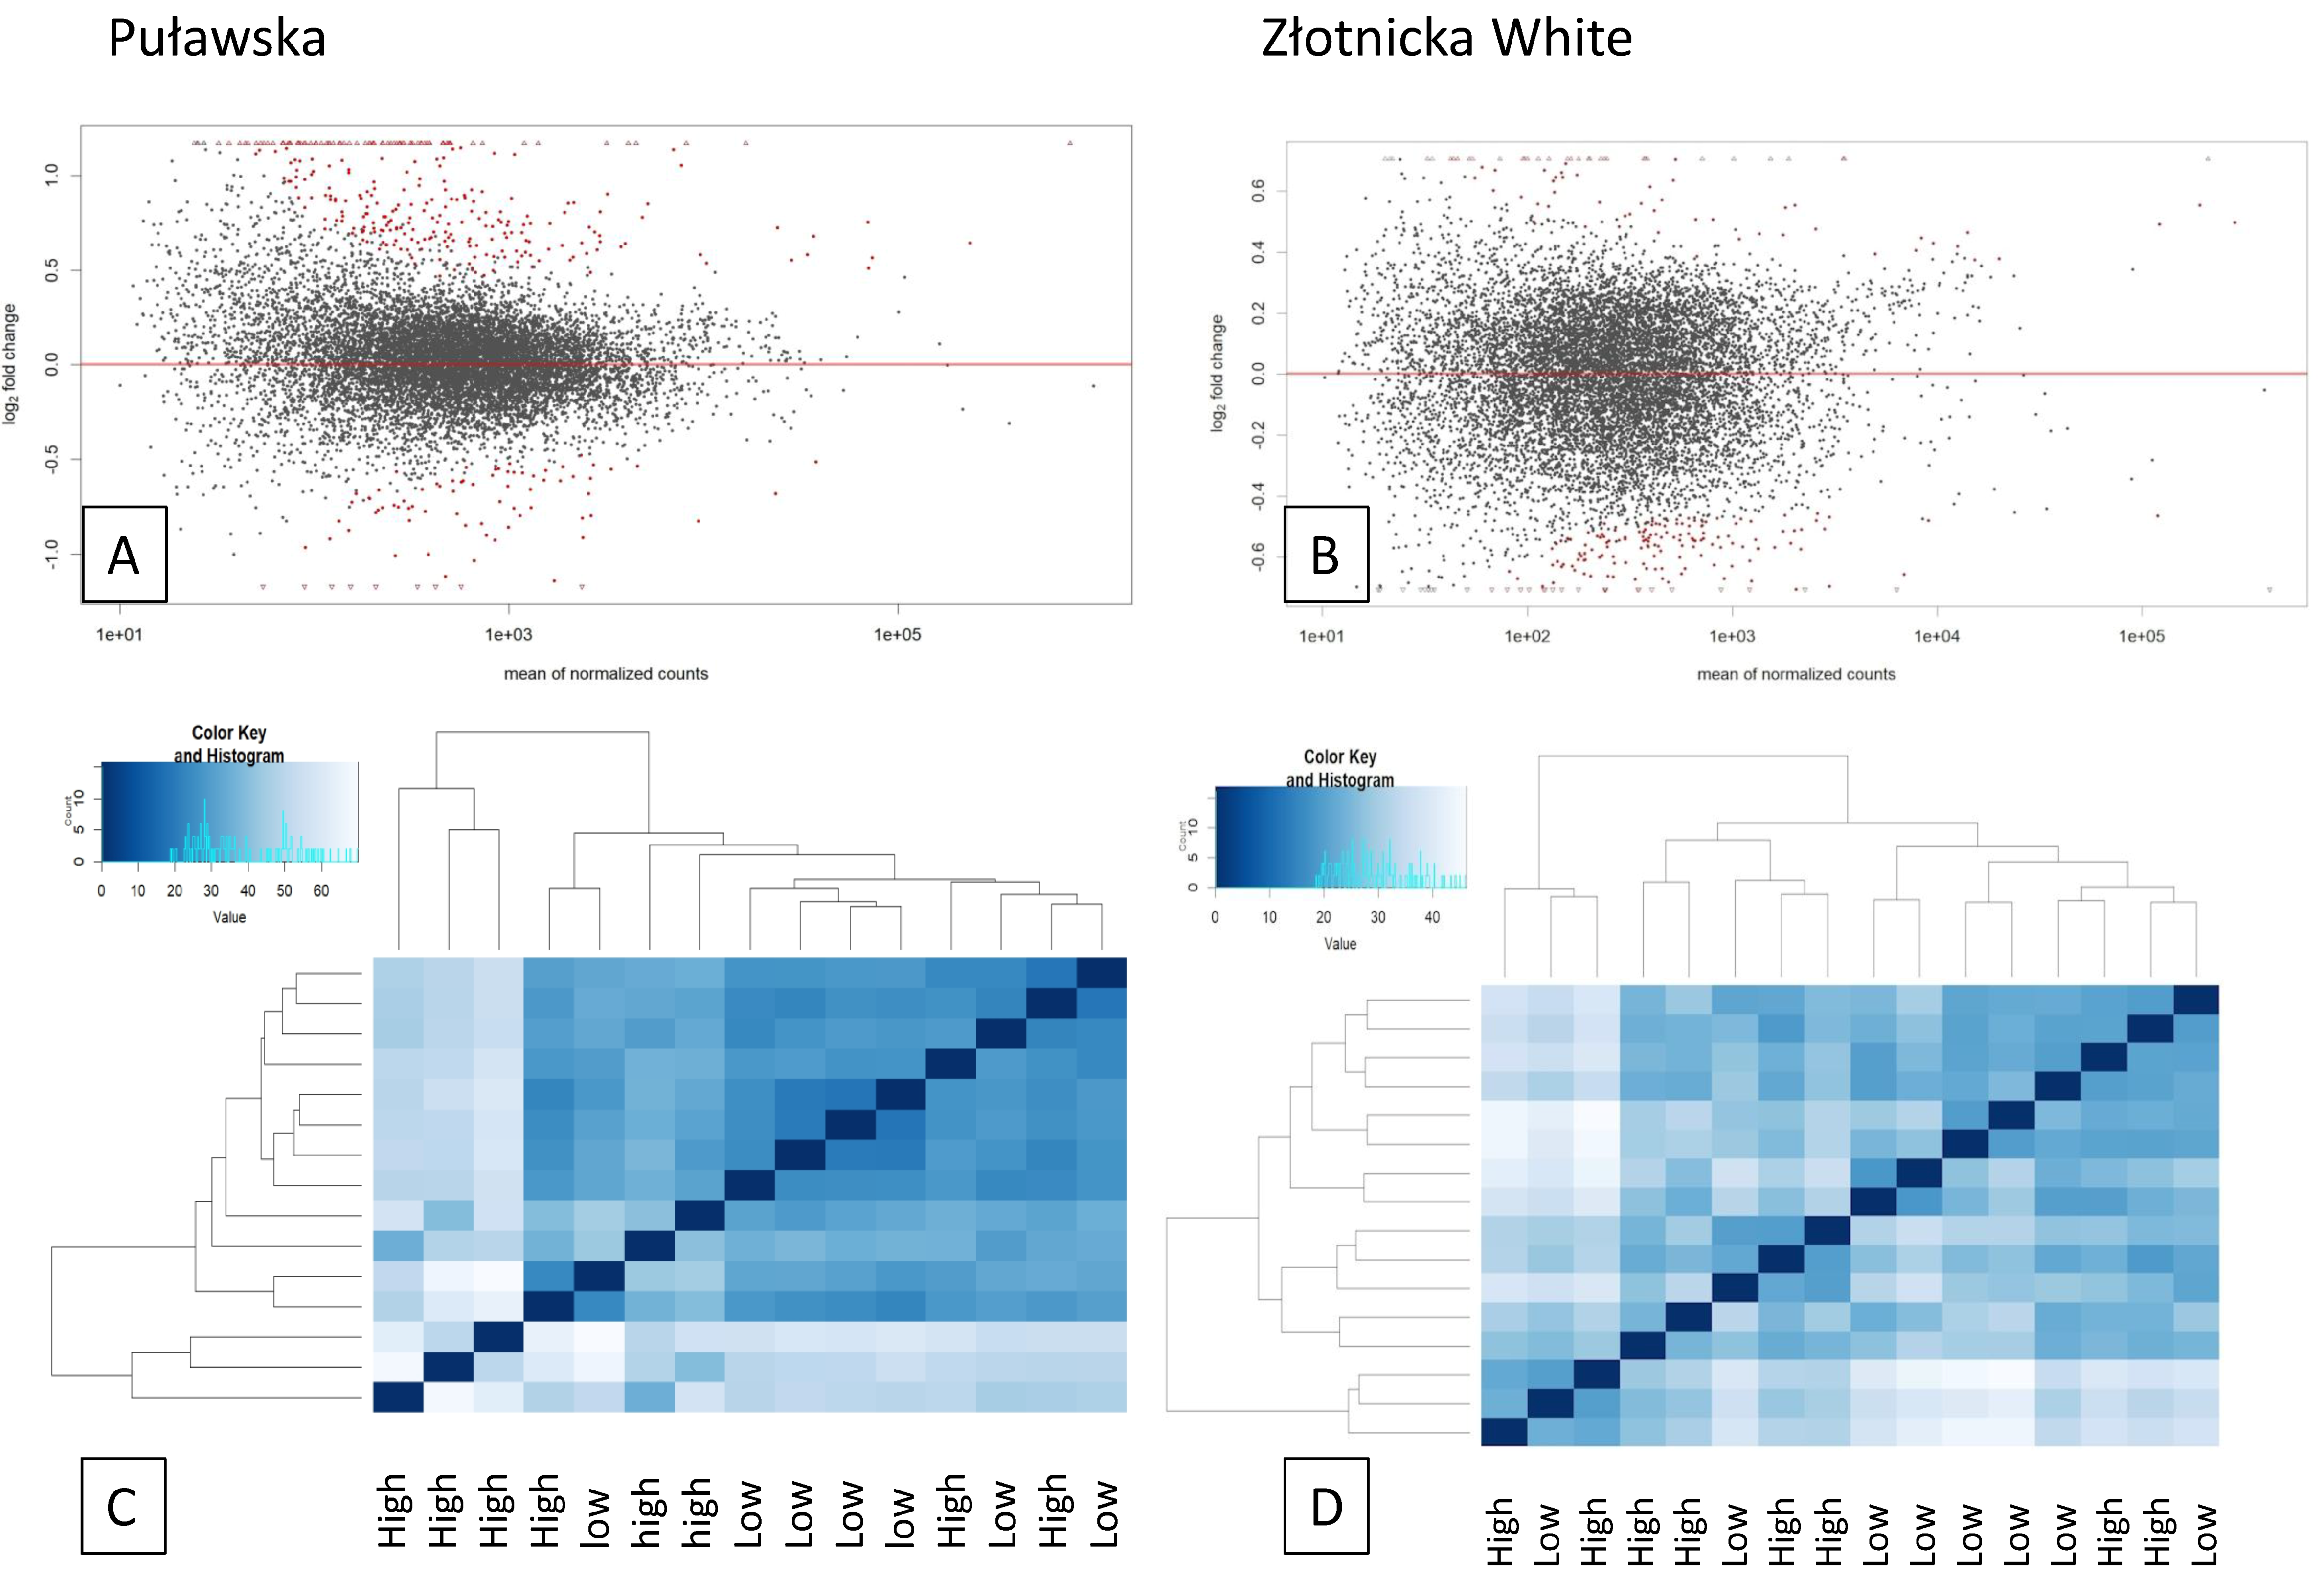
3.2. Analysis of Differentially Expressed Genes
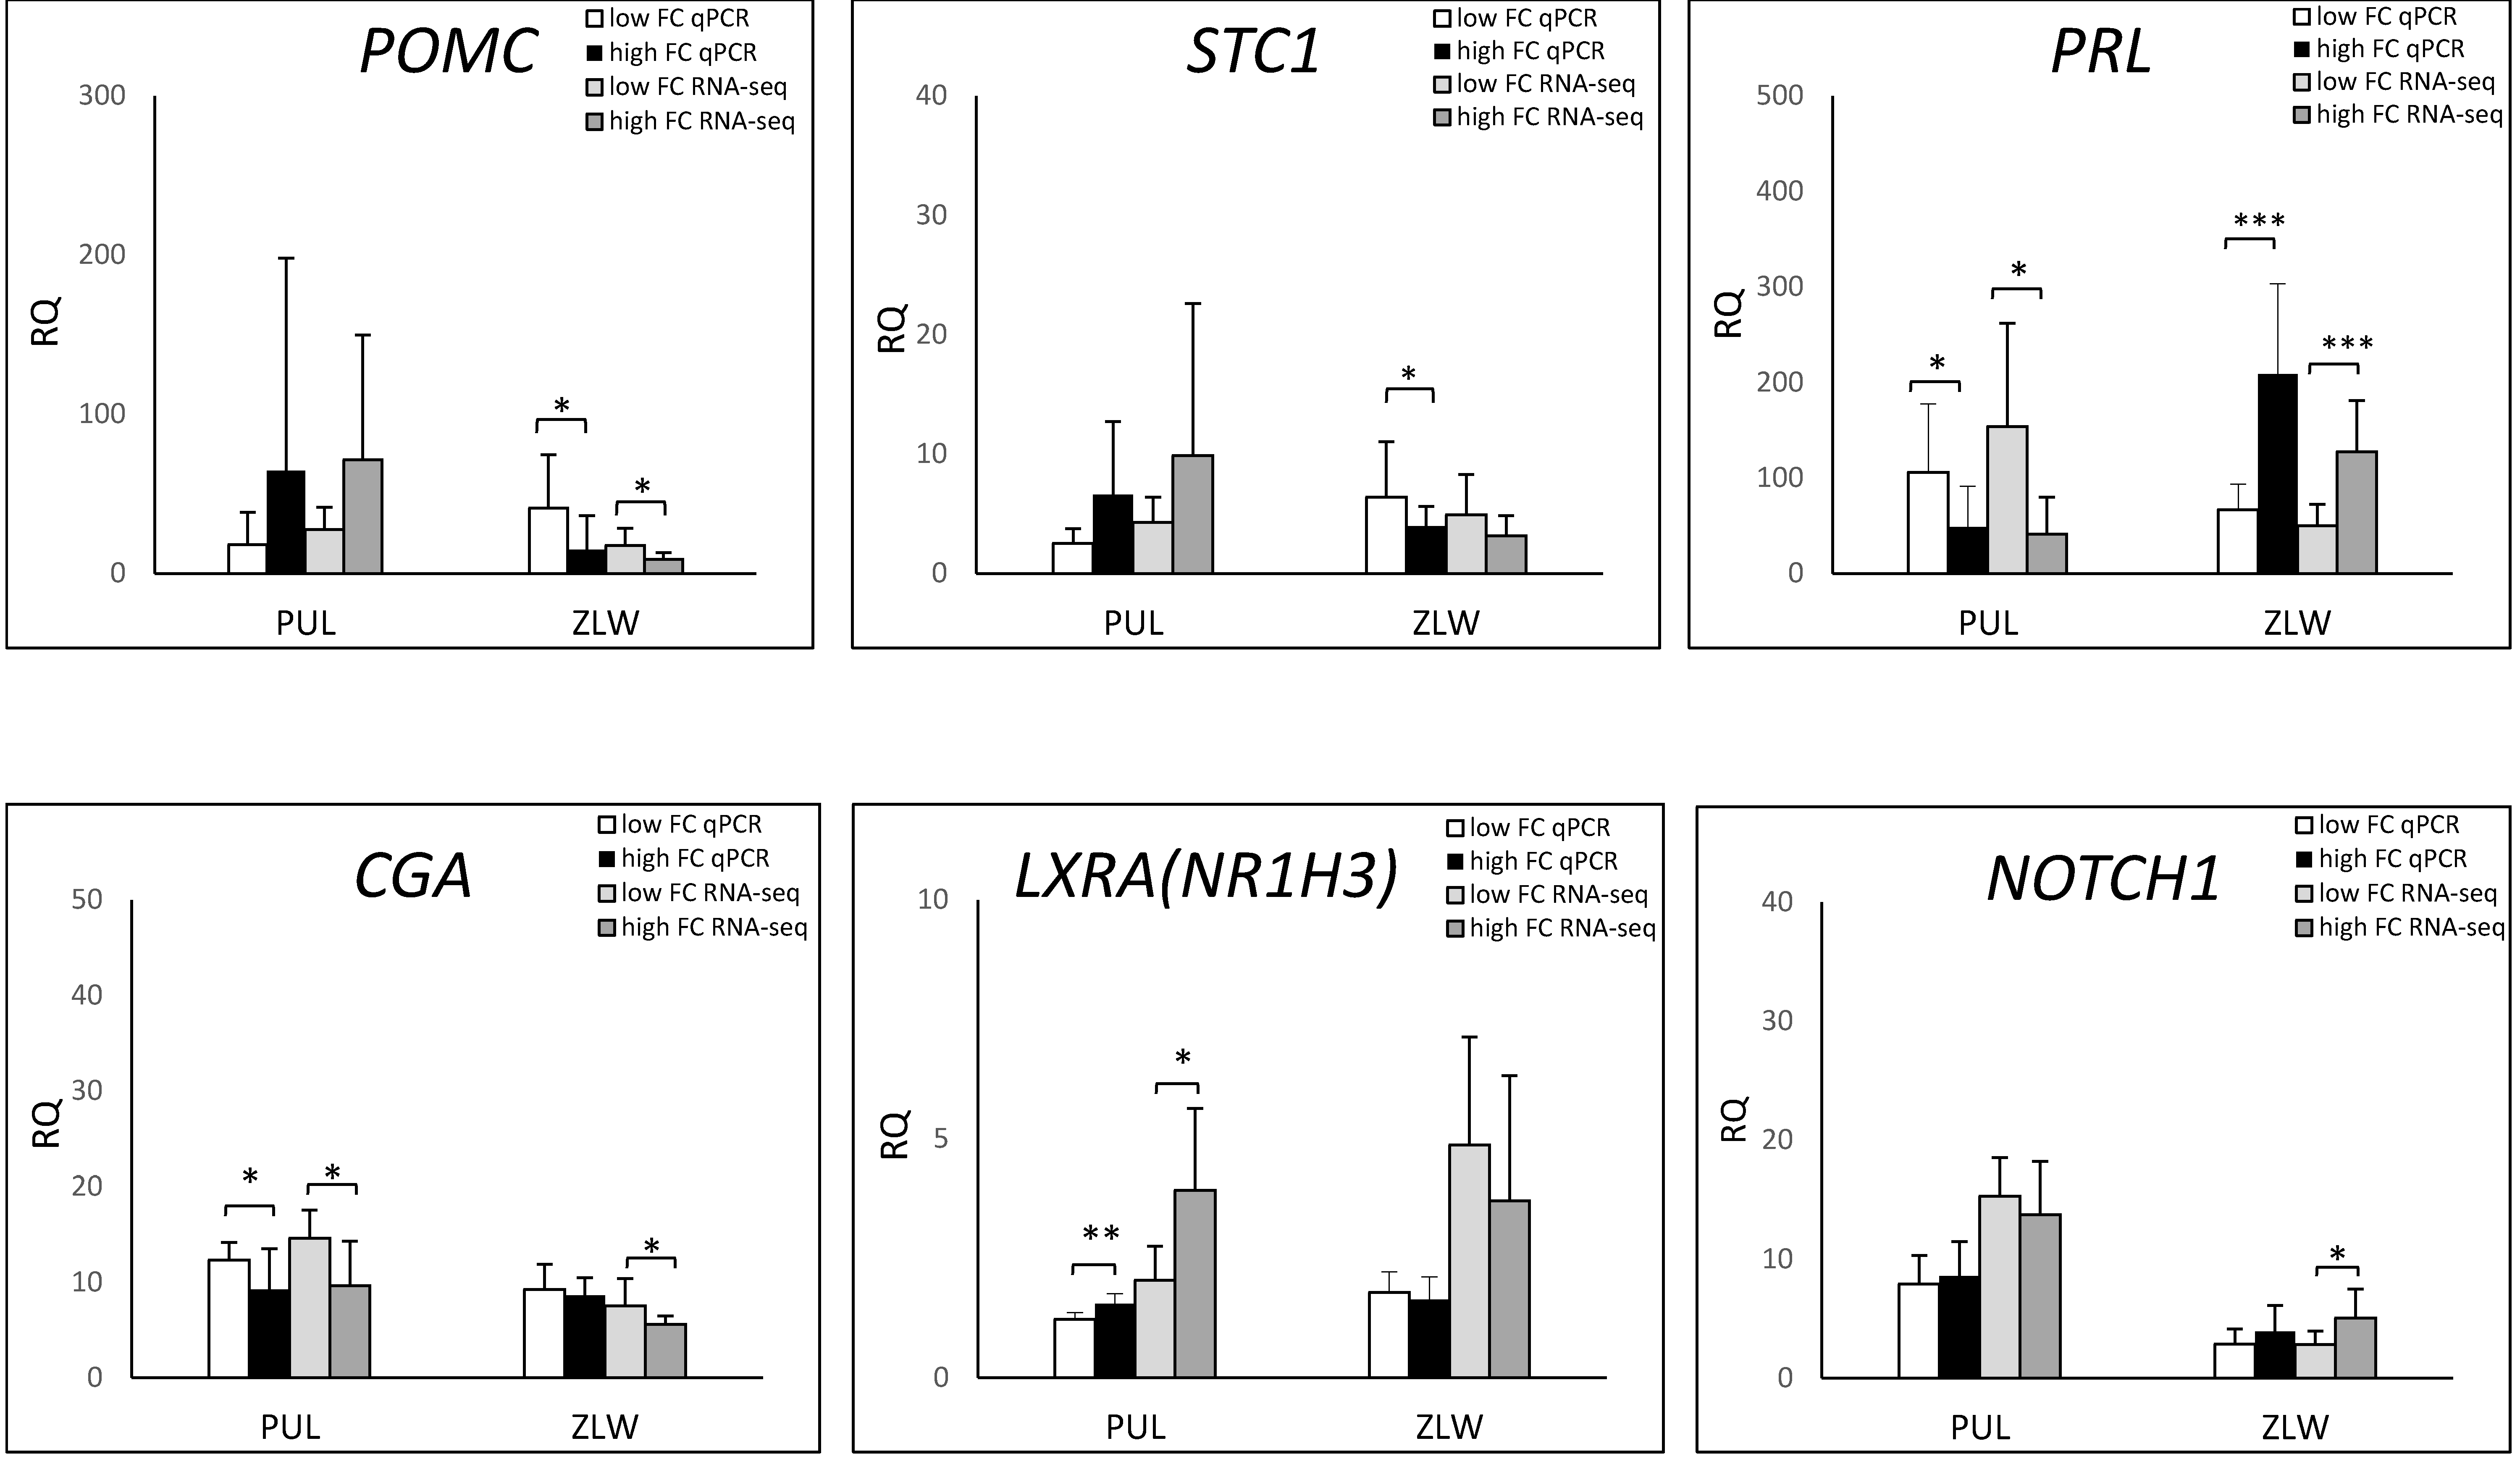
The statistics are shown in the Supplementary File in Figure S1. After processing, an average of 90% and 80% of the reads (Sus scrofa 11.1) were mapped to the pig reference genome, including 77% and 64% to exonic regions, and 8% and 9% to intronic regions for Puławska and ZW pigs, respectively. The Deseq2 analysis showed that the pituitary response to variable feed conversion was associated with DEGs of 293 and over 500 (a fold-change of ≥1.3 at an adjusted p-value ≤ 0.05) (Figure 1) in Puławska and ZW pigs, respectively. DESeq2 results are available at https://bit.ly/2Wtbqlb.
The comparison of the DEGs between Puławska and Złotnicka White breeds showed 57 shared genes that encode proteins involved in growth factor binding, glucagon signalling, cortisol synthesis, secretion, and triglyceride homeostasis (Figure 2).
The pituitary responses related to changes in feed conversion indicated approximately 300 DEGs in Puławska pigs that encode proteins involved in the corticotropin-releasing factor receptor signaling pathway (POMC, GNA14), the negative regulation of the canonical Wnt signaling pathway (TLE2, FRZB, TLE1, SFRP5), the positive regulation of cholesterol transport (LXRA, APOA1, APOE, ANXA2), the regulation of hormone levels (CYP1B1, APOA1, ANO1, AQP1, NR1D1, CRYM, DDO, SPP1, ARRB1, SOX8, BIRC5, CLCN2), a response to oxidative stress (CAT, MAP3K5, CYP1B1, APOD, SPHK1, APOE, NR4A2, AIF1, MT3, NOR-1, RBPMS), and regulation of the insulin-like growth factor (IGF) transport and uptake by insulin-like growth factor binding proteins (IGFBPs) (CHRDL1, SPP1, C4A, LTBP1, APOE, IGFBP6, IGF2) (Table S2, https://bit.ly/2Wtbqlb). In turn, Złotnicka White DEGs were involved in the integrin signalling pathway (LAMB2, ITGAE, MAP3K5, COL16A1, TLN1, VCL, COL4A2, COL5A1, COL12A1, FLNA, COL1A2, ITGBL1, LAMC1, COL1A1, LAMB1, ITGA6, BCAR1, COL6A3, ITGA3, ARPC3, ACTN4, NRAS, LAMA5); positive regulation of cholesterol efflux (LRP1, APOE, PTCH1, NR1H3, ABCG1, ABCA1); gene silencing (DNMT3A, AGO2, UBE2B, DHX9, TNRC6A, RIF1, ARID1A, TNRC6C, DNMT1, GIGYF2, DICER1); positive regulation of the Notch signaling pathway (NOV, MAML3, AAK1, NOTCH1, ROBO1, ERH, ZMIZ1, KIT, EP300, CREBBP, PDCD10), the Wnt signaling pathway (33 genes), and the response to hormones (71 genes) (Table S3, https://bit.ly/2Wtbqlb).
The Cytoscape (Cytohubba plugin) and STRING indicated genes that were co-expressed in each of the analysed pig groups (Figure 3 and Figure 4). The analysis identified EP300 as a hub gene correlated with elevated fat deposition and high feed conversion values in the pituitary of Złotnicka White pigs. The EP300 was co-expressed with the other genes involved in Notch1 (CREBP), Wnt (CREBP, MTOR, and CHD8), and thyroid hormones (NCOR1, MED12, MED13L, and CREBP) signalling pathways. Moreover, the co-expression analysis showed that several co-transcripted genes play a role in thermogenesis; these genes include ATP8, ND5, ND6, ND4L, ARDI1A, and SMARCA4. In low FC Złotnicka White pigs, co-expressed genes were associated with ribosome biogenesis and the translation process. The STRING network also reveals that POMC and CGA co-expression is involved in hormonal regulation. In Puławska pigs, co-expressed genes positively correlated with feed conversion to play a role in thermogenesis, respiratory electron transport, and ATP metabolism processes. The co-expression analysis between the DEGs in LFC Puławska pigs did not find any connections.

3.3. qPCR Analysis

The relative quantification for seven DEGs (POMC, NOTCH1, CGA, NR1H3, PRL, RYR2, and STC1) was estimated by the qPCR method. The lowest R coefficient (0.39) obtained for the NR1H3 gene. This observation was likely the consequence of numerous isoforms encoded by this gene. The R coefficients for the other genes were 0.97, 0.81, 0.84, 0.91, 0.89, and 0.80 for POMC, NOTCH1, CGA, PRL, RYR2, and STC1, respectively. The qPCR analysis confirmed the RNA-seq results. The comparison of the RQ levels between Puławska and Złotnicka White pigs showed an opposite tendency in POMC expression, depending on the pig breed. For Puławska pigs, POMC expression correlated with increased FC. For Złotnicka White pigs, an elevated POMC mRNA level was observed in the faster-growing animals. The same tendency was recorded for PRL, STC1, and CGA genes (Figure 5).

4. Discussion

Feed conversion has become one of the most critical factors in animal production, including pig farms. The present study, using next-generation sequencing, shows the candidate genes and biological processes that are induced in the pituitary response to variable feed conversion. The pituitary is one of the most essential glands, as it regulates the body’s water level, temperature, heartbeat, urination, sleep, hunger, and thirst [4]. Therefore, most processes activated in this organ translate into phenotypic traits and bodily functions.

4.1. Inducing of Pituitary Gene Expression in Response to Variable Feed Conversion in Pigs

The two pig breeds involved in the present investigation, although they belong to native populations without selection pressure, often displayed opposite pituitary responses dependent on feed conversion. This state could be related to differences in their growth process and the increased fat content in Złotnicka White pigs. Nevertheless, in both breeds, numerous shared DEGs were identified to be involved in cholesterol efflux, lipid metabolism (regulated by peroxisome proliferator-activated receptor-alpha), and cholesterol transport. Among these DEGs were two relevant to lipid metabolism, LXRA and APOE. The liver X receptor alpha (LXRA) regulates cholesterol, lipid, and glucose metabolism [20], and its impaired protein function implicates it in diabetes and cardiovascular disease. Although the LXRA mRNA level was low in the pituitary, the present study found the differences in its gene expression to be dependent on feed conversion values. Within Puławska pigs, increased LXRA expression favoured higher FC values, with the opposite tendency in Złotnicka White pigs. Nilsson et al. [20] identified that the LXR agonist treatment-induced POMC secretion in the pituitary cell culture. The authors suggested that LXRs independently interfere with hypothalamic–pituitary–adrenal axis regulation. In turn, Christoffolete et al. [21] suggested that LXRA controls feed intake, which is associated with lipid metabolism. Yu et al. [22] showed that LXRA polymorphisms affected the fat levels in pig carcasses. In turn, Piórkowska et al. [23], who identified the candidate genes for meat quality in pigs, found that increased LXRA expression was negatively associated with feed efficiency and daily gains.
The apolipoprotein E (APOE) function was examined using Apoe−/− mice [24]. The lack of APOE disturbed the hypothalamic–pituitary–adrenal axis mediated by the glucocorticoid, which plays a role in various brain functions, such as cognition, emotion, and feeding. In another study, Babenko et al. [25] supported the thesis that APOE can be the driver of the neighbouring genes’ expression alteration observed under stressful loads. Moreover, the authors pinpointed that APOE and POMC in tandem is essential in specific energy metabolism and signalling cascades in the brain. The present study confirmed this observation because pro-opiomelanocortin (POMC) expression in the pituitary was positively correlated with APOE and LXRA gene expression levels, as well as with feeding stimuli in Puławska pigs.
The hypothalamic POMC is cleaved via prohormone convertase (PCs) into smaller peptides [26] with anorexigenic activities (α-MSH and β-MSH) [27,28] and orexigenic abilities, such as β-endorphin [29]. In the pituitary, pro-opiomelanocortin decays to the adrenocorticotropic hormone (ACTH), which affects gluconeogenesis by releasing, from the adrenal cortex, glucocorticoids (GCs) that enhance the availability of glucose. This energy mobilization promotes the loss of body mass, which has also been observed in the investigated Puławska pig population. In pigs with increased feed conversion and feed intake, as well as lowered daily gains, elevated POMC expression followed. These findings are consistent with the experiment of the GC administration, which promoted ad libitum food intake both in humans and animals [30]. The role of POMC in Złotnicka White pigs seems to be different from that in the Puławska pig population, since its expression was negatively related to FC and body mass loss. In Złotnicka White pigs, POMC expression did not also correlate with feed intake. On the other hand, the Cytoscape and STRING analyses identified that POMC co-expressed with the CGA gene in the pig pituitaries. The CGA encodes the glycoprotein hormone; it is also crucial in regular TSH activity and likely increases the circulating levels of the thyroxine (T4) hormone [31]. Martin et al. [32] showed a reduction in the production of pituitary TSH and hypothalamic TRH in POMC KO (knockout) mice. This observation could be associated with the mediating role of CGA in TSH functionality.
The present study also showed increased prolactin (PRL) expression to be positively correlated with fat content in Złotnicka White pigs (confirmed by qPCR analysis). Numerous studies have described prolactin’s functions in terms of their effects on lactation and reproduction [33,34]. Prolactin secretion is regulated by dopamine, which was demonstrated using mice lacking the dopamine D2 receptor and exhibiting hyperprolactinemia [35]. Dopamine is believed to be an anorexigenic molecule because when released in the ventral tegmental area of brain, it suppresses feed intake [36]. The present study identified increased PRL expression in more obese Złotnicka White pigs. This finding is consistent with a previous survey of patients with hyperprolactinemia with increased fat content and reduced lean mass. The present Cytoscape analysis did not detect any co-expression for the PRL gene.

4.2. The Enriched Insulin-Like Growth Factor Pathway

The previously mentioned APOE also plays a role in the regulation of the insulin-like growth factor (IGF) transport and uptake by the insulin-like growth factor binding protein (IGFBP) pathway. The present study identified several other DEGs (IGF2, IGFBP6, IGFBP5, and IGF1R) to be associated with this pathway. These genes encode proteins belonging to the IGF family, which consists of ligands (insulin, IGFs), binding proteins (IGFBPs), and cell surface receptors (IGF1R, IGF2R, and IR) [37]. IGF2 is an imprinted gene with an expressed paternal allele. It controls foetal growth [38], but significant evidence shows its essential function during postnatal development. IGF-II is critical for amplifying and maintaining myoblast determination protein 1 (MyoD) efficacy during muscular development [39]. It also promotes the proliferation and differentiation of bone cells [40]. The present study also showed increased FOXO3 expression in the pituitary glands of obese Złotnicka White pigs. The FOXO3 gene was proposed as a candidate for chicken growth [41] because silencing this gene in a chicken fibroblast culture significantly inhibited MyoD and up-regulated growth-related genes, such as INSR, GH, and IGF2Rs. Therefore, the FOXO3 gene is considered to be related to the IGF family. Returning to IGF2, in pigs, it was found that intron mutation IGF2 G>A3072 disrupts a binding site for the repressor zinc finger BED-type containing 6 (ZBED6), which results in an elevation of IGF2 expression that is associated with increased meat content in the carcass [42,43]. In the present study, augmented IGF2 expression in the pituitary of Puławska pigs with an increased daily feed intake and low daily gain values was observed. Thus, pituitary IGF2 expression did not positively relate to growth in 6 month old pigs. The present Cytoscape analysis did not detect any co-expression for the IGF2 gene.

4.3. The Enriched Notch Signalling Pathway

Notch signalling was induced in response to variable feed conversion in Złotnicka White gilts that were more obese and were characterized by poor feed efficiency (Figure 6). The Notch signalling pathway is essential for pituitary proliferation and progenitor maintenance in postnatal pituitary expansion [44]. A study using Notch2 cKO mice showed that pituitary GH, TSHB, PRL and POU1F11(Pit1) expressions are strongly dependent on Notch signalling through the transcription factor, PROP1. Moreover, in Notch2 cKO mice, increased POMC expression was observed to be consistent with the present results, where Notch signalling negatively correlates with POMC expression in Złotnicka White pigs. Numerous studies have proven that Notch signalling promotes obesity because it boosts gluconeo- and lipogenesis in the liver, leading to fatty liver disease [45]; induces the whitening of brown adipose tissue and insulin resistance in adipocytes [46]; and increases fat deposition in the hypothalamus by the activation of B cells (NF-κB) in mice on a high-fat diet [47]. The present study supports the positive effect of Notch signalling on fat content since Notch signalling was activated only in Złotnicka White pigs characterized by a high body fat level. Additionally, the CytoHubba analysis found that the CREBBP and EP300 genes involved in Notch signalling are co-expressed. CREBBP and EP300 are highly homologous genes that play essential roles as global transcriptional coactivators [48]. In the present study, CREBBP and EP300 overexpression was correlated with slower growth and increased fat content in pigs. CREBBP is the binding protein for the cAMP-responsive element-binding protein (CREB), which is the critical regulatory element for hypothalamic–pituitary axis development because crucial transcription factors in the pituitary have a CREB binding site in their promoters. Firstly, CREB [49] plays a role in the production of pituitary GH, which was demonstrated using genetically engineered mice, where decreased CREB activity resulted in dwarfism [50], and increased cAMP levels led to pituitary hyperplasia and gigantism [51]. The present study also found two CREB-like protein genes in the DEG group (CREB3L2 and CREB3L1), but to date, their role remains unclear. In turn, the mutations in CREBBP and EP300 have been described in Rubinstein–Taybi syndrome, where children have growth disturbances in the first few months, resulting in short statures [48]. Thus, CREBBP and EP300 could be crucial in pig growth and feed conversion.

4.4. The Enriched Wnt Signalling Pathway

Wnt signalling likely plays a significant role during growth, fat accumulation, and feed intake in pigs. The present study found enriched Wnt signalling in ZW pigs with increased fat mass and weak feed efficiency. However, in Puławska pigs, the genes associated with negative regulation of the canonical Wnt signalling pathway were overexpressed (Figure 6). In turn, the CytoHubba analysis showed that EP300, CREBBP, MTOR, and CHD8 involved in Wnt signalling were co-transcribed. EP300 and CREBBP were described, previously, as critical transcriptional regulators. In turn, the mTOR (mammalian target of rapamycin) pathway plays a central role in the regulation of cell growth, metabolism, and apoptosis. In the pituitary, MTOR is involved in the PI3K/AKT/mTOR signalling pathway traditionally described as a pro-proliferative and pro-survival pathway [52].
Wnt signalling is also involved during embryogenic development [53] and is essential in brain morphogenesis and function [54]. In turn, recent studies indicate that Wnt signalling is critical for neuroendocrine control in the hypothalamus. Wnt signalling is also linked with a risk of type 2 diabetes because it can bind to the co-activator of β-catenin TCF7/L2 [55], and the Wnt/β-catenin pathway is responsive to glucose [56]. The beta-catenin in the hypothalamus also affects NPY and POMC neurons, which suggests that the Wnt pathway regulates obesity by controlling food intake behaviour [57]. The present study showed that the secreted frizzled-related proteins (SFRPs) associated with Wnt signalling are differentially expressed in pig pituitaries, dependent on variable feed conversion. Increased SFRP1 and SFRP4 expressions in obese and lean Złotnicka White pigs have also been observed, respectively. In turn, SFRP5 expression is positively correlated with lean meat in Złotnicka pigs and slower growth in Puławska pigs. The role of SFRP proteins in the pituitary is not precisely clear, but their decreased expression was observed during tumorigenesis [58]. In the pituitary, the Wnt signalling pathway is not involved in the regulation of feed intake like in hypothalamus, but it plays an essential role during gland development and maturation and stimulates cell proliferation during tumorigenesis [58].

5. Conclusions

In summary, feed conversion is a highly economically important trait in farm animals that determines animal maintenance costs. However, feed conversion is an exponent of many factors. Thus, for Złotnicka White pigs, lowered feed conversion values were associated with increased fat content, while in the Puławska pig population, these values were associated with slower growth. Therefore, the pituitary response to variable feed conversion was extremely different between these breeds. Nevertheless, the current research shows a significant relationship between hormonal pituitary activity and feed conversion determination. Here, we presented several candidate genes, such as POMC, PRL, EP300, CREBBP, APOE, IGF2, and CGA, that are differentially expressed in the pituitary in response to variable feed conversion in pigs. These genes play significant roles in the crucial pituitary processes that determine pig phenotypes.

Supplementary Materials

The following are available online at https://www.mdpi.com/2073-4425/10/9/712/s1, Figure S1: Bar plots show overall statistics and read annotations obtained for each library. Table S1: Primers and probes used in qPCR analysis. Table S2: DE pituitary gene dependent on feed efficiency/conversion based on Fisher exact test in Panther classification system for Puławska pigs.

Availability of Data

Data available in the GEO database:

Author Contributions

Conceptualization, K.P.; data curation, K.P.; writing—original draft preparation, K.P.; visualization, K.P.; validation, K.P.; methodology, K.P.; software, K.Ż., writing—review and editing, K.P., K.Ż. K.R.-M., M.T. project administration, M.T.; M.S.-N.; supervision, M.T.; investigation, M.T.; funding acquisition, M.T.; resources, M.S.-N., K.S., E.S.

Funding

The research was funded by grant BIOSTRATEG (BIOSTRATEG2/297267/14/NCBIR/2016) of the National Centre for Research and Development, and partially by the statutory activity of the National Research Institute of Animal Production (01-11-01-21).

Conflicts of Interest

The authors declare that they have no competing interests.

References

  1. Żak, G.; Tyra, M.; Różycki, M. Possibility of improvement of lean meat content of ham and loin in pigs by selection for growth and feed conversion rate. Anim. Sci. Pap. Rep. 2008, 26, 305–316. [Google Scholar]
  2. Żak, G.; Tyra, M.; Lasek, J. Ocena świń w stacjach kontroli użytkowości rzeźnej trzody chlewnej–historia, stan obecny, znaczenie i zakres. Przegląd Hod. 2018, 86, 5–6. [Google Scholar]
  3. Tyra, M.; Mucha, A.; Eckert, R. Zależności pomiędzy dziennym spożyciem paszy a wskaźnikami użytkowości tucznej, rzeźnej i jakości mięsa świń ocenianych w stacjach kontroli. Rocz. Nauk. Zoot. 2019, 46, 1–13. [Google Scholar]
  4. Melmed, S. The Pituitary; Academic Press: Cambridge, MA, USA, 2010. [Google Scholar]
  5. Menche, N. PFLEGEN: Biologie Anatomie Physiologie; Elsevier Health Sciences: London, UK, 2017. [Google Scholar]
  6. Lupu, F.; Terwilliger, J.D.; Lee, K.; Segre, G.V.; Efstratiadis, A. Roles of growth hormone and insulin-like growth factor 1 in mouse postnatal growth. Dev. Biol. 2001, 229, 141–162. [Google Scholar] [CrossRef]
  7. Zhou, H.; Jiang, Y.; Ko, W.K.; Li, W.; Wong, A.O. Paracrine regulation of growth hormone gene expression by gonadotrophin release in grass carp pituitary cells: Functional implications, molecular mechanisms and signal transduction. J. Mol. Endocrinol. 2005, 34, 415–432. [Google Scholar] [CrossRef] [PubMed]
  8. Barb, C.R.; Kraeling, R.R.; Rampacek, G.B. Nutritional regulators of the hypothalamic-pituitary axis in pigs. Reprod. Suppl. 2001, 58, 1–15. [Google Scholar] [PubMed]
  9. Falch, C.M.; Sundaram, A.Y.; Oystese, K.A.B.; Normann, K.R.; Silamikelis, I.; Andersen, M.; Olarescu, N.C. RNA sequencing and RT-qPCR identify different gene expression profiles in fast-vs. slow-growing non-functioning pituitary adenomas. Endocr. Abstracts 2017, 49, OC83. [Google Scholar] [CrossRef]
  10. Ren, J.; Jian, F.; Jiang, H.; Sun, Y.; Pan, S.; Gu, C.; Sun, Q. Decreased expression of SFRP2 promotes development of the pituitary corticotroph adenoma by upregulating Wnt signaling. Int. J. Oncol. 2018, 52, 1934–1946. [Google Scholar] [CrossRef]
  11. Cheung, L.Y.; George, A.S.; McGee, S.R.; Daly, A.Z.; Brinkmeier, M.L.; Ellsworth, B.S.; Camper, S.A. Single-Cell RNA sequencing reveals novel markers of male pituitary stem cells and hormone-producing cell types. Endocrinology 2018, 159, 3910–3924. [Google Scholar] [CrossRef]
  12. Hekman, J.P.; Johnson, J.L.; Edwards, W.; Vladimirova, A.V.; Gulevich, R.G.; Ford, A.L.; Trut, L.N. Anterior pituitary transcriptome suggests differences in ACTH release in tame and aggressive foxes. G3 2018, 8, 859–873. [Google Scholar] [CrossRef]
  13. Wysocka, D.; Sobiech, P.; Herudzińska, M.; Sachajko, M.; Pareek, C.S. Investigation of candidate genes for metabolic disorders expressed in liver and pituitary gland by comparing the RNA-seq data of Polish-HF and Polish-Red cattle. Transl. Res. Vet. Sci. 2018, 1, 69–83. [Google Scholar] [CrossRef]
  14. Shan, L.; Wu, Q.; Li, Y.; Shang, H.; Guo, K.; Wu, J.; Li, M.H. Transcriptome profiling identifies differentially expressed genes in postnatal developing pituitary gland of miniature pig. DNA Res. 2013, 21, 207–216. [Google Scholar] [CrossRef] [PubMed]
  15. Tyra, M.; Żak, G. Analysis of the possibility of improving the indicators of pork quality through selection with particular consideration of intramuscular fat (IMF) content. Ann. Anim. Sci. 2013, 13, 33–44. [Google Scholar] [CrossRef]
  16. Piórkowska, K.; Żukowski, K.; Nowak, J.; Połtowicz, K.; Ropka-Molik, K.; Gurgul, A. Genome-wide RNA-Seq analysis of breast muscles of two broiler chicken groups differing in shear force. Anim. Genet. 2016, 47, 68–80. [Google Scholar] [CrossRef] [PubMed]
  17. Love, M.I.; Huber, W.; Anders, S. Moderated estimation of fold change and dispersion for RNA-Seq data with DESeq2. Genome Biol. 2014, 15, 550. [Google Scholar] [CrossRef] [PubMed]
  18. Piórkowska, K.; Ropka-Molik, K.; Eckert, R.; Różycki, M. The expression pattern of proteolytic enzymes of cathepsin family in two important porcine skeletal muscles. Livest. Sci. 2013, 157, 427–434. [Google Scholar] [CrossRef]
  19. Pfaffl, M.W. A new mathematical model for relative quantification in real-time RT–PCR. Nucleic Acids Res. 2000, 29, 45. [Google Scholar] [CrossRef] [PubMed]
  20. Nilsson, M.; Stulnig, T.M.; Lin, C.Y.; Yeo, A.L.; Nowotny, P.; Liu, E.T.; Steffensen, K.R. Liver X receptors regulate adrenal steroidogenesis and hypothalamic-pituitary-adrenal feedback. Mol. Endocrinol. 2007, 21, 126–137. [Google Scholar] [CrossRef] [PubMed]
  21. Christoffolete, M.A.; Doleschall, M.; Egri, P.; Liposits, Z.; Zavacki, A.M.; Bianco, A.C.; Gereben, B. Regulation of thyroid hormone activation via the liver X-receptor/retinoid X-receptor pathway. J. Endocrinol. 2010, 205, 179–186. [Google Scholar] [CrossRef] [Green Version]
  22. Yu, M.; Geiger, B.; Deeb, N.; Rothschild, M.F. Liver X receptor alpha and beta genes have the potential role on loin lean and fat content in pigs. J. Anim. Breed. Gen. 2006, 123, 81–88. [Google Scholar] [CrossRef]
  23. Piórkowska, K.; Żukowski, K.; Ropka-Molik, K.; Tyra, M.; Gurgul, A. A comprehensive transcriptome analysis of skeletal muscles in two Polish pig breeds differing in fat and meat quality traits. Genet. Mol. Biol. 2018, 41, 125–136. [Google Scholar] [CrossRef] [PubMed] [Green Version]
  24. Raber, J.; Akana, S.F.; Bhatnagar, S.; Dallman, M.F.; Wong, D.; Mucke, L. Hypothalamic-pituitary-adrenal dysfunction in Apoe(-/-) mice: Possible role in behavioral and metabolic alterations. J. Neurosci. 2000, 20, 2064–2071. [Google Scholar] [CrossRef] [PubMed]
  25. Babenko, V.N.; Smagin, D.A.; Kudryavtseva, N.N. RNA-Seq mouse brain regions expression data analysis: Focus on ApoE functional network. J. Integr. Bioinform. 2017, 14, 1–16. [Google Scholar] [CrossRef] [PubMed]
  26. Wang, L.; Sui, L.; Panigrahi, S.K.; Meece, K.; Xin, Y.; Kim, J.; Leibel, R.L. PC1/3 deficiency impacts pro-opiomelanocortin processing in human embryonic stem cell-derived hypothalamic neurons. Stem Cell Rep. 2017, 8, 264–277. [Google Scholar] [CrossRef] [PubMed]
  27. Honda, K.; Saneyasu, T.; Hasegawa, S.; Kamisoyama, H.A. Comparative study of the central effects of melanocortin peptides on food intake in broiler and layer chicks. Peptides 2012, 37, 13–17. [Google Scholar] [CrossRef] [PubMed]
  28. Korek, E.; Krauss, H.; Piatek, J.; Checinska, Z. Regulacja hormonalna łaknienia. Med. Ogólna Nauk. Zdr. 2013, 19, 211–217. [Google Scholar]
  29. Appleyard, S.M.; Hayward, M.; Young, J.I.; Butler, A.A.; Cone, R.D.; Rubinstein, M.; Low, M.J. A role for the endogenous opioid β-endorphin in energy homeostasis. Endocrinology 2003, 144, 1753–1760. [Google Scholar] [CrossRef]
  30. Dallman, M.F.; Warne, J.P.; Foster, M.T.; Pecoraro, N.C. Glucocorticoids and insulin both modulate caloric intake through actions on the brain. J. Physiol. 2007, 583, 431–436. [Google Scholar] [CrossRef]
  31. Fonseca, T.L.; Correa-Medina, M.; Campos, M.P.; Wittmann, G.; Werneck-de-Castro, J.P.; Drigo, R.A.; Gereben, B. Coordination of hypothalamic and pituitary T3 production regulates TSH expression. J. Clin. Investig. 2013, 123, 1492–1500. [Google Scholar] [CrossRef] [Green Version]
  32. Martin, N.M.; Small, C.J.; Sajedi, A.; Liao, X.H.; Weiss, R.E.; Gardiner, J.V.; Bloom, S.R. Abnormalities of the hypothalamo-pituitary-thyroid axis in the pro-opiomelanocortin deficient mouse. Regul. Pept. 2004, 122, 169–172. [Google Scholar] [CrossRef]
  33. Bachelot, A.; Binart, N. Reproductive role of prolactin. Reproduction 2007, 133, 361–369. [Google Scholar] [CrossRef] [PubMed]
  34. Ostrom, K.M. A review of the hormone prolactin during lactation. Prog. Food Nutr. Sci. 1990, 14, 1–43. [Google Scholar] [PubMed]
  35. Saiardi, A.; Bozzi, Y.; Baik, J.H.; Borrelli, E. Antiproliferative role of dopamine: Loss of D2 receptors causes hormonal dysfunction and pituitary hyperplasia. Neuron 1997, 19, 115–126. [Google Scholar] [CrossRef]
  36. Mebel, D.M.; Wong, J.C.; Dong, Y.J.; Borgland, S.L. Insulin in the ventral tegmental area reduces hedonic feeding and suppresses dopamine concentration via increased reuptake. Eur. J. Neurosci. 2012, 36, 2336–2346. [Google Scholar] [CrossRef] [PubMed] [Green Version]
  37. Cianfarani, S.; Rossi, P. Neuroblastoma and insulin-like growth factor system. Eur. J. Pediatr. 1997, 156, 256–261. [Google Scholar] [CrossRef] [PubMed]
  38. Frasca, F.; Pandini, G.; Scalia, P.; Sciacca, L.; Mineo, R.; Costantino, A.; Vigneri, R. Insulin receptor isoform A, a newly recognized, high-affinity insulin-like growth factor II receptor in fetal and cancer cells. Mol. Cell Biol. 1999, 19, 3278–3288. [Google Scholar] [CrossRef] [PubMed]
  39. Wilson, E.M.; Rotwein, P. Control of MyoD function during initiation of muscle differentiation by an autocrine signaling pathway activated by insulin-like growth factor-II. J. Biol. Chem. 2006, 281, 29962–29971. [Google Scholar] [CrossRef]
  40. Uchimura, T.; Hollander, J.M.; Nakamura, D.S.; Liu, Z.; Rosen, C.J.; Georgakoudi, I.; Zeng, L. An essential role for IGF2 in cartilage development and glucose metabolism during postnatal long bone growth. Development 2017, 144, 3533–3546. [Google Scholar] [CrossRef] [Green Version]
  41. Chen, B.; Xu, J.; He, X.; Xu, H.; Li, G.; Du, H.; Zhang, X. A genome-wide mRNA screen and functional analysis reveal FOXO3 as a candidate gene for chicken growth. PLoS ONE 2015, 10, e0137087. [Google Scholar] [CrossRef]
  42. Clark, D.L.; Clark, D.I.; Beever, J.E.; Dilger, A.C. Increased prenatal IGF2 expression due to the porcine IGF2 intron3-G3072A mutation may be responsible for increased muscle mass. J. Anim. Sci. 2015, 93, 2546–2558. [Google Scholar] [CrossRef]
  43. Oczkowicz, M.; Tyra, M.; Walinowicz, K.; Różycki, M.; Rejduch, B. Known mutation (A3072G) in intron 3 of theIGF2 gene is associated with growth and carcass composition in Polish pig breeds. J. Appl. Genet. 2009, 50, 257–259. [Google Scholar] [CrossRef] [PubMed]
  44. Nantie, L.B.; Himes, A.D.; Getz, D.R.; Raetzman, L.T. Notch signaling in postnatal pituitary expansion: Proliferation, progenitors, and cell specification. Mol. Endocrinol. 2014, 28, 731–744. [Google Scholar] [CrossRef] [PubMed]
  45. Pajvani, U.B.; Qiang, L.; Kangsamaksin, T.; Kitajewski, J.; Ginsberg, H.N.; Accili, D. Inhibition of notch uncouples akt activation from hepatic lipid accumulation by decreasing mTorc1 stability. Nat. Med. 2013, 19, 1054. [Google Scholar] [CrossRef] [PubMed]
  46. Cohen, P.; Levy, J.D.; Zhang, Y.; Frontini, A.; Kolodin, D.P.; Svensson, K.J.; Wu, J. Ablation of PRDM16 and beige adipose causes metabolic dysfunction and a subcutaneous to visceral fat switch. Cell 2014, 156, 304–316. [Google Scholar] [CrossRef] [PubMed]
  47. Li, J.; Tang, Y.; Cai, D. IKKβ/NF-κB disrupts adult hypothalamic neural stem cells to mediate a neurodegenerative mechanism of dietary obesity and pre-diabetes. Nat. Cell Biol. 2012, 14, 999. [Google Scholar] [CrossRef] [PubMed]
  48. Bartholdi, D.; Roelfsema, J.H.; Papadia, F.; Breuning, M.H.; Niedrist, D.; Hennekam, R.C.; Peters, D.J. Genetic heterogeneity in Rubinstein–Taybi syndrome: Delineation of the phenotype of the first patients carrying mutations in EP 300. J. Med. Genet. 2007, 44, 327–333. [Google Scholar] [CrossRef]
  49. Hegedus, B.; Yeh, T.H.; Lee, D.Y.; Emnett, R.J.; Li, J.; Gutmann, D.H. Neurofibromin regulates somatic growth through the hypothalamic–pituitary axis. Hum. Mol. Genet. 2008, 17, 2956–2966. [Google Scholar] [CrossRef] [PubMed]
  50. Struthers, R.S.; Vale, W.W.; Arias, C.; Sawchenko, P.E.; Montminy, M.R. Somatotroph hypoplasia and dwarfism in transgenic mice expressing a non-phosphorylatable CREB mutant. Nature 1991, 350, 622. [Google Scholar] [CrossRef]
  51. Burton, F.H.; Hasel, K.W.; Bloom, F.E.; Sutcliffe, J.G. Pituitary hyperplasia and gigantism in mice caused by a cholera toxin transgene. Nature 1991, 350, 74. [Google Scholar] [CrossRef]
  52. Roof, A.K.; Gutierrez-Hartmann, A. Consider the context: Ras/ERK and PI3K/AKT/mTOR signaling outcomes are pituitary cell type-specific. Mol. Cell Endocrinol. 2018, 463, 87–96. [Google Scholar] [CrossRef]
  53. Clevers, H. Wnt/β-catenin signaling in development and disease. Cell 2006, 127, 469–480. [Google Scholar] [CrossRef] [PubMed]
  54. Kibardin, A.; Ossipova, O.; Sokol, S.Y. Metastasis-associated kinase modulates Wnt signaling to regulate brain patterning and morphogenesis. Development 2006, 133, 2845–2854. [Google Scholar] [CrossRef] [PubMed] [Green Version]
  55. Florez, J.C.; Jablonski, K.A.; Bayley, N.; Pollin, T.I.; de Bakker, P.I.; Shuldiner, A.R.; Altshuler, D. TCF7L2 polymorphisms and progression to diabetes in the Diabetes Prevention Program. N. Engl. J. Med. 2006, 355, 241–250. [Google Scholar] [CrossRef] [PubMed]
  56. Anagnostou, S.H.; Shepherd, P.R. Glucose induces an autocrine activation of the Wnt/b-catenin pathway in macrophage cell lines. Biochem. J. 2008, 416, 211–218. [Google Scholar] [CrossRef] [PubMed]
  57. Helfer, G.; Tups, A. Hypothalamic Wnt signalling and its role in energy balance regulation. J. Neuroendocr. 2016, 28, 1–9. [Google Scholar] [CrossRef] [PubMed]
  58. Chambers, T.J.G.; Giles, A.; Brabant, G.; Davis, J.R.E. Wnt signalling in pituitary development and tumorigenesis. Endocr. Relat. Cancer 2013, 20, R101–R111. [Google Scholar] [CrossRef] [Green Version]
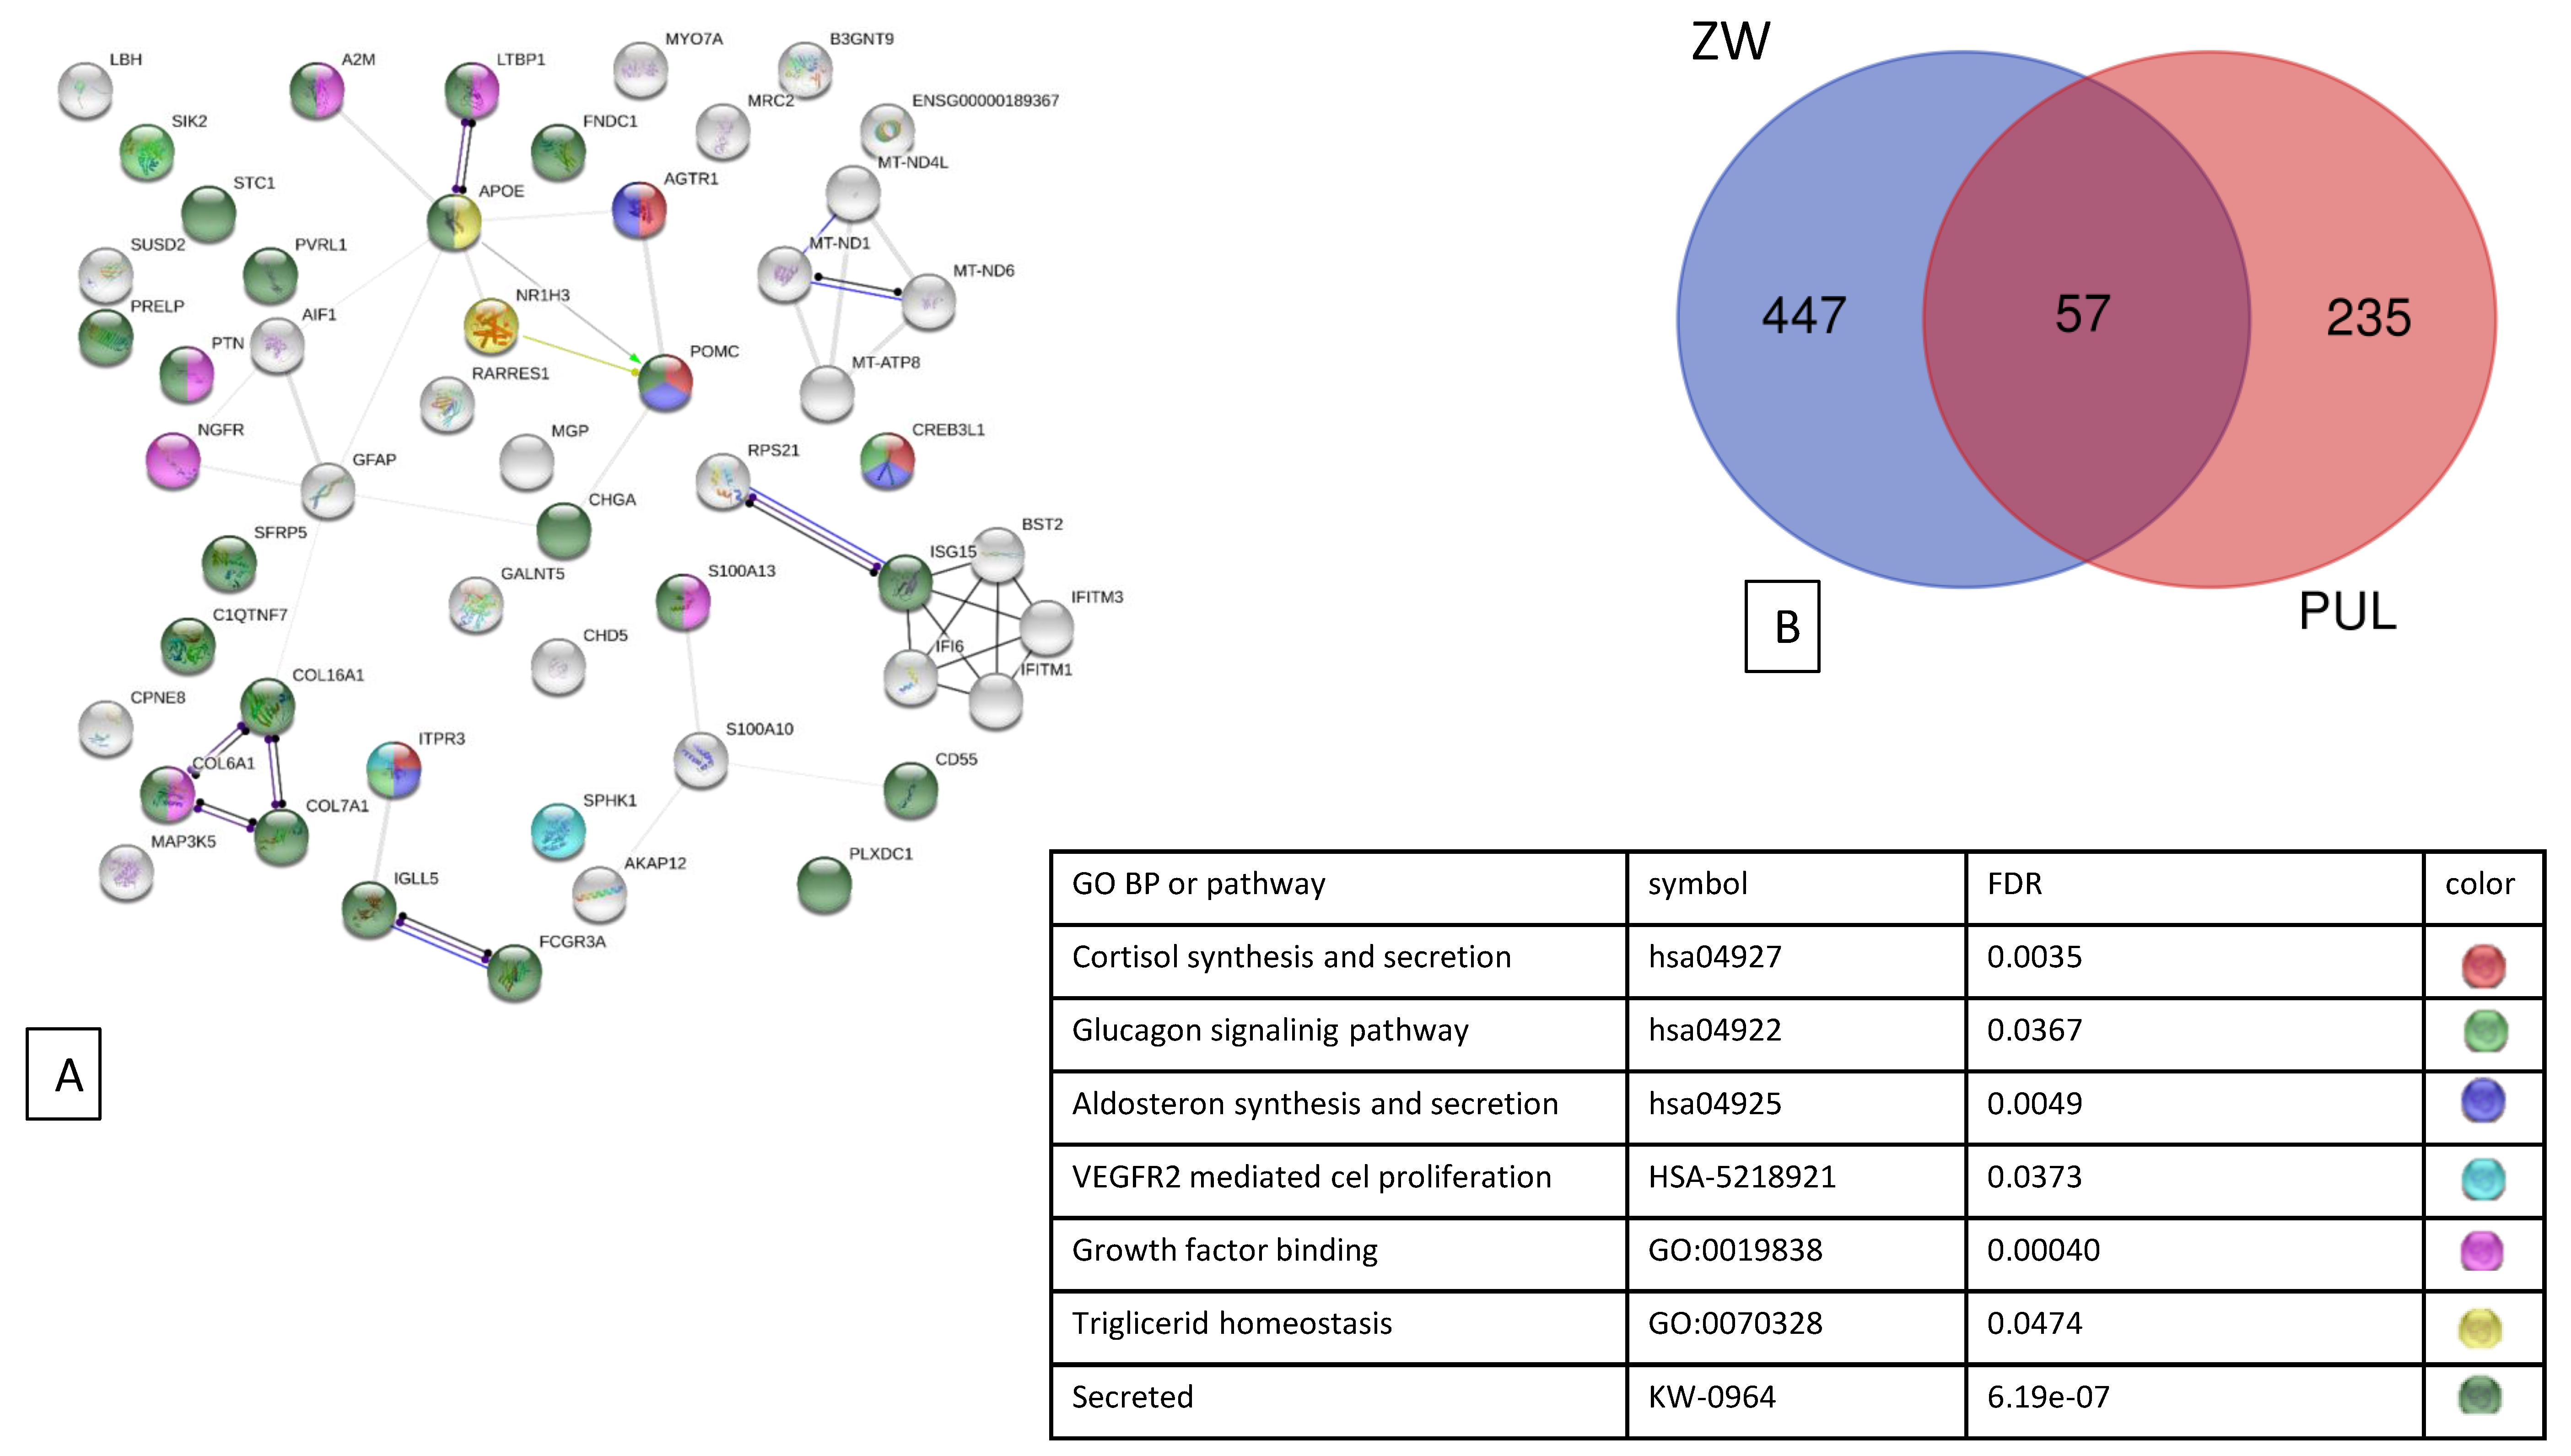
Figure 1. The plots showing the differentially expressed genes (DEGs) in the pig pituitaries identified in the present analysis. The MA (an application of a Bland-Altman plot, M (log ratio) and A (mean average) scales) plots showing several significant (red points) and not significant (black points) results (A) for Puławska and (B) Złotnicka White pigs. The heatmap Principal Component Analysis (PCA) shows the sample clustering based on the processed reads for (C) Puławska and (D) Złotnicka breeds characterized by high (HFC) and low feed conversion (LFC).
Genes 10 00712 g001
Figure 2. The string network of proteins encoded by identified DEGs in the (A) pituitary of Puławska (PUL) and Złotnicka White (ZW) pigs in response to variable feed conversion. (B) A Venn diagram presenting DEGs identified for Puławska and Złotnicka White pigs with 57 shared genes.
Genes 10 00712 g002
Figure 3. Co-expression analysis of the DEGs in Złotnicka White pigs. The gene network after Cytoscape, featuring a CytoHubba plugin analysis with the top five nodes ranked by the MCC test for high (A) and low (C) feed conversion pigs. The gene co-expression network predicted by STRING with the indicated metabolic pathway involvement in high (B) and low (D) feed conversion pigs. Legend: Genes 10 00712 i001, Genes 10 00712 i002, high feed conversion Złotnicka White pigs: Genes 10 00712 i003 
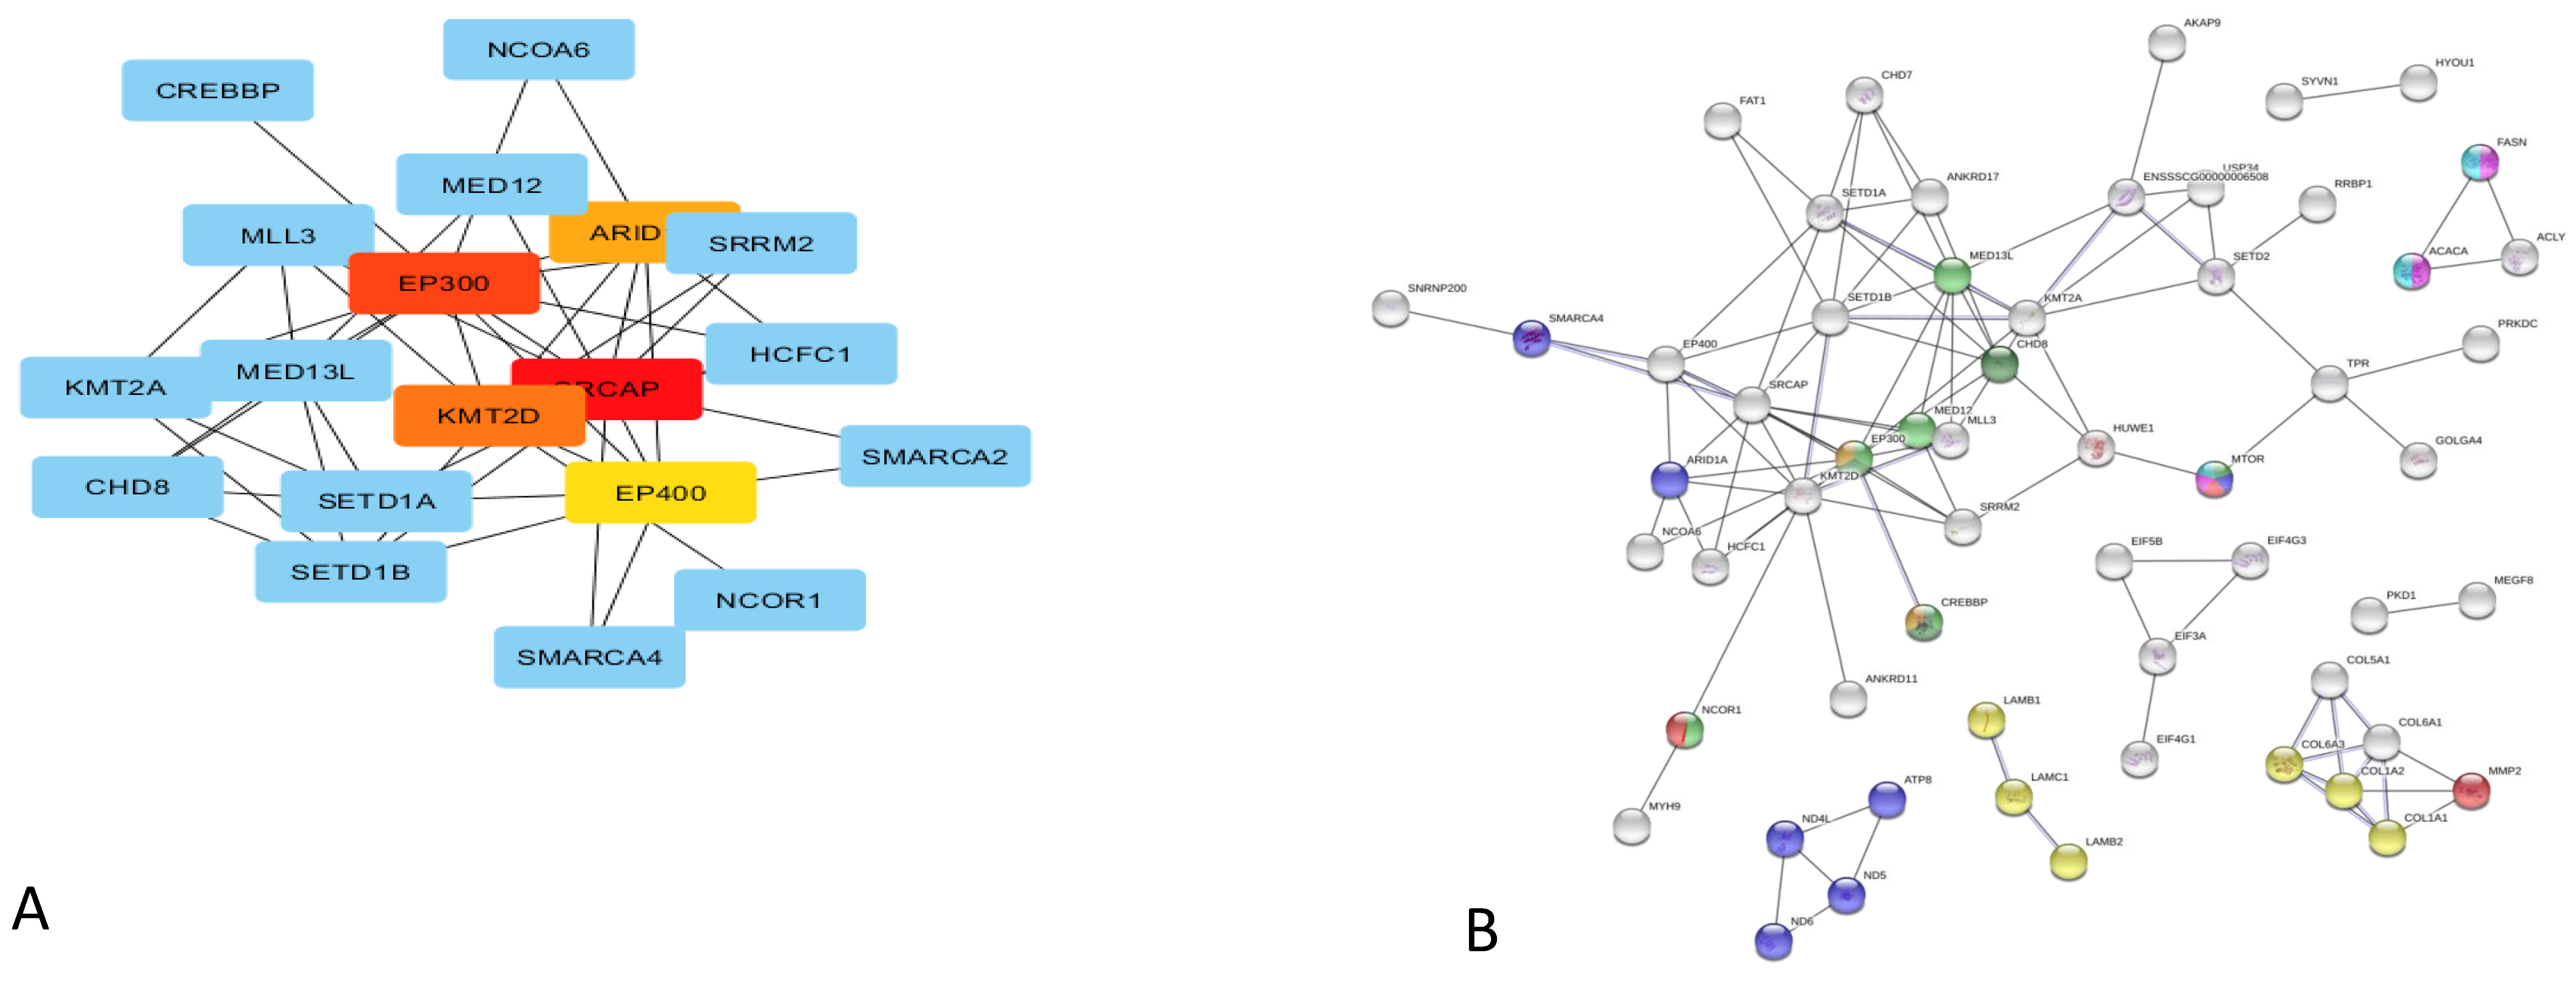
ECM receptor interaction (ssc04512), Genes 10 00712 i004 the thyroid hormone signaling pathway (ssc04919), Genes 10 00712 i005 thermogenesis (ssc04714), Genes 10 00712 i006 endocrine resistance (ssc01522), Genes 10 00712 i007 the AMPK signaling pathway (ssc04152), Genes 10 00712 i008 
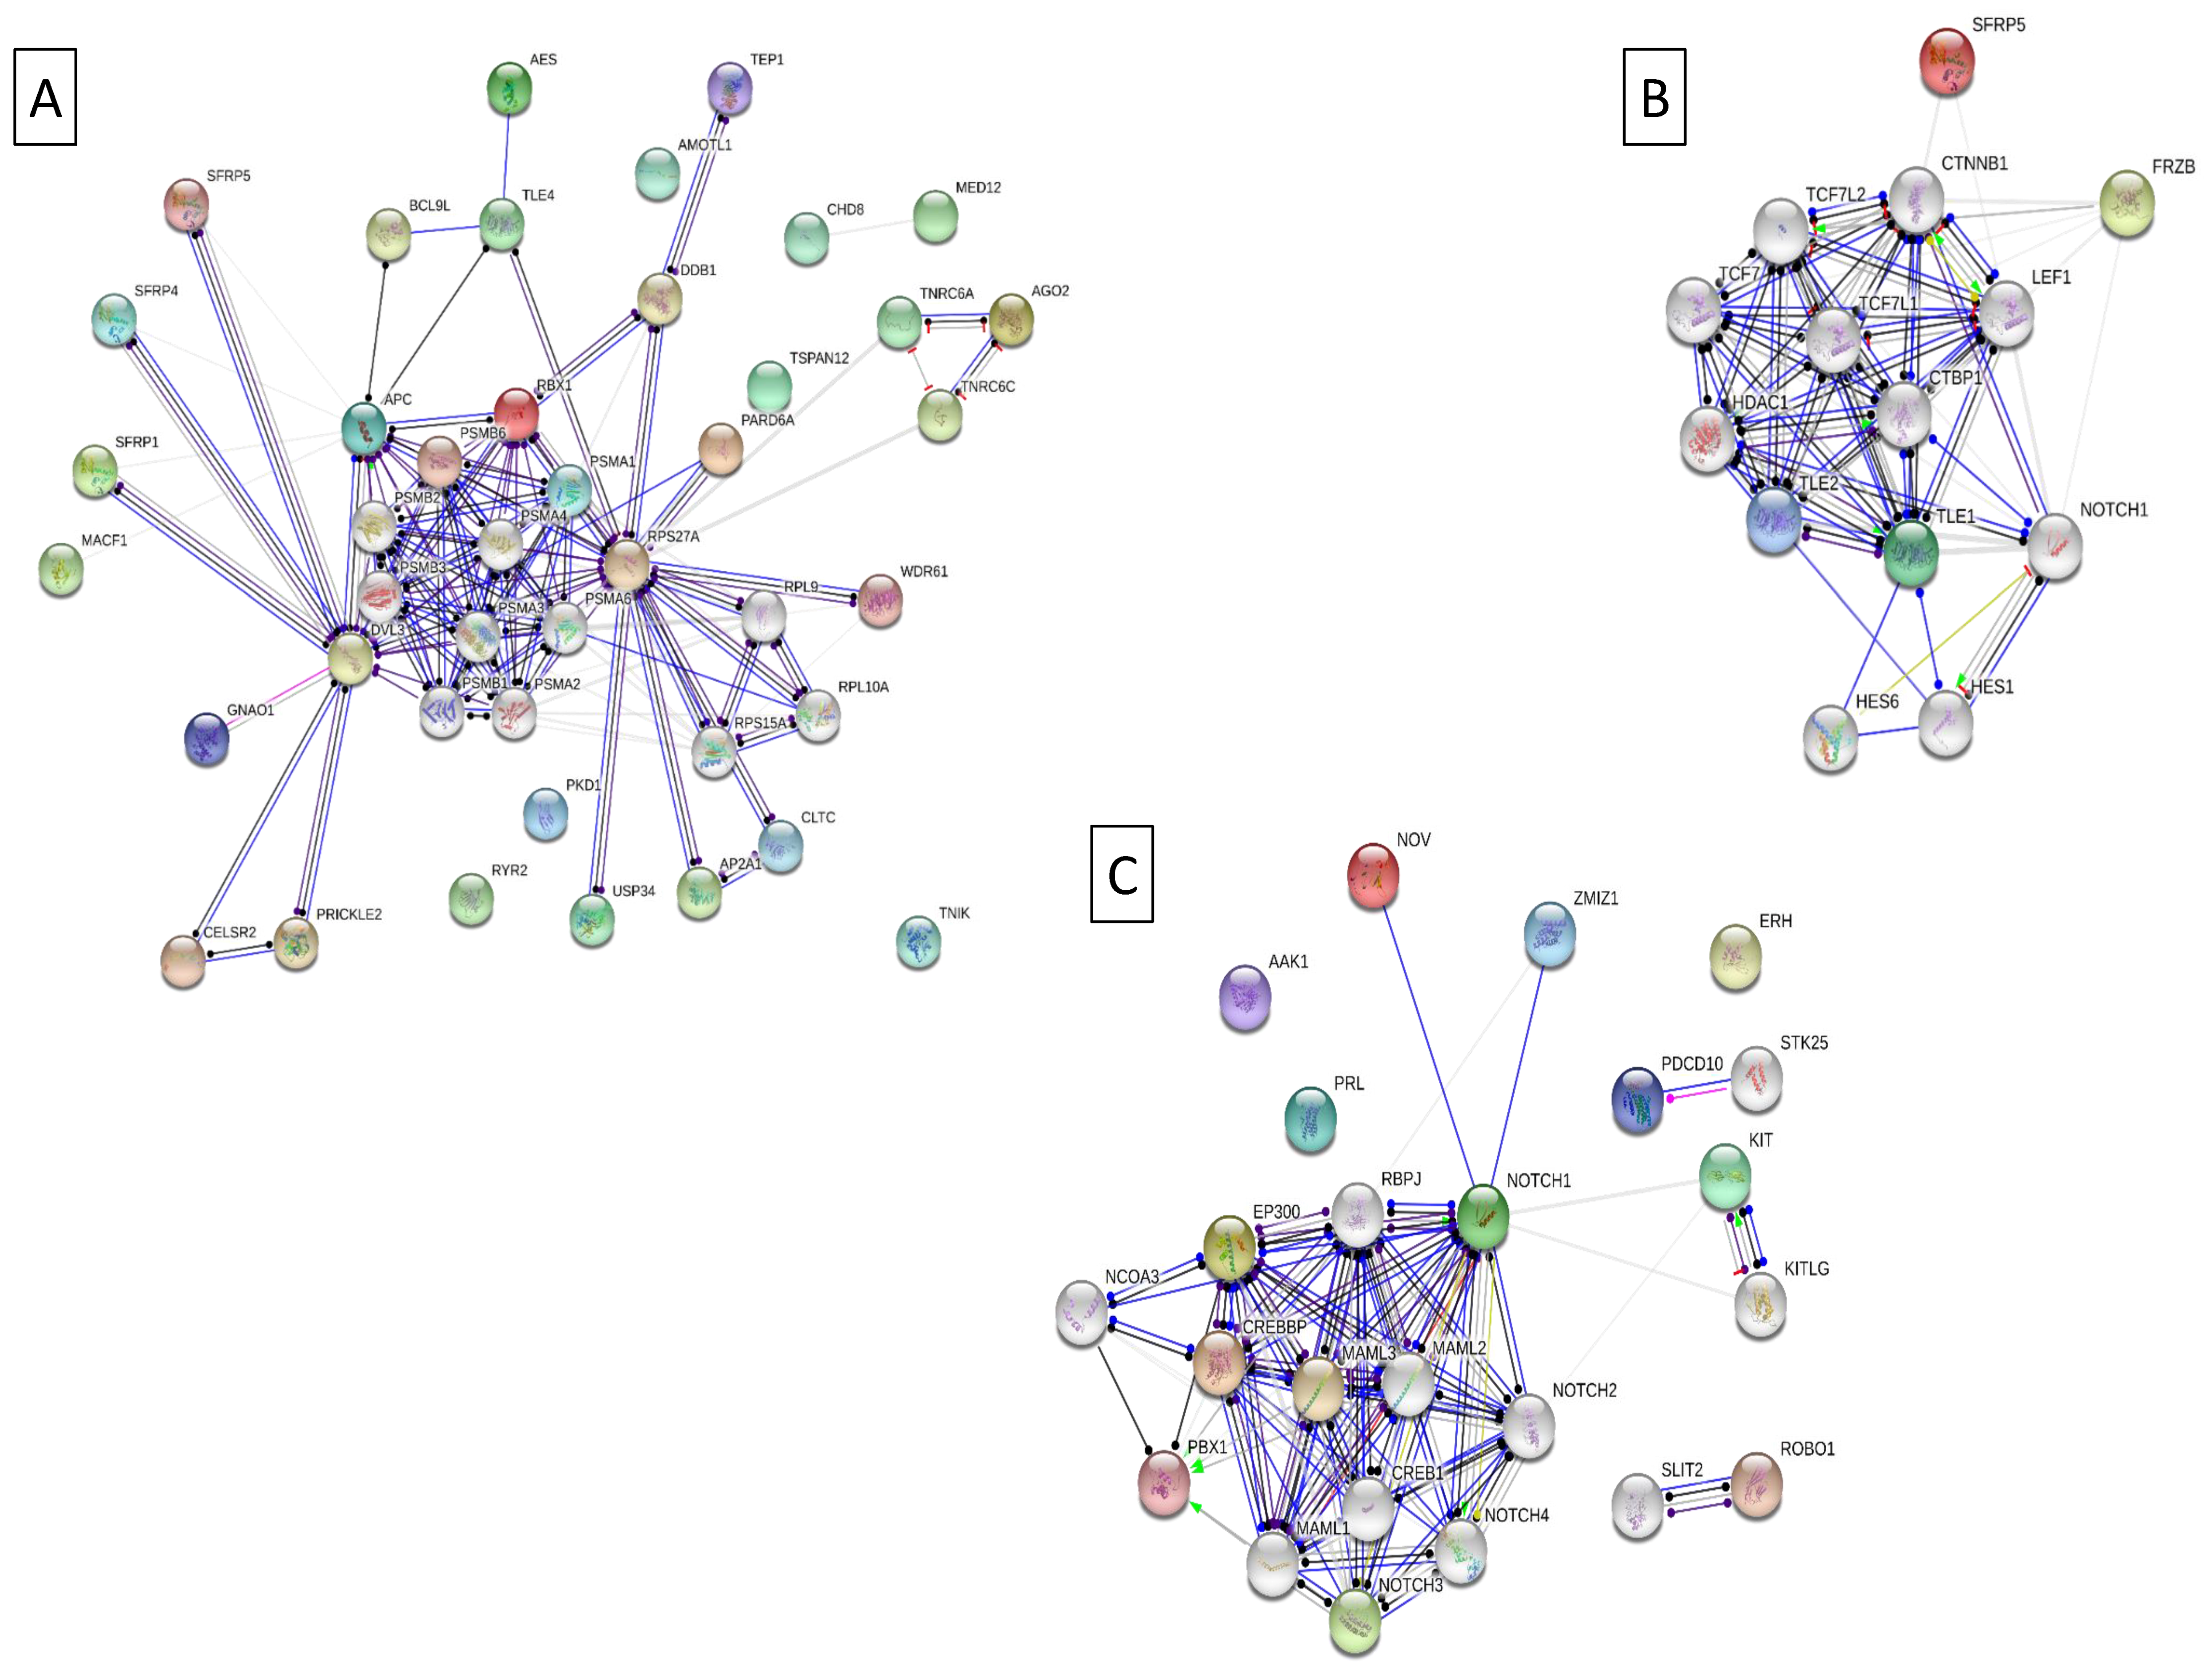
the Wnt signaling pathway (ssc04310), Genes 10 00712 i009 the Insulin signaling pathway (ssc04910), Genes 10 00712 i010 
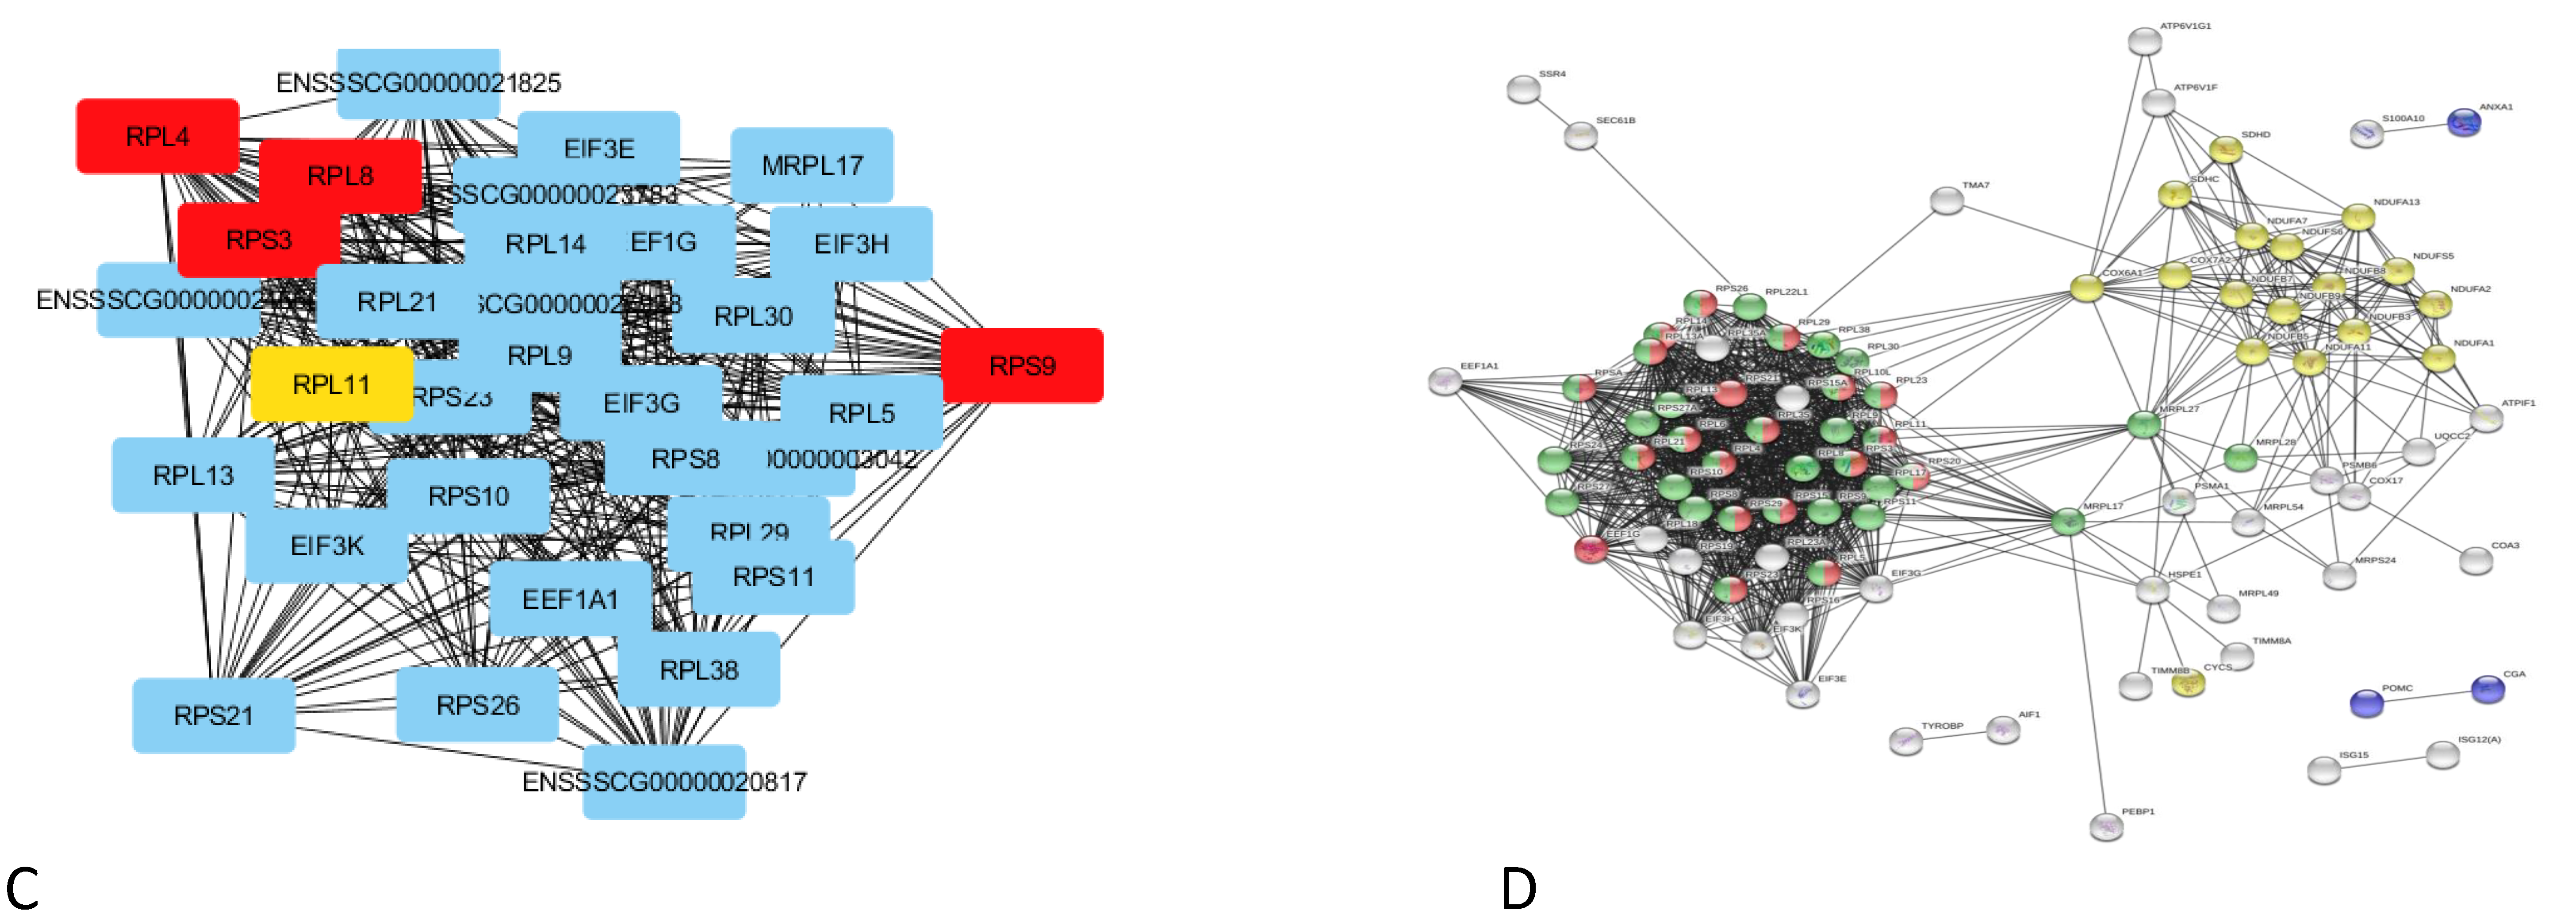
the Notch signaling pathway (ssc04330); low feed conversion Złotnicka White pigs: Genes 10 00712 i003 non-alcoholic fatty liver disease (NAFLD) (ssc04932), Genes 10 00712 i004 ribosome (ssc03010), Genes 10 00712 i006 GO:0006412 translation, and Genes 10 00712 i005 GO:0010817 regulation of hormone levels.
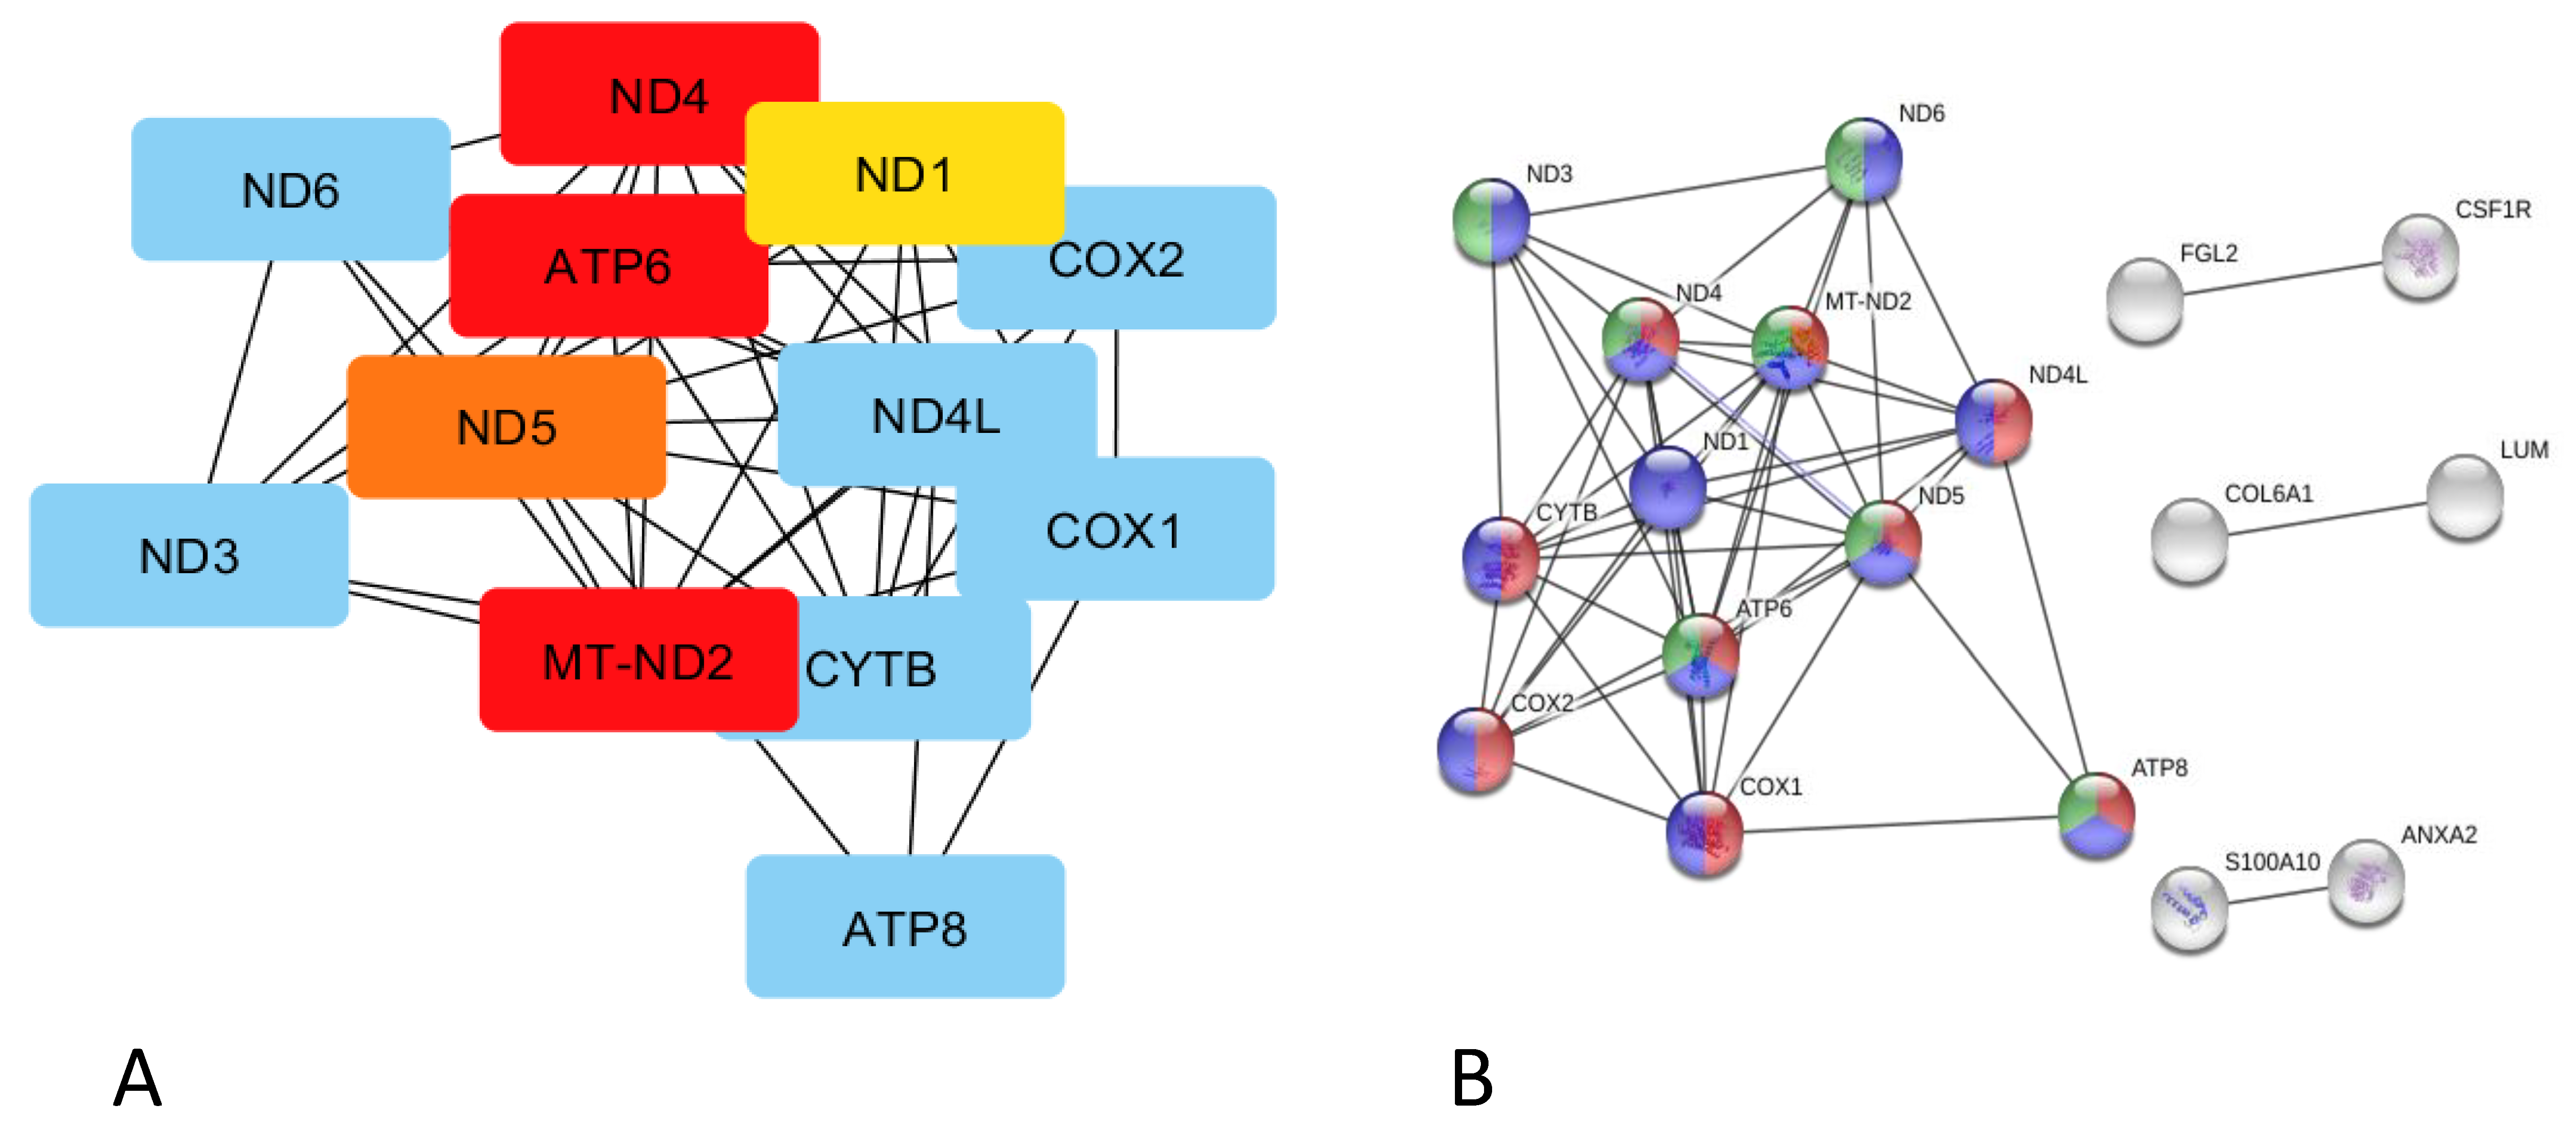
Genes 10 00712 g003aGenes 10 00712 g003b
Figure 4. Co-expression analysis of genes overexpressed in Puławska pigs, characterized by high feed conversion values. (A) The gene network after Cytoscape using a CytoHubba plugin analysis with the top five nodes ranked by the Maximal Clique Centrality (MCC) test. (B) The gene co-expression network predicted by STRING, indicating the pathway involvement. Legend: Genes 10 00712 i001, Genes 10 00712 i002, Genes 10 00712 i004 respiratory electron transport, ATP synthesis by chemiosmotic coupling, and heat production by the uncoupling proteins (Reactome pathway SSC-163200), Genes 10 00712 i005 thermogenesis (ssc04714), Genes 10 00712 i006 and the ATP metabolic process (GO:0046034).
Genes 10 00712 g004
Figure 5. The relative quantification of the DEGs involved in the regulation of hormonal levels, as identified by RNA-seq. The relative transcript abundance of genes evaluated in the pituitary of low (n = 8) and high feed conversion (FC) (n = 8) Puławska and Złotnicka pigs. The RPS29 and OAZ1 genes have been used as endogenous controls. The efficiency of the PCR reactions was estimated based on the standard curve method. The gene expression levels were calculated using the delta–delta CT method [19]. Significant differences between gene expression levels were determined by ANOVA. POMC—pro-opiomelanocortin, STC1—stanniocalcin-1, PRL—prolactin, CGA—glycoprotein hormones, LXRA (NR1H3)—nuclear receptor subfamily 1 group H member 3, and NOTCH1—notch receptor 1.
Genes 10 00712 g005
Figure 6. The string network of proteins (encoded by the differentially expressed genes (DEGs)) involved in signalling pathways. They enriched (A) the Wnt signalling pathway in Złotnicka White pigs, (B) the negative regulation of the canonical Wnt signalling pathway in Puławska pigs, and (C) the positive regulation of the Notch signalling pathway in Złotnicka White pigs. The coloured orbs indicate DEGs, and the grey orbs are the backgrounds.
Genes 10 00712 g006
Table 1. The differences in porcine traits observed between the analysed groups for both breeds.
TraitGroup of Native Pigs
PuławskaZłotnicka White
LFC
(High Benefit)
n = 8
HFC
(Low Benefit)
n = 8
LFC
(High Benefit)
n = 8
HFC
(Low Benefit)
n = 8
Mean ± SDMean ± SDMean ± SDMean ± SD
Feed conversion ratio2.57 ± 0.06 A3.64 ± 0.37 B2.84 ± 0.71 A4.12 ± 0.89 B
Daily gain (g)919 ± 103 A715 ± 82 B811 ± 98 A561 ± 165 B
Daily feed intake (kg/day)2.35 ± 0.27 a2.60 ± 0.23 b2.30 ± 0.122.32 ± 0.16
Day in test 78 ± 9 A95 ± 10 B84 ± 15 A122 ± 28 B
Back ham (kg)11.1 ± 0.71 a10.3 ± 0.61 b10.2 ± 0.519.8 ± 0.58
Ham (kg)9.3 ± 0.648.74 ± 0.608.21 ± 0.59 A7.34 ± 0.65 B
Ham fat (cm)1.57 ± 0.13 a1.38 ± 0.21 b1.76 ± 0.21 a2.22 ± 0.38 b
Backfat (cm) * 1.28 ± 0.44 a1.64 ± 0.19 b1.7 ± 0.471.64 ± 0.53
Knuckle fat0.20 ± 0.010.20 ± 0.010.20 ± 0.01 a0.23 ± 0.01 b
Backfat in C1 point *1.30 ± 0.381.03 ± 0.281.53 ± 0.40 a2.03 ± 0.41 b
Backfat in the K1 point *1.30 ± 0.381.06 ± 0.261.53 ± 0.39 a2.01 ± 0.40 b
%meat in primary cuts70 ± 2.270 ± 2.466 ± 3.2 A61 ± 3.7 B
%meat in carcass61.4 ± 1.8260.7 ± 2.8557.5 ± 3.0 A52.9 ± 3.7 B
Backfat *—backfat thickness was measured on the back above the joint between last thoracic vertebrae and the first lumbar vertebra. * Backfat in C1 point was measured between the last thoracic vertebrae and the first lumbar vertebra, 8 cm from away from the midline. * Backfat in K1 point was measured between the last thoracic vertebrae and the first lumbar vertebra above the lateral edge of the M. longissimus dorsi. LFC—low feed conversion, HFC—high feed conversion. Values with the same superscripts belong to the same statistical group (A, B = p < 0.01, a, b = p < 0.05).

