Article

Genetic Characteristic and RNA-Seq Analysis in Transparent Mutant of Carp–Goldfish Nucleocytoplasmic Hybrid

1
Hubei Provincial Engineering Laboratory for Pond Aquaculture, College of Fisheries, Huazhong Agricultural University, Wuhan 430070, China
2
Key Lab of Freshwater Biodiversity Conservation Ministry of Agriculture, Yangtze River Fisheries Research Institute, The Chinese Academy of Fisheries Sciences, Wuhan 430223, China
*
Authors to whom correspondence should be addressed.
These authors contributed equally to this work.
Genes 2019, 10(9), 704; https://doi.org/10.3390/genes10090704
Submission received: 17 July 2019 / Revised: 27 August 2019 / Accepted: 7 September 2019 / Published: 12 September 2019
(This article belongs to the Section Animal Genetics and Genomics)

Abstract

:
In teleost, pigment in the skin and scales played important roles in various biological processes. Iridophores, one of the main pigment cells in teleost, could produce silver pigments to reflect light. However, the specific mechanism of the formation of silver pigments is still unclear. In our previous study, some transparent mutant individuals were found in the carp–goldfish nucleocytoplasmic hybrid (CyCa hybrid) population. In the present study, using transparent mutants (TM) and wild type (WT) of the CyCa hybrid as a model, firstly, microscopic observations showed that the silver pigments and melanin were both lost in the scales of transparent mutants compared to that in wild types. Secondly, genetic study demonstrated that the transparent trait in the CyCa hybrid was recessively inherent, and controlled by an allele in line with Mendelism. Thirdly, RNA-Seq analysis showed that differential expression genes (DEGs) between wild type and transparent mutants were mainly enriched in the metabolism of guanine, such as hydrolase, guanyl nucleotide binding, guanyl ribonucleotide binding, and GTPase activity. Among the DEGs, purine nucleoside phosphorylase 4a (pnp4a) and endothelin receptor B (ednrb) were more highly expressed in the wild type compared to the transparent mutant (p < 0.05). Finally, miRNA-Seq analysis showed that miRNA-146a and miR-153b were both more highly expressed in the transparent mutant compared to that in wild type (p < 0.05). Interaction analysis between miRNAs and mRNAs indicated that miRNA-146a was associated with six DEGs (MGAT5B, MFAP4, GP2, htt, Sema6b, Obscn) that might be involved in silver pigmentation.

1. Introduction

In teleost, the pigment chromophores in the skin and scales could be involved in several important biological processes, such as camouflage, thermoregulation, mate choice, mimicry, warning of toxicity, and immunity [1]. The pigments are produced by several pigment cells in fish, including melanophores, xanthophores, and iridophores [2]. Pigmentation is a very complicated process, which is regulated by a series of cellular, genetic, endocrine, environmental, and physiological factors [3]. Different pigment cells in fish display different colors due to their unique organelles. The melanin particles produced by melanocytes could absorb the incident light of a specific wavelength and make fish appear black or brown. The pigments produced by xanthophores are mainly pteridine, which can filter out certain wavelengths of light to make fish appear yellow or red [4]. In addition, iridophores could produce silver pigments, in which guanine could combine with water to form purine-containing reflecting platelets [5].
The transparent trait in fish is closely related to the development of pigment cells. Generally, most fish are transparent in their early lives, while the body in adult fish is no longer transparent due to the accumulation of pigment in skin and peritoneum. The cytoplasm of iridophores contains a large number of crystalline plates, which could reflect a certain wavelength of light and make them iridescent. The color presented by iridophores belongs to the configuration color, which is different from other kinds of pigment cells [5]. The absence of silver pigments produced by iridophores could allow light to penetrate body and make fish transparent. Previous studies have reported that zebrafish shady, rose, and barley transparent mutations are all associated with the lost of iridophores. Mutations in shady could result in a lack of iridophores throughout the whole life [6,7]. Mutations in rose, a gene encoding the endothelin receptor b1a (ednrb1a), could cause an adult-specific reduction of iridophores [8,9]. In addition, the transparent mutant not only shows the lost of iridophores, but also a significant decrease in the number of melanocytes.
To date, a series of genes have been reported to be involved in the determination of skin color, such as pro-opiomelanocortin (POMC), melanocyte stimulating hormone (MSH), microphthalmia-associated transcription factor (MITF), kit oncogene (KIT), tyrosinase (TYR), tyrosine related protein-1 (TYRP1), and tyrosine related protein-2 (TYRP2) [2,10]. In melanocytes, MITF could induce the biosynthesis of melanin through the up-regulation of melanogenic enzyme expression [11]. Further studies found that endothelin receptor B (ednrb) could induce the phosphorylation of MITF and its mutation could reduce the pigmentation in melanocytes [12,13]. In addition, previous studies reported that purine nucleoside phosphorylase 4a (pnp4a) was also involved in guanine synthesis and its mutation could cause the deficiency of iridophores [14,15]. However, most of the genetic resources involved in the color of fish remain to be discovered.
MicroRNAs (miRNAs) are a group of single-stranded, non-coding RNA molecules with an average size of approximately 22 nucleotides, which play crucial roles in numerous biological processes through promoting their target gene’s degradation or inhibiting mRNA translation. It is important for the crosstalk between miRNAs and mRNAs to steady the signal transduction and the transcriptional activities as well as maintain homeostasis in many organs [16,17,18]. In mammals, it has been reported that the miR-137 could affect body color pattern in mice [19]. In Drosophila, the loss of miR-8 could reduce pigmentation in dorsal abdomen [20]. In addition, miR-429 silencing in common carp could increase the transcript level of Foxd3, and influence the melanin production [21]. These studies indicate that miRNAs could also play an important role in body color formation [15]. However, little is known about the functional role of miRNA in the regulation of silver pigment synthesis.
In our previous studies, some transparent mutant (TM) individuals were found in the wild type (WT) of the carp–goldfish nucleocytoplasmic hybrid (CyCa hybrid) population [22]. In the WT, the silver pigments and melanin in the scales could block the light to pass through fish body, so they were opaque. However, there were no reflective substances in the skin and peritoneum of TM, so the internal organs of TM could be observed directly. In the present study, using the WT and TM as the model, (i) the hybridization experiment was used to further explore the genetic characteristics of the transparent trait in common carp; (ii) the RNA-Seq was used to examine the differentially expressed genes between the TM and WT; (iii) the miRNA-Seq was also recruited to detect the functional role of miRNA in the formation of pigment in common carp. This study will help us to understand the formation mechanism of the transparent trait in teleost.

2. Materials and Methods

2.1. Genetic Analysis of the Transparent Trait

Experimental CyCa hybrids were bred in the Yaowan Testing Ground of the Yangtze River Fisheries Research Institute (Hubei Province). The wild types (WTs) in CyCa hybrids (three males and three females) were used as broodstocks for crossing to produce the F1 generation (Figure 1A). After the F1 generation matured, the transparent mutants (TMs) in the F1 generation (six males and six females) were used as parents for self-crossing to produce the F2 generation (Figure 1B). In addition, three male TMs in F1 generation and three female WTs in the F0 generation were used as parents for back-crossing to produce the F2 generation, respectively (Figure 1C). Similarly, three female TMs in the F1 generation and three male WTs in the F0 generation were also recruited to do the back-crossing experiment (Figure 1D). When the phenotypes were easily distinguished, the number of WTs and TMs in the F1 and F2 generation were counted, respectively. In the present study, the common carps were used according to the protocol approved by the committee for animal use at Huazhong Agricultural University (ethical approval no. HBAC20091138; date: 15 November 2009).

2.2. RNA-Seq Library Construction and Illumina Sequencing

Total RNA was extracted from the whole carp fry of WTs and TMs which were two-weeks old by using a TRIzol reagent (Invitrogen, Carlsbad, CA, USA) according to the manufacturer’s instructions. To be specific, five fry were collected for one replicated group, and three replicated groups for TMs (total 15 carps) and WTs (total 15 carps) were all used for RNA extraction, respectively. A Nanodrop 2000 spectrophotometer was used to assess sample purity and RNA concentration, and the quality of RNA was analyzed by using an Agilent 2100 bioanalyzer with a RNA 6000 Nano kit (Agilent Technologies, Santa Clara, CA, USA). Only high-quality RNA samples (RIN ≥ 8) were used to construct the sequencing library. RNA-Seq transcriptome libraries were prepared by using 5 μg of total RNA following TruSeqTM RNA sample preparation Kit (Illumina, San Diego, CA, USA). After quantification by TBS380, paired-end RNA-Seq sequencing libraries were sequenced with the Illumina HiSeq™ 4000 (Illumnia, San Diego, CA, USA). In this study, the cDNA libraries for TMs and WTs were constructed and sequenced in Nextomics Biosciences (Wuhan, China), respectively. The raw reads were filtered using NGSQCToolkit (v2.3.3). By removing reads containing adapters, reads containing poly-N, or low quality reads from raw data, the clean data were obtained. Using FastQC software to do quality control (QC) of clean data, if QC was qualified, clean reads were compared to the reference sequence (http://www.carpbase.org/CarpBase/download). Then, a series of subsequent analysis such as gene expression, variable shear, prediction of new transcripts, SNP detection, and gene structure optimization were conducted.

2.3. Small RNA Library Construction and Illumina Sequencing

A total amount of 10 μg of total RNA from WTs and TMs were used as input material to construct small RNA libraries. The small RNA libraries were constructed by using a TruseqTM Small RNA sample prep Kit (San Diego, CA, USA), following the Illumina protocol. Subsequently, SE50 sequencing of qualified sequencing libraries was performed on an Illumina HiSeq™ system [23]. In this study, three small RNA libraries for WTs and TMs were constructed and sequenced by Nextomics Biosciences (Wuhan, China), respectively. Then, a series of subsequent analysis such as sequencing data quality control, small RNA annotation analysis, and miRNA deep analysis would be carried out.

2.4. Differentially Expressed Genes (DEGs) Analysis and Functional Enrichment

To identify DEGs between TMs and WTs, the expression level of each transcript was calculated according to the fragments per kilobase of exon per million mapped reads (FRKM) method. The significance of DEGs between TMs and WTs was determined by using edgeR [24]. In this study, the threshold for DEGs was defined with p < 0.05 and |log2(Fold change)| ≥ 1. Functional annotation of gene ontology (GO) terms were analyzed by using Blast2GO software [25], and GO functional classification of unigenes was analyzed by using WEGO software [26]. Functional enrichment analysis including GO and Kyoto Encyclopedia of Genes and Genomes (KEGG) were performed by using Goatools (or KOBAS) software.

2.5. Differentially Expressed miRNAs (DEMs) Analysis and Functional Enrichment

Clean reads were filtered from raw reads by removing low quality reads and adaptor sequences, either shorter than 18 nt or longer than 32 nt. Then, the cleaned sRNA reads were mapped to the Rfam databases to discard rRNA-, snRNA-, scRNA-, snoRNA-, tRNA-, and ribozyme associated reads [27]. Then, the qualified clean reads were compared with the reference sequence by the genome comparison analysis software Bowtie (version 1.1.2) [28]. DEMs analysis was performed by using DEGseq software. The screening conditions for DEMs were p-adjust < 0.05 and |log2(Fold change)| ≥ 1. The potential known and novel miRNA targets were predicted by miRanda software [29], and expression levels of target genes were taken from DEGs identified in our transcriptome data. GO and KEGG analysis were performed for the target genes of DEMs by using Blast2GO and KASS.

2.6. Interaction Analysis of DEGs and DEMs

In order to define all the possible miRNA-mRNA interactions, we constructed the DE genes pool (p < 0.05 and |log2(Fold change)| ≥ 1) and DE miRNAs target genes pool (p-adjust < 0.05 and |log2(Fold change)| ≥ 1), respectively. Then the interaction analysis was carried out in the two gene pools. Briefly, the target genes of the DE miRNAs were firstly predicted basing on the miRanda (3.3a). Then, overlapped with the DE genes obtained by RNA-Seq, the target DE genes of DE miRNAs were further detected. According to the expression trend, the relationship between DE miRNAs and their corresponding target DE genes was determined to be up–up, up–down, down–down and down–up, respectively. The miRNA–mRNA regulatory networks were visualized by using Cytoscape software [30]. Given that miRNAs could negatively regulate the expression of their target mRNAs in most cases, only the data with a negative relationship (up–down and down–up) between miRNA and mRNA expression were selected for the miRNA–mRNA network mapping in the present study.

2.7. RT-PCR Analysis of DEGs

Total RNA was extracted from the same period carp fry as in the RNAseq experiment by using Trizol reagent (Invitrogen). Five fry were collected for one replicated group, and three replicated groups for TMs (total 15 carps) and WTs (total 15 carps) were all used for RNA extraction, respectively. The cDNA was synthesized by using 5 μg total RNA with the HifairTM II 1st Strand cDNA Synthesis Kit following the manufacturer’s protocol (Yesen, Shanghai). The primers of candidate genes were designed following the general principles with Premier 6.0 software. The housekeeping gene β-actin and glyceraldehyde-3-phosphate dehydrogenase (Gapdh) were used as the reference. The details of the primers used in RT-qPCR are listed in Table S1. RT-PCR was performed by using the Unique AptamerTM qPCR SYBR® Green Master Mix (Novogene, Tianjin, China) on an ABI PRISM 7500 Real-time Detection System (Life Technologies, Carlsbad, CA, USA) according to the manufacturer’s protocol. The relative expression levels of target genes were calculated by the 2−∆∆CT method. ∆CTtarget gene = CTtarget gene − CThousekeeping gene, ∆∆CT = ∆CTTM − ∆CTWT, each target gene mRNA expression difference multiples with 2−∆∆CT.

3. Results

3.1. Genetic Analysis of Transparent Trait

In the CyCa hybrid carp inbred line, some individuals were found to present the transparent trait without reflective substances in their eyelids and scales, which were named as transparent mutants (TM). Since the TMs accounted for about 25% in F1 generation (Figure 1A), it was presumed that the reflective trait in their broodstock was an “Aa” heterozygote, and the transparent trait was recessive over the reflective trait. In addition, all of the self-crossing F2 generation showed the transparent trait (Figure 1B), while the ratio of TMs and WTs of back-crossing F2 generation was nearly 50% (Figure 1C,D). These results further confirmed that the transparent trait in TM was “aa” and the heritance characteristic was consistent with Mendel’s genetic law. Microscopic examination showed that there were a large number of melanin, yellow pigments, and silver pigments on the scales of WT (Figure 2A). However, only a large number of yellow pigments, very few melanin and silver pigments, were found on the scales of TM (Figure 2B). Due to the absence of silver pigments, the scales in TMs were transparent.

3.2. Transcriptome Analysis

After stringent quality assessment and data filtering, approximately 63,272,006 and 75,019,864 clean paired-end sequence reads with a length of 145 bp and a Q30 rate (those with a base quality greater than 20) over 96% were generated from TMs and WTs, respectively (Table S2). Compared with the reference genome of common carp, approximately 41,800,444 and 50,183,848 clean reads were mapped back to the transcriptome assembly in TM and WT libraries, respectively (Table S2). Compared to WT, a total of 331 transcript-derived unigenes were up-regulated while 792 unigenes were down-regulated in TM (Figure S1A and Table S5). Here, 57 up-regulated DEGs were selected on the basis of FCTM/WT > 3 and 60 down-regulated DEGs were selected according to FCWT/TM > 15. Among them, the up-regulated DEGs in TM included epididymis-specific α-mannosidase, zinc-binding protein A33, FAM83H, interferon-induced very large GTPase 1, galactose-specific lectin nattectin, guanine nucleotide-binding protein subunit α-14, and others. (Table 1). For the down-regulated DEGs, they contained hemoglobin subunit α, 40S ribosomal protein S26, epididymis-specific α-mannosidase, purine nucleoside phosphorylase (pnp4a), purine nucleoside phosphorylase (pnp5a), and others (Table 2).
To identify the functional clusters and biochemical pathways of these DEGs, GO (gene ontology) enrichment analysis was performed by hypergeometric distribution testing. Based on the Nr annotation, 29,609 unigenes were assigned to 1739 GO terms. Using WEGO, 15,270 unigenes for the biological process category, 10,947 unigenes for the cellular component category, and 26,107 unigenes for the molecular function category were identified, respectively (Figure S2). Based on the analysis of DEGs and GO annotation results, GO enrichment analysis was conducted under the condition of p < 0.05. Here, we listed 21 GO terms for up-regulated DEGs and 24 GO terms for down-regulated DEGs, respectively. For the up-regulated DEGs, the most abundant GO terms were annotated to peptidase activity, heme binding, iron ion binding, and other terms (Figure 3A). For the down-regulated DEGs, the most abundant GO terms were annotated to molecular function, such as hydrolase activity, guanyl nucleotide binding, GTPase activity, nucleoside triphosphatase act, pyrophosphatase activity and GTP binding (Figure 3B).
KEGG (Kyoto Encyclopedia of Genes and Genomes) is the main public database for systematic analysis of the metabolic pathways in cells. To further elucidate the biological functions and interactions of these DEGs, the unigenes were mapped to the reference pathways recorded in the KEGG database. In total, 12,540 unigenes were annotated in KEGG and located to 5 known KEGG metabolic pathways, including cellular processes, environmental informational processing, genetic information processing, metabolism, organismal systems (Table 3). KEGG analysis of DEGs showed 4 different pathways, including other glycan degradation, antigen processing and presentation, microRNAs in cancer, and regulation of mitophagy-yeast (Table 4).

3.3. miRNA Analysis

For the miRNA sequences, 10,979,661 and 12,296,112 total raw reads were obtained from TM and WT, respectively. After quality control, 9,876,199 and 11,368,562 total clean reads were left in TM and WT for further analysis, respectively. Among them, 7,898,353 in TM and 9,385,680 in WT clean reads were perfectly matched to the reference genome. (Table S3). To identify miRNAs in TM and WT, all of the mapped small RNA reads in the transcriptome were used as query against known and novel miRNAs in the database. In total, 54 known miRNAs and 396 novel miRNAs were obtained. Screening conditions for DEMs were p-adjust < 0.05 and |log2(Fold change)| ≥ 1. Firstly, we identified the expression profile of known miRNAs between TM and WT. The results indicated that only 2 differential expression known miRNAs, miR-146a and miR-153b, were highly up-regulated expression in TM compared to WT. Secondly, we identified the differential expression profile of novel miRNAs between TM and WT. The results indicated that 70 differential expression novel miRNAs were up-regulated and 125 differential expression novel miRNAs were down-regulated in TM vs. WT. Here, 2 up-regulated known DEMs, and 30 up-regulated and 30 down-regulated novel DEGs were listed according to the FC (fold change) value (Table S4). The overall distribution of the DEMs can be inferred from the volcanic map (Figure S1B,C).
GO enrichment analysis was performed for the target genes of the DEMs, including two known and 195 novel DEMs. For the target genes (total 490) of two known DEMs, 15 GO terms from the three ontologies of molecular function, cellular component, and biological process were selected to describe their functions. As a result, some GO terms were identified in the guanyl-nucleotide exchange factor activity, GTPase activator activity, purine nucleotide metabolic process, GTP metabolic process, and other functions (Figure 4). Additionally, similar to known DEMs, the most abundant GO terms in the 64,546 target genes of 195 novel DEMs were annotated to metal ion binding, nucleic acid binding, purine nucleotide binding, and cellular process (Figure 5).
KEGG enrichment analysis was performed for the target genes of DEMs, including known and novel DEMs. For the known DEMs, 138 target genes were assigned to 344 KEGG pathways. For the novel DEMs, 9824 target genes were assigned to 344 KEGG pathways. For the known DEMs, target genes were mostly concentrated in metabolic pathways, Rap1 signaling pathway, pathways in cancer, biosynthesis of secondary metabolites, biosynthesis of antibiotics, and other pathways (Figure 6A). For novel DEMs, target genes were mostly enriched in the mitogen-activated protein kinase (MAPK) signaling pathway, Human T-lymphotropicvirus 1 (HTLV-I) infection, oxytocin signaling pathway, axon guidance, microRNAs in cancer, and other pathways (Figure 6B).

3.4. Interaction Analysis Between miRNAs and mRNAs

In order to visualize the relationship between DEGs and DEMs, the RNA-Seq data and miRNA data were combined together to make the miRNA–mRNA regulatory network. For the known DEM, the up-regulated miR-146a was associated with 6 down-regulated DEGs including MGAT5B, MFAP4, GP2, htt, Sema6b, and Obscn (Table 5). In addition, miR-153b was also one of the known DEMs, but its target genes were not detected in the DEGs. For the novel miRNAs, correlation analysis was performed for 70 up-regulated miRNAs and their down-regulated target DEGs (Figure 7A). The network diagram showed that some novel miRNAs, such as Novel_294, Novel_384, and Novel_272, were associated with multiple differentially expressed genes. Conversely, some target genes, such as TTN, Nlrc3, and NLRP, were regulated by multiple novel miRNAs (Figure 7A). In addition, correlation analysis was also performed for 125 down-regulated miRNAs (such as Novel_212, Novel_377, and Novel_399) and their up-regulated target DEGs (such as Nrxn2, GALNT17, and MLRP3) (Figure 7B).

3.5. RT-qPCR Validation of DEGs

In order to substantiate the RNA-Seq data, eleven DEGs including endothelin receptor type B (EDNRB), up-regulator of cell proliferation (URGCP), purine nucleoside phosphorylase 4a (PNP4a), A kinase anchor protein 12a (ALAP12a), purine nucleoside phosphorylase 4a (PNP5a), GTPase IMAP family member 8 (GIMAP8), amyloid protein-binding protein 2 (APBA2), galactose-specific lectin nattectin (GSLN), histidine-rich glycoprotein (HRG), guanine nucleotide-binding protein subunit α-14(GNA14), and guanylate-binding protein 1(GBP1) were selected to validate their relative expression levels between TM and WT by using RT-qPCR. The results revealed a significant up-regulation in the expression of EDNRB, URGCP, PNP4a, AKAP12a, PNP4a, and GIMAP8 in WT relative to TM (p < 0.05). Similarly, a significant up-regulation was observed in the expression of APBP2, GSLN, HRG, GNA14, and GBP1 in TM relative to MT (p < 0.05) (Table 6). These results suggested that the qPCR results were generally consistent with the RNA-Seq data.

4. Discussions

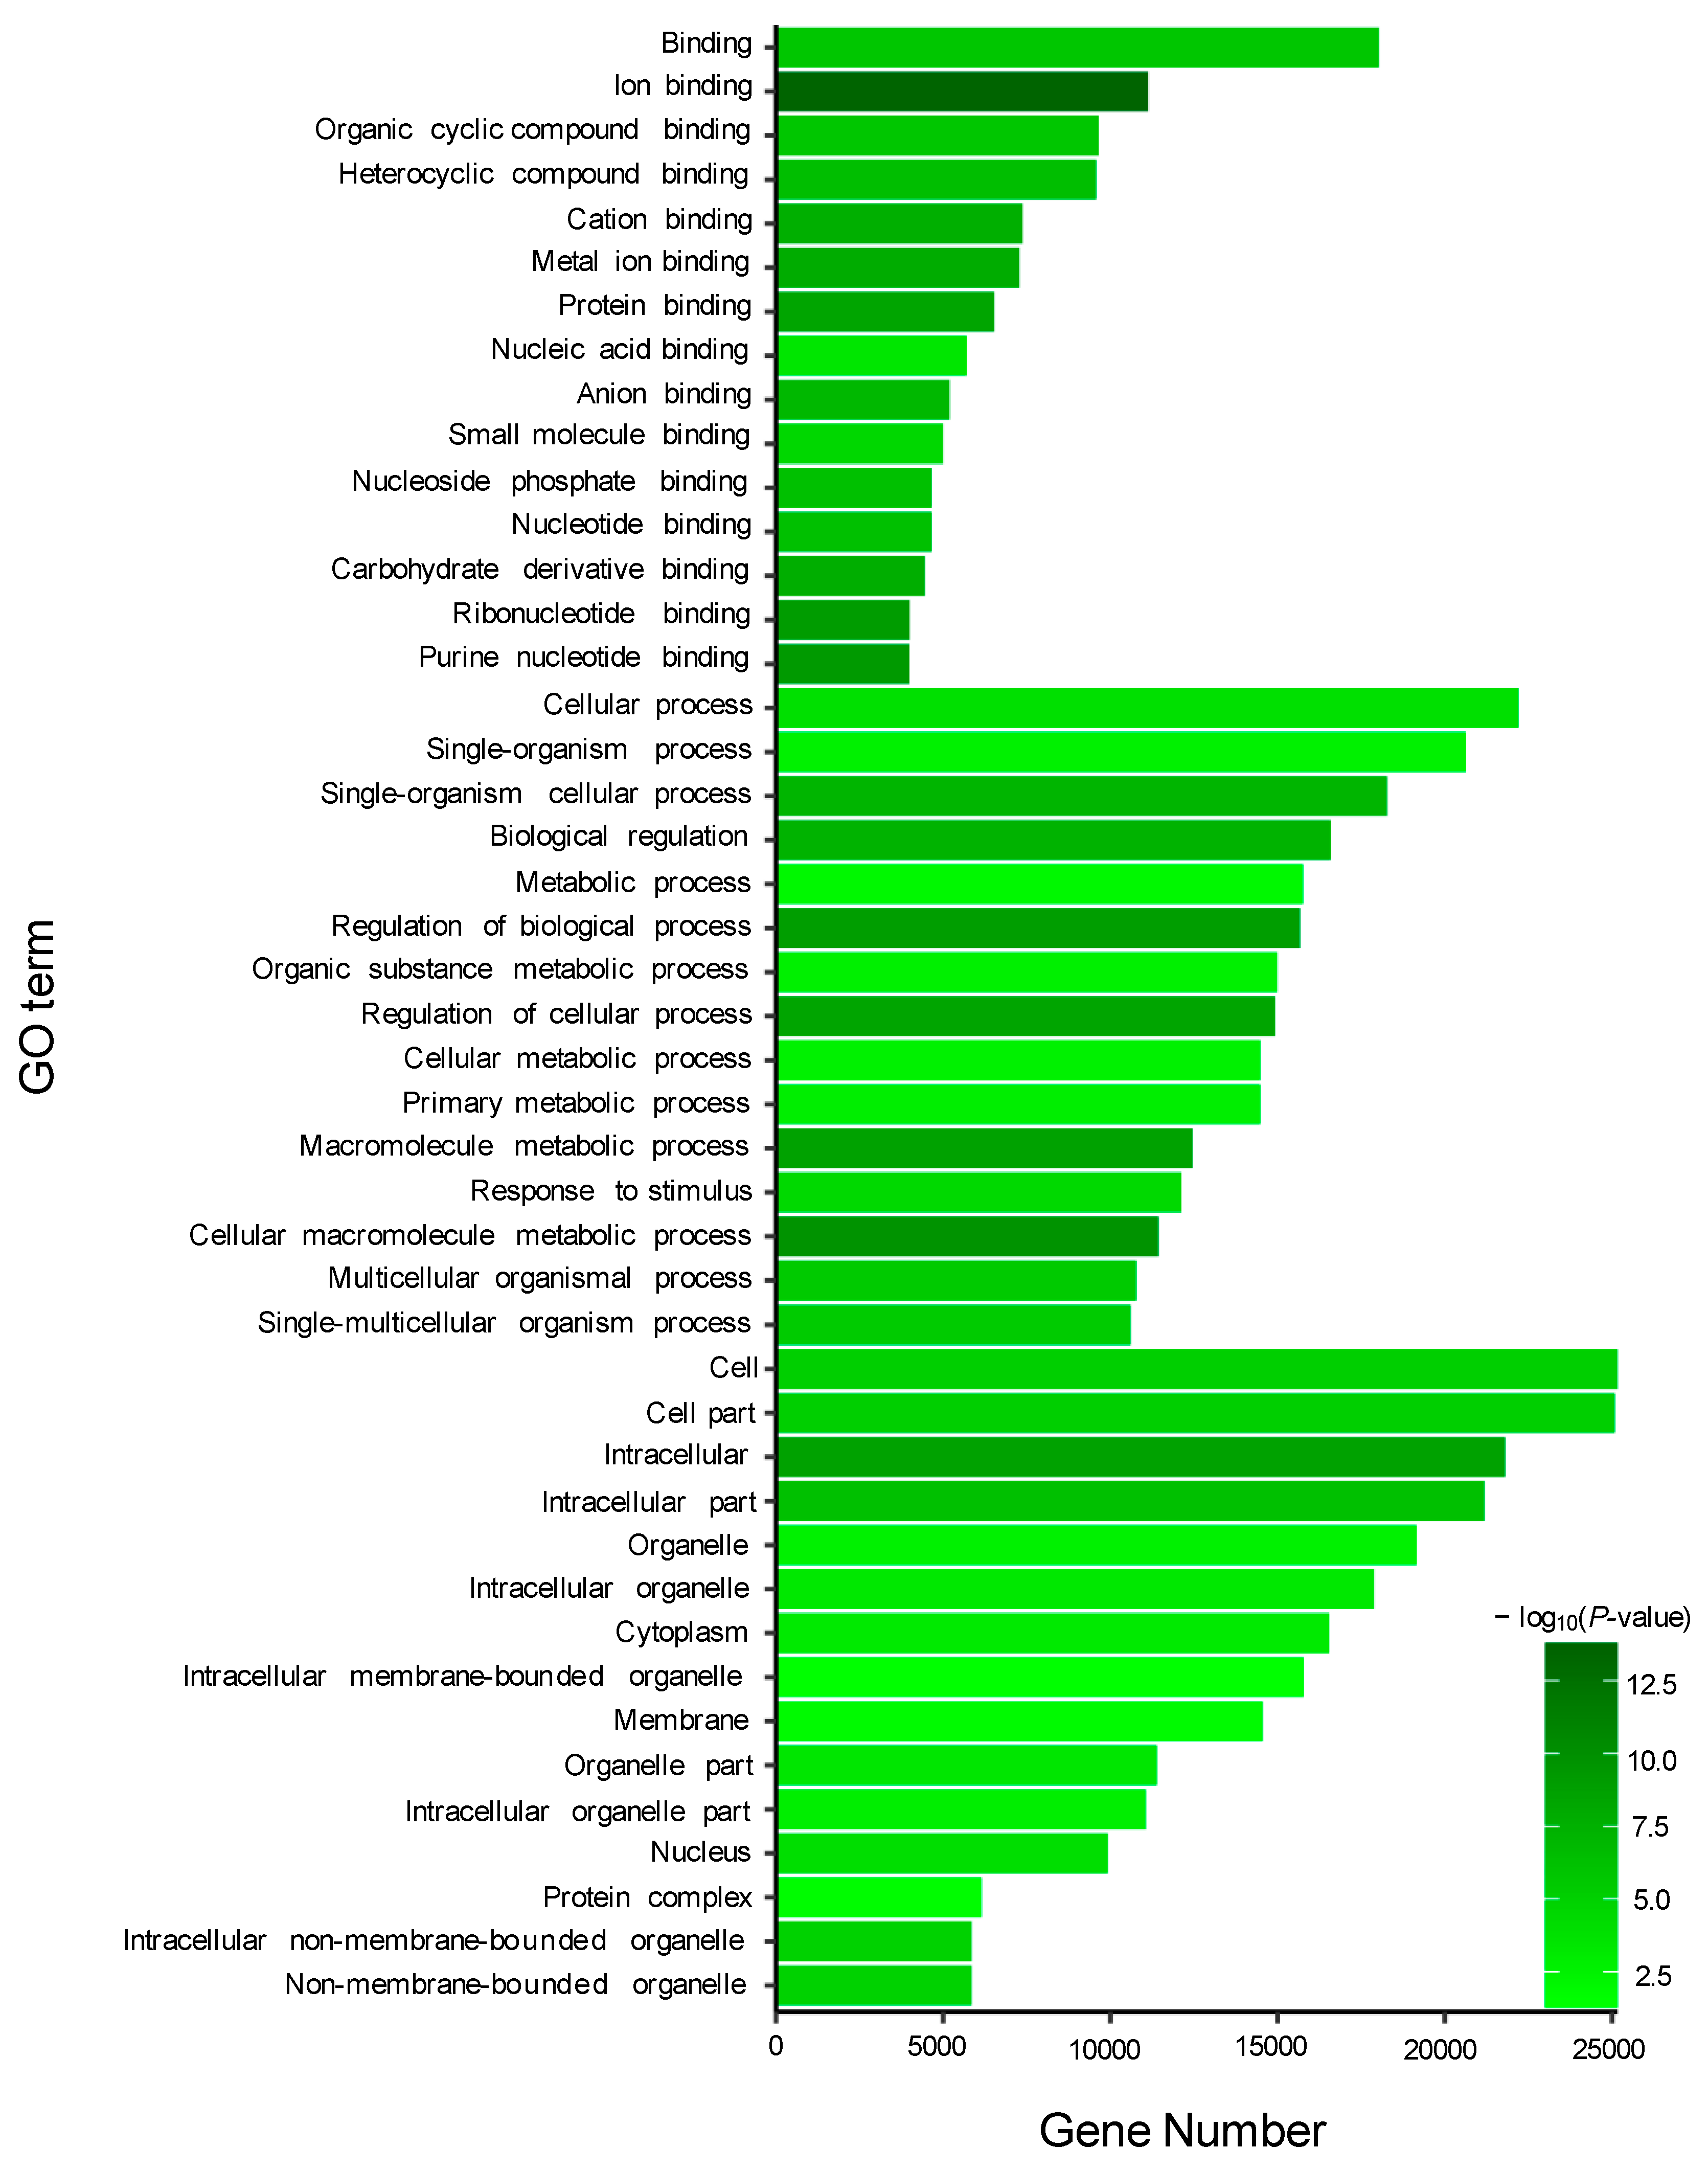
There are three main types of pigment cells in fish, namely melanophores, xanthophores, and iridophores [2]. Among them, iridophores could produce silver pigments to reflect light in fish scales, so the loss of silver pigments could make the fish transparent. In goldfish, the transparent mutants have been reported in China, which were named as crystal goldfish. Further genetic studies on crystal goldfish indicated that the transparent mutants were homozygotes of guanophore (-/-) [
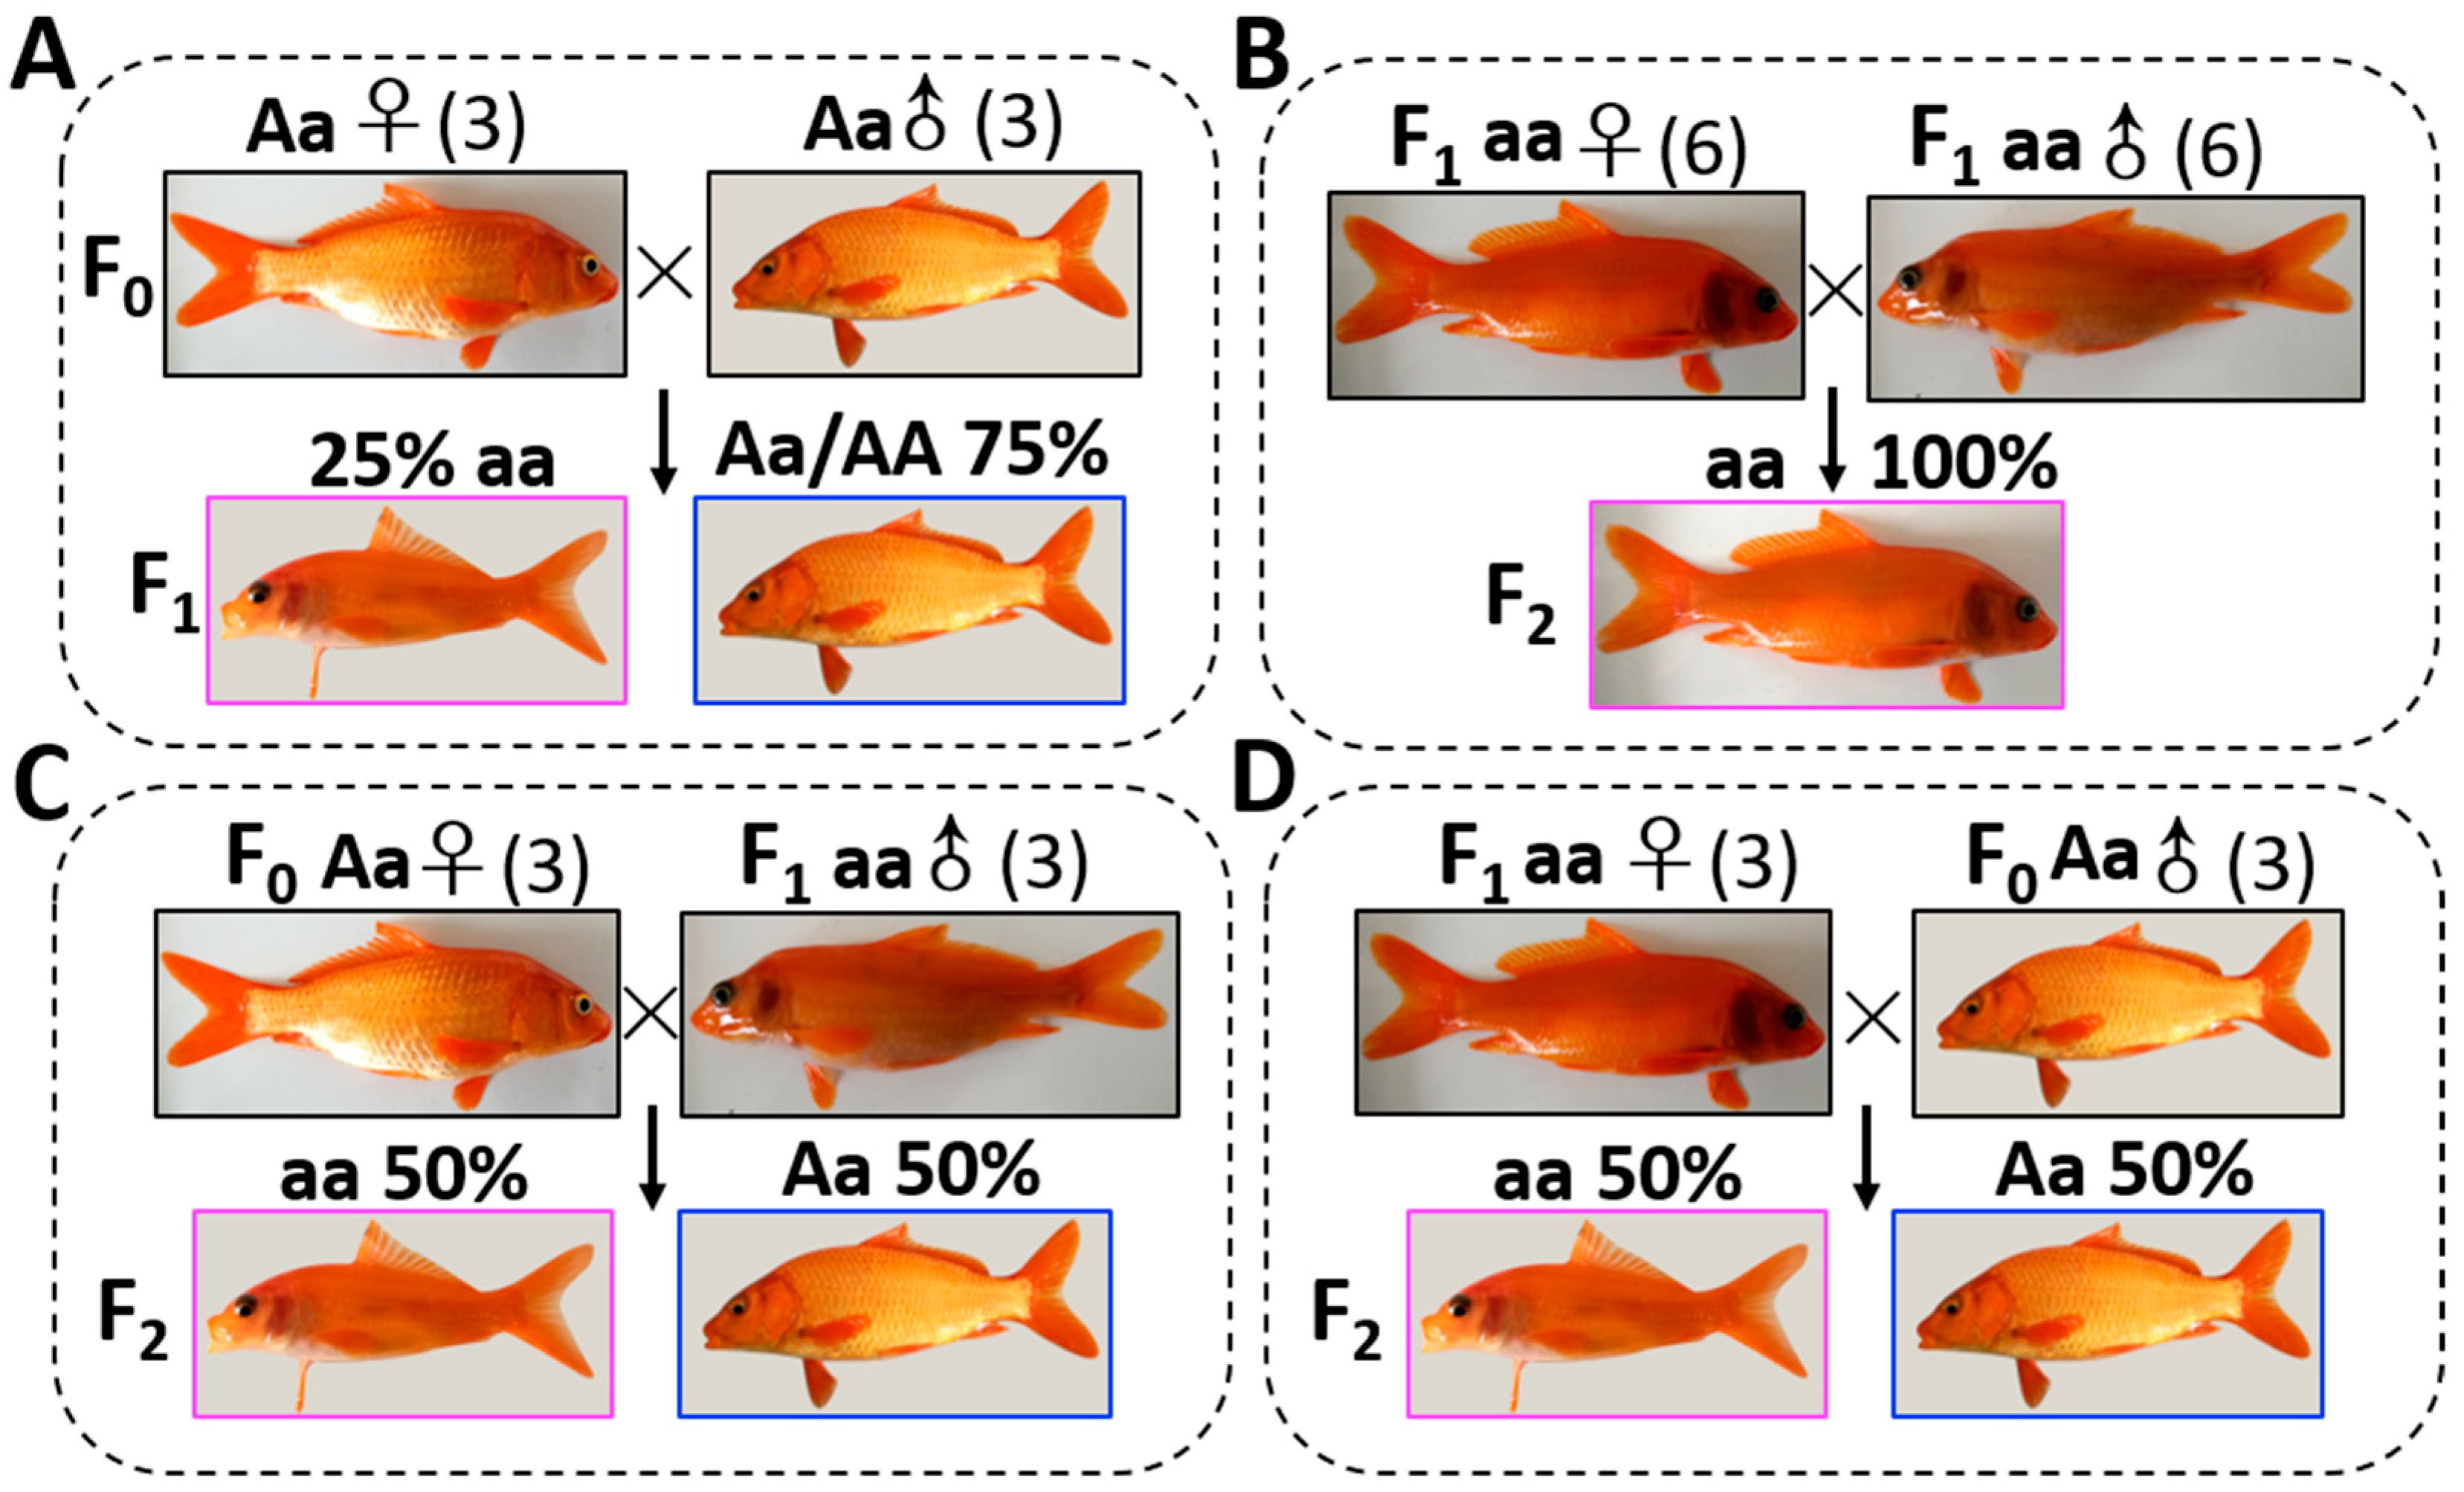
31]. Similarly, our present study demonstrated that the transparent trait in common carp was recessive over the reflective trait, and this phenomenon could completely conform to the Mendelian segregation rule of alleles. These results suggested that the transparent common carp could be a novel model to investigate the genetic basis of silver pigment synthesis.
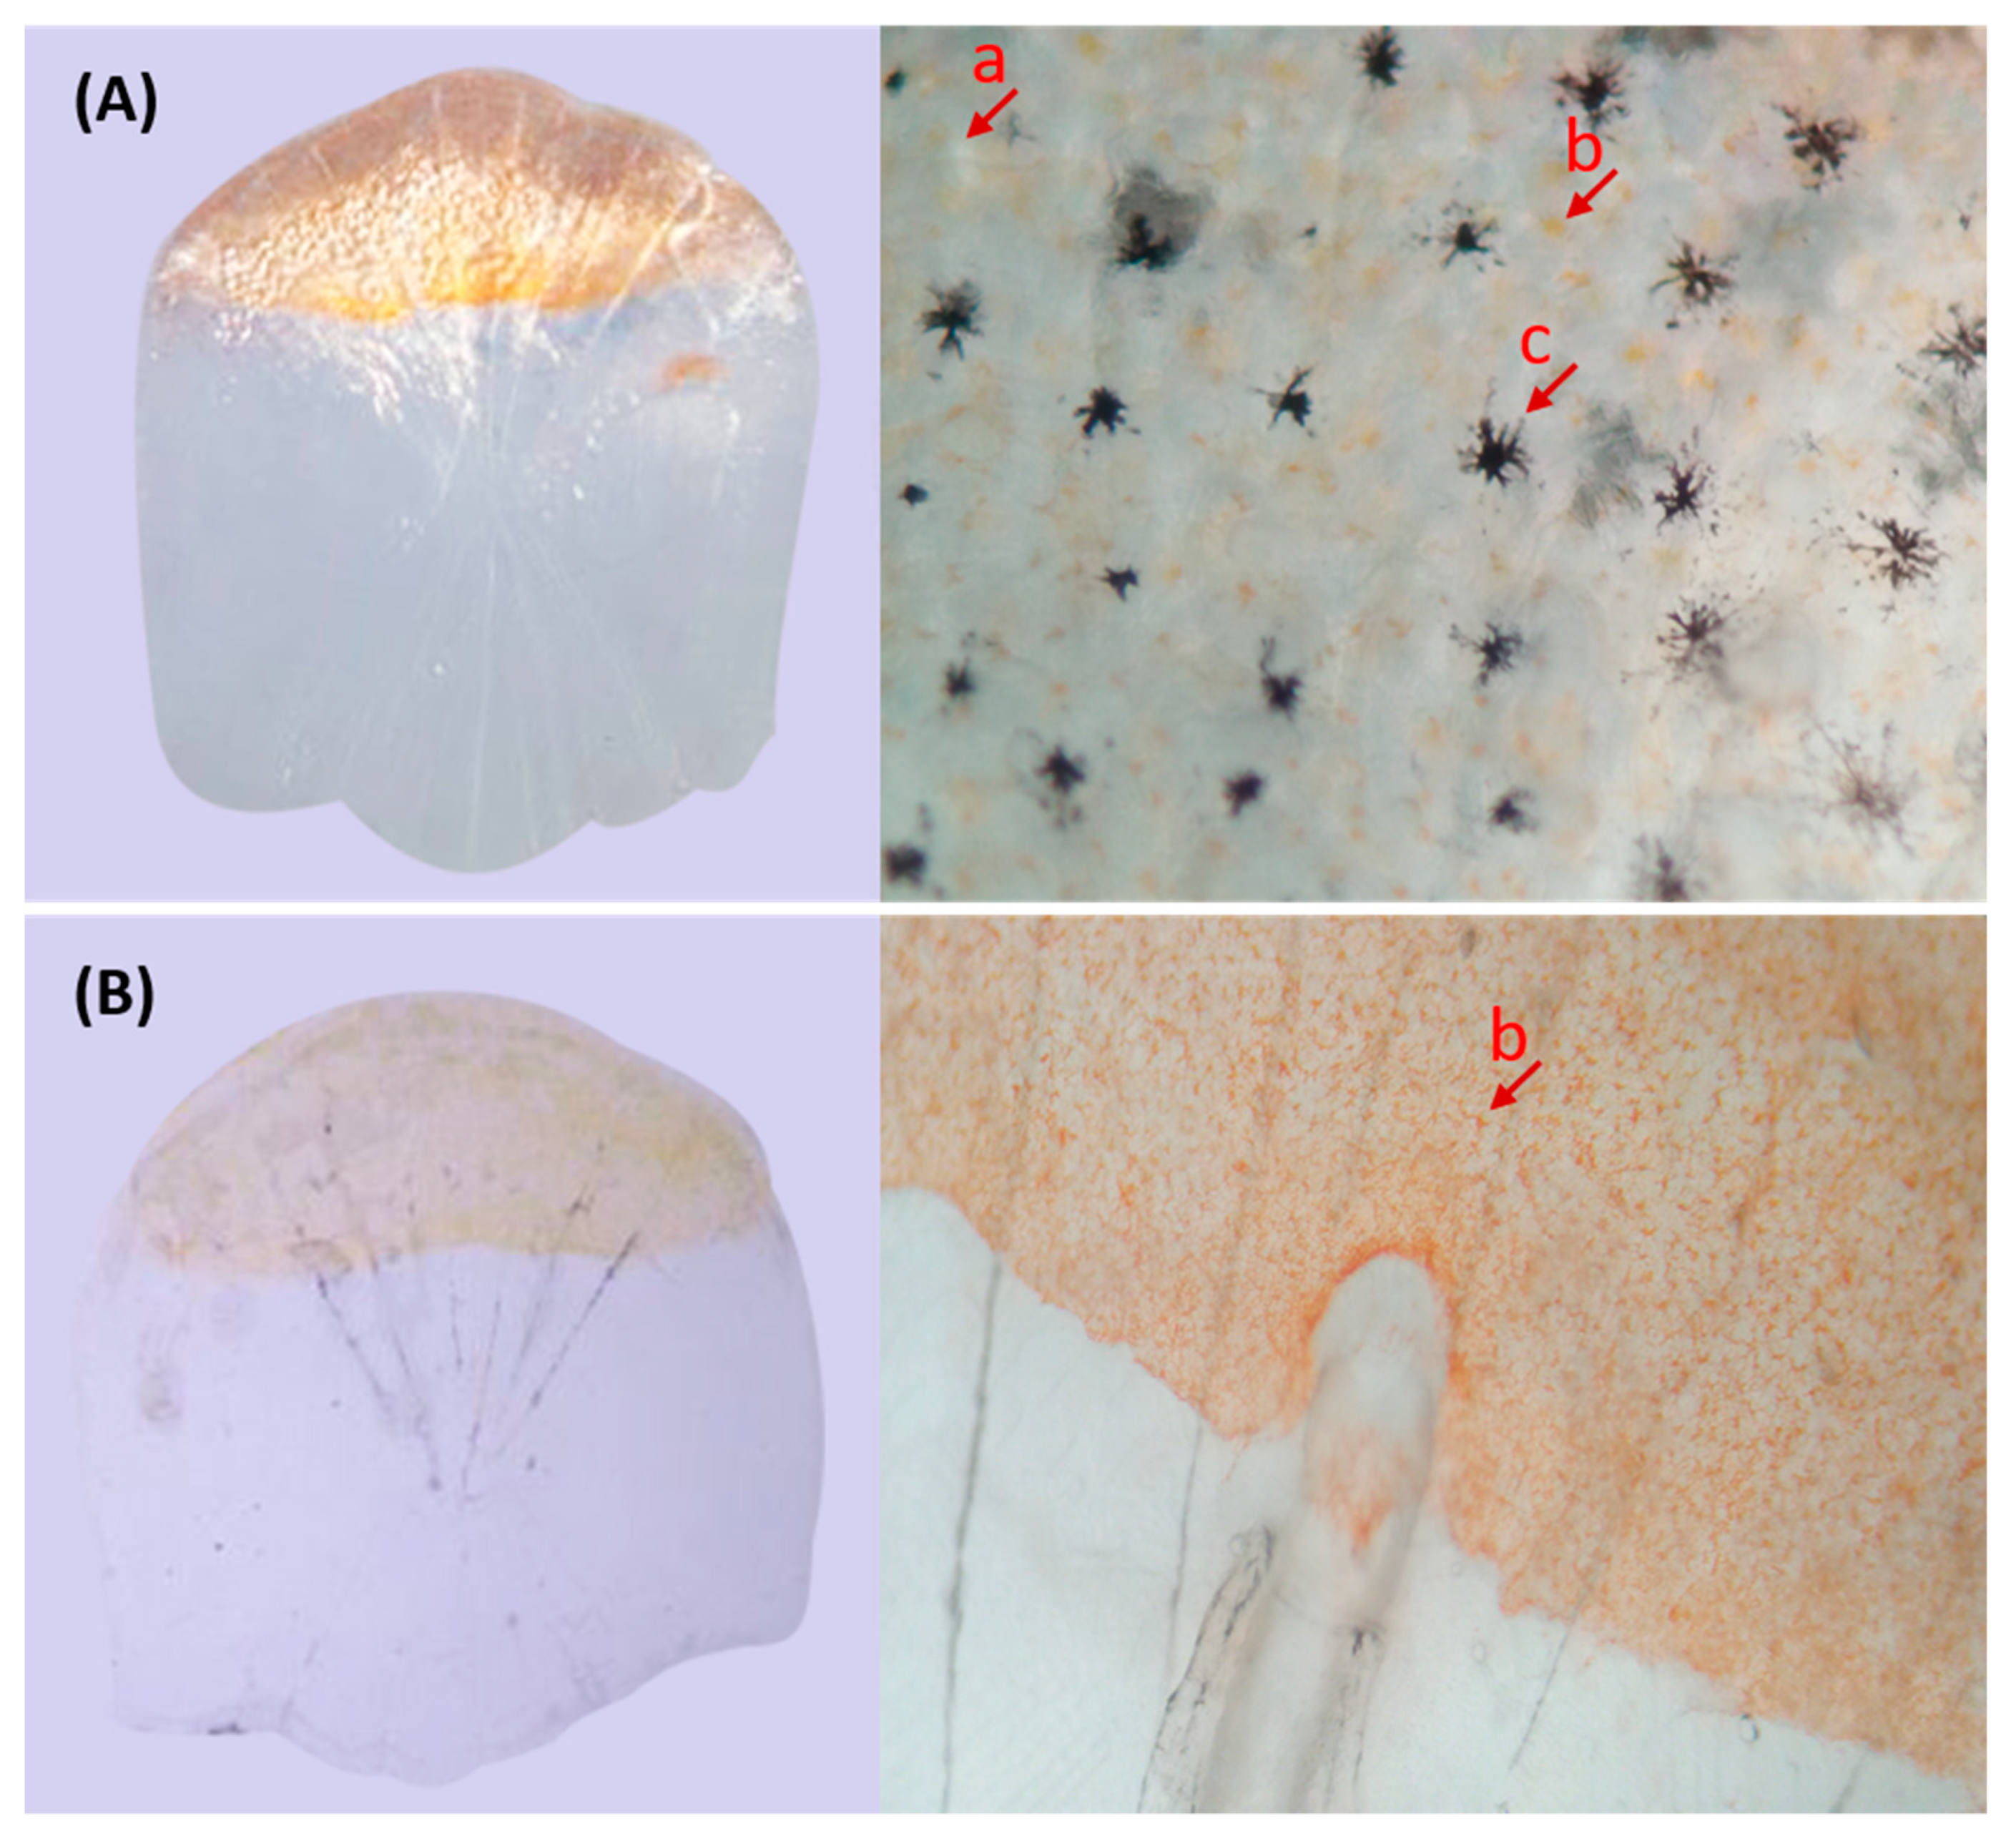
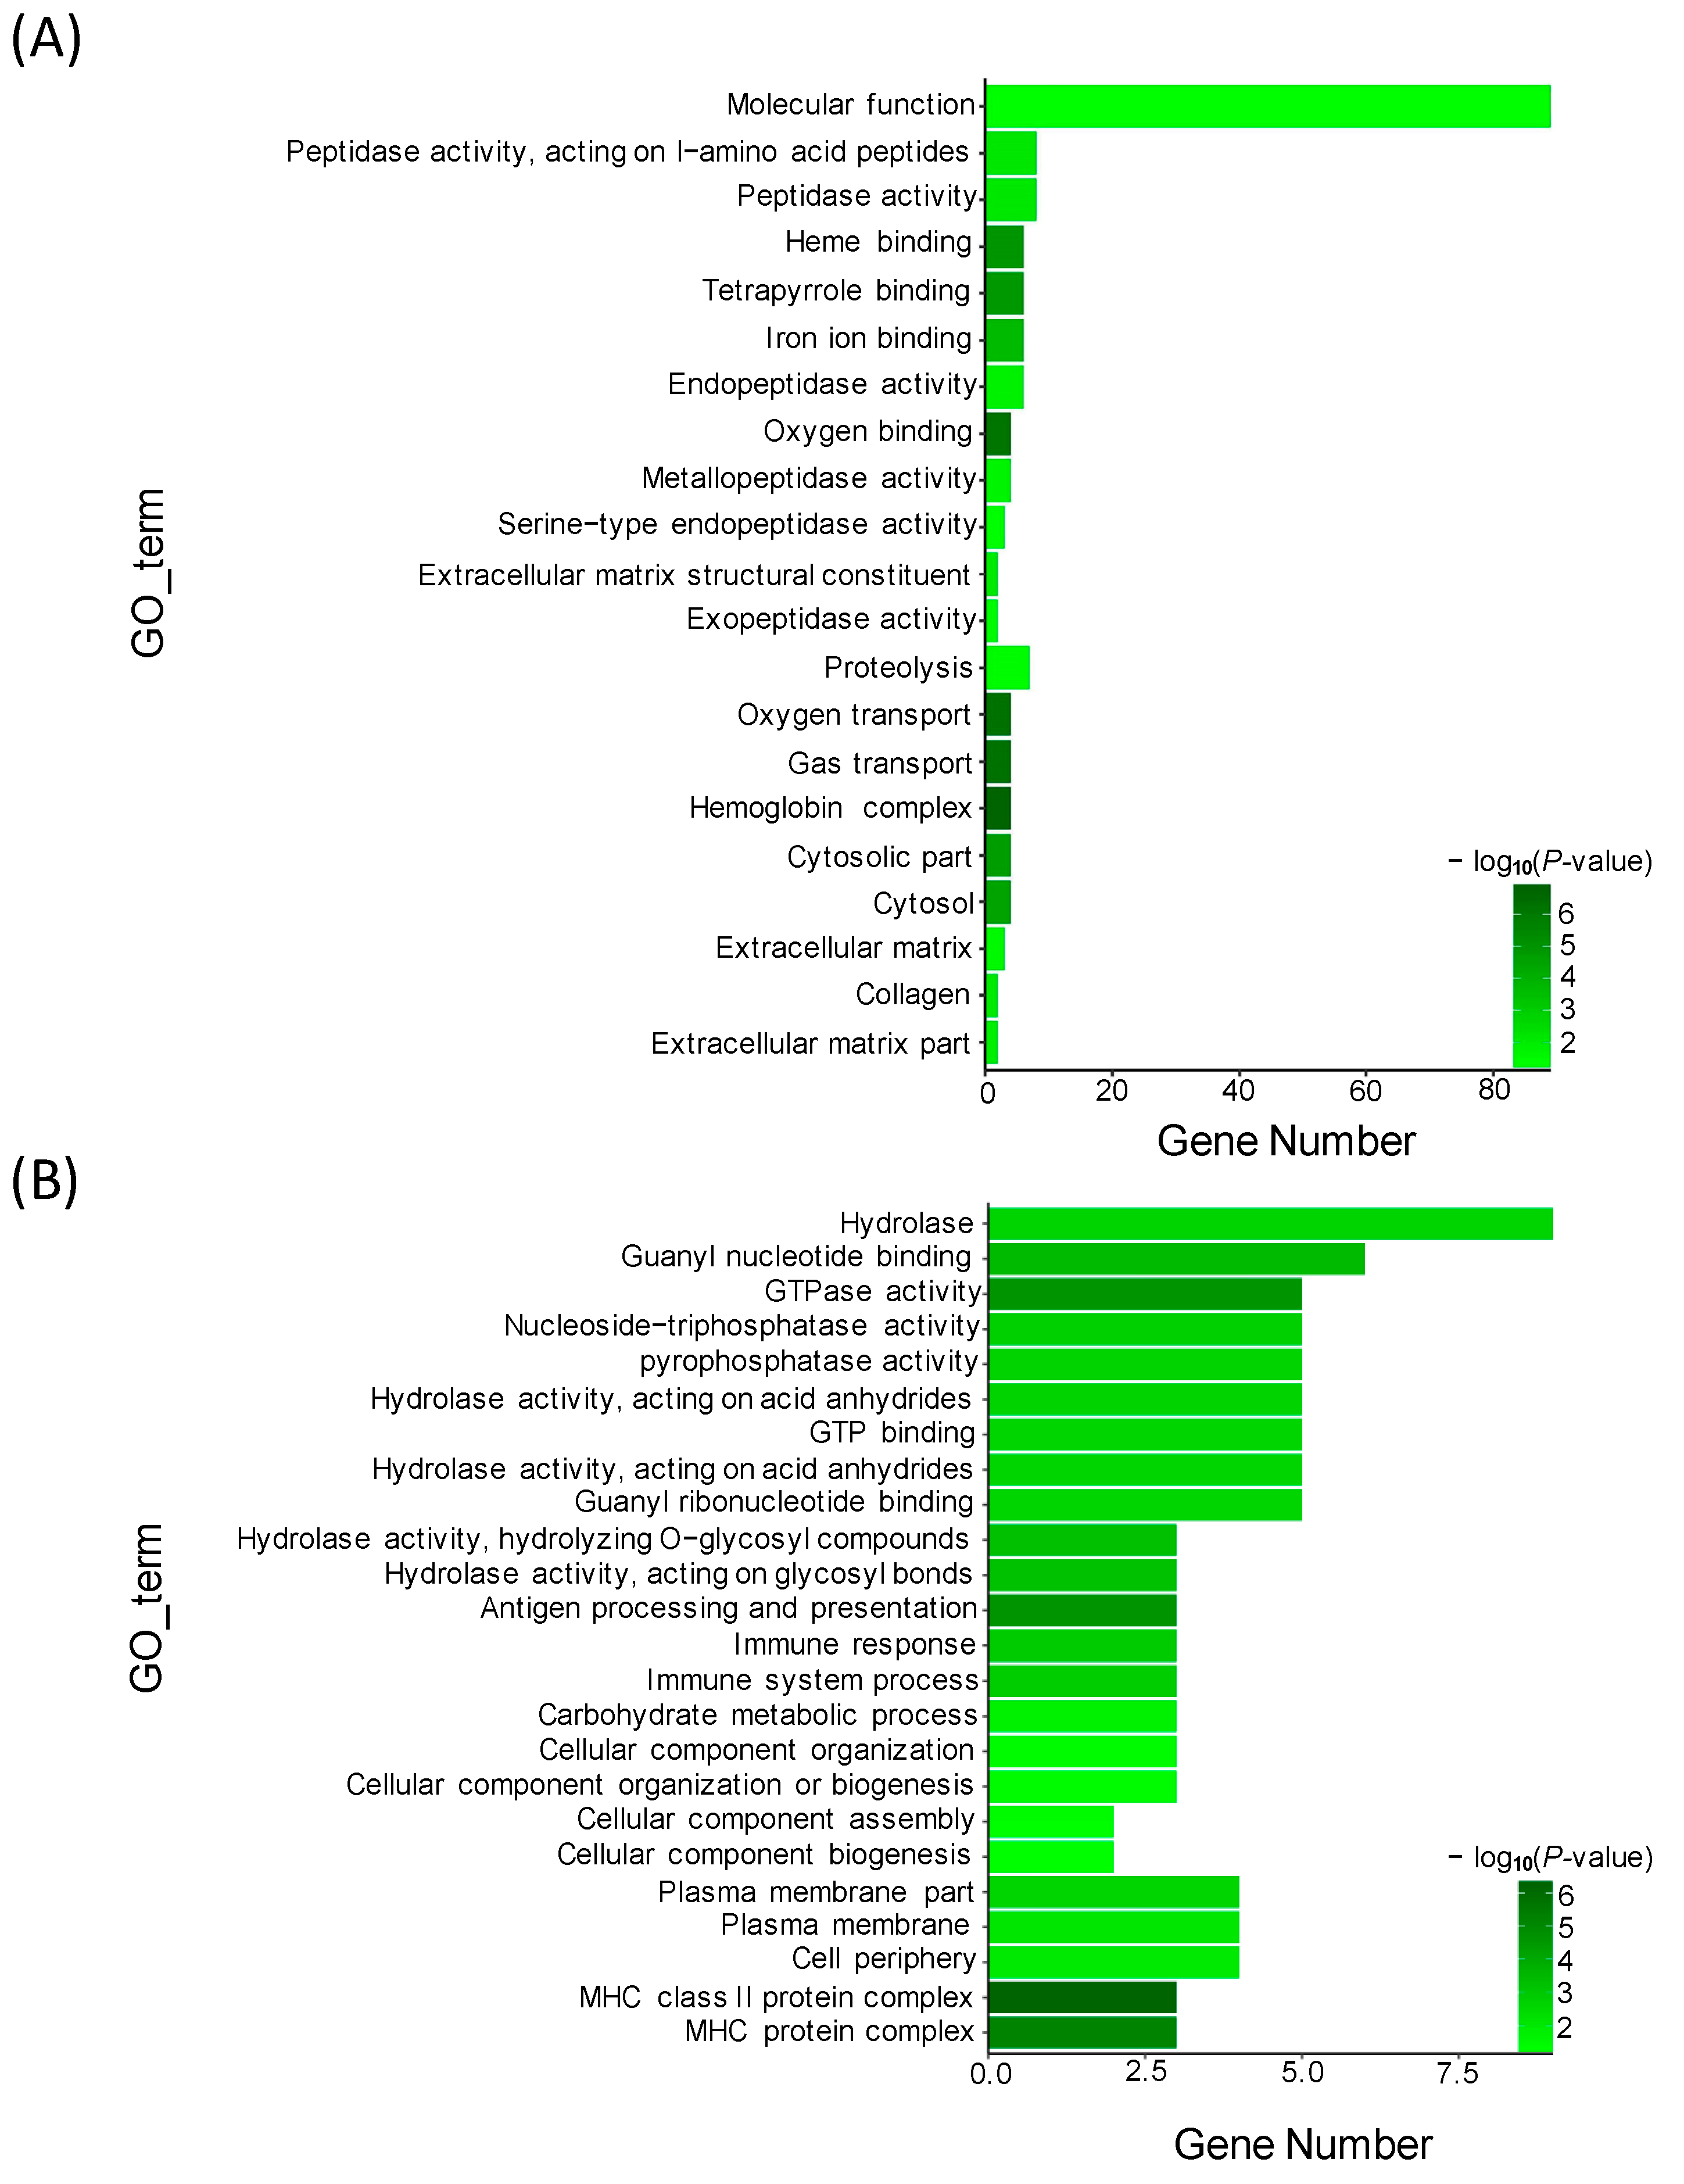
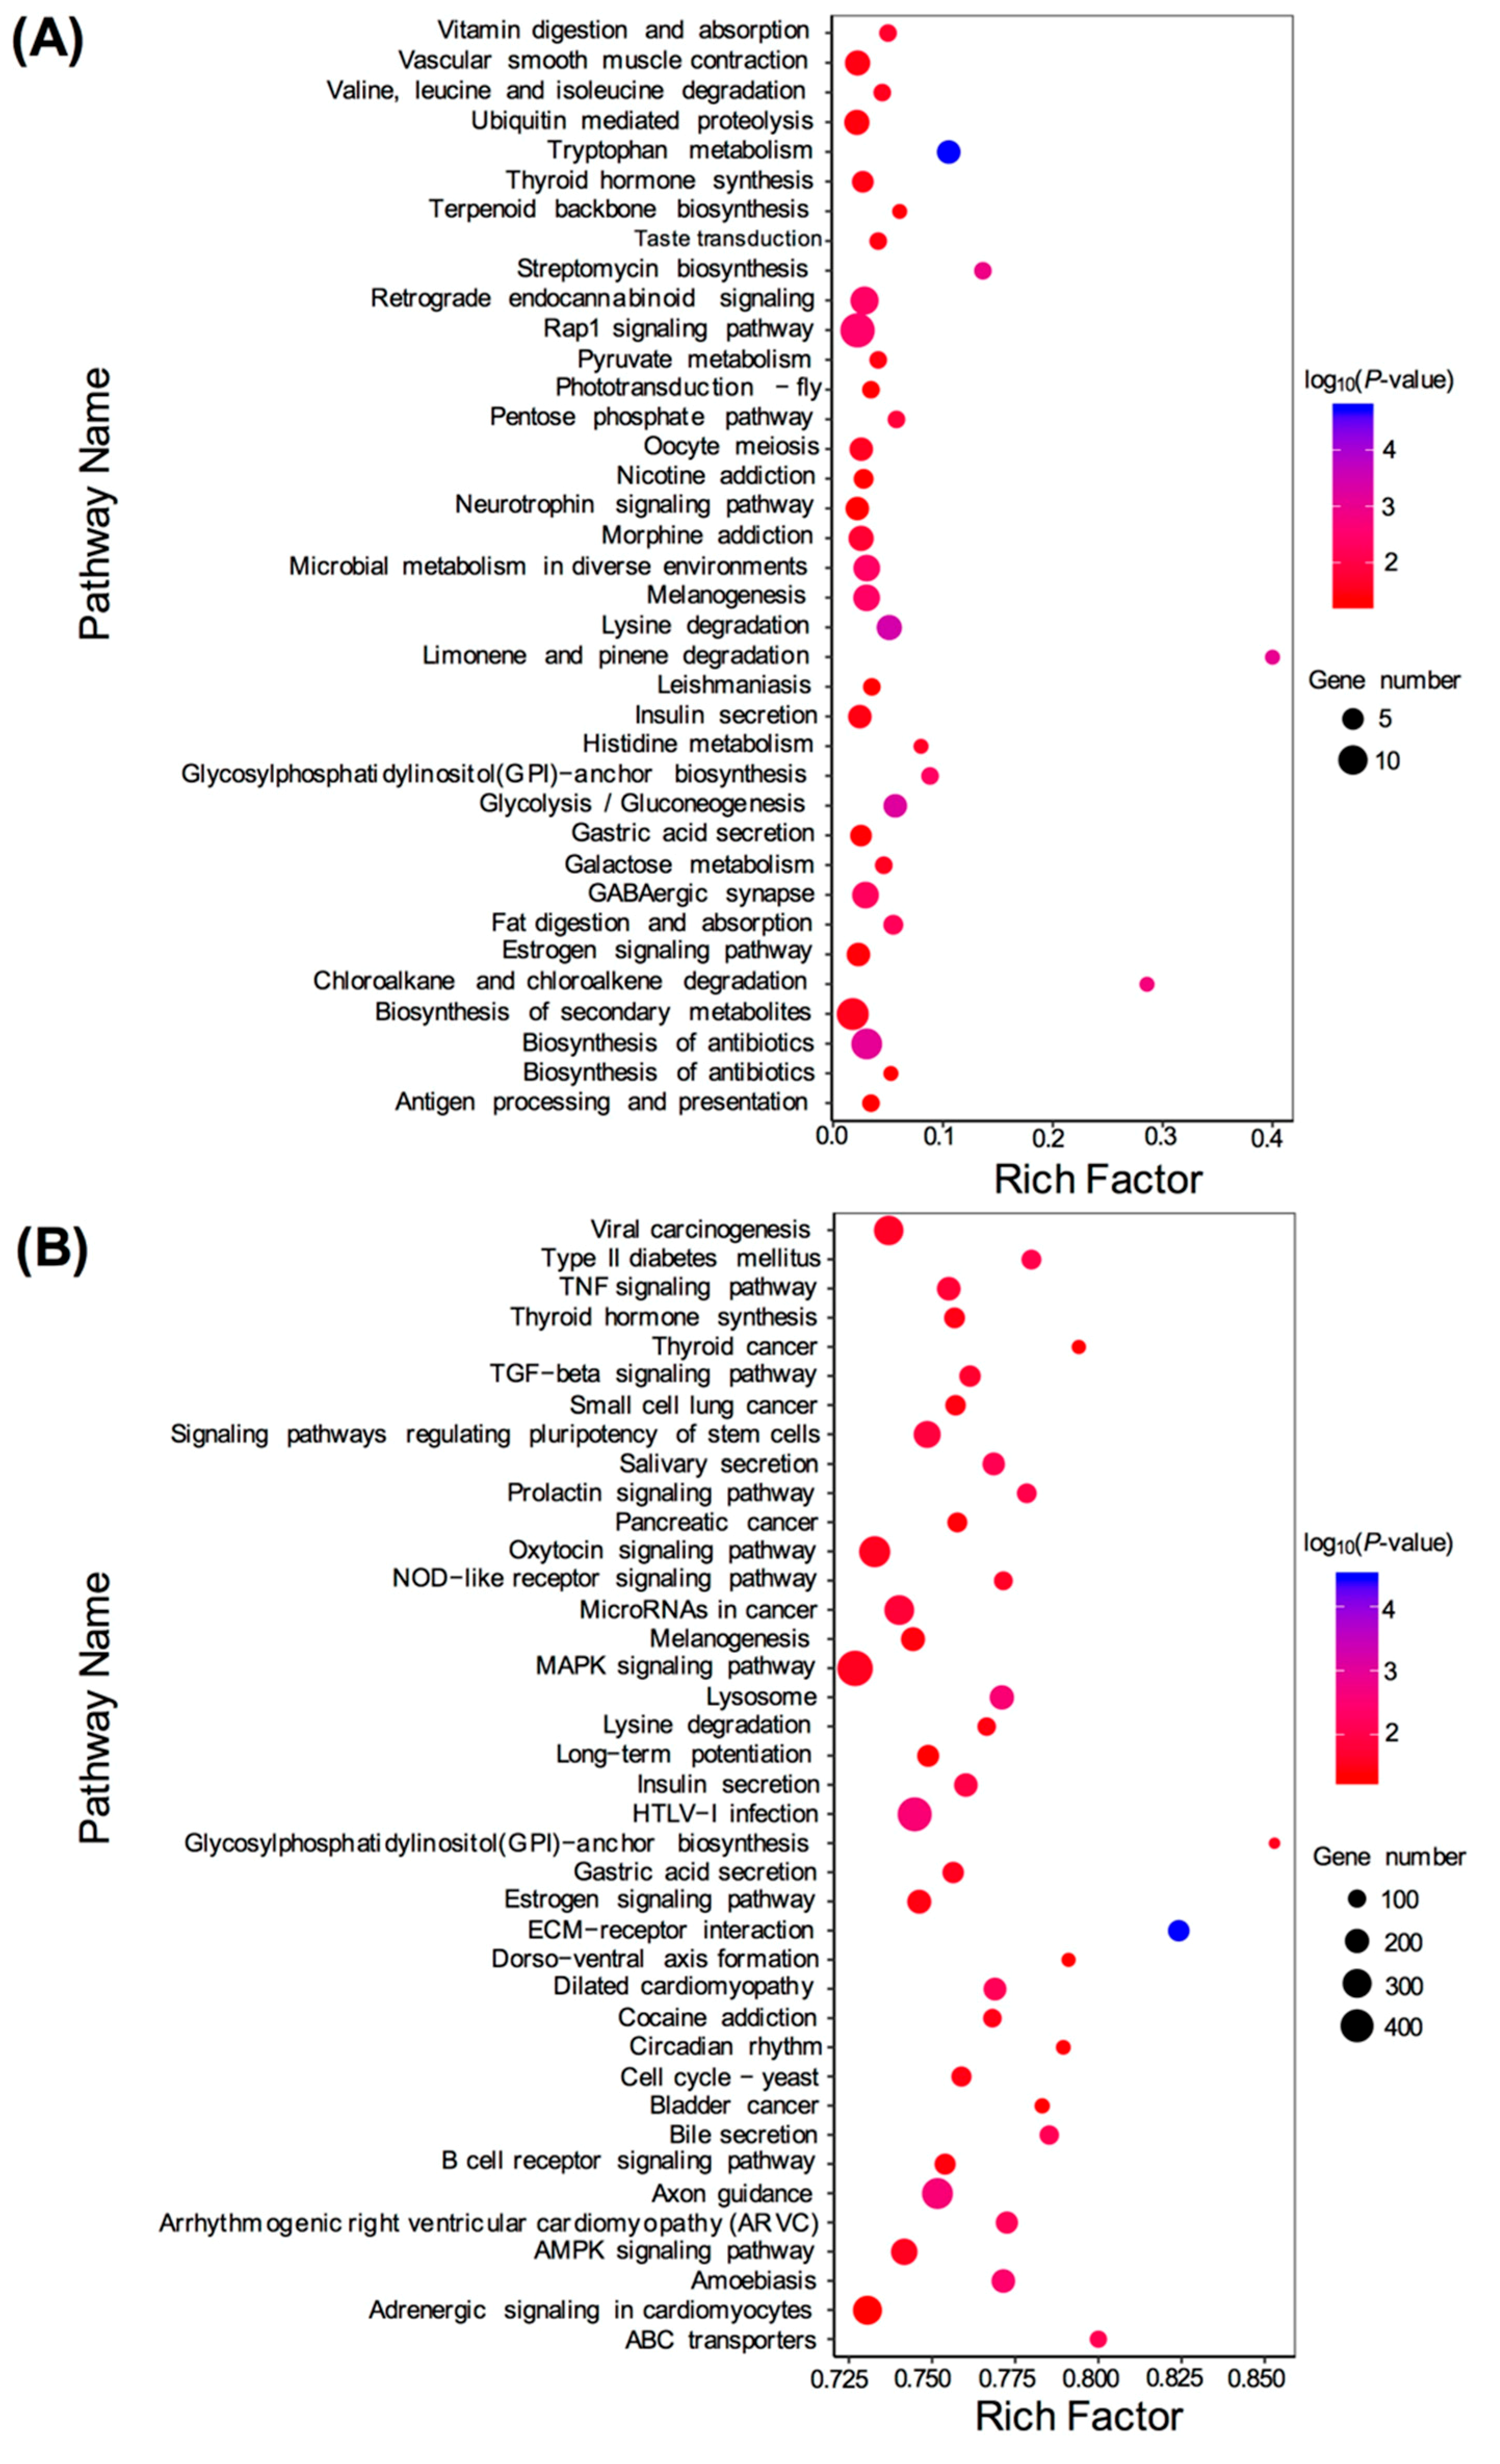
In the present study, microscopic observations showed that the silver pigments and melanin were both lost in the scales of transparent mutants compared to that in wild types. Furthermore, GO and KEGG analysis showed that the DEGs between wild type and transparent mutants were mainly enriched in the metabolism of guanine, such as hydrolase, guanyl nucleotide binding, guanyl ribonucleotide binding, and GTPase activity. Consistent with these, previous studies have shown that the guanine was the major component of silver pigments, and it could combine with water to form a crystal plate to make scales reflect light [32]. The reduction in guanine deposition in iridophores could induce the establishment of the transparent medaka strains [33,34] (Wakamatsu et al., 2001; Ohshima et al., 2013). In addition, the differentiation of melanophores is coupled closely with the onset of pteridine synthesis which starts from GTP and is regulated through the control of GTP cyclohydrolase I activity [14].
Transcriptome analysis showed that several DEGs were detected between TMs and WTs, including purine nucleoside phosphorylase 4a (pnp4a) and endothelin receptor B (ednrb). As a member of pnp gene family in vertebrates, pnp4a was reported to have an important role in guanine synthesis in iridophores [14]. The previously reported zebrafish shady, rosy, and barley transparent mutations were all associated with the deficiency of iridophores caused by the mutant of pnp4a [7,32,35]. The CRISPR/CAS9 system has been used to further confirm that pnp4a was a causal gene on the guanineless locus of zebrafish [14,15]. In the present study, the slivery pigments in TM were completely lost, and pnp4a was less expressed in TM compared to WT. These results, taken together, suggested that pnp4a could also be involved in the formation of silver pigments in common carp. Similar to pnp4a, our results found that the pnp5a was also differentially expressed between WT and TM, which indicated that the pnp5a might be a guanine synthetic gene in teleost iridophores. Endothelin receptor b (ednrb) and its ligand, endothelin (edn), were vital in melanocyte development [36]. The signaling pathway of ednrb could promote the proliferation and differentiation of melanocyte stem cells and the regeneration of epidermal melanocytes, and ednrb mutations could give rise to pigmentation defects [12,13]. Further studies found that the activation of ednrb could induce the phosphorylation of microphthalmia-associated transcription factor (MITF), which was the key transcription factor for catalyzing tyrosine synthesis into melanin in melanocytes [15]. In our present study, the melanin in TM was completely lost and the expression level of ednrb in TM was significantly lower than that in WT, which suggested that ednrb might play an important role in the synthesis of melanin in common carp. Guanine nucleotide-binding protein was the subunit of the G protein-couple signaling pathway, and a previous study reported that it might be involved in the formation of coat color in mice [37]. Interestingly, our present study also found that guanine nucleotide-binding protein subunit α-14 (GNA14) was significantly differentially expressed between WT and TM, which suggested that GNA14 might be involved in the formation of pigment in teleost.
In mammals, miRNAs played pivotal roles in a variety of developmental processes, and their dysregulations were linked to several skin pigment diseases, such as melisma development [38] and melanoma [39]. In teleost, previous studies have reported that miR-429 was highly expressed in red skin of common carp, and inhibition of miR-429 could cause a substantial decrease in skin pigmentation [21], which suggested that the miRNAs also played an important role in the pigmentation of teleost. In our present study, DEMs analysis found that miR-146a and miR-153b were both more highly detected in TM compared to those in WT. In mammals, recent studies have reported that miR-146a played an important role in melanoma [39,40,41] and retinal pigment epithelial cells [42]. Similarly, miR-153 could suppress cell proliferation and invasion by targeting snail family transcriptional repressor 1 (SNAI1) in melanoma [
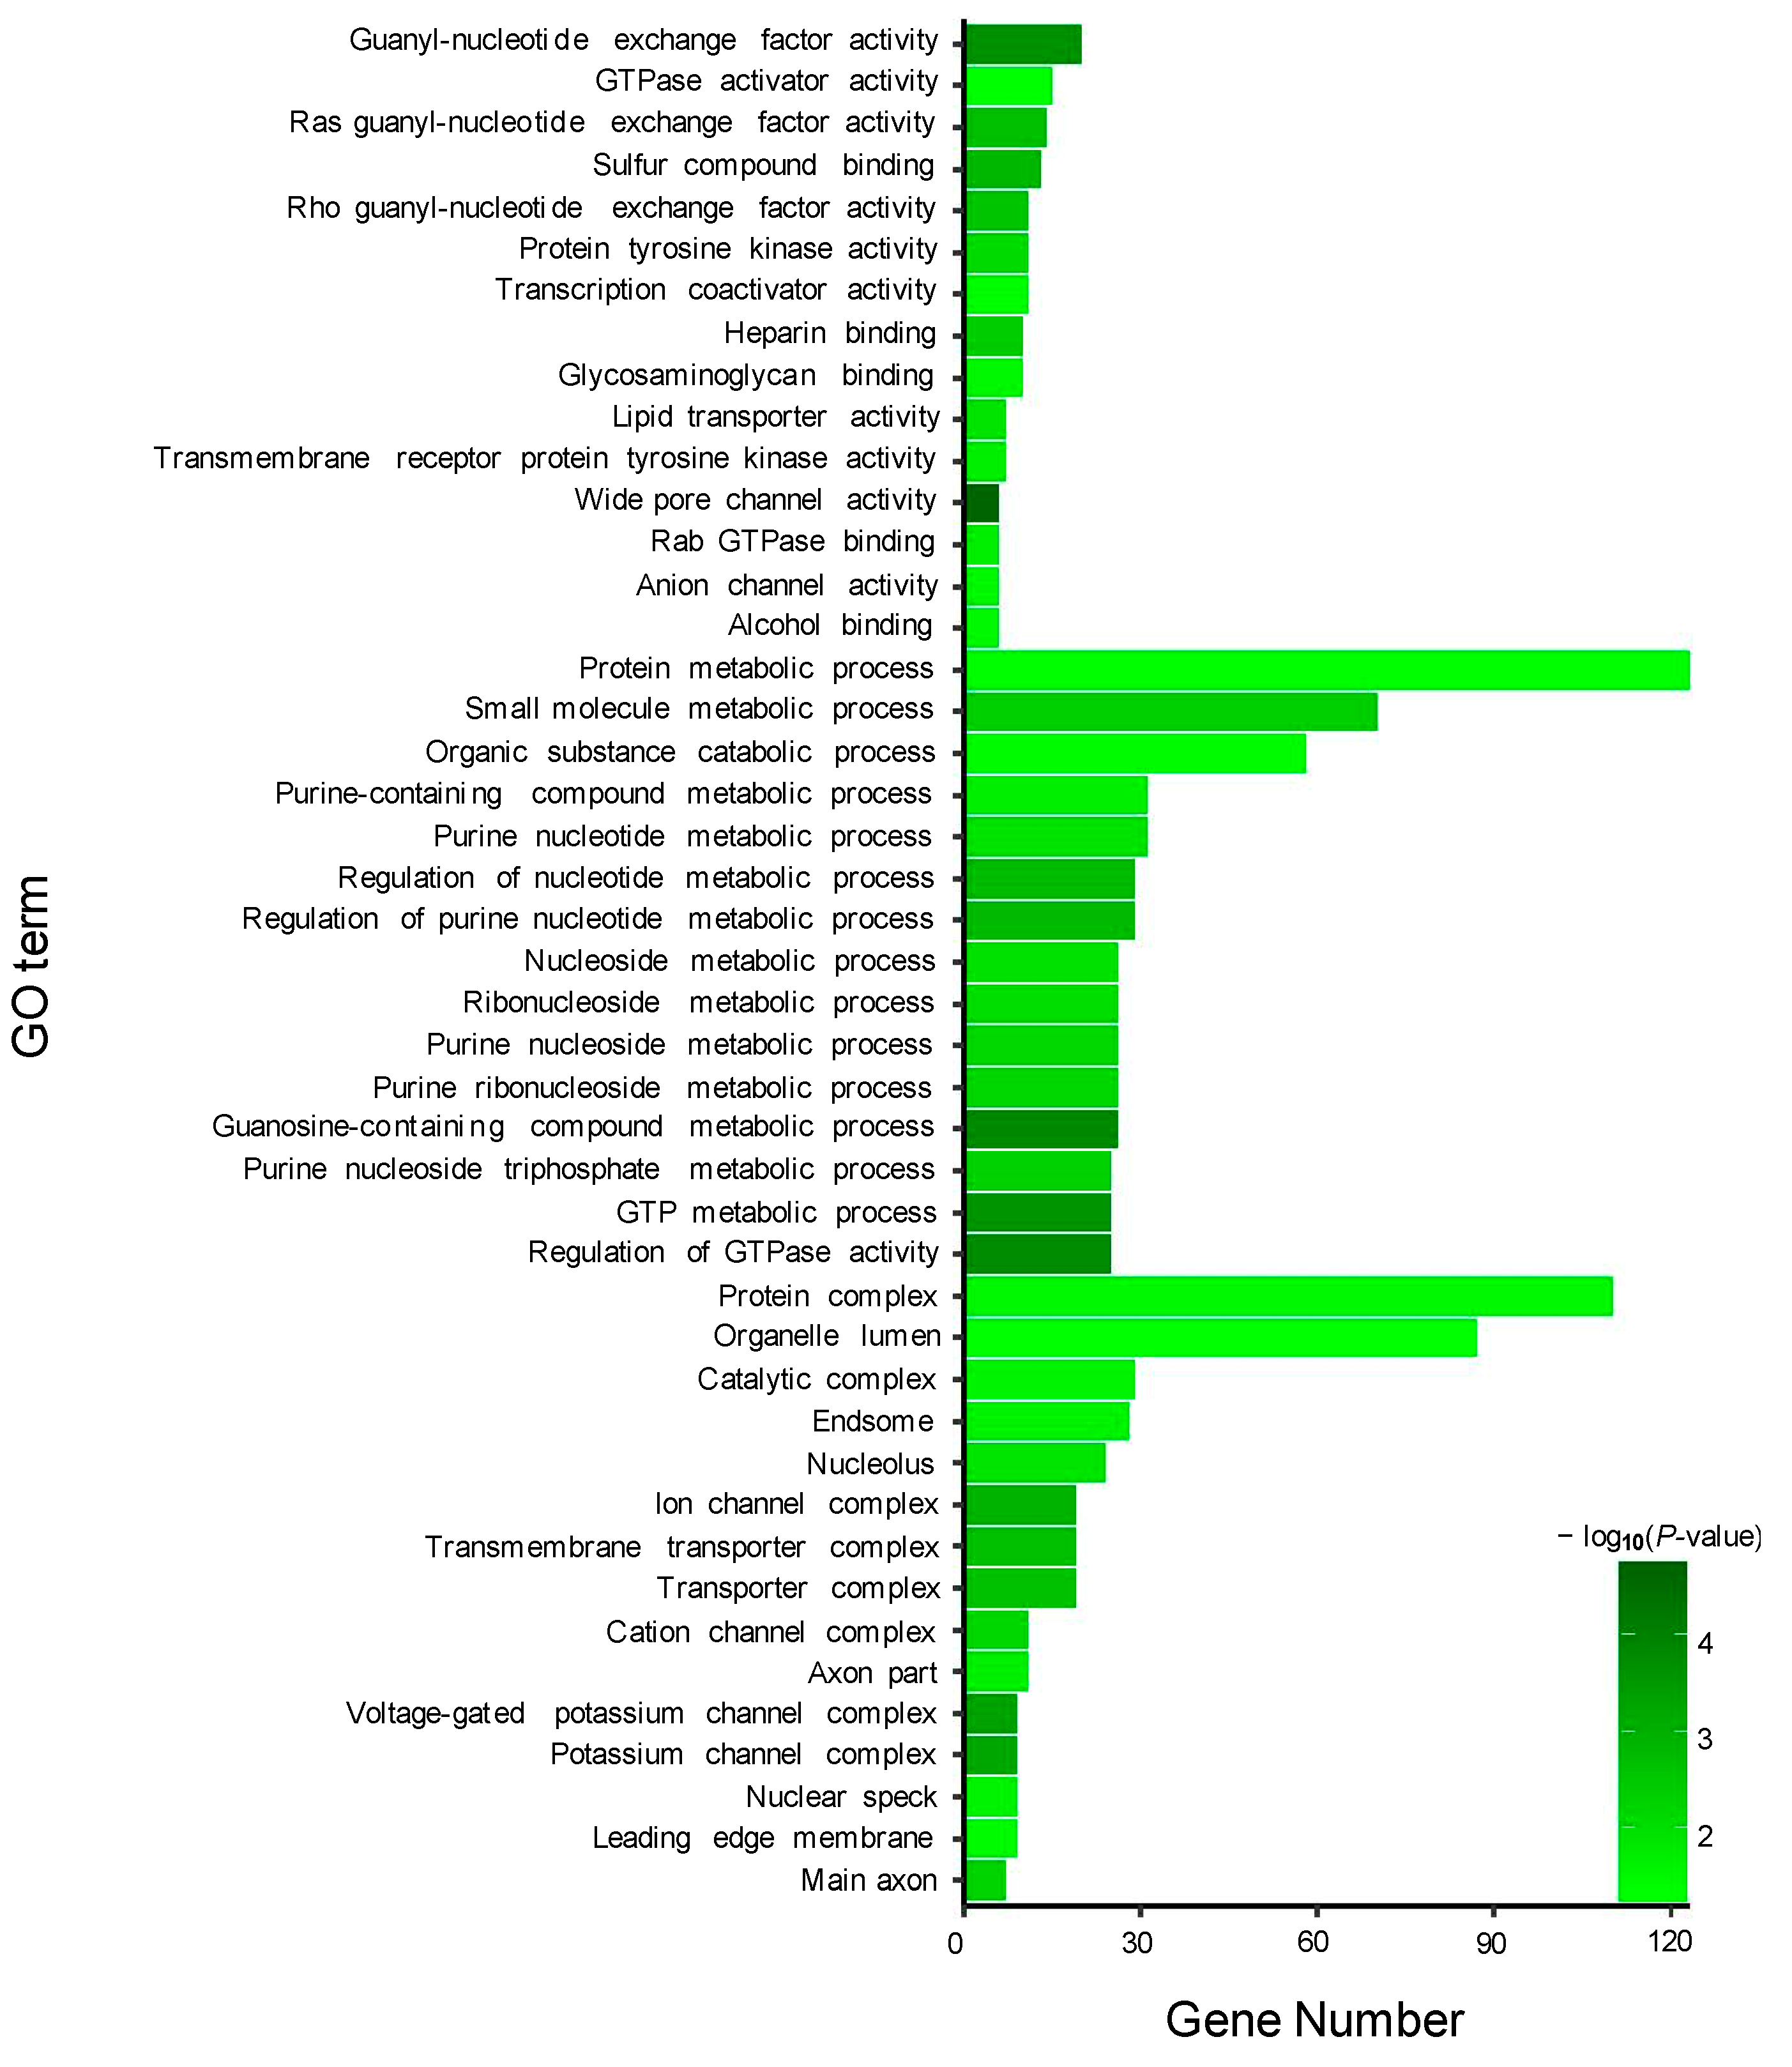
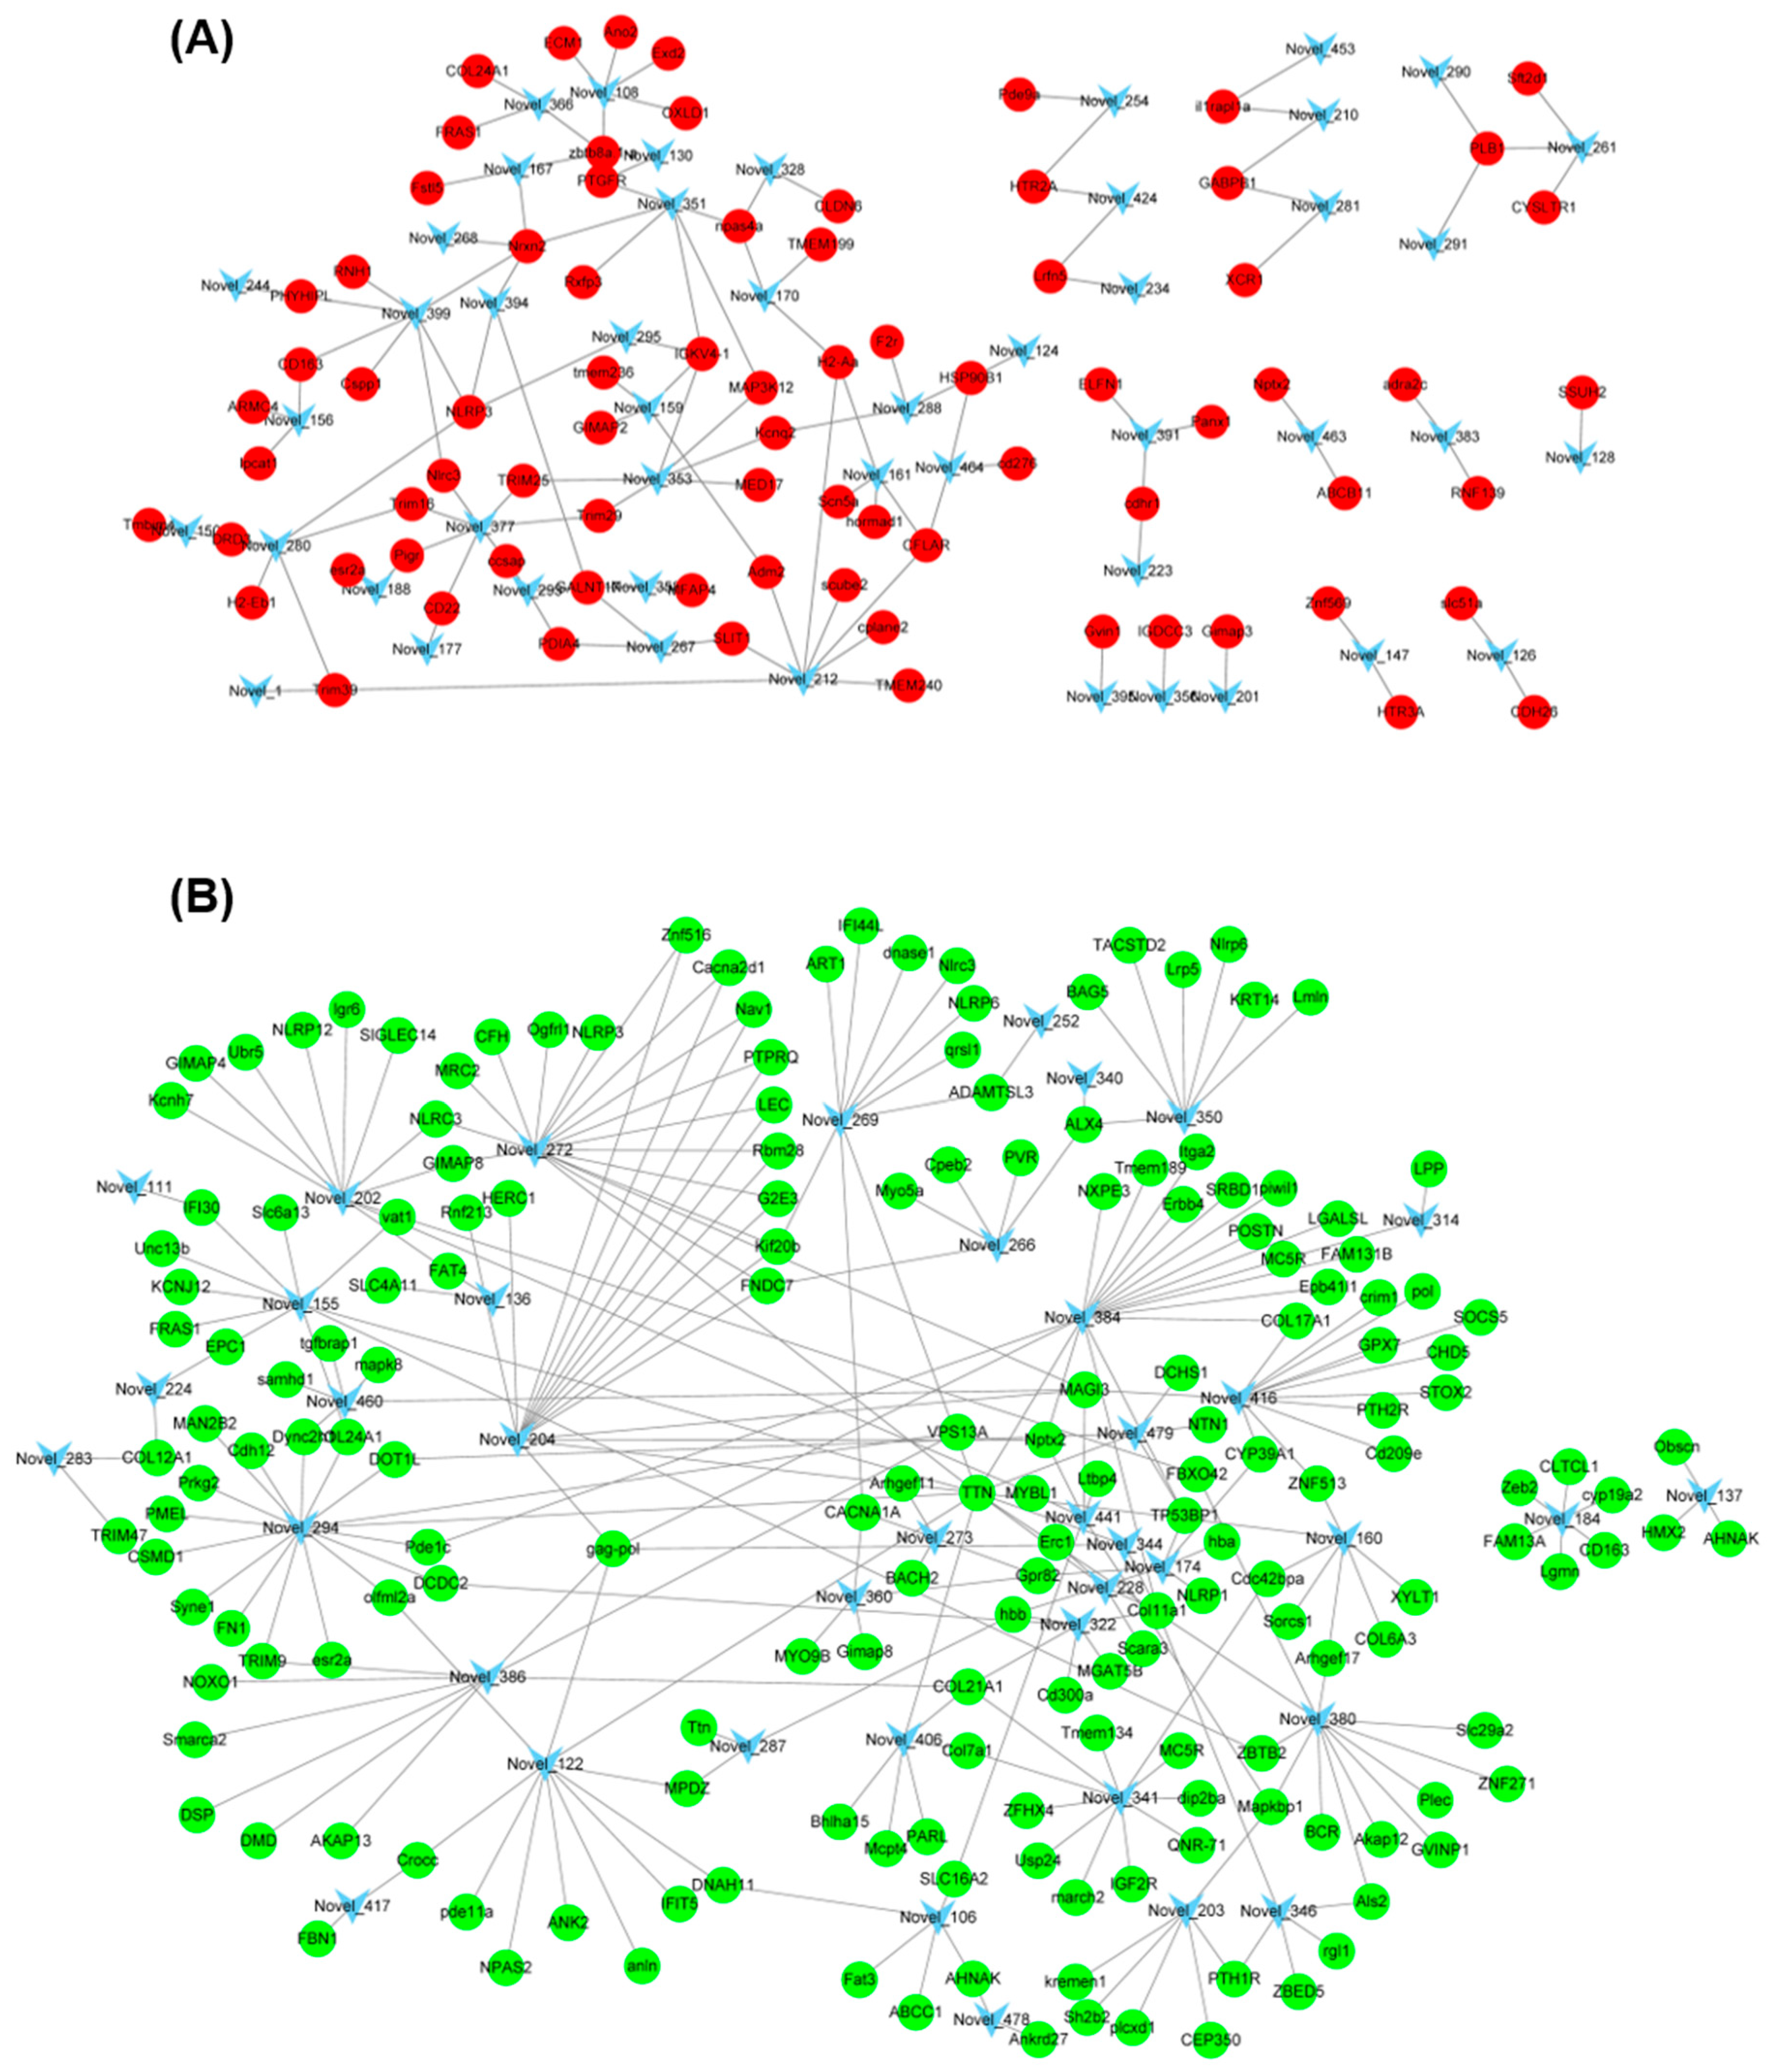
43]. In the present study, further GO and KEGG analysis showed that the target genes of miR-146a and miR-153b were mainly enriched in the guanyl-nucleotide exchange factor activity, GTPase activator activity, purine nucleotide metabolic process, and GTP metabolic process. These results suggested that miR-146a and miR-153b might also play a vital role in the regulation of pigment synthesis in common carp. In addition, we also found several novel DEMs between TMs and WTs, such as Novel_294, Novel_384, Novel_272, Novel_377, Novel_212, and Novel_399. Interaction analysis showed that these DEMs were associated with several DEGs between TMs and WTs. Further GO and KEGG analysis showed that these target DEGs were mainly enriched in purine nucleotide binding and nucleic acid binding. These results suggested that these novel DEMs might also play an important role in the regulation of pigmentation.
In the present study, the transparent mutants were detected in the CyCa hybrid carp. Microscopic examination showed that the scales of transparent mutants were completely devoid of silver pigments and melanin. Genetic analysis indicated that the transparent trait was recessive over the opaque trait in common carp. To further examine the molecular mechanism of the transparent trait, RNA-Seq and miRNA-Seq were both used to detect the DEGs and DEMs between TMs and WTs. RNA-Seq analysis showed that several DEGs were detected between TMs and WTs, such as pnp4a and ednrb. Interestingly, previous studies have reported that the pnp4a and ednrb played an important role in the synthesis of silver pigments and melanin, respectively. In addition, our GO and KEGG analysis showed that the DEGs between TM and WT were mainly enriched in the metabolism of guanine, which was consistent with the previous studies that the silver pigment was the metabolic product of guanine. By using miRNA-Seq analysis, several known and novel DEMs were also detected between TM and WT. In addition, interaction analysis showed that the DEMs were associated with several DEGs. These results suggested that the miRNAs were also involved in carp pigmentation. In general, the present study could provide some new ideas for investigating the genetic mechanism of the transparent trait and the formation mechanism of sliver pigment in common carp.

Supplementary Materials

The following are available online at https://www.mdpi.com/2073-4425/10/9/704/s1: Figure S1: Volcano plot of DEGs and DEMs in TM and WT: (A) Volcano plot of DEGs in TM and WT; (B) Volcano plot of DEMs (known) in TM and WT; (C) Volcano plot of DEMs (novel) in TM and WT. Splashes represent different genes or miRNAs, and the black splashes mean genes or miRNAs without significant differential expression. The red splashes mean significantly up-regulated genes or miRNAs, and the green splashes mean significantly down-regulated genes or RNAs. Figure S2: GO classification annotation chart: The abscissa represents the three ontologies of GO, which are molecular function, cellular component, and biological process. The ordinate represents the percent of genes and the number of genes. Table S1: Primer sequences. Table S2: Statistic of mRNA data. Table S3: Statistic of miRNA data. Table S4: DE miRNAs in TM compared to WT. Table S5: All the DE genes between TM and WT.

Author Contributions

Conceptualization, G.H. and G.Z.; methodology, L.Z.; software, J.J. and C.Y.; validation, L.Z., H.L. and X.Z.; formal analysis, S.X.; investigation, Q.H.; resources, Y.Y.; data curation, L.Z.; writing—original draft preparation, L.Z., H.L. and X.Z.; writing—review and editing, G.H. and G.Z.; visualization, G.H.; supervision, G.H.; project administration, G.Z.; funding acquisition, G.Z.

Funding

This work was supported by the fund from the Key Lab of Freshwater Biodiversity Conservation Ministry of Agriculture to H.G.F. (LFBC0906), NSFC Grant (31602130) and the Fundamental Research Funds for the Central University (2662019PY006). This work was also supported by the Huazhong Agricultural University Undergraduate Science and Technology Innovation Project (2018BC010 for ZLL) and National College Student Innovation Training Program (201810504100 for YYN).

Acknowledgments

We thank the Yaowan Testing Ground of the Yangtze River Fisheries Research Institute (Jingzhou City, China) for the sample collection of CyCa hybrid carp.

Conflicts of Interest

The authors declare no conflict of interest.

Abbreviations

WTwild type of carp-goldfish nucleocytoplasmic hybrid
TMtransparent mutant of carp-goldfish nucleocytoplasmic hybrid
pnp4apurine nucleoside phosphorylase 4a
ednrbendothelin receptor B
DEGdifferentially expressed gene
DEMdifferentially expressed miRNA

References

  1. Protas, M.E.; Patel, N.H. Evolution of coloration patterns. Annu. Rev. Cell Dev. Biol. 2008, 24, 425–446. [Google Scholar] [CrossRef] [PubMed]
  2. Kelsh, R.N. Genetics and evolution of pigment patterns in fish. Pigment Cell Res. 2004, 17, 326–336. [Google Scholar] [CrossRef] [PubMed]
  3. Aspengren, S.; Sköld, H.N.; Wallin, M. Different strategies for color change. Cell. Mol. Life Sci. 2009, 66, 187–191. [Google Scholar] [CrossRef] [PubMed]
  4. Braasch, I.; Brunet, F.; Volff, J.N.; Schartl, M. Pigmentation pathway evolution after whole-genome duplication in fish. Genome Biol. Evol. 2009, 1, 479–493. [Google Scholar] [CrossRef] [PubMed]
  5. Bagnara, J.T.; Matsumoto, J. Comparative anatomy and physiology of pigment cells in nonmammalian tissues. In The Pigmentary System: Physiology and Pathophysiology, 2nd ed.; Blackwell Publishing Ltd.: Hoboken, NJ, USA, 2007; pp. 11–59. [Google Scholar]
  6. Kelsh, R.N.; Brand, M.; Jiang, Y.J.; Heisenberg, C.P.; Lin, S.; Haffter, P.; Odenthal, J.; Mullins, M.C.; van Eeden, F.J.; Furutani-Seiki, M.; et al. Zebrafish pigmentation mutations and the processes of neural crest development. Development 1996, 123, 369–389. [Google Scholar] [PubMed]
  7. Lopes, S.S.; Yang, X.; Müller, J.; Carney, T.J.; McAdow, A.R.; Rauch, G.J.; Jacoby, A.S.; Hurst, L.D.; Delfino-Machín, M.; Haffter, P.; et al. Leukocyte tyrosine kinase functions in pigment cell development. PLoS Genet. 2008, 4, e1000026. [Google Scholar] [CrossRef] [PubMed]
  8. Parichy, D.M.; Mellgren, E.M.; Rawls, J.F.; Lopes, S.S.; Kelsh, R.N.; Johnson, S.L. Mutational analysis of endothelin receptor b1 (rose) during neural crest and pigment pattern development in the zebrafish Danio rerio. Dev. Biol. 2000, 227, 294–306. [Google Scholar] [CrossRef]
  9. Krauss, J.; Astrinides, P.; Frohnhöfer, H.G.; Walderich, B.; Nüsslein-Volhard, C. Transparent, a gene affecting stripe formation in zebrafish, encodes the mitochondrial protein mpv17 that is required for iridophore survival. Biol. Open 2013, 2, 703–710. [Google Scholar] [CrossRef]
  10. Hubbard, J.K.; Uy, J.A.C.; Hauber, M.E.; Hoekstra, H.E.; Safran, R.J. Vertebrate pigmentation: From underlying genes to adaptive function. Trends Genet. 2010, 26, 231–239. [Google Scholar] [CrossRef]
  11. Steingrímssonm, E.; Copeland, N.G.; Jenkins, N.A. Melanocytes and the microphthalmia transcription factor network. Annu. Rev. Genet. 2004, 38, 365–411. [Google Scholar] [CrossRef]
  12. Li, Y.N.; Zhao, B.L.; Wang, H.D.; Chen, T.Z.; Liu, Y.; Chang, L.C.; Dong, C.S. Effect of EDN3 on of sheep skin melanocytes with different coat colors in vitro. Sci. Agric. Sin. 2017, 50, 1139–1146. [Google Scholar]
  13. Li, H.; Fan, L.; Zhu, S.; Shin, M.K.; Lu, F.; Qu, J.; Hou, L. Epilation induces hair and skin pigmentation through an EDN3/EDNRB-dependent regenerative response of melanocyte stem cells. Sci. Rep. 2017, 7, 7272. [Google Scholar] [CrossRef] [PubMed]
  14. Kimura, T.; Takehana, Y.; Naruse, K. pnp4a is the causal gene of the medaka iridophore mutant guanineless. G3 2017, 7, 1357–1363. [Google Scholar] [CrossRef] [PubMed]
  15. Curran, K.; Lister, J.A.; Kunkel, G.R.; Prendergast, A.; Parichy, D.M.; Raible, D.W. Interplay between Foxd3 and Mitf regulates cell fate plasticity in the zebrafish neural crest. Dev. Biol. 2010, 344, 107–118. [Google Scholar] [CrossRef] [PubMed] [Green Version]
  16. Mo, Y.Y. MicroRNA regulatory networks and human disease. Cell. Mol. Life Sci. 2012, 69, 3529–3531. [Google Scholar] [CrossRef] [PubMed]
  17. Sand, M.; Gambichler, T.; Sand, D.; Skrygan, M.; Altmeyer, P.; Bechara, F.G. microRNAs and the skin: Tiny players in the body’s largest organ. J. Dermatol. Sci. 2009, 53, 169–175. [Google Scholar] [CrossRef] [PubMed]
  18. Yi, R.; Fuchs, E. microRNA-mediated control in the skin. Cell Death Differ. 2010, 17, 229–235. [Google Scholar] [CrossRef]
  19. Dong, C.; Wang, H.; Xue, L.; Dong, Y.; Yang, L.; Fan, R.; Yu, X.; Tian, X.; Ma, S.; Smith, G.W. Coat color determination by miR-137 mediated downregulation of microphthalmia-associated transcription factor in a mouse model. RNA 2012, 18, 1679–1686. [Google Scholar] [CrossRef]
  20. Kennell, J.A.; Cadigan, K.M.; Shakhmantsir, I.; Waldron, E.J. The microRNA miR-8 is a positive regulator of pigment ation and eclosion in Drosophila. Dev. Dyn. 2012, 241, 161–168. [Google Scholar] [CrossRef]
  21. Yan, B.; Liu, B.; Zhu, C.D.; Li, K.L.; Yue, L.J.; Zhao, J.L.; Gong, X.L.; Wang, C.H. microRNA regulation of skin pigmentation in fish. J. Cell Sci. 2013, 126, 3401–3408. [Google Scholar] [CrossRef] [Green Version]
  22. Hu, G.; Zou, G.; Liu, X.; Liang, H.; Li, Z.; Hu, S. The carp–goldfish nucleocytoplasmic hybrid has mitochondria from the carp as the nuclear donor species. Gene 2014, 536, 265–271. [Google Scholar] [CrossRef] [PubMed]
  23. Hafner, M.; Landgraf, P.; Ludwig, J.; Rice, A.; Ojo, T.; Lin, C.; Holoch, D.; Lim, C.; Tuschl, T. Identification of microRNAs and other small regulatory RNAs using cDNA library sequencing. Methods 2008, 44, 3–12. [Google Scholar] [CrossRef] [PubMed] [Green Version]
  24. Robinson, M.D.; McCarthy, D.J.; Smyth, G.K. edgeR: A Bioconductor package for differential expression analysis of digital gene expression data. Bioinformatics 2010, 26, 139–140. [Google Scholar] [CrossRef] [PubMed]
  25. Conesa, A.; Götz, S.; García-Gómez, J.M.; Terol, J.; Talón, M.; Robles, M. Blast2GO: A universal tool for annotation, visualization and analysis in functional genomics research. Bioinformatics 2005, 21, 3674–3676. [Google Scholar] [CrossRef] [PubMed]
  26. Ye, J.; Fang, L.; Zheng, H.; Zhang, Y.; Chen, J.; Zhang, Z.; Wang, J.; Li, S.; Li, R.; Bolund, L.; et al. WEGO: A web tool for plotting GO annotations. Nucleic Acids Res. 2006, 34, W293–W297. [Google Scholar] [CrossRef] [PubMed]
  27. Nawrocki, E.P.; Burge, S.W.; Bateman, A.; Daub, J.; Eberhardt, R.Y.; Eddy, S.R.; Floden, E.W.; Gardner, P.P.; Jones, T.A.; Tate, J.; et al. Rfam 12.0: Updates to the RNA families database. Nucleic Acids Res. 2015, 43, D130–D137. [Google Scholar] [CrossRef]
  28. Langmead, B.; Trapnell, C.; Pop, M.; Salzberg, S.L. Ultrafast and memory-efficient alignment of short DNA sequences to the human genome. Genome Biol. 2009, 10, R25. [Google Scholar] [CrossRef]
  29. Enright, A.J.; Bino, J.; Ulrike, G.; Thomas, T.; Chris, S.; Marks, D.S. MicroRNA targets in Drosophila. Genome Biol. 2003, 5, R1. [Google Scholar] [CrossRef]
  30. Shannon, P.; Markiel, A.; Ozier, O.; Baliga, N.S.; Wang, J.T.; Ramage, D.; Amin, N.; Schwikowski, B.; Ideker, T. Cytoscape: A software environment for integrated models of biomolecular interaction networks. Genome Res. 2003, 13, 2498–2504. [Google Scholar] [CrossRef]
  31. Xu, W.; Tong, G.X.; Geng, L.W.; Jiang, H.F. Body color development and genetic analysis of hybrid transparent crucian carp (Carassius auratus). Genet. Mol. Res. 2015, 14, 4399–4407. [Google Scholar] [CrossRef]
  32. Frohnhofer, H.G.; Krauss, J.; Maischein, H.M.; Nusslein-Volhard, C. Iridophores and their interactions with other chromatophores are required for stripe formation in zebrafish. Development 2013, 140, 2997–3007. [Google Scholar] [CrossRef] [Green Version]
  33. Wakamatsu, Y.; Pristyazhnyuk, S.; Kinoshita, M.; Tanaka, M.; Ozato, K. The see-through medaka: A fish model that is transparent throughout life. Proc. Natl. Acad. Sci. USA 2001, 98, 10046–10050. [Google Scholar] [CrossRef] [Green Version]
  34. Ohshima, A.; Morimura, N.; Matsumoto, C.; Hiraga, A.; Komine, R.; Kimura, T.; Naruse, K.; Fukamachi, S. Effects of body-color mutations on vitality: An attempt to establish easy-to-breed see-through medaka strains by outcrossing. G3 2013, 3, 1577–1585. [Google Scholar] [CrossRef]
  35. White, R.M.; Sessa, A.; Burke, C.; Bowman, T.; Leblanc, J.; Ceol, C.; Bourque, C.; Dovey, M.; Burns, G.E.; Zon, L.I. Transparent adult zebrafish as a tool for in vivo transplantation analysis. Cell Stem Cell 2008, 2, 183–189. [Google Scholar] [CrossRef]
  36. Takeo, M.; Lee, W.; Rabbani, P.; Sun, Q.; Hu, H.; Lim, C.H.; Manga, P.; Ito, M. EdnrB governs regenerative response of melanocyte stem cells by crosstalk with wnt signaling. Cell Rep. 2016, 15, 1291–1302. [Google Scholar] [CrossRef]
  37. Yin, Z.; Zhao, X.; Wang, Z.; Li, Z.; Bai, R.; Yang, S.; Zhao, M.; Pang, Q. Expression and Distribution of the Guanine Nucleotide-binding Protein Subunit α-s in Mice Skin Tissues and Its Association with White and Black Coat Colors. J. Anim. Sci. 2016, 29, 1392–1397. [Google Scholar] [CrossRef]
  38. Lee, A.Y. Recent progress in melasma pathogenesis. Pigment Cell Melanoma Res. 2015, 28, 648–660. [Google Scholar] [CrossRef]
  39. Raimo, M.; Orso, F.; Grassi, E.; Cimino, D.; Penna, E.; De Pittà, C.; Stadler, M.B.; Primo, L.; Calautti, E.; Quaglino, P.; et al. miR-146a Exerts Differential Effects on Melanoma Growth and Metastatization. Mol. Cancer Res. 2016, 14, 548–562. [Google Scholar] [CrossRef] [Green Version]
  40. Pu, W.; Shang, Y.; Shao, Q.; Yuan, X. miR-146a promotes cell migration and invasion in melanoma by directly targeting SMAD4. Oncl. Lett. 2018, 15, 7111–7117. [Google Scholar] [CrossRef]
  41. Aksenenko, M.; Palkina, N.; Komina, A.; Tashireva, L.; Ruksha, T. Differences in microRNA expression between melanoma and healthy adjacent skin. BMC Dermatol. 2019, 19, 1. [Google Scholar] [CrossRef]
  42. Hao, Y.; Zhou, Q.; Ma, J.; Wang, S. miR-146a is upregulated during retinal pigment epithelium (RPE)/choroid aging in mice and represses IL-6 and VEGF-A expression in RPE cells. J. Clin. Exp. Ophthalmol. 2016, 7, 562. [Google Scholar] [CrossRef]
  43. Zeng, H.F.; Yan, S.; Wu, S.F. MicroRNA-153-3p suppress cell proliferation and invasion by targeting SNAI1 in melanoma. Biochem. Biophys. Res. Commun. 2017, 487, 140–145. [Google Scholar] [CrossRef]
Figure 1. Genetic analysis of transparent trait. (A) The wild types (WTs) in the carp–goldfish nucleocytoplasmic hybrids (CyCa hybrids) were used as broodstocks for crossing to produce F1 generation. (B) After the F1 generation matured, the transparent mutants (TMs) in the F1 generation were used as parents for self-crossing to produce the F2 generation. (C) TMs in the F1 generation and WTs in the F0 generation were used as the male parent and female parent for back-crossing to produce the F2 generation, respectively. (D) TMs in the F1 generation and WTs in the F0 generation were used as the female parent and male parent for back-crossing to produce the F2 generation, respectively. When the phenotypes were easily distinguished, the number of WTs and TMs in the F1 and F2 generation were counted, respectively.
Genes 10 00704 g001
Figure 2. Microscopic observation of scales. (A) Scales of WT; (B) Scales of TM. a: sliver pigment; b: yellow pigment; c: melanin
Genes 10 00704 g002
Figure 3. Gene ontology (GO) enrichment analysis of DE genes between TM and WT. (A) Significantly enriched GO terms of up-regulated DE genes; (B) Significantly enriched GO terms of down-regulated DE genes.
Genes 10 00704 g003
Figure 4. Gene ontology (GO) enrichment analysis of target genes of two known DE miRNAs between TM and WT.
Genes 10 00704 g004
Figure 5. Gene ontology (GO) enrichment analysis of target genes of 195 novel DE miRNAs.
Genes 10 00704 g005
Figure 6. Kyoto Encyclopedia of Genes and Genomes (KEGG) pathway enrichment analysis of the target genes of differentially expressed miRNAs (DEMs). (A) Significantly enriched pathways of the target genes of known DEMs (TM vs. WT); (B) Significantly enriched pathways of the target genes of novel DEMs (TM vs. WT).
Genes 10 00704 g006
Figure 7. Interaction analysis of novel DE miRNAs and their target DE genes. (A) Interaction analysis of down-regulated novel DE miRNAs and their up-regulated target genes (TM vs. WT); (B) Interaction analysis of up-regulated novel DE miRNAs and their down-regulated target genes (TM vs. WT).
Genes 10 00704 g007
Table 1. Up-regulated differential expression (DE) genes in TM compared to WT.
Gene_IDFCp-ValueDescription
G_08350738.002.69 × 10−5galaxin-like
G_05143026.004.53 × 10−5zinc-binding protein A33-like; E3 ubiquitin-protein ligase TRIM39-like
G_00451524.605.79 × 10−5relaxin-3 receptor 1-like
G_01985919.762.18 × 10−4FAM217B-like; tubulin polyglutamylase TTLL9
G_02031218.002.29 × 10−3potassium voltage-gated channel subfamily V member 1-like
G_06616117.375.30 × 10−4Wilms tumor protein homolog
G_04820616.835.30 × 10−4PI-PLC X domain-containing protein 1-like
G_09091816.007.27 × 10−4germ cell-specific gene 1-like protein
G_07741415.877.27 × 10−4protein phosphatase 1L-like
G_01830515.727.27 × 10−4von Hippel-Lindau disease tumor suppressor-like; protein lifeguard 4-like
G_04696115.517.27 × 10−4interferon-induced very large GTPase 1-like
G_03170514.452.00 × 10−3histone acetyltransferase KAT7-like; protachykinin-like
G_03781114.434.81 × 10−4E3 ubiquitin-protein ligase RNF19B-like
G_07968413.106.97 × 10−7uncharacterized
G_03759013.009.91 × 10−5RLA class II histocompatibility antigen; MHC class II α chain
G_00798113.002.86 × 10−35-hydroxytryptamine receptor 3A-like
G_02588412.234.17 × 10−3uncharacterized
G_01482512.004.17 × 10−3SLAM family member 9-like
G_03938712.004.17 × 10−3RLA class I histocompatibility antigen; α chain 11/11-like
G_04189112.004.17 × 10−3immunoglobulin superfamily DCC subclass member 3-like
G_06711812.004.17 × 10−3oxidoreductase-like domain-containing protein 1
G_08020011.654.17 × 10−3proteinase-activated receptor 1-like
G_04147610.317.95 × 10−6epididymis-specific α-mannosidase-like
G_08839810.001.42 × 10−3HMG domain-containing protein 3-like
G_01678610.004.55 × 10−3transcription elongation regulator 1-like protein
G_0832678.803.12 × 10−3guanylate-binding protein 6-like
G_0734658.333.83 × 10−3guanine nucleotide-binding protein subunit α-14-like
G_0528388.004.73 × 10−3metastasis-associated protein MTA3-like
G_0457207.944.22 × 10−4WD40 repeat-containing protein SMU1-like
G_0758967.351.48 × 10−4FAM83H-like
G_0105556.711.62 × 10−3carcinoembryonic antigen-related cell adhesion molecule 3-like
G_0270656.631.38 × 10−3slit homolog 1 protein-like; slit guidance ligand 1 (slit1)
G_0438436.404.75 × 10−3uncharacterized
G_0641975.964.50 × 10−4amyloid protein-binding protein 2-like
G_0066295.574.64 × 10−3neutral α-glucosidase AB-like
G_0375895.574.64 × 10−3H-2 class II histocompatibility antigen; I-E β chain-like
G_0622405.224.51 × 10−3CCAAT/enhancer-binding protein β-like
G_0054975.203.99 × 10−3cholesterol 25-hydroxylase-like protein 2
G_0592475.023.22 × 10−3ras-related protein Rab-19-like
G_0363785.001.53 × 10−3microfibril-associated glycoprotein 4-like
G_0125434.913.22 × 10−3SLIT and NTRK like family member 4 (slitrk4),
G_0116574.902.75 × 10−3coiled-coil domain-containing protein 149-B-like
G_0017544.841.01 × 10−3sucrase-isomaltase; intestinal-like
G_0210864.721.59 × 10−3haptoglobin-like
G_0027594.511.22 × 10−3H-2 class II histocompatibility antigen; MHC class II antigen β chain
G_0863334.473.30 × 10−3dynein regulatory complex subunit 7; coiled-coil domain containing 135
G_0777304.461.75 × 10−3tripartite motif-containing protein 16-like
G_0162064.442.67 × 10−3guanylate-binding protein 1-like
G_0161034.391.05 × 10−3ladderlectin-like; galactose-specific lectin nattectin-like
G_0300624.371.06 × 10−3galactose-specific lectin nattectin-like; ladderlectin-like
G_0027374.234.28 × 10−3guanylate-binding protein 1-like
G_0897844.194.28 × 10−3uncharacterized
G_0124834.082.30 × 10−3uncharacterized; zinc finger MYM-type protein 1-like
G_0095804.022.73 × 10−3centriole, cilia and spindle-associated protein-like
G_0397023.743.28 × 10−3insulin-like growth factor-binding protein 1
G_0461833.644.95 × 10−3titin-like; SLAM family member 5-like
G_0300933.554.29 × 10−3histidine-rich glycoprotein-like; antihemorrhagic factor cHLP-B-like
FC: fold change.
Table 2. Down-regulated DE genes in TM compared to WT.
Gene_IDFCp-ValueDescription
G_066699364.961.62 × 10−14hemoglobin subunit α-like
G_048410351.728.64 × 10−1740S ribosomal protein S26
G_029206300.971.82 × 10−17hemoglobin subunit α-like
G_011161289.548.18 × 10−16hemoglobin subunit β-like
G_051354172.251.93 × 10−11epididymis-specific α-mannosidase-like
G_068758138.761.29 × 10−10toll-like receptor 12
G_029207111.891.34 × 10−13β-globin
G_02235553.027.49 × 10−9epithelial cell adhesion molecule-like (EP-CAM)
G_07210752.994.66 × 10−7uncharacterized
G_05751949.028.76 × 10−7NACHT, LRR and PYD domains-containing protein 3-like (NLRP3)
G_02589643.652.05 × 10−6storkhead box 2 (stox2)
G_03122337.925.19 × 10−6sterile α motif domain-containing protein 3-like (SAMD3) Smad3
G_07077036.005.69 × 10−5titin-like
G_02799335.585.69 × 10−5carcinoembryonic antigen-related cell adhesion molecule 1
G_06567632.172.15 × 10−7nectin-1-like
G_04745232.001.27 × 10−4SLAM family member 9-like
G_07757932.001.27 × 10−4parathyroid hormone/parathyroid hormone-related peptide receptor-like
G_07706130.672.25 × 10−5mucin-17-like; microtubule-associated protein 1B-like; melanoma 1 protein
G_07398630.002.82 × 10−5tetraspanin-9-like
G_01275430.001.95 × 10−4uncharacterized
G_01884729.507.49 × 10−6trypsin-1-like
G_09066329.323.57 × 10−5protein NLRC3-like (NOD-like receptors, NLRs)
G_08911828.004.53 × 10−5sterile α motif domain-containing protein 3-like
G_08632426.705.79 × 10−5Palmitoyl transferase ZDHHC18-like
G_06015226.007.45 × 10−5Gig2-like protein CauA
G_05316226.004.88 × 10−4serine/threonine-protein kinase mTOR-like
G_04207825.009.64 × 10−5uncharacterized
G_09165825.006.22 × 10−4PDZ domain-containing protein 2-like
G_00483624.674.77 × 10−6NACHT, LRR and PYD domains-containing protein 1-like. (NLRP1)
G_02026024.311.26 × 10−4U6 snRNA-associated Sm-like protein LSm7
G_04065023.461.65 × 10−4protein NLRC3-like; NACHT, LRR and PYD domains-containing protein 3
G_00272223.321.65 × 10−4prelamin A recognition factor like
G_02899623.001.03 × 10−3low-density lipoprotein receptor-related protein 2-like
G_09101222.505.78 × 10−5uncharacterized
G_03255021.752.18 × 10−42’,5’-phosphodiesterase 12-like (PDE12)
G_02470121.303.04 × 10−3protein NLRC3-like; NACHT, LRR and PYD domains-containing protein 3
G_04266520.944.20 × 10−5uncharacterized; E3 ubiquitin-protein ligase CBL-like
G_06814420.002.29 × 10−3cyclic AMP-responsive element-binding protein 5-like
G_07758320.002.29 × 10−3trophoblast glycoprotein-like
G_08358720.002.29 × 10−3laminin subunit α-5-like
G_06832319.793.91 × 10−4receptor-type tyrosine-protein phosphatase F-like
G_00153219.643.91 × 10-04class A basic helix-loop-helix protein 15
G_03153719.583.91 × 10−4presenilins-associated rhomboid-like protein
G_05993719.345.30 × 10−4suppressor of cytokine signaling 5-like
G_05888219.043.04 × 10−3mitogen-activated protein kinase 8; JNK1 (JNK1)
G_03545719.005.30 × 10−4Chymotrypsinogen B-like
G_03755419.003.04 × 10−3protocadherin-16-like
G_03940419.003.04 × 10−3collagen α-1(XXI) chain-like
G_06885619.003.04 × 10−3anoctamin-5-like
G_08922918.815.30 × 10−4gastrula zinc finger protein XlCGF57.1-like
G_07137318.004.07 × 10−3γ-adducin-like; adducin 3 (add3)
G_07540518.004.07 × 10−3tektin 2 (tekt2)
G_08106918.004.07 × 10−3oogenesis-related gene (org)
G_01533817.934.07 × 10−3SLAM family member 7-like; CD48 antigen-like
G_05043817.857.27 × 10−4nuclear export mediator factor (nemf)
G_05293017.773.36 × 10−4SE-cephalotoxin-like
G_06571717.527.97 × 10−4voltage-dependent L-type calcium channel subunit α-1C-like
G_09145317.001.01 × 10−3sodium/calcium exchanger 2-like
G_00787116.231.92 × 10−4rho GTPase-activating protein 17-like
G_07947216.061.41 × 10−3chromodomain-helicase-DNA-binding protein 6-like
Table 3. Kyoto Encyclopedia of Genes and Genomes (KEGG) classification of DE genes between TM and WT.
KEGG PathwaySecondary PathwayNumber
Cellular ProcessesCell growth and death786
Cellular ProcessesCell motility219
Cellular ProcessesCellular community422
Cellular ProcessesTransport and catabolism1131
Environmental Information ProcessingMembrane transport68
Environmental Information ProcessingSignal transduction1759
Environmental Information ProcessingSignaling molecules and interaction74
Genetic Information ProcessingFolding, sorting and degradation948
Genetic Information ProcessingReplication and repair235
Genetic Information ProcessingTranscription403
Genetic Information ProcessingTranslation837
MetabolismAmino acid metabolism389
MetabolismBiosynthesis of secondary metabolites92
MetabolismCarbohydrate metabolism626
MetabolismEnergy metabolism293
MetabolismGlycan biosynthesis and metabolism326
MetabolismLipid metabolism545
MetabolismMetabolism of cofactors and vitamins222
MetabolismMetabolism of other amino acids209
MetabolismMetabolism of terpenoids and polyketides73
MetabolismNucleotide metabolism361
MetabolismOverview357
MetabolismXenobiotics biodegradation147
Organismal SystemsAging402
Organismal SystemsCirculatory system343
Organismal SystemsDevelopment210
Organismal SystemsDigestive system599
Organismal SystemsEndocrine system1063
Organismal SystemsEnvironmental adaptation430
Organismal SystemsExcretory system187
Organismal SystemsImmune system582
Organismal SystemsNervous system683
Organismal SystemsSensory system204
Table 4. KEGG analysis of DE genes (TM/WT).
Pathwayp-ValueGene NumberGene_IDRegulationDescription
Other glycan degradation0.0022G_051354Upepididymis-specific α-mannosidase
G_041476Downepididymis-specific α-mannosidase
Antigen processing and presentation0.0102G_014100Upγ-interferon-inducible lysosomal thiol reductase
G_065294Uplegumain
MicroRNAs in cancer0.0452G_053162Upserine/threonine-protein kinase mTOR
G_043688UpDNA (cytosine-5)-methyltransferase 3A
Regulation of mitophagy-yeast0.0482G_053162Upserine/threonine-protein kinase mTOR
G_087121Updynamin-2
Table 5. Interaction analysis of miR-146a and its target DE genes.
miRNA_IDmiRNA RegulationTarget Gene IDGene RegulationUniProt KB-ACGene Name
miR-146aUpG_010841DownQ3V5L5MGAT5B
miR-146aUpG_019763DownP55918MFAP4
miR-146aUpG_053967DownP25291GP2
miR-146aUpG_058480DownP51112htt
miR-146aUpG_061471DownO54951Sema6b
miR-146aUpG_084436DownA2AAJ9Obscn
Table 6. Comparison of relative qPCR results with RNA-Seq results.
Gene IDGene NameFCWT/TM (RNA-Seq)FCWT/TM (qPCR)
β-actinGapdh
G_039032endothelin receptor type B (EDNRB)9.5561.7811.843
G_026459up-regulator of cell proliferation (URGCP)9.5717.8768.424
G_045698purine nucleoside phosphorylase 4a (PNP4a)12.4006.7196.476
G_059817A kinase anchor protein 12a (AKAP12a)8.3822.2482.494
G_049977purine nucleoside phosphorylase 5a (PNP5a)12.0332.9443.691
G_058087GTPase IMAP family member 8 (GIMAP8)9.6742.8922.833
Gene IDGene NameFCTM/WT (RNA-Seq)FCTM/WT (qPCR)
β-actinGapdh
G_064197amyloid protein-binding protein 2 (APBA2)5.9621.6792.352
G_030062galactose-specific lectin nattectin (GSLN)4.36710.4098.041
G_030093histidine-rich glycoprotein (HRG)3.5471.6132.614
G_073465guanine nucleotide-binding protein subunit α-14 (GNA14)8.3338.7737.813
G_002737guanylate-binding protein 1 (GBP1)4.2322.6783.745

