Article

Potassium Transporter LrKUP8 Is Essential for K+ Preservation in Lycium ruthenicum, A Salt-Resistant Desert Shrub

1
College of Biological Sciences and technology, Beijing Forestry University, 35 Qinghua East Road, Beijing 100083, China
2
National Engineering Laboratory for Tree Breeding, Beijing Forestry University, 35 Qinghua East Road, Beijing 100083, China
*
Author to whom correspondence should be addressed.
Genes 2019, 10(8), 600; https://doi.org/10.3390/genes10080600
Submission received: 24 June 2019 / Revised: 29 July 2019 / Accepted: 7 August 2019 / Published: 9 August 2019
(This article belongs to the Special Issue Abiotic Stress in Plants: Current Challenges and Perspectives)

Abstract

:
Salt stress is a major constraint for many crops and trees. A wild species of Goji named Lycium ruthenicum is an important economic halophyte in China and has an extremely high tolerance to salinity. L. ruthenicum grows in saline soil and is known as a potash-rich species. However, its salt adaptation strategies and ion balance mechanism remains poorly understood. Potassium (K+) is one of the essential macronutrients for plant growth and development. In this study, a putative salt stress-responsive gene encoding a HAK (high-affinity K+)/KUP (K+ uptake)/KT (K+ transporter) transporter was cloned and designated as LrKUP8. This gene belongs to the cluster II group of the KT/HAK/KUP family. The expression of LrKUP8 was strongly induced under high NaCl concentrations. The OE-LrKUP8 calli grew significantly better than the vector control calli under salt stress conditions. Further estimation by ion content and micro-electrode ion flux indicated a relative weaker K+ efflux in the OE-LrKUP8 calli than in the control. Thus, a key gene involved in K+ uptake under salt condition was functionally characterized using a newly established L. ruthenicum callus transformation system. The importance of K+ regulation in L. ruthenicum under salt tolerance was highlighted.

Graphical Abstract

1. Introduction

Soil salinization is a severe global environmental stress that limits the growth and development of trees and crops. Over 800 million hectares of the world’s arable land is adversely affected by salinity [1]. Halophytes are plants that tolerate high salt concentrations that kill 99% of other species [2]. These plants can complete an entire life cycle in a salt concentration of at least 200 mM NaCl, either in controlled conditions or the natural environment [3]. Halophytes draw considerable attention [4,5,6], and many studies focused on the ability of maintaining an optimal K+/Na+ ratio in the cytosol [7,8,9,10].
K+ and Na+ have similar chemical properties and content ratio in non-saline soils [11]. K+ is an essential nutrient required for plant growth and development, and plays important roles in protein synthesis and the maintenance of cytoplasmic pH and transmembrane voltage gradients [12]. Low Na+ and high K+ in the cytoplasm are important in upholding several enzymatic processes [13]. An extremely high Na+ as a toxic ion in salinized soil results in ion-induced injury of plant cells. Thus, precisely controlling Na+/K+ selective accumulation is needed to maintain cellular cation homeostasis [14].
For K+ acquisition and distribution, plants have two K+ transport systems: K+ channels and K+ transporters [15]. The four families of K+ transport systems are shaker channels, K+ channel outward-rectifier (KCO) channels, high-affinity K+ transporter (HKT) transporters, and KT/KUP/HAK transporters [11,16]. Genes from the KT/KUP/HAK family can be divided into four clusters (I–IV) [17,18]. Previous studies on Arabidopsis thaliana identified AtHAK5, a high-affinity K+ transporter, as the major contributor to K+ uptake from low-K+ solutions under saline conditions [19,20]. Many genes in cluster I were studied, and all these transporters can mediate high-affinity K uptake [21,22]. Cluster II members of KT/KUP/HAK have greatly diverse functions [23]. AtKUP1 mediates high-and low-affinity K uptake [24]. OsHAK2 exhibits higher Na than K transport activities [21]. Arabidopsis kup4 mutant results in tiny root hairs due to impaired auxin transport, whereas kup2 mutant decreases the cell expansion in the shoot [25,26]. All these studies indicated that KT/KUP/HAK transporters play important roles in K+ acquisition, redistribution, and homeostasis. However, the physiological functions in terms of K acquisition under salt stresses focused only on several genes that are mainly from model plants. Many individual members of KT/KUP/HAK transporters are not yet characterized in plants, especially in halophytes.
L. ruthenicum is a wild Goji species that recently attracted attention due to its nutritional and medical values [27]. This plant is described in the Tibetan medical classics Jing Zhu Ben Cao and Si Bu Yi Dian as a treatment for heart disease, abnormal menstruation, and menopause [28]. Studies on this species focused on determining its active pharmaceutical ingredients and the pharmacological activities of its chemical composition, extracting its active constituents, and developing seedling-breeding techniques [29,30,31,32]. L. ruthenicum exhibits extremely high salt tolerance [33], which can alleviate the degree of soil salinity–alkalinity and is crucial for the restoration of desert ecosystems [27,34]. However, the mechanisms for maintaining K+/Na+ homeostasis in L. ruthenicum are still unknown.
Here, we identified a K+ transporter from L. ruthenicum according to our transcriptomic data screening. This K+ transporter belongs to cluster II of the KT/KUP/HAK family. Functional properties and the expression pattern of this gene suggest its involvement in salt stress response. We studied its ion accumulation mechanism that elicits salt resistance by using a callus system. This work helps elucidate the factors underlying L. ruthenicum survival in saline areas and the maintenance of a high K content in highly saline soil.

2. Materials and Methods

2.1. Plant Material for Ion Content Analysis

L. ruthenicum is an economic shrub widely distributed in the northwest arid region of China. During our survey in the Qinghai, Xinjiang Provinces, and Inner Mongolia, we found that L. ruthenicum could grow with Na+ from 100 mM to 450 mM during control experiments or in natural conditions. From 21 May 2014, we planted 30 L. ruthenicum in pots of 60-cm diameter in Qinghai Province and divided the plants into four groups. Natural soil with less than 150 mM (90–122 mM) Na+ was first used in planting. On 10 July 2015, 20 pots with similar growth status were selected. A salt control experiment was then performed using 200 mM NaCl solution until the soil Na+ reached 200, 300, or 400 mM with errors of approximately 40 mM. At different soil salinity gradients, we analyzed the contents of K+ in specific tissues of these L. ruthenicum shrubs on 25 August 2017. The trees grown in natural soil were used as controls.

2.2. Determination of Na+ and K+ Contents

Dry weights (DWs) of the samples were determined after drying at 80 °C for 72 h in an oven. The dried samples were then powdered in mortars. Before the Na+ and K+ concentrations were confirmed, the powdered samples were dissolved by adding 5 mL of concentrated sulfuric acid and 2 mL of 30% H2O2 on an anti-boiling furnace at 350 °C until the liquid became colorless. An atomic absorption spectrophotometer was used to measure the Na+ and K+ contents [35]. Three replicate measurements were carried out per treatment.

2.3. Callus Induction, Selection, and Maintenance

Wild L. ruthenicum seeds were collected from Shaya country town of Xinjiang Province, China in August 2016. The seeds were washed with sodium hypochlorite and distilled water and then germinated in petri plates for five days. Bibulous paper saturated with sterile water was required in the petri plates, which were placed in a dark environment at 25 °C. After leaf emergence, the seedlings were cultured in a Murashige and Skoog (MS) medium with a pH of 6.0. Embryogenic calli initiated from leaves were grown on MS and vitamins supplemented with 30 g·L−1 sucrose, 0.6 g·L−1 6-benzylaminopurine (6-BA), and 0.4 g·L−1 2,4-dichlorophenoxyacetic acid (2,4-D), solidified with 7 g·L−1 agar.
As L. ruthenicum is a self-incompatible open-pollinated species, calli formed on individual seedlings were maintained as independent genotypic lines. Then, 0.5 g of loose and fragile light-yellow embryogenic calli from leaves of each genotypic line were selected and inoculated into the above subculture medium. The fresh embryogenic calli were weighed after being cultured for 30 days and temperature of 28 °C in the dark. The regeneration ability of the calli from each line was calculated as follows: (total fresh weight − initial fresh weight)/initial fresh weight. After the cell line with the highest regeneration ability was selected, the callus induction and subculture were performed every four weeks at 28 °C in the dark to maintain the cell line.

2.4. Isolation of Putative Key Genes Responsible for K+ /Na+ Homeostasis

By screening our previous RNA-sequencing data (No. SRP059046 of the SRA database) [36], we found a potassium transporter that was highly expressed after salt treatment. Its full length was amplified from young L. ruthenicum seedlings by a PCR method with specific primers (Table S1, Supplementary Materials). After sequencing, the transporter was designated as K+ uptake permease 8 (LrKUP8). The protein sequences encoded by the LrKUP8 and their homologous genes were obstained from Oryza sativa, A. thaliana, and Populus were obtained from the NCBI (http://www.ncbi.nlm.nih.gov/), TAIR (https://www.arabidopsis.org/), and Phytozome (https://phytozome.jgi.doe.gov/pz/portal.html) databases. The sequence alignment was used the DNAMAN 6.0 program, by which the identical and similar base could be easily identified from the output file. Phylogenetic analyses were completed using the MEGA 5.1 program with 1000 bootstrap replicates after aligning sequences with ClustalW (opening = 10, extension = 0.2).

2.5. Subcellular Localization of LrKUP8

For subcellular localization, the complete open reading frame (ORF) of LrKUP8 was amplified via PCR and inserted into a vector pBI121 to generate a fusion construct (35S:LrKUP8-GFP). The fusion construct and the control vector were transiently transfected into epidermal cells of Nicotiana Benthamiana according to the method of Voinnet et al. [37]. The transformed cells were subsequently observed by laser confocal fluorescence microscopy via a Leica TCS SP8 instrument (Weztlar, Germany).

2.6. Gene Expression Analysis by Quantitative Real-Time PCR

Quantitative real-time PCR (qRT-PCR) analysis was used to study tissue specific expression patterns and salt stress-inducing patterns. Total RNA was extracted using the cetyltrimethylammonium bromide method [38]. For tissue-specific analysis, three-year-old L. ruthenicum trees were used. Total RNA was extracted from the tissues of the root, shoot, and new and old leaves. For salt-inducible analysis, we extracted total RNA from 300 mM and 400 mM NaCl-treated calli according to a time-course of 1, 3, 6, and 12 h, and non-salt treated calli were used as the control. We tested RNA integrity and quality by gel electrophoresis and by measuring 260/230 and 260/280 absorbance ratios with a NanoDrop 2000 Spectrophotometer (Thermo Fisher Scientific, Waltham, MA, USA). According to the instruction book of the producer (Qiagen, Duesseldorf, Germany), 2 μg of total RNA was used for the reverse-transcription reaction with a Tiangen FastQuant RT Kit (with gDNase, TIANGEN Biotech Co., Beijing, China). All qRT-PCR reactions were completed using ABI SYBR Green PCR Master Mix (Applied Biosystems, Waltham, MA, USA). Relative expression ratios were normalized to the housekeeping gene Actin1 [39]. All primers used are listed in Table S1 (Supplementary Materials). Details of the qRT-PCR are as follows: 2 μg of total RNA was reverse-transcribed with SuperScriptII (Invitrogen, Carlsbad, CA, USA) using Oligo (dT) primers (Invitrogen) in a total volume of 25 μL. The reverse-transcription product was then diluted with 25 μL of sterilized water to a final volume of 50 μL. Then, 1 μL of the diluted solution was used as the template in the qRT-PCR experiments. 20 µL reaction system contained 10 µL SYBR Premix ExTaq, 0.02 µL ROX reference dye, 0.4 µL forward primer, 0.4 µL reverse primer, 1 µL diluted cDNA and 8.18 µL ddH2O. The thermal cycle program used was as follows: 94 °C for 20 s, 40 cycles at 94 °C for 20 s, 60 °C for 20 s and 72 °C for 30 s. The melt curve was produced between 60 °C and 95 °C with an increments of 0.5 °C every 5 s. The relative expression of LrKUP8 in different tissues was analyzed using the 2−ΔCT method and the real-time PCR data under salt treatments were analyzed using the 2−ΔΔCT method [40].

2.7. Agrobacterium-Mediated Transformation of L. ruthenicum Calli

We inserted the pBI121-LrKUP8-GFP recombinant vector into A. tumefaciens strain GV3101. The Agrobacterium strains were stored on a yeast extract peptone (YEP) medium with 50 mg·L−1 kanamycin sulfate and 50 mg·L−1 gentamicin. The culture was incubated overnight at 28 °C until the optical density (OD)600 reached 0.6–0.8. Then, 200 μL of Agrobacterium cells were re-cultured in 200 mL of liquid YEP medium under the same conditions. There were no selective antibiotics in this liquid YEP medium. When the OD600 reached 0.5, the liquids were used to transform callus cells. The cells were firstly co-cultured on solid MS medium without antibiotics in darkness at 24 °C for 72 h and then transferred to a screening medium supplemented with 50 mg·L−1 kanamycin and 300 mg·L−1 cefalothin sodium. The selection period lasted for approximately 30 days. Transgenic callus cells were selected and subcultured every four weeks on a screening medium. For validation of gene presence, total DNA was extracted from putative transgenic calli, the wild-type control, and the vector control. All DNA samples were subjected to PCR using the PCR Kit (TIANGEN, China) with primer sets to amplify the NptII, GFP, and LrKUP8-GFP genes. Table S1 (Supplementary Materials) provides a list of primers used.

2.8. Observation of GFP Fluorescence

The transformed callus was placed in a screening medium and cultured for 20 days under dark conditions before this experiment. Before imaging, the calli were selected from the solid plates and placed in 1/2 MS liquid medium to obtain the relatively dispersed callus cell. GFP imaging was achieved with a Leica SP8 confocal laser scanning microscope (Leica, Weztlar, Germany). Fluorescent protein measurements were conducted with excitation at 488 nm and emission at 525 ± 25 nm for GFP. The image of bright field channel was also acquired as a background.

2.9. Determination of Callus Growth under Salt Stress

To test the performance of LrKUP8, the pBI121-GFP control and LrKUP8 overexpressing calli (OE-LrKUP8, fresh weight < 0.1 g) were shifted to an MS medium with 0, 100, 200, and 300 mM NaCl with 50 mM kanamycin. After 50 days, calli from the four culture dishes were observed and the fresh weight was determined. The treatment was performed three times.

2.10. Ion Contents

At 50 days after the calli were transferred to the 300 mM salinized culture medium, the DWs of the separated calli were determined after drying at 80 °C for 72 h in an oven to a constant weight. The Na+ and K+ contents were measured using the method described above.

2.11. Ion Flux

We measured net fluxes of K+ by a non-invasive micro-test technique (NMT, BIO-001A, Younger USA Sci. & Tech. Corp., Amherst, MA, USA) at Xuyue Science and Technology Co., Ltd., Beijing, China [41]. The non-invasive micro-test technique originated from the Woods Hole Marine Biological Laboratory in the United States. In 1995, the Woods Hole Institute firstly modified the vibration probe device to make it capable of ion current [42]. Before use, the calli were grown for 12 h in two types of callus regeneration medium with or without 300 mM NaCl. The samples were rinsed with redistilled water to decrease the effect of salt release on flux recording. The K+ ion-selective microelectrodes with an external tip diameter of 2–4 μm was pulled from 1.5 mm diameter glass capillaries (TW150-4; World Precision Instruments, Inc., Sarasota, FL) with an electrode puller (P-97; Sutter Instrument Co., Novato, CA). After 10 min of equilibration in a measuring solution (0.5 mM KCl, 0.5 mM NaCl, 0.1mM MgCl2, 0.2 mM CaCl2, and 2.5% sucrose; pH was adjusted to 5.7 with HCl and KOH), we continuously recorded the steady-state fluxes of K+ for 10–15 min. Ion fluxes were measured along the callus cell. The software of imFluxes V2.0 (YoungerUSA LLC, Amherst, MA 01002, USA), which is capable of integrating voltage signal, motion control, and image capture simultaneously was used. The net K+ fluxes were then calculated using the Mage Flux software developed by Xuyue (http://xuyue.net/mageflux).

2.12. Statistical Analysis

The results of growth indexes and net ion fluxes were examined by one-way ANOVA using SPSS21. Significant differences between mean values were determined through Duncan’s multiple-range tests; otherwise, a Student’s t-test was indicated. When p < 0.05, the differences were considered statistically significant.

3. Results

3.1. K+ Distribution under Normal and Salinized Conditions

K+ contents in different tissues were analyzed using three-year-old L. ruthenicum trees growing under different salinized conditions. The K+ content in the different tissues of L. ruthenicum significantly varied. In general, the K+ contents in leaf and fruit were significantly higher (p < 0.05) than those in the root and stem, and the K+ content in leaf was significantly higher than that in fruit (Figure 1). The K+ content of trees did not show significant differences between mildly salinized soils and natural soils (which used as a control), indicating that the small increase of salinity did not affect the K+ content. The K+ contents of the root in moderate soils (about 300 mM NaCl) were significantly higher than those in mildly (about 200 mM NaCl) and severely salinized (about 400 mM NaCl) soils. The opposite results occurred in the stem, where the K+ contents in moderately salinized soil were significantly lower than those in mildly and severely salinized soil. The K+ content in leaves and fruits significantly increased with salinization, thereby indicating that the edible parts of L. ruthenicum could enrich K ions under high salinization conditions.

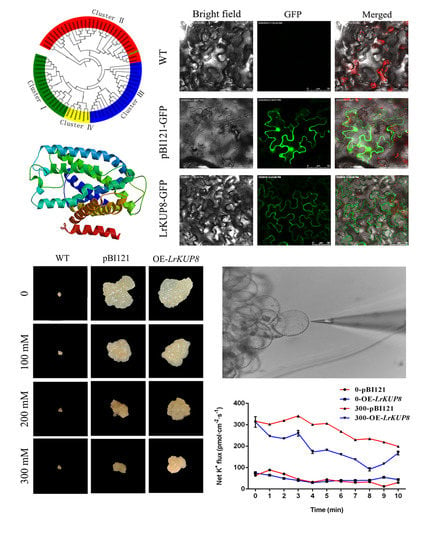
3.2. Cloning, Protein Sequence Alignment, and Phylogenetic Analysis of LrKUP8

According to our previous transcriptome of L. ruthenicum, a highly salt-induced gene annotated as a K transporter was isolated from salt-treated calli. The presence of a typical “K_trans” domain (Pfam Profile PF02705) indicates that the isolated gene encodes a putative HAK transporter family member (Figure 2a). The three-dimensional (3D) structure of LrKUP8 suggests that it contains 15 strong transmembrane helices and the typical characteristics of a membrane protein (Figure 2b). BLAST searches against the TAIR database revealed that the deduced amino-acid sequence of this protein is highly similar to that of high-affinity KUP8-like K transporters from Arabidopsis. Thus, this gene was designated as LrKUP8. Phylogenetic analyses of LrKUP8 and the KUP family members from Arabidopsis, rice, and poplar showed that LrKUP8 is homologous to NrHAK1, NtHAK1, and AtKUP8, and belongs to subgroup II of the KUP family (Figure 2c). These four homologous genes were not characterized.

3.3. The Subcellular Localization and Expression Pattern of LrKUP8

To test the subcellular localization of LrKUP8, we constructed LrKUP8–GFP fusions driven by the Cauliflower mosaic virus 35S promoter and transiently expressed it into tobacco epidermal cells. The cells transformed with the pBI121::GFP vector were used as controls, and GFP fluorescence was observed mainly in the cytoplasm and nucleus (Figure 3a). The green fluorescence of LrKUP8–GFP was confined to the plasma membrane (PM), thereby indicating that LrKUP8 is mainly targeted to the PM. The subcellular localization result also suggests the potential transport activity of LrKUP8. Ion transporters are often differentially expressed in old and new tissues. Thus, we analyzed the tissue-specific expression of LrKUP8 by qRT-PCR using a panel of four organ/tissue types from three independent three-year-old L. ruthenicum trees. LrKUP8 was expressed ubiquitously in four testing tissues, including new and old leaves and new and old stems. A significantly higher expression level of LrKUP8 was observed in the new leaves compared with other tissue types (Figure 3b). According to a preparatory experiment for salt resistance of calli, 300 mM NaCl could be used as a threshold for callus salt treatment. Thus, we examined the gene expression level of LrKUP8 in 300 mM or higher (400 mM) NaCl treated calli. As a result, the relative expression levels of LrKUP8 in calli under 300 mM NaCl were stable during the first 6 h but increased dramatically at 12 h. When the NaCl concentration increased to 400 mM, LrKUP8 expression was induced immediately and continually increased until 12 h (Figure 3c). The expression level of LrKUP8 under 400 mM NaCl treatment was higher than that under 300 mM NaCl treatment at the specific time point. Our results indicated LrKUP8 expression could be induced by exposure to salt stress, especially to high salt stress.

3.4. Overexpression of LrKUP8 Improved Callus Salt Tolerance

Expression analysis indicated that LrKUP8 is strongly induced by salt, and its protein is targeted to the PM. Thus, LrKUP8 might be involved in ion acquisition under salt treatment. Calli were transformed with the pBI121–LrKUP–GFP recombinant vector to study whether LrKUP8 regulates salt tolerance, and the pBI121–GFP vector was used as the control (Figure 4a). After screening from a medium with kanamycin, NPTII, LrKUP8-GFP, and GFP were examined by PCR amplifications to guarantee the genome presence of LrKUP8 (Figure S1, Supplementary Materials). Before the transgenic lines were re-cultured for salt treatment, GFP imaging was also performed to ensure the expression of LrKUP8–GFP protein. As expected, the GFP signal was absent in wide type calli but was observed mainly in cytoplasm and nucleus in the empty vector control (Figure 4). Comparatively, LrKUP8-GFP fluorescence was predominantly localized at the membrane system (Figure 4b), indicating that LrKUP8 expressed normally in transgenic calli. The kanamycin was always used to ensure that all or most of the transgenic callus cells were positive cell clones. In the absence of salinity stress conditions, the vector control and LrKUP8 overexpressing calli exhibited similar growth rates. The differences appeared at 100 mM NaCl and became highly pronounced at 200 mM NaCl. The 300 mM NaCl treatment considerably delayed the growth of all studied calli (Figure 4c). However, the growth of OE-LrKUP8 calli under the 300 mM NaCl treatment was better than that of the control calli because the vector control calli almost stopped growing, whereas the transgenic calli continually grew. The wild-type callus cells could not grow because they were not resistant to the aminoglycoside antibiotic kanamycin. The fresh weight analysis also indicated that when the NaCl concentration was 200 mM or higher, the OE-LrKUP8 calli grew considerably faster than the vector control calli (Figure 4d). Therefore, our results indicate that the overexpression of LrKUP8 improves callus salt tolerance, especially at a high NaCl level.

3.5. LrKUP8 Functions in K+/Na+ Homeostasis through K Accumulation under Salt Stress Condition

We tested the K+ and Na+ concentrations of OE-LrKUP8 and vector control calli before and after salt treatment. The 300 mM NaCl treatment for 50 days substantially decreased the K+ content but increased the Na+ content in both control and transgenic calli. The K+ content decreased by 61.7% after salt treatment in the vector control and by 17.1% in OE-LrKUP8 calli (Figure 5a). Thus, the K+ content in OE-LrKUP8 was significantly higher than that of vector control after 50 days of growth under high salt conditions. The Na+ content increased to 5.5 and 3.92 times after salt treatment in the vector control and OE-LrKUP8 calli, respectively (Figure 5b). As a result, K+/Na+ ratios in the control and transgenic calli were significantly reduced after salt stress. The OE-LrKUP8 calli showed a higher K+/Na+ ratio compared with the vector control (Figure 5c), suggesting that this ratio is affected by the K+ translocation because of LrKUP8 overexpression. Different types of calli grown with or without NaCl treatment were used for K+ flux assessments. The glass electrode (2–4 μm aperture), which was filled with liquid electrolyte, was placed at an appropriate distance apart from the calli cell (Figure 5d). All the tested calli exhibited minimal K+ efflux in the absence of NaCl stress, and no statistical difference occurred between the two kinds of calli (Figure 5e). We then measured the K+ flux responses under 300 mM NaCl conditions. After 12 h of salt treatment, we detected a steady K+ efflux in the control and transgenic calli. The efflux rate under salt stress was considerably larger than that in untreated experiments (Figure 5e). Furthermore, the rate of K+ efflux in the vector control was remarkably higher than that in transgenic callus lines (Figure 5f).
The use of a transgene is the most commonly applied method for analyzing gene function, but stable genetic transformation approaches are difficult to achieve for certain plants [43]. L. ruthenicum is a rare medicinal-and alimental-use species with high saline resistance. Numerous salt response genes were screened from L. ruthenicum via the RNA-sequencing method. However, few genes were characterized because of the difficulties or long period required for the genetic transformation of this species. L. ruthenicum is a self-incompatible outcrossing species. Hence, all genotypes of cultivars are highly heterozygous. Different genotypes within a cultivar affect the transformation efficiency and potentially the characteristics of transgenic plants. With the increasing interest in breeding and gene mining of L. ruthenicum, novel transformation method was developed [44]. These techniques differ in the explant source and procedure and facilitate the studies on L. ruthenicum, but they still require refinement to improve efficiency. In the present study, embryogenic calli were induced from L. ruthenicum leaves, and genetic transformation was conducted by the Agrobacterium-mediated method. DNA examination and GFP imaging showed that transgenic calli were obtained successfully. Using L. ruthenicum calli, numerous transgenic plants carrying multiple genes of interest could be produced after rapid characterization.
The accumulation of Na+ usually reduces K+/Na+ homeostasis in the cytosol because Na+ can compete with K+ for binding sites at the plasma membrane [8,45,46]. The efflux of Na+ or the uptake of K+ is the main strategy used by plants to maintain the K+/Na+ ratio [47,48,49,50]. Many studies have shown that the ratio of K+/Na+ in cells determines the metabolic capacity of cells, rather than the absolute content of Na+ or K+ [51,52]. In this study, a putative salt-responsive K+ transporter designated as LrKUP8 was cloned and characterized. Our phylogenetic analyses indicated that LrKUP8 belongs to the cluster II group of the KT/KUP/HAK family. The KUP/HAK/KT family is the earliest, most abundant, and most functional family of potassium ion transporters, and is considered to play a key role in mediating the accumulation of potassium in cells and maintaining the normal growth of plants [53]. This gene is expressed in all tissues of L. ruthenicum, which is different from cluster I members that are expressed exclusively in roots. Although several KT/KUP/HAK members were extensively studied, limited studies were conducted on the homologous genes of LrKUP8.
The precise function of LrKUP8 was further characterized by using the callus system. Biomass is frequently used as the main criterion for identifying salinity tolerance in plants because it represents the combined genetic and environmental effects on plant growth [54,55]. Biomass analysis revealed that OE-LrKUP8 is less sensitive to salt stress. Therefore, LrKUP8 plays a key role in the response to a highly saline condition. Analysis of the LrKUP8 expression pattern is critical to explaining its physiological functions in plants. By studying the expression of LrKUP8 in different tissues, we found that the relative expression of LrKUP8 was highest in new leaves. Thus, we proposed that in the process of growth and development, plants will preferentially supply K+ to the new leaves, and provide K+ to the last important tissues, such as old leaves. The K+/Na+ ratio in both kinds of calli decreased under salt treatment. This reduction is attributed to the reduction in K+ uptake and the increase in Na+ uptake. The Na+ content between the pBI121 control and OE-LrKUP8 calli showed no significant difference, thereby indicating that the main function of LrKUP8 may not for Na+ transport. The cells of OE-LrKUP8 calli maintained relatively higher levels of cytoplasmic K+ concentration, which means the decreased rate of K+ concentration in OE-LrKUP8 calli was significantly lower than that in the vector control. This resulted a higher K+/Na+ ratio in OE-LrKUP8 calli, which is very important for the better performance of them in high salt medium. The function of genes from KUP/HAK/KT family is diversity. PhaHAK5, which belongs to the Cluster IV group, is one of the routes by which Na+ enters cells, indicating some KUP/HAK/KT member also function in Na+ transporting [56]. The function of AtHAK5 under low potassium conditions has been thoroughly studied [19,20]. Compared to retrieve K+ from low K+ condition, the performance of KUP/HAK/KT genes under high Na+ condition was relatively fewer studied. Our data demonstrated the LrKUP8 is crucial for K+ uptake, especially under high salt condition. We further performed NMT analysis to clarify the contribution of ion fluxes. The NMT is an effective tool for exhibiting the physical salt tolerance mechanisms of plants because it reflects real-time physiological functions of plant roots while maintaining plant root integrity in living plants [41,57,58]. Measurement results showed that K+ effluxes were significantly decreased in OE-LrKUP8 calli compared with the vector control under NaCl stress. Thus, OE-LrKUP8 L. ruthenicum calli could maintain high K+/Na+ in tissues due to their ability to retain K+. Considering that one of the key features of plant salt tolerance is the ability of cells to maintain an optimal K+/Na+ ratio in the cytosol, we propose that the ability of LrKUP8 to retain K+ contributes to the performance for L. ruthenicum under saline conditions.
We performed molecular analyses to uncover the function of LrKUP8 in response to salt stress because salt-induced K+ deficiency is the main factor affecting plant growth performance. Examination of K+ and Na+ accumulation in vector control and OE-LrKUP8 callus lines confirmed the excellent capacity of L. ruthenicum to maintain the K+/Na+ ratio through effective K+ absorption. K+ flux measurement via a non-invasive ion-selective microelectrode technique also revealed that OE-LrKUP8 L. ruthenicum can maintain K+ under NaCl exposure, and this process may be the main mechanism underlying the salt tolerance of L. ruthenicum. Our data aid in explaining the K richness of L. ruthenicum despite thriving in a natural saline–alkali environment.

Supplementary Materials

The following are available online at https://www.mdpi.com/2073-4425/10/8/600/s1: Table S1. Primers for LrKUP8 isolation, LrKUP8 expression, and OE-LrKUP8 callus detection; Figure S1. DNA integration analysis to identify LrKUP8 insertion.

Author Contributions

Investigation, F.D.; project administration, J.C.; writing—original draft, J.C. and F.D.; writing—review and editing, J.C., A.L., and S.R. All authors read and approved the final manuscript.

Funding

This work was supported by National Key R&D Program Project Funding (2018YFD1000607), the Fundamental Research Funds for the Central Universities (2016ZCQ05), and the National Natural Science Foundation of China (grant number 31670610).

Conflicts of Interest

The authors declare no conflict of interests.

Abbreviations

DWdry weight
FWfresh weight
MDAmalondialdehyde
MSMurashige and Skoog
NMTnon-invasive micro-test technique
PMplasma membrane
qPCRquantitative real-time PCR

References

  1. Munns, R.; Tester, M. Mechanisms of salinity tolerance. Plant Biol. 2008, 59, 651–681. [Google Scholar] [CrossRef] [PubMed]
  2. Flowers, T.J.; Colmer, T.D. Salinity tolerance in halophytes. New Phytol. 2008, 179, 945–963. [Google Scholar] [CrossRef] [PubMed]
  3. Flowers, T.J.; Glenn, E.P.; Volkov, V. Could vesicular transport of Na+ and Cl be a feature of salt tolerance in halophytes? Ann. Bot. 2019, 123, 1–18. [Google Scholar] [CrossRef] [PubMed]
  4. Khan, M.A.; Ansari, R.; Ali, H.; Gul, B.; Nielsen, B.L. Panicum turgidum, a potentially sustainable cattle feed alternative to maize for saline areas. Agric. Ecosyst. Environ. 2009, 129, 542–546. [Google Scholar] [CrossRef]
  5. Koyro, H.W.; Zörb, C.; Debez, A.; Huchzermeyer, B. The effect of hyperosmotic salinity on protein pattern and enzyme activities of halophytes. Funct. Plant Biol. 2013, 40, 787–804. [Google Scholar] [CrossRef]
  6. Jin, H.; Liu, Y.; Yang, F.; Wang, J.; Fu, D.; Zhang, X. Characterization of anthocyanins in wild Lycium ruthenicum Murray by HPLC-DAD/QTOF-MS/MS. Anal. Methods 2015, 7, 4947–4956. [Google Scholar] [CrossRef]
  7. Ali, A.; Khan, I.U.; Jan, M.; Khan, H.A.; Hussain, S.; Nisar, M.; Chung, W.S.; Yun, D.-J. The high-affinity Potassium transporter EpHKT1;2 from the extremophile Eutrema parvula mediates salt tolerance. Front. Plant Sci. 2018, 9, 1108. [Google Scholar] [CrossRef] [PubMed]
  8. Ali, A.; Yun, D.-J. Differential selection of sodium and potassium ions by TsHKT1;2. Plant Signal. Behav. 2016, 11, e1206169. [Google Scholar] [CrossRef] [PubMed] [Green Version]
  9. Hasanuzzaman, M.; Nahar, K.; Alam, M.M.; Roychowdhury, R.; Fujita, M. Physiological, biochemical, and molecular mechanisms of heat stress tolerance in plants. Int. J. Mol. Sci. 2013, 14, 9643–9684. [Google Scholar] [CrossRef]
  10. Zhao, N.; Wang, S.; Ma, X.; Zhu, H.; Sa, G.; Sun, J.; Li, N.; Zhao, C.; Zhao, R.; Chen, S. Extracellular ATP mediates cellular K+/Na+ homeostasis in two contrasting poplar species under NaCl stress. Trees 2016, 30, 825–837. [Google Scholar] [CrossRef]
  11. Hamamoto, S.; Horie, T.; Hauser, F.; Deinlein, U.; Schroeder, J.I.; Uozumi, N. Hkt transporters mediate salt stress resistance in plants: From structure and function to the field. Curr. Opin. Biotechnol. 2015, 32, 113–120. [Google Scholar] [CrossRef] [PubMed]
  12. Maathuis, F.J.M. Physiological functions of mineral macronutrients. Curr. Opin. Plant Biol. 2009, 12, 250–258. [Google Scholar] [CrossRef] [PubMed]
  13. Wang, H.; Wu, Z.; Zhou, Y.; Han, J.; Shi, D. Effects of salt stress on ion balance and nitrogen metabolism of old and young leaves in rice (Oryza sativa L.). BMC Plant Biol. 2012, 12, 194. [Google Scholar] [CrossRef] [PubMed]
  14. Zhu, J.K. Regulation of ion homeostasis under salt stress. Curr. Opin. Plant Biol. 2003, 6, 441–445. [Google Scholar] [CrossRef]
  15. Wang, Y.; Wu, W.H. Potassium transport and signaling in higher plants. Annu. Rev. Plant Biol. 2013, 64, 451–476. [Google Scholar] [CrossRef] [PubMed]
  16. Véry, A.A.; Sentenac, H. Molecular Mechanisms and Regulation of K+ Transport in Higher Plants. Annu. Rev. Plant Biol. 2003, 54, 575–603. [Google Scholar] [CrossRef] [PubMed]
  17. Grabov, A. Plant KT/KUP/HAK potassium transporters: Single family-multiple functions. Ann. Bot. 2007, 99, 1035–1041. [Google Scholar] [CrossRef] [PubMed]
  18. Gupta, M.; Qiu, X.H.; Wang, L.; Xie, W.B.; Zhang, C.J.; Xiong, L.Z.; Lian, X.M.; Zhang, Q.F. KT/HAK/KUP potassium transporters gene family and their whole-life cycle expression profile in rice (Oryza sativa). Mol. Genet. Genom. 2008, 280, 437–452. [Google Scholar] [CrossRef]
  19. Qi, Z.; Hampton, C.R.; Shin, R.; Barkla, B.J.; White, P.J.; Schachtman, D.P. The high affinity K+ transporter AtHAK5 plays a physiological role in planta at very low K+ concentrations and provides a caesium uptake pathway in Arabidopsis. J. Exp. Bot. 2008, 59, 595–607. [Google Scholar] [CrossRef]
  20. Nieves-Cordones, M.; Alemán, F.; Martínez, V.; Rubio, F. The Arabidopsis thaliana HAK5 K+ transporter is required for plant growth and K+ acquisition from low K+ solutions under saline conditions. Mol. Plant 2010, 3, 326–333. [Google Scholar] [CrossRef]
  21. Horie, T.; Sugawara, M.; Okada, T.; Taira, K.; Kaothien-Nakayama, P.; Katsuhara, M.; Nakayama, H. Rice sodium-insensitive potassium transporter, OsHAK5, confers increased salt tolerance in tobacco BY2 cells. J. Biosci. Bioeng. 2011, 111, 346–356. [Google Scholar] [CrossRef] [PubMed]
  22. Yang, T.; Zhang, S.; Hu, Y.; Wu, F.; Hu, Q.; Chen, G.; Xu, G. The role of a potassium transporter OsHAK5 in potassium acquisition and transport from roots to shoots in rice at low potassium supply levels. Plant Physiol. 2014, 166, 945–959. [Google Scholar] [CrossRef] [PubMed]
  23. Yang, Z.; Gao, Q.; Sun, C.; Li, W.; Gu, S.; Xu, C. Molecular evolution and functional divergence of HAK potassium transporter gene family in rice (Oryza sativa L.). J. Genet. Genom. 2009, 36, 161–172. [Google Scholar] [CrossRef]
  24. Fu, H.H.; Luan, S. AtKUP1: A dual-affinity K+ transporter from Arabidopsis. Plant Cell 1998, 10, 63–73. [Google Scholar] [PubMed]
  25. Elumalai, R.P.; Nagpal, P.; Reed, J.W. A mutation in the Arabidopsis KT2/KUP2 potassium transporter gene affects shoot cell expansion. Plant Cell 2002, 14, 119–131. [Google Scholar] [CrossRef] [PubMed]
  26. Vicente-Agullo, F.; Rigas, S.; Desbrosses, G.; Dolan, L.; Hatzopoulos, P.; Grabov, A. Potassium carrier TRH1 is required for auxin transport in Arabidopsis roots. Plant J. 2004, 40, 523–535. [Google Scholar] [CrossRef]
  27. Liu, Y.; Hou, L.; Li, Q.; Jiang, Z.; Liu, T.; Zhu, Y. The effects of exogenous antioxidant germanium (Ge) on seed germination and growth of Lycium ruthenicum Murr subjected to NaCl stress. Environ. Technol. 2016, 37, 909–919. [Google Scholar] [CrossRef]
  28. Wang, C.M.; Xia, C.M.; Wu, G.Q.; Yuan, H.J.; Wang, X.R.; Li, J.H.; Tian, F.P.; Zhang, Q.; Wang, H.; Li, J.; et al. Lycium ruthenicum studies: Molecular biology, phytochemistry and pharmacology. Food Chem. 2018, 240, 759–766. [Google Scholar] [CrossRef]
  29. Wang, J.; Chen, X.; Zhang, W. Study on hypoglycemic function of polysaccharides from Lycium ruthenicum Murr. fruit and its mechanism. Food Sci. 2009, 30, 244–248. [Google Scholar]
  30. Peng, Q.; Lv, X.; Xu, Q.; Li, Y.; Huang, L.; Du, Y. Isolation and structural characterization of the polysaccharide LRGP1 from Lycium ruthenicum. Carbohyd. Polym. 2012, 90, 95–101. [Google Scholar] [CrossRef]
  31. Peng, Q.; Liu, H.; Shi, S.; Li, M. Lycium ruthenicum polysaccharide attenuates inflammation through inhibiting TLR4/NF-κ B signaling pathway. Int. J. Biol. Macromol. 2014, 67, 330–335. [Google Scholar] [CrossRef] [PubMed]
  32. Liu, Z.; Dang, J.; Wang, Q.; Yu, M.; Jiang, L.; Mei, L.; Shao, Y.; Tao, Y. Optimization of polysaccharides from Lycium ruthenicum fruit using RSM and its anti-oxidant activity. Int. J. Biol. Macromol. 2013, 61, 127–134. [Google Scholar] [CrossRef] [PubMed]
  33. Liu, Y.; Song, Y.; Zeng, S.; Patra, B.; Yuan, L.; Wang, Y. Isolation and characterization of a salt stress-responsive betaine aldehyde dehydrogenase in Lycium ruthenicum Murr. Physiol. Plant 2018, 163, 73–87. [Google Scholar] [CrossRef] [PubMed]
  34. Zheng, J.; Ding, C.; Wang, L.; Li, G.; Shi, J.; Li, H.; Wang, H.; Suo, Y. Anthocyanins composition and antioxidant activity of wild Lycium ruthenicum Murr. from Qinghai-Tibet Plateau. Food Chem. 2011, 126, 859–865. [Google Scholar] [CrossRef]
  35. Walsh, A. The application of atomic absorption spectra to chemical analysis. Spectrochim. Acta 1955, 7, 108–117. [Google Scholar] [CrossRef]
  36. Chen, J.H.; Zhang, D.Z.; Zhang, C.; Xu, M.L.; Yin, W.L. Physiological characterization, transcriptomic profiling, and microsatellite marker mining of Lycium ruthenicum. J. Zhejiang Univ. Sci B 2017, 18, 1002–1021. [Google Scholar] [CrossRef] [PubMed]
  37. Voinnet, O.; Rivas, S.; Mestre, P.; Baulcombe, D. An enhanced transient expression system in plants based on suppression of gene silencing by the p19 protein of tomato bushy stunt virus. Plant J. 2003, 33, 949–956. [Google Scholar] [CrossRef]
  38. Chang, S.; Puryear, J.; Cairney, J. A simple and efficient method for isolating RNA from pine trees. Plant Mol. Biol. Rep. 1993, 11, 113–116. [Google Scholar] [CrossRef]
  39. Zeng, S.; Liu, Y.; Wu, M.; Liu, X.; Shen, X.; Liu, C.; Wang, Y. Identification and validation of reference genes for quantitative real-Time PCR normalization and its applications in Lycium. PLoS ONE 2014, 9, e97039. [Google Scholar] [CrossRef]
  40. Livak, K.J.; Schmittgen, T.D. Analysis of relative gene expression data using real-time quantitative PCR and the 2−Schm method. Methods 2001, 25, 402–408. [Google Scholar] [CrossRef]
  41. Sun, J.; Chen, S.; Dai, S.; Wang, R.; Li, N.; Shen, X.; Zhou, X.; Lu, C.; Zheng, X.; Hu, Z.; et al. NaCl-induced alternations of cellular and tissue ion fluxes in roots of salt-resistant and salt-sensitive poplar species. Plant Physiol. 2009, 149, 1141–1153. [Google Scholar] [CrossRef] [PubMed]
  42. Xue, Z.S.; Gao, H.; Sun, S. The salt resistance of wild soybean (Glycine soja Sieb. et Zucc. ZYD 03262) under NaCl stress is mainly determined by Na+ distribution in the plant. Acta. Physiol. Plant 2014, 36, 61–70. [Google Scholar] [CrossRef]
  43. Xu, K.; Zhang, X.M.; Fan, C.M.; Chen, F.L.; Zhu, J.L.; Zhang, S.L.; Chen, Q.S.; Fu, Y.F. A callus transformation system for gene functional studies in soybean. J. Integr. Agric. 2017, 16, 1913–1922. [Google Scholar] [CrossRef] [Green Version]
  44. Chahel, A.A.; Zeng, S.; Yousaf, Z.; Liao, Y.; Yang, Z.; Wei, X.; Ying, W. Plant-specific transcription factor LrTCP4 enhances secondary metabolite biosynthesis in Lycium ruthenicum hairy roots. Plant Cell Tissue Organ Cult. (PCTOC) 2019, 136, 323–337. [Google Scholar] [CrossRef]
  45. Ismail, H.; Maksimović, J.D.; Maksimović, V.; Shabala, L.; Živanović, B.D.; Tian, Y.; Jacobsen, S.E.; Shabala, S. Rutin, a flavonoid with antioxidant activity, improves plant salinity tolerance by regulating K+ retention and Na+ exclusion from leaf mesophyll in quinoa and broad beans. Funct. Plant Biol. 2016, 43, 75–86. [Google Scholar] [CrossRef]
  46. Wang, N.; Qi, H.K.; Qiao, W.Q.; Shi, J.B.; Xu, Q.H.; Zhou, H.; Yan, G.T.; Huang, Q. Cotton (Gossypium hirsutum L.) genotypes with contrasting K+/Na+ ion homeostasis: Implications for salinity tolerance. Acta Physiol. Plant 2017, 39, 77. [Google Scholar] [CrossRef]
  47. Shi, H.; Ishitani, M.; Kim, C.S.; Zhu, J.K. The Arabidopsis thaliana salt tolerance gene SOS1 encodes a putative Na+/H+ antiporter. Proc. Natl. Acad. Sci. USA 2000, 97, 6896–6901. [Google Scholar] [CrossRef] [PubMed]
  48. Wakeel, A.; Faroop, M.; Qadir, M.; Schubert, S. Potassium substitution by sodium in plants. Crit. Rev. Plant Sci. 2011, 30, 401–413. [Google Scholar] [CrossRef]
  49. Zhu, X.Q.; He, J.J.; Kumar, T.; Wang, X.L.; Zhang, J.L. The coordinated regulation of Na+ and K+ in Hordeum brevisubulatum responding to time of salt stress. Plant Sci. 2016, 252, 358–366. [Google Scholar]
  50. Wu, G.Q.; Wang, J.L.; Li, S.J. Genome-wide identification of Na+/H+ antiporter (NHX) genes in sugar Beet (β vulgaris L.) and their regulated expression under salt stress. Genes 2019, 10, 401. [Google Scholar] [CrossRef]
  51. Colmer, T.D.; Flowers, T.J.; Munns, R. Use of wild relatives to improve salt tolerance in wheat. J. Exp. Bot. 2006, 57, 1059–1078. [Google Scholar] [CrossRef] [PubMed] [Green Version]
  52. Cuin, T.A.; Miller, A.J.; Laurie, S.A.; Leigh, R.A. Potassium activities in cell compartments of salt-grown barley leaves. J. Exp. Bot. 2003, 54, 657–661. [Google Scholar] [CrossRef] [PubMed] [Green Version]
  53. Gierth, M.; Maser, P. Potassium transporters in plants-involvement in K+ acquisition, redistribution and homeostasis. FEBS Lett. 2007, 58, 2348–2356. [Google Scholar] [CrossRef] [PubMed]
  54. Noble, C.L.; Rogers, M.E. Arguments for the use of physiological criteria for improving the salt tolerance in crops. Plant Soil 1992, 146, 99–107. [Google Scholar] [CrossRef]
  55. Julkowska, M.M.; Klei, K.; Fokkens, L.; Haring, M.A.; Schranz, M.E.; Testerink, C. Natural variation in rosette size under salt stress conditions corresponds to developmental differences between Arabidopsis accessions and allelic variation in the LRR-KISS gene. J. Exp. Bot. 2016, 67, 2127–2138. [Google Scholar] [CrossRef] [PubMed]
  56. Takahashi, R.; Nishio, T.; Ichizen, N.; Takano, T. High-affinity K+ transporter PhaHAK5 is expressed only in salt-sensitive reed plants and shows Na+ permeability under NaCl stress. Plant Cell Rep. 2007, 26, 1673–1679. [Google Scholar] [CrossRef]
  57. Shabala, L.; Cuin, T.A.; Newman, I.A.; Shabala, S. Salinity-induced ion flux patterns from the excised roots of Arabidopsis sos mutants. Planta 2005, 222, 1041–1050. [Google Scholar] [CrossRef] [PubMed]
  58. Smith, P.J.S. Non-invasive ion probes-tools for measuring transmembrane ion flux. Nature 1995, 378, 645–646. [Google Scholar] [CrossRef]
Figure 1. Ion contents of different tissues for L. ruthenicumin in different saline soils. DW means dry weight. The mean ± standard error (SE) of five replicates is presented. The lowercase letters on the histogram indicate p < 0.05.
Genes 10 00600 g001
Figure 2. In silico analysis of the KT/KUP/HAK protein. (a) The phylogenetic tree using KUP transporters from A. thaliana, Nicotiana tabacum, O. sativa, and Populus. The tree topology was constructed using the Clustal W2 (http://www.ebi.ac.uk/Tools/msa/clustalw2/) and MEGA programs. LrKUP8 is indicated by green enlarged font. (b) Protein prediction of LrKUP8. (c) Multiple alignments of amino-acid sequences of LrKUP8 and other plant KT/KUP/HAK transporters.
Genes 10 00600 g002
Figure 3. Cellular localization and expression patterns of LrKUP8. (a) Tobacco epidermal cells were transiently transformed with constructs containing either control (GFP alone) or LrKUP8–GFP fusion plasmid. (b) Tissue expression level of LrKUP8. OL, NL, OS, and NS indicate old leaves, new leaves, old stems, and new stems, respectively. The relative expression of different developmental tissues was calculated by the 2−ΔCT method. (c) LrKUP8 expression levels in the calli under different saline conditions. The relative fold change data under different salt treatments were analyzed using the 2−ΔΔCT method. The upper- and lowercase letters on the histogram indicate p < 0.01 and p < 0.05, respectively. The mean ± SE of three replicates is presented.
Genes 10 00600 g003
Figure 4. Overexpression of LrKUP8 confers salt tolerance in transgenic calli. (a) Schematic representation of the T-DNA region of pBI121. The red and green boxes indicate LrKUP8 and GFP, respectively. (b) GFP detection of vector control and LrKUP8 overexpressing calli. (c) Phenotype test of vector control and OE-LrKUP8 lines after being grown on medium containing different Na+ concentrations and 50 mM kanamycin for 50 days. (d) Fresh weight analysis of vector control and OE-LrKUP8 lines after being grown on medium containing different Na+ concentrations for 50 days. The data in (d) are shown as means ± SE (n = 3). The upper- and lowercase letters on the histogram indicate p < 0.01 and p < 0.05, respectively.
Genes 10 00600 g004
Figure 5. LrKUP8 reduces K+ efflux in calli. (a) K+ content of L. ruthenicum calli with 300 mM NaCl for 50 days expressing GFP or LrKUP8-GFP. The data is from three samples (n = 3). (b) Na+ content of L. ruthenicum calli with 300 mM NaCl for 50 days expressing GFP or LrKUP8-GFP. The data is from three samples (n = 3). (c) K+/Na+ ratios of L. ruthenicum calli with 300 mM NaCl for 50 days expressing GFP or LrKUP8-GFP. The data is from three samples (n = 3). (d) The measuring position using K+-selective microelectrode of NMT. (e) K+ flux rates measured by NMT/MIFE assays of L. ruthenicum calli expressing GFP or LrKUP8-GFP under control or 300 mM NaCl treatment after 12 h. The data is from six samples (n = 6). (f) Histogram analyses of K+ in L. ruthenicum calli expressing GFP or LrKUP8-GFP under control or 300 mM NaCl treatment after 12 h. The data is from six samples (n = 6). The mean ± SE of all replicates is presented. The upper- and lowercase letters on the histogram indicate p < 0.01 and p < 0.05, respectively. The double asterisks represent p < 0.01. NS means not significant.4. Discussion.
Genes 10 00600 g005

