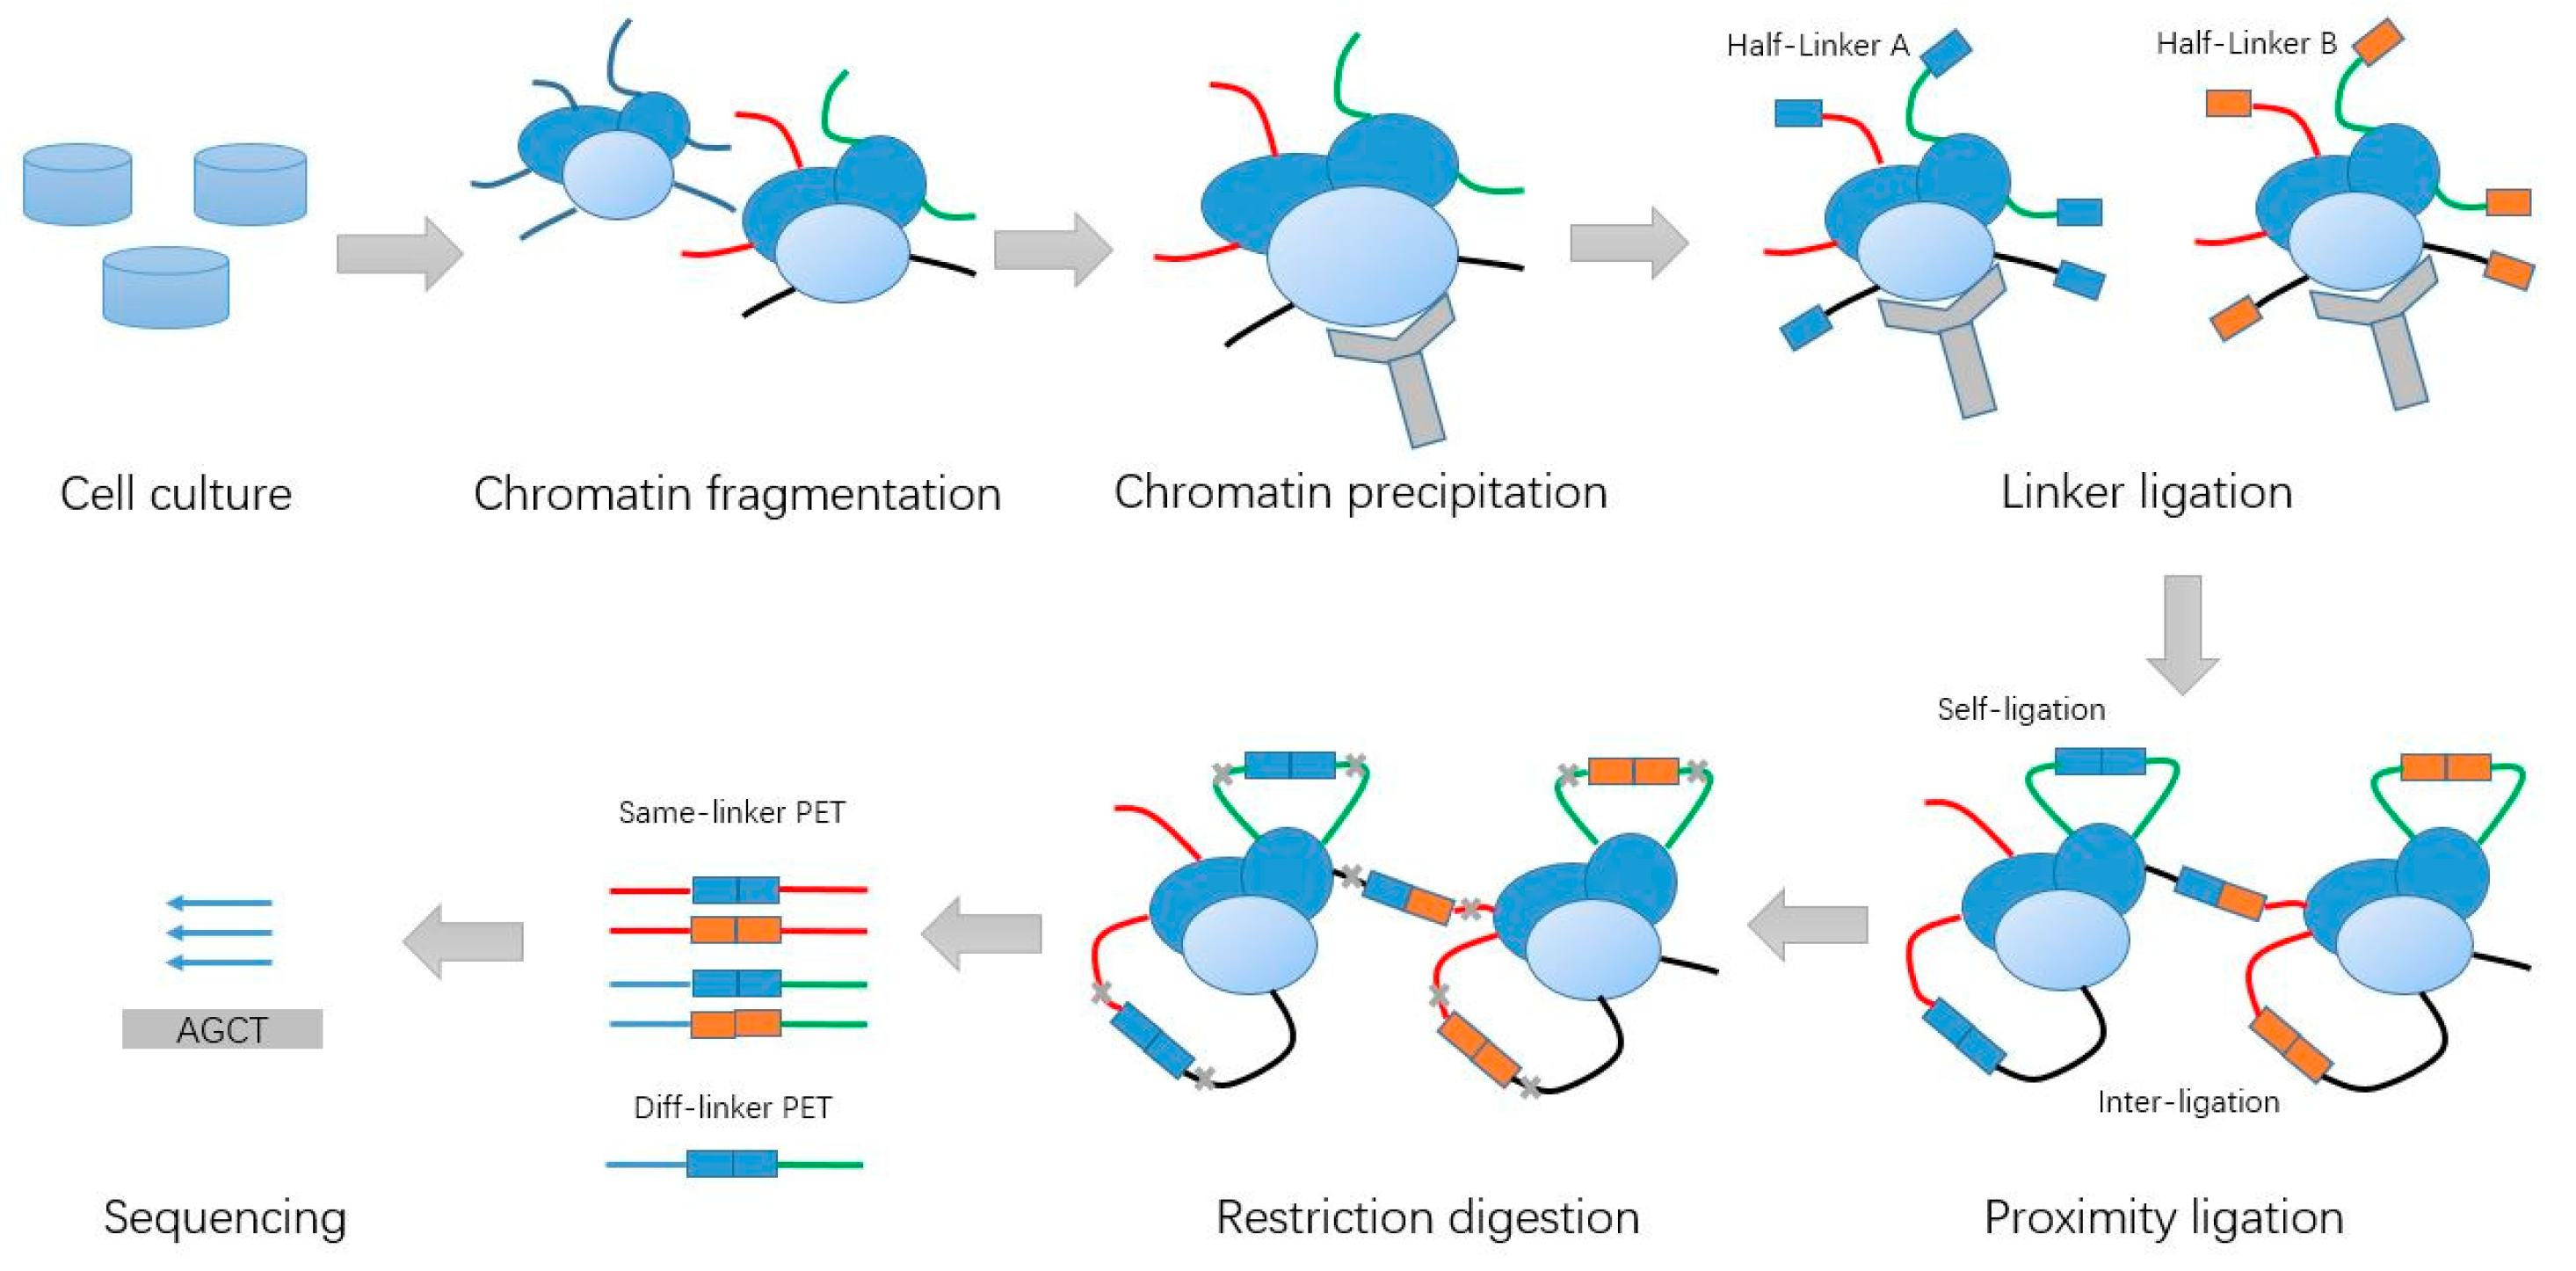
Figure 1.
Schematic of Chromatin Interaction Analysis with Paired-End Tag (ChIA-PET) experiment steps.
Figure 1.
Schematic of Chromatin Interaction Analysis with Paired-End Tag (ChIA-PET) experiment steps.
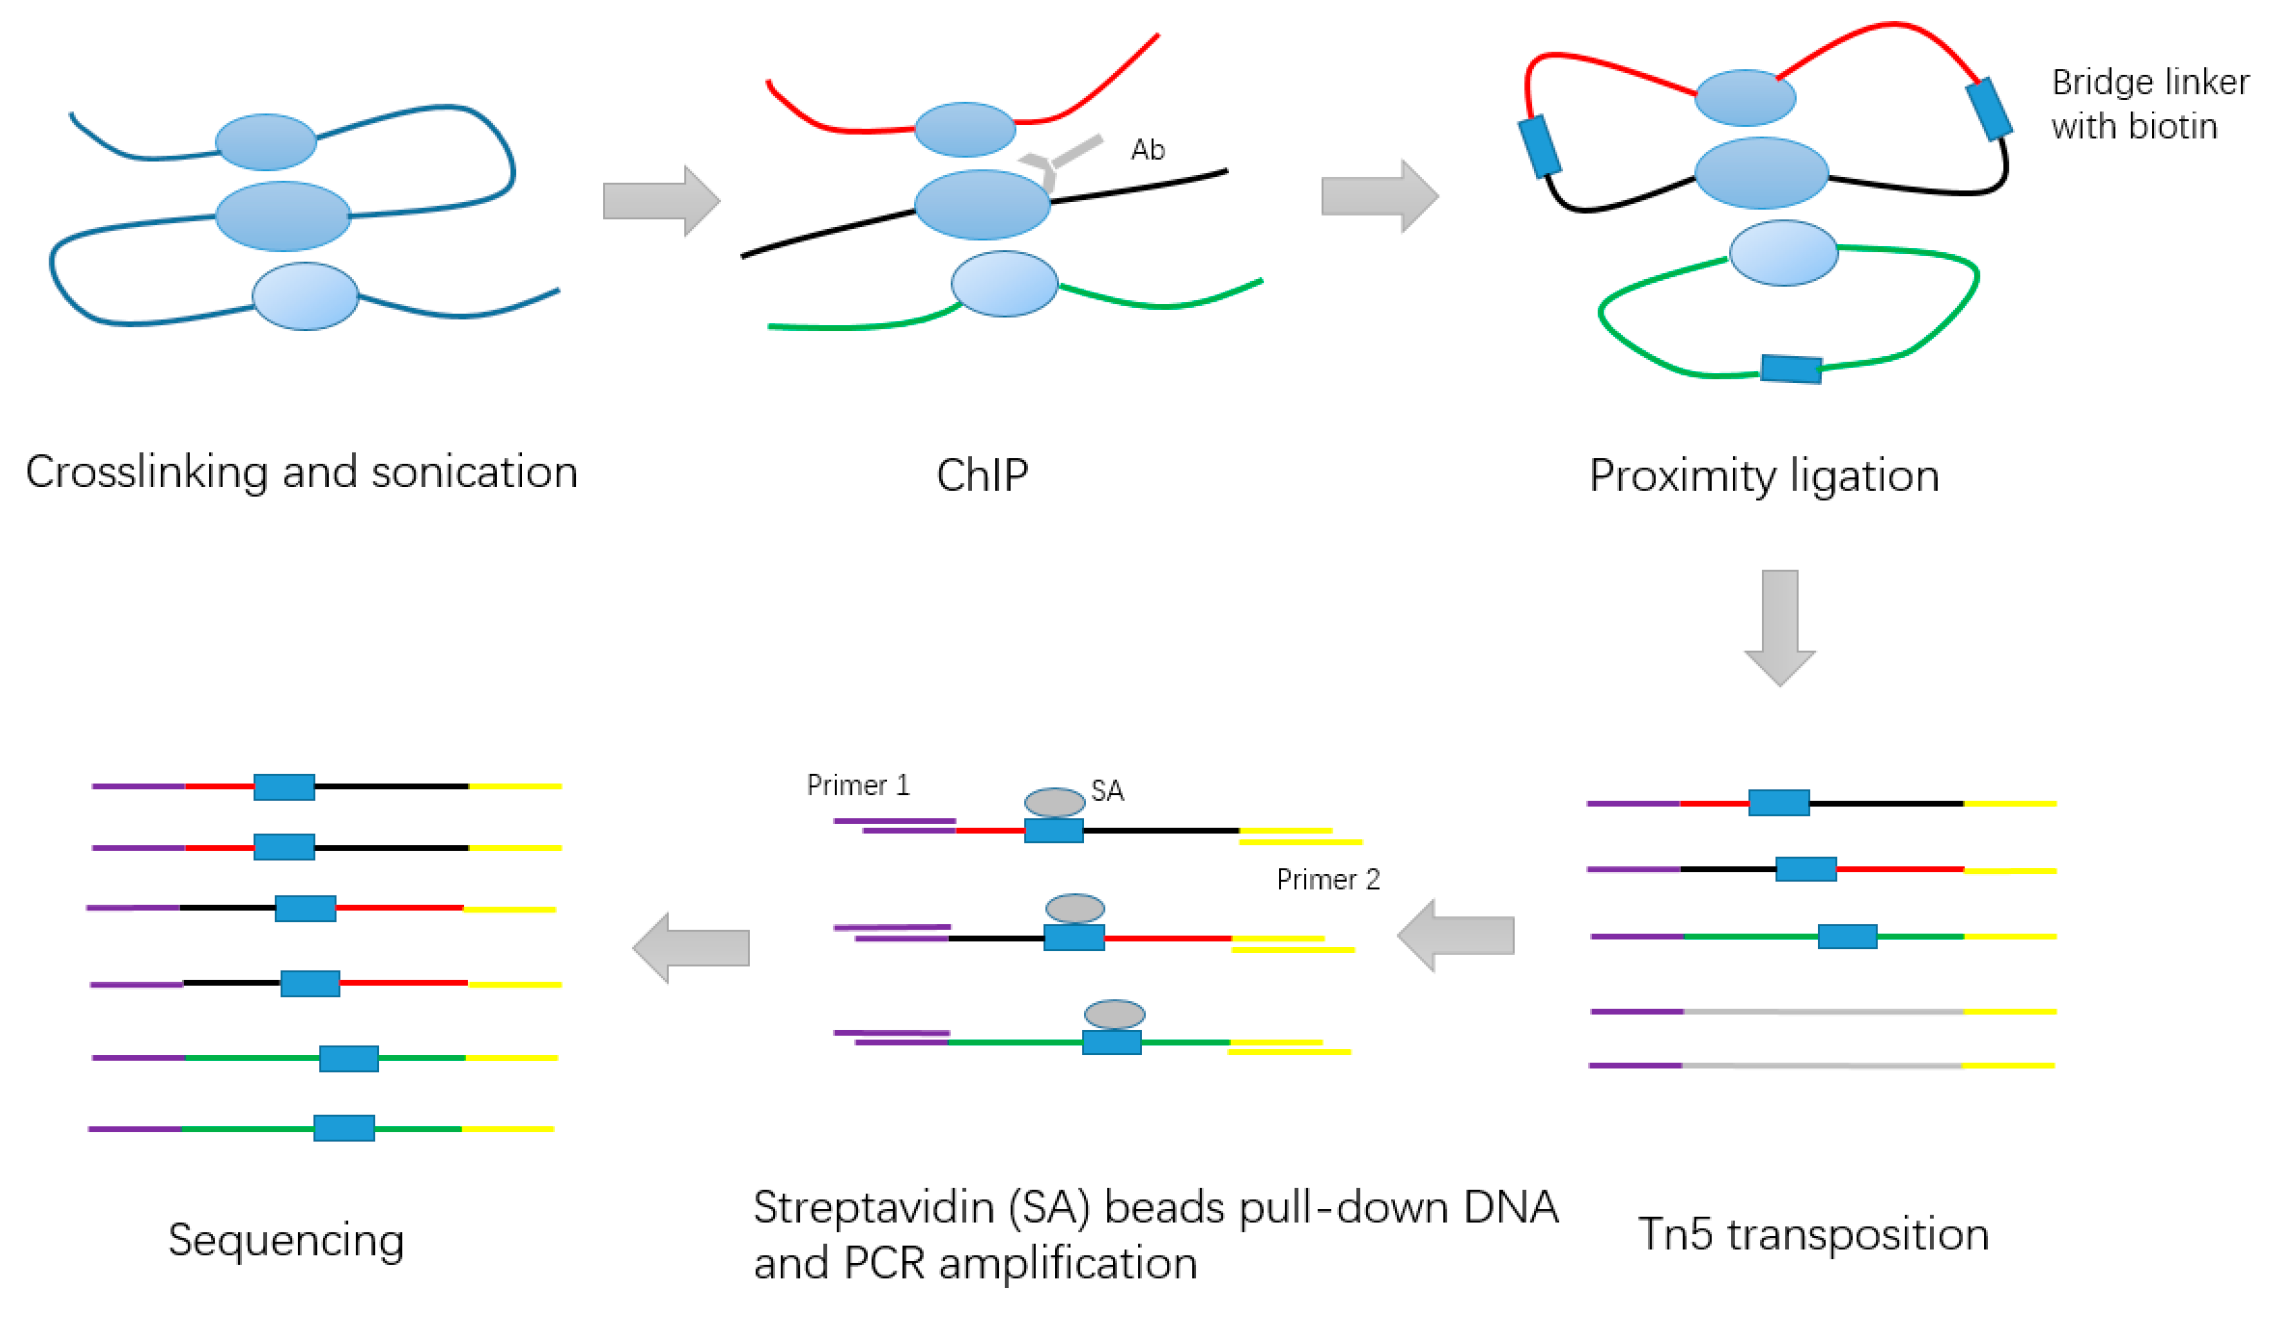
Figure 2.
Schematic of long-read ChIA-PET experiment steps.
Figure 2.
Schematic of long-read ChIA-PET experiment steps.
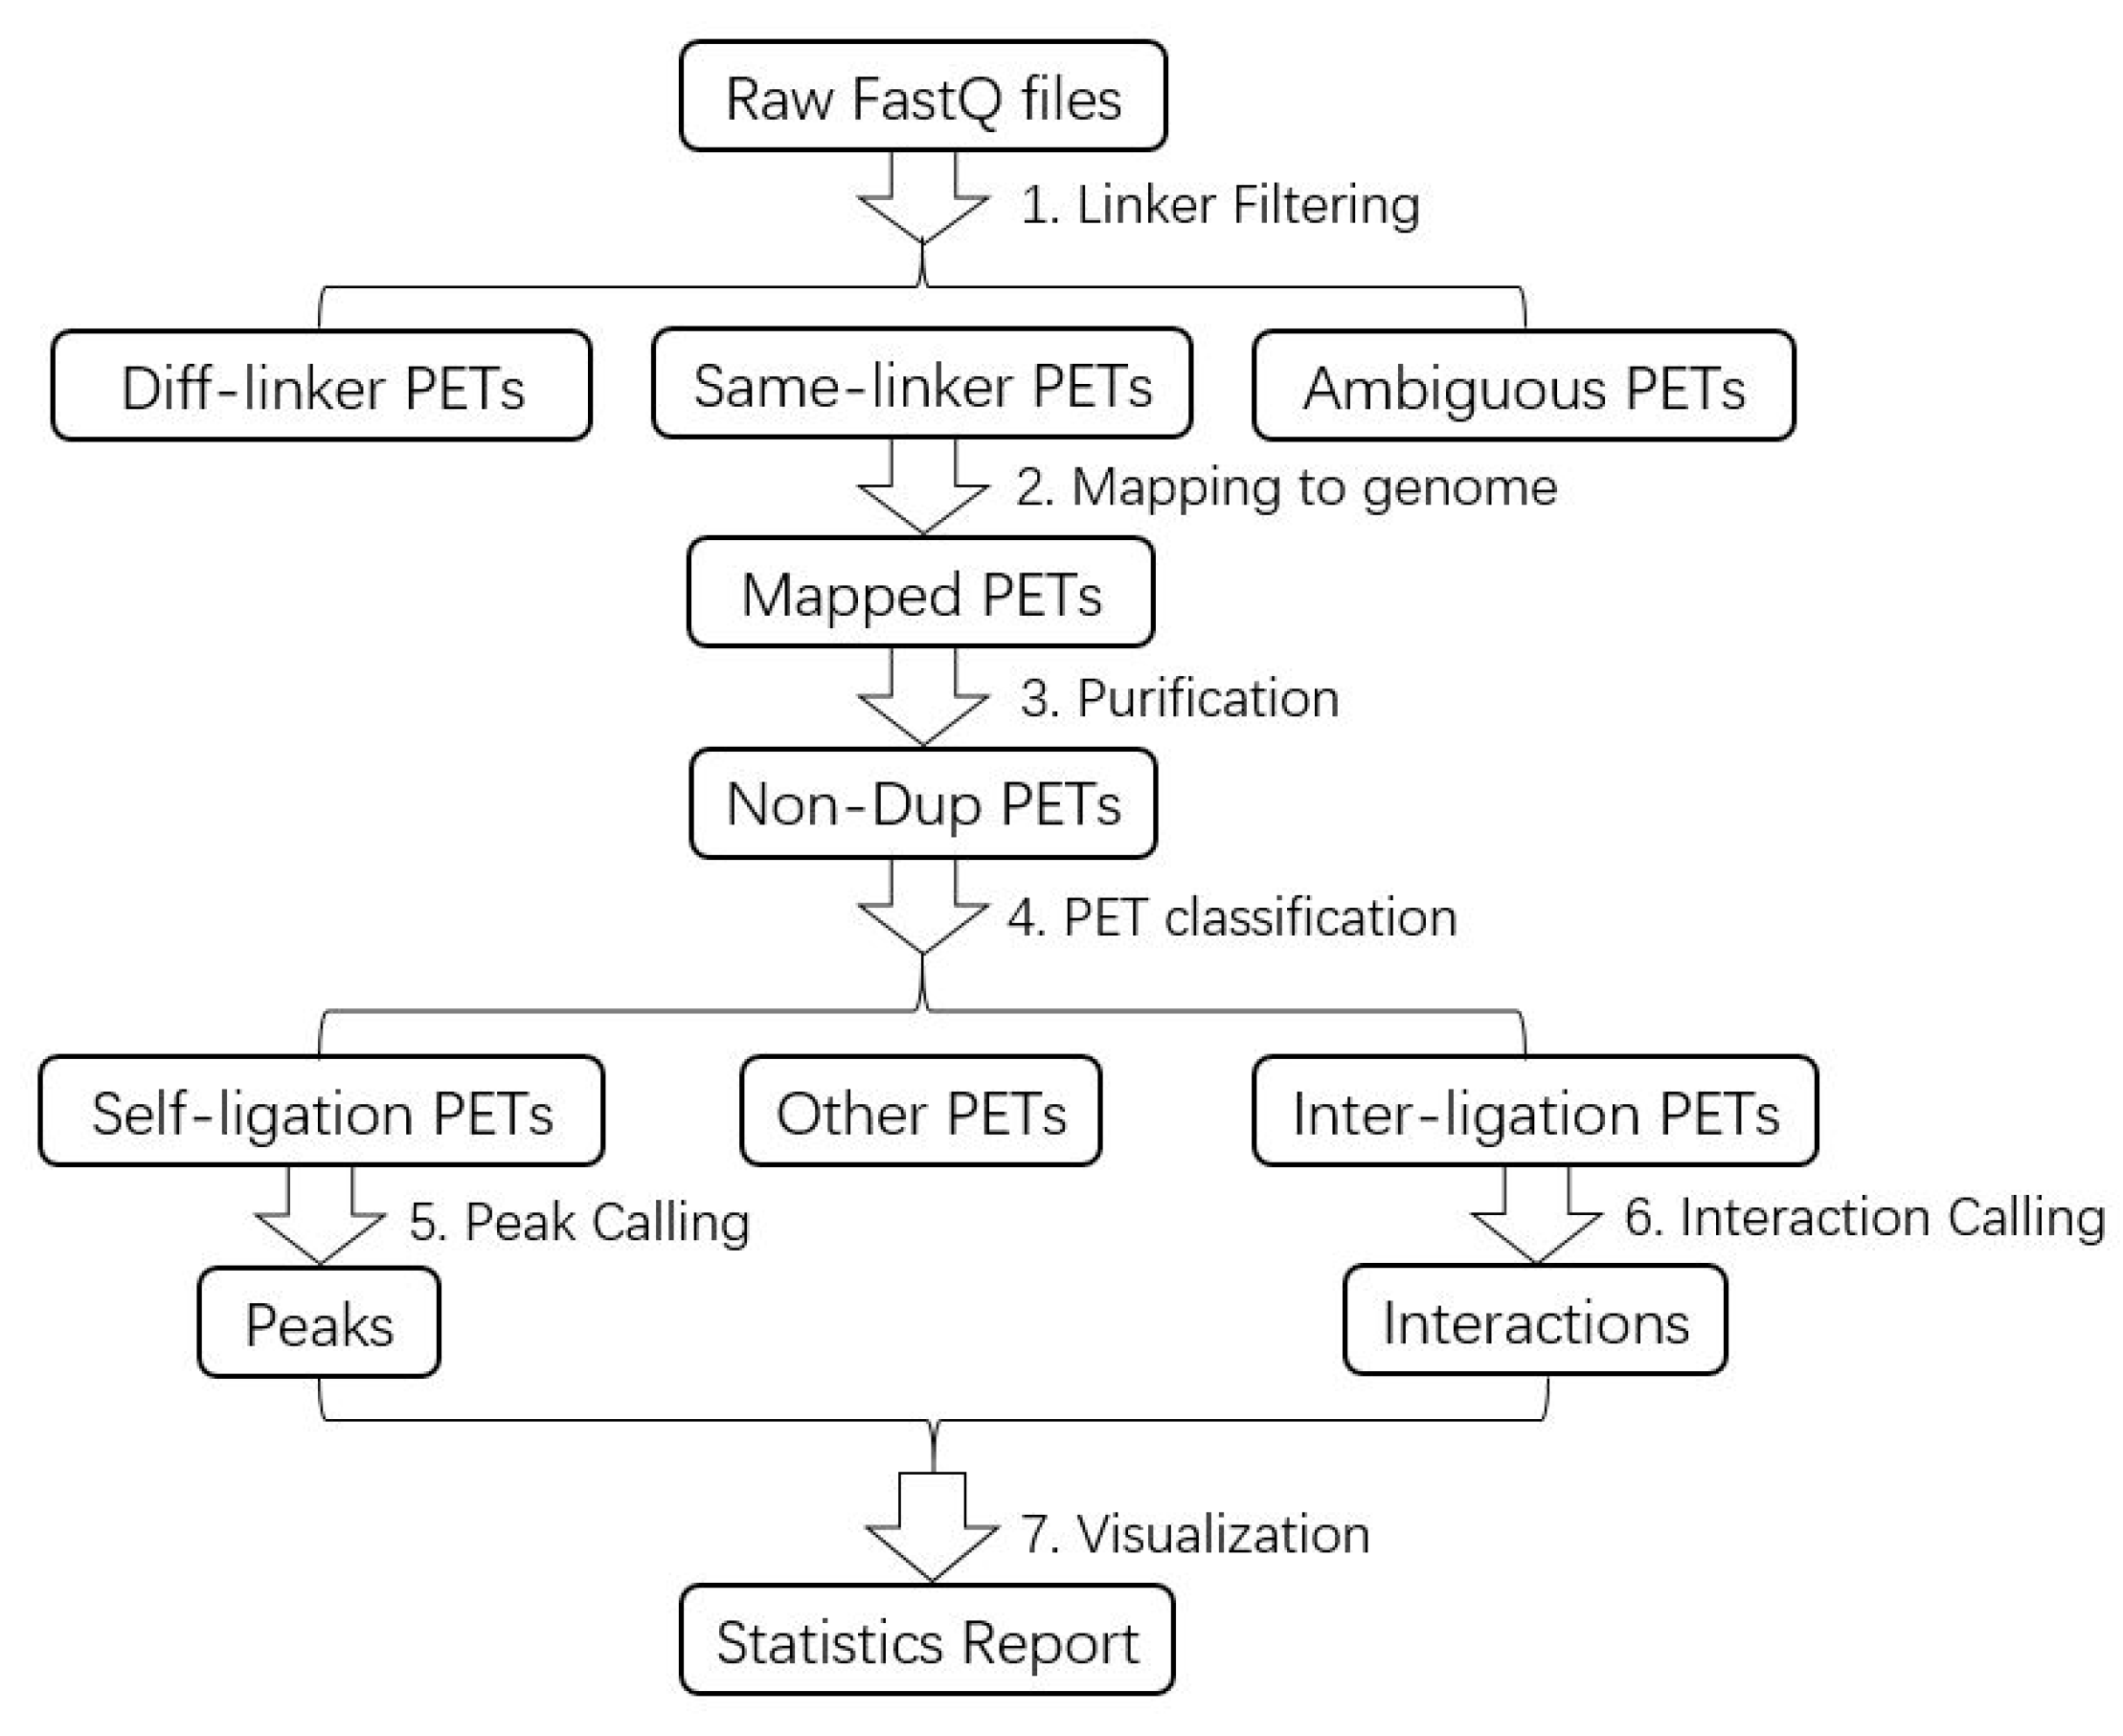
Figure 3.
Flowchart of ChIA-PET Tool V3 for ChIA-PET data analysis.
Figure 3.
Flowchart of ChIA-PET Tool V3 for ChIA-PET data analysis.
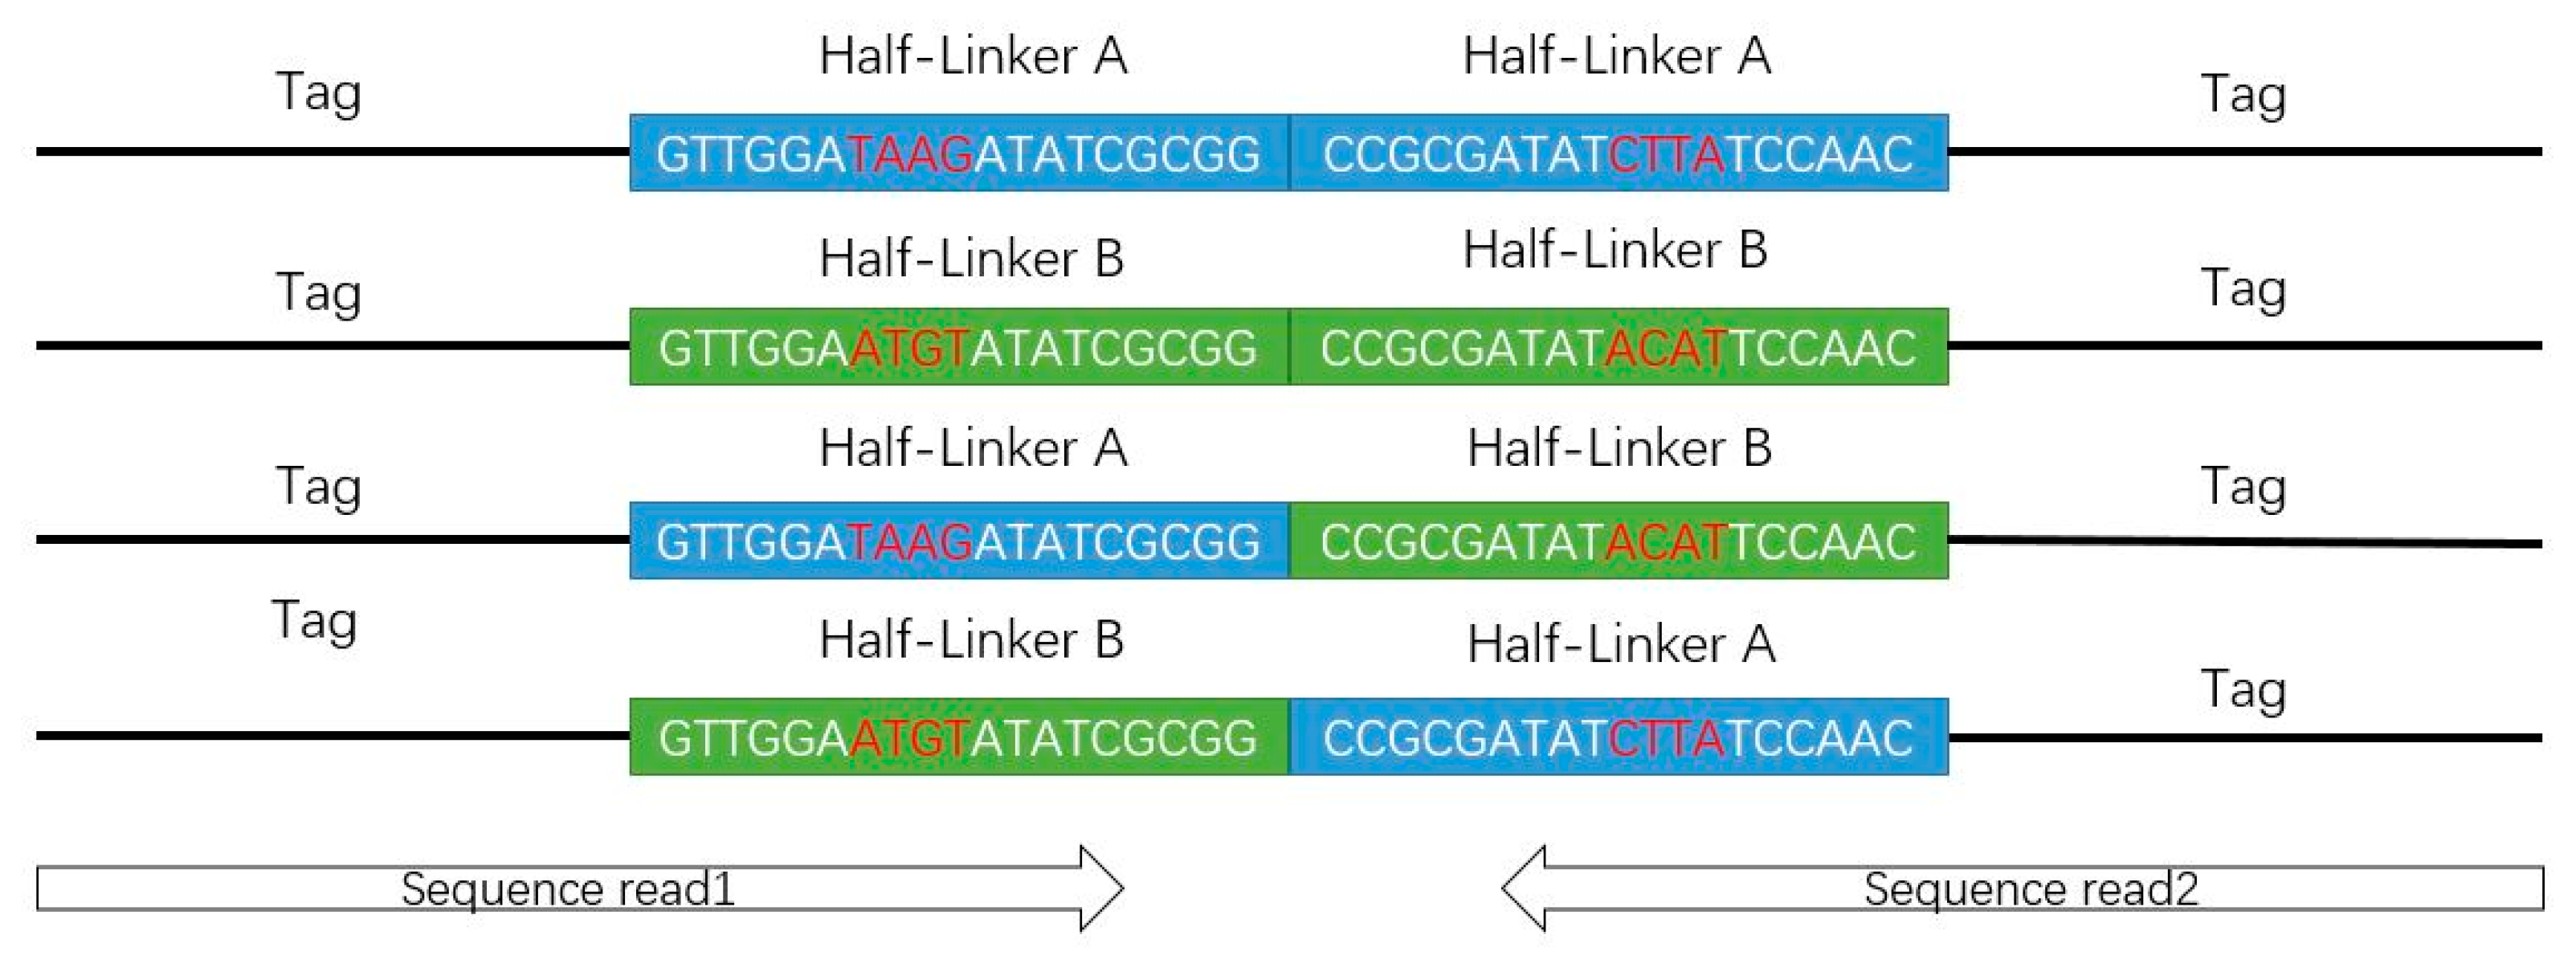
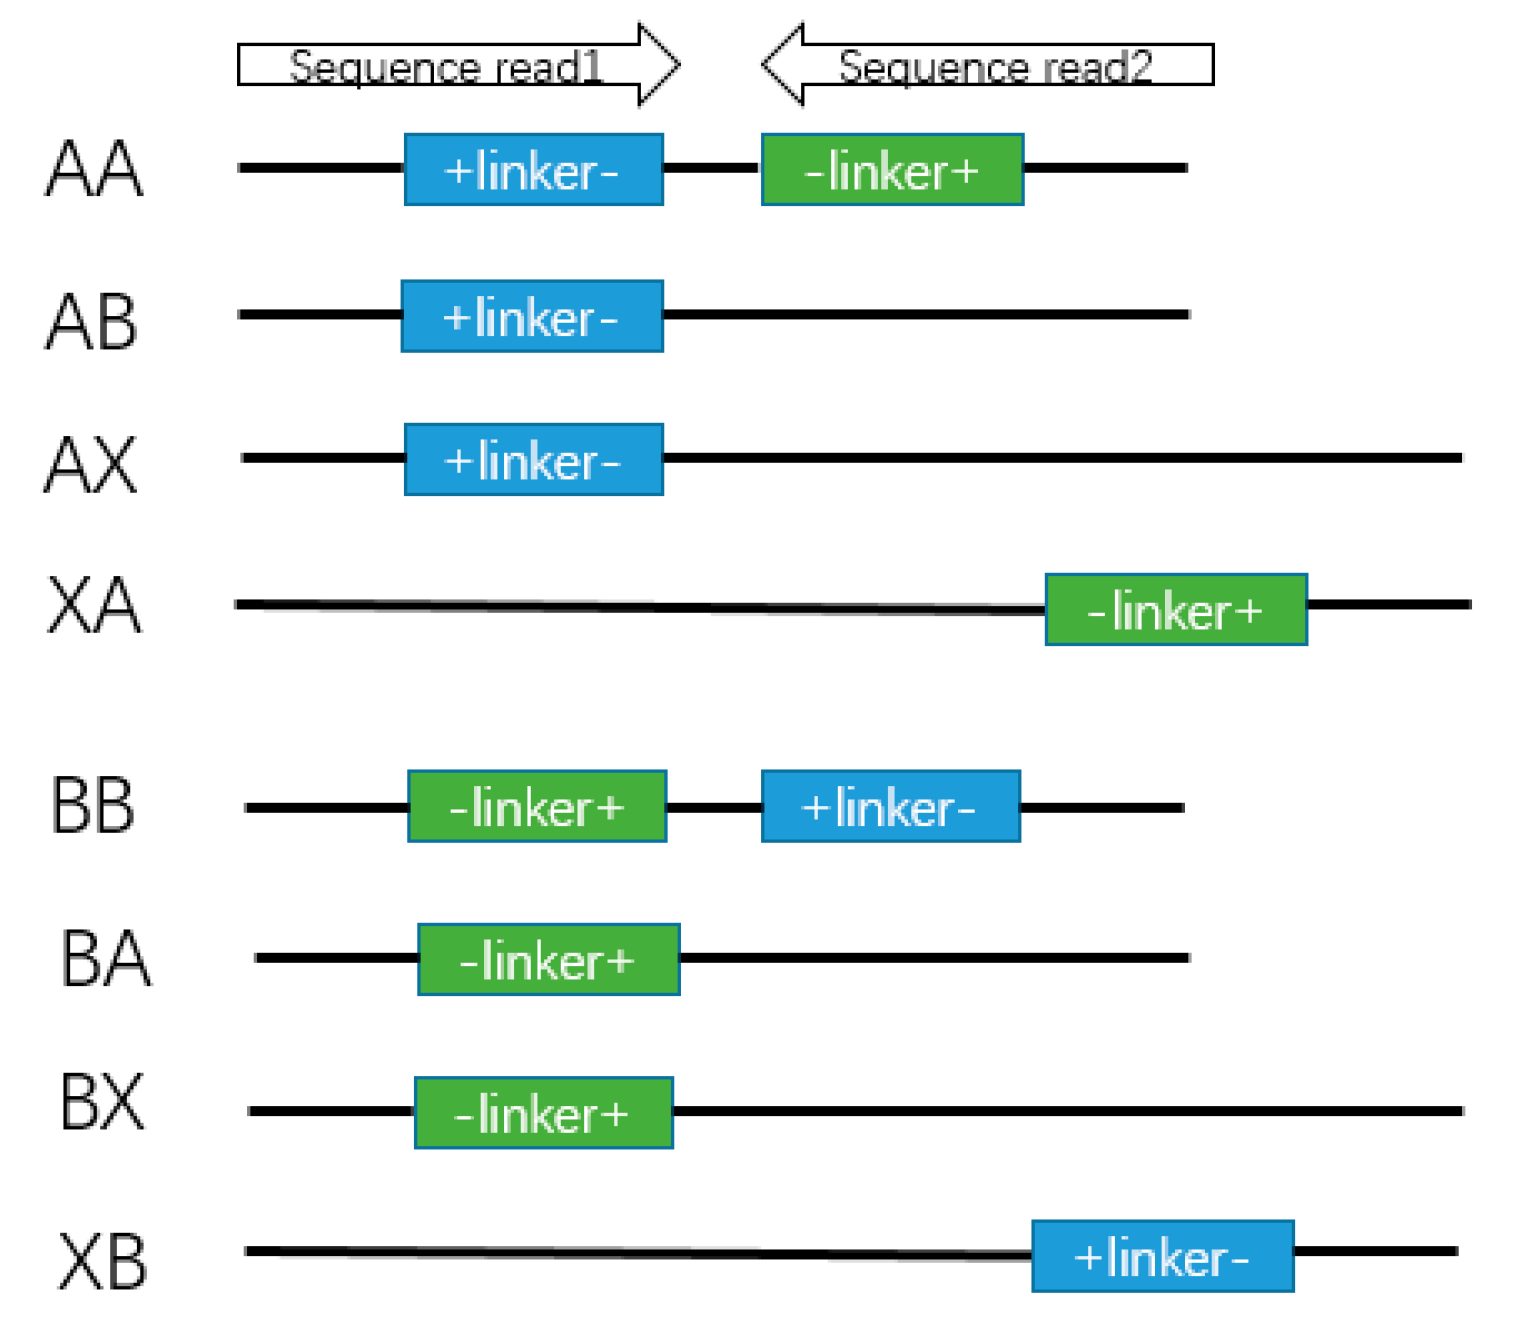
Figure 4.
Deoxyribonucleic acid constructs from the experiments in tag-linker-tag format.
Figure 4.
Deoxyribonucleic acid constructs from the experiments in tag-linker-tag format.
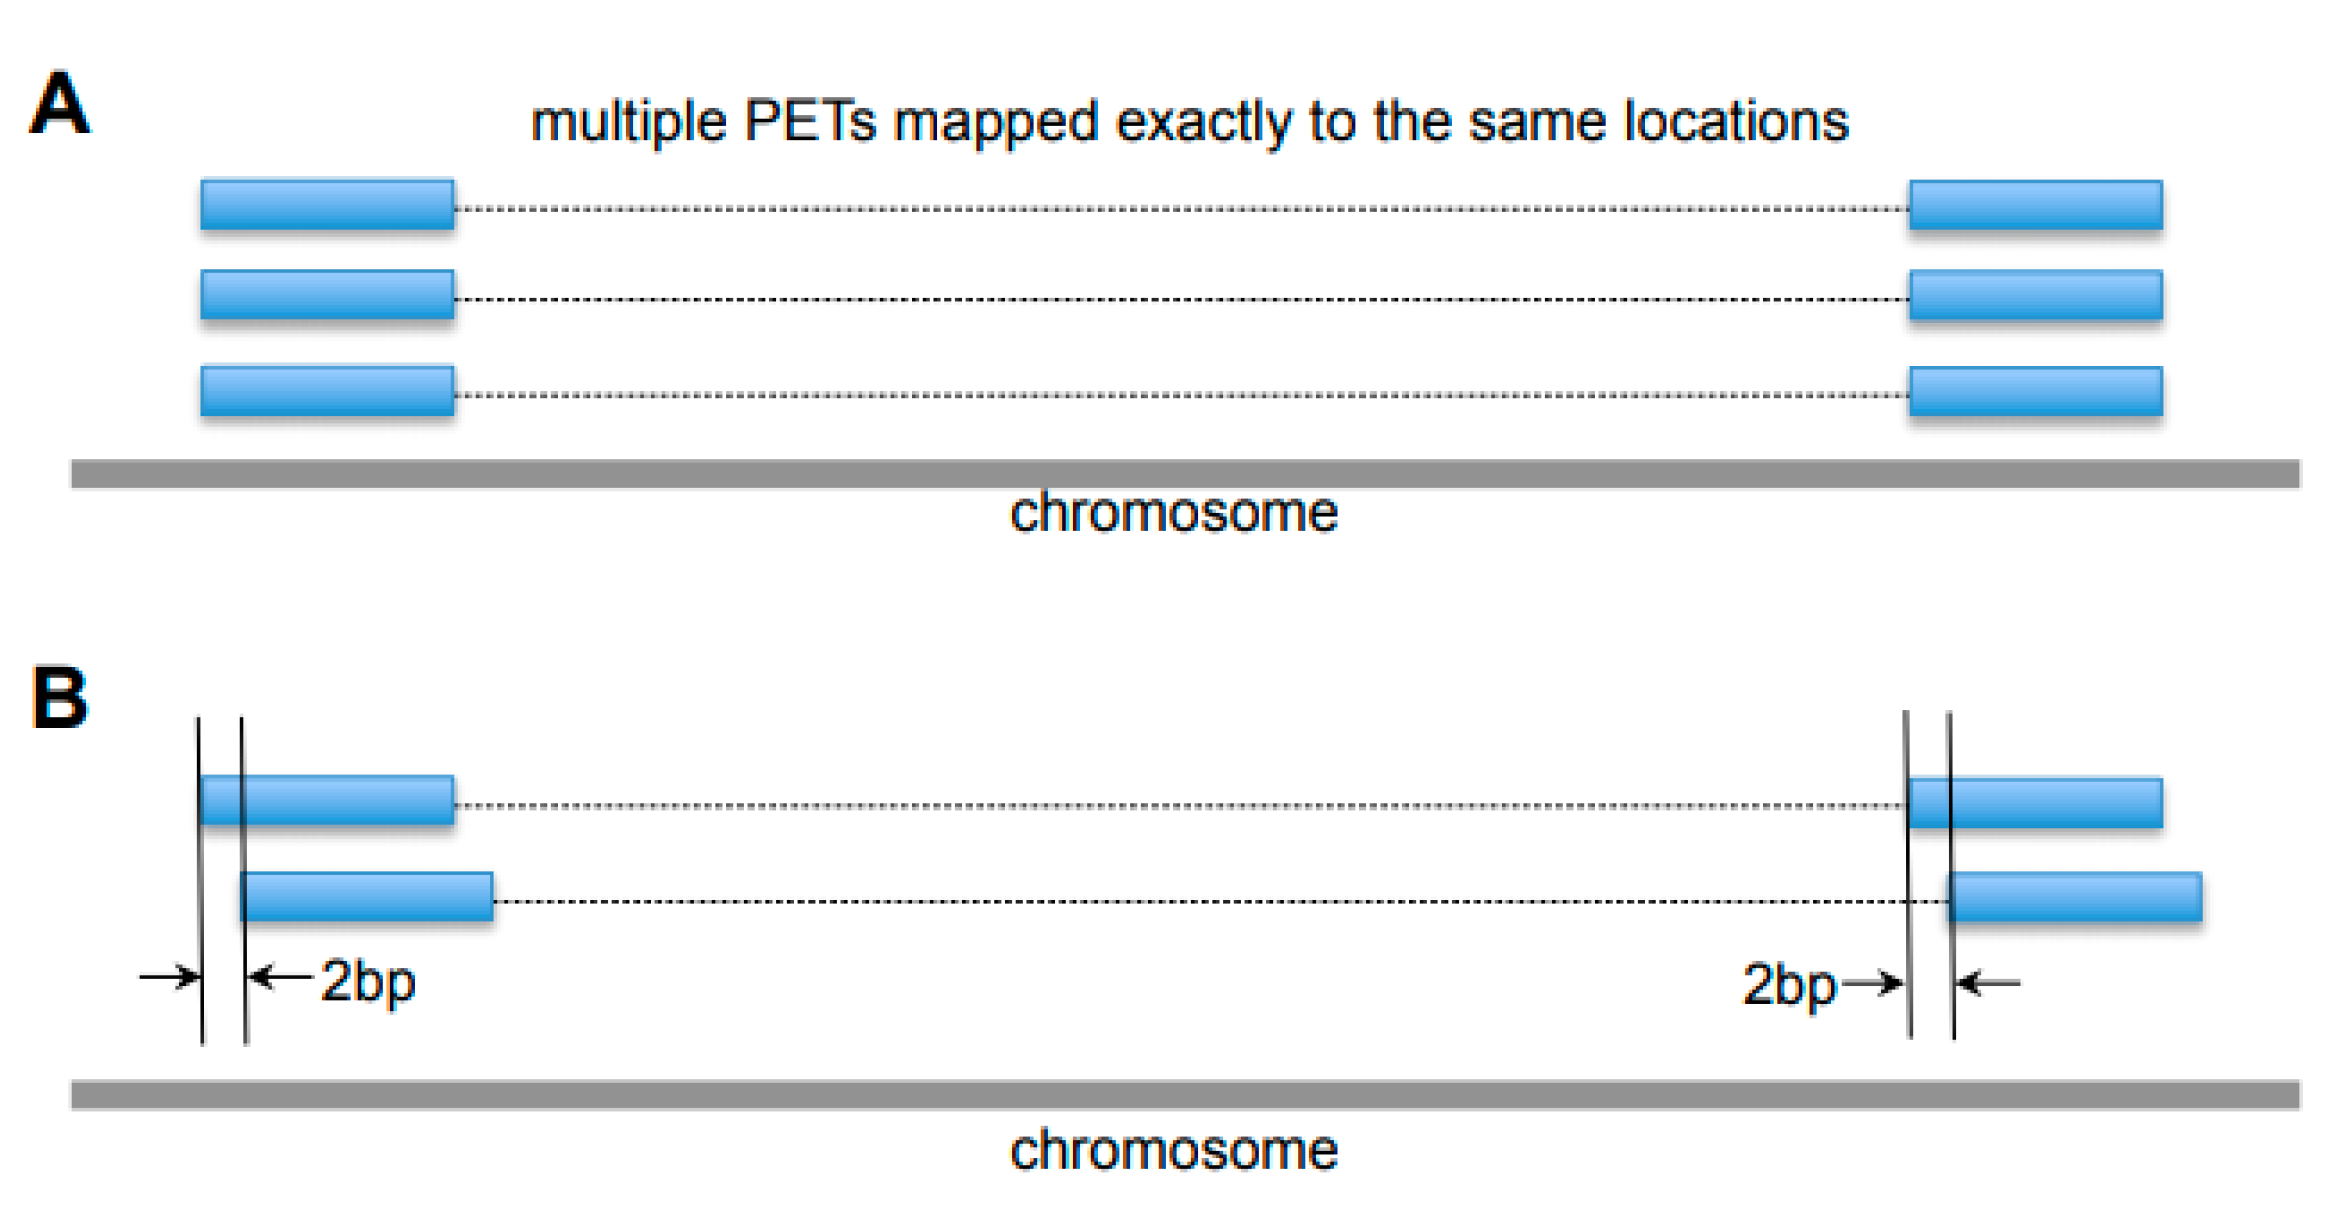
Figure 5.
Examples of noises in the ChIA-PET data. (A) Duplicates of Paired-End Tags (PETs) from Polymerase Chain Reaction (PCR) amplification, which are mapped exactly to the same locations. (B) Different PETs with tags within 2 bp at both ends.
Figure 5.
Examples of noises in the ChIA-PET data. (A) Duplicates of Paired-End Tags (PETs) from Polymerase Chain Reaction (PCR) amplification, which are mapped exactly to the same locations. (B) Different PETs with tags within 2 bp at both ends.
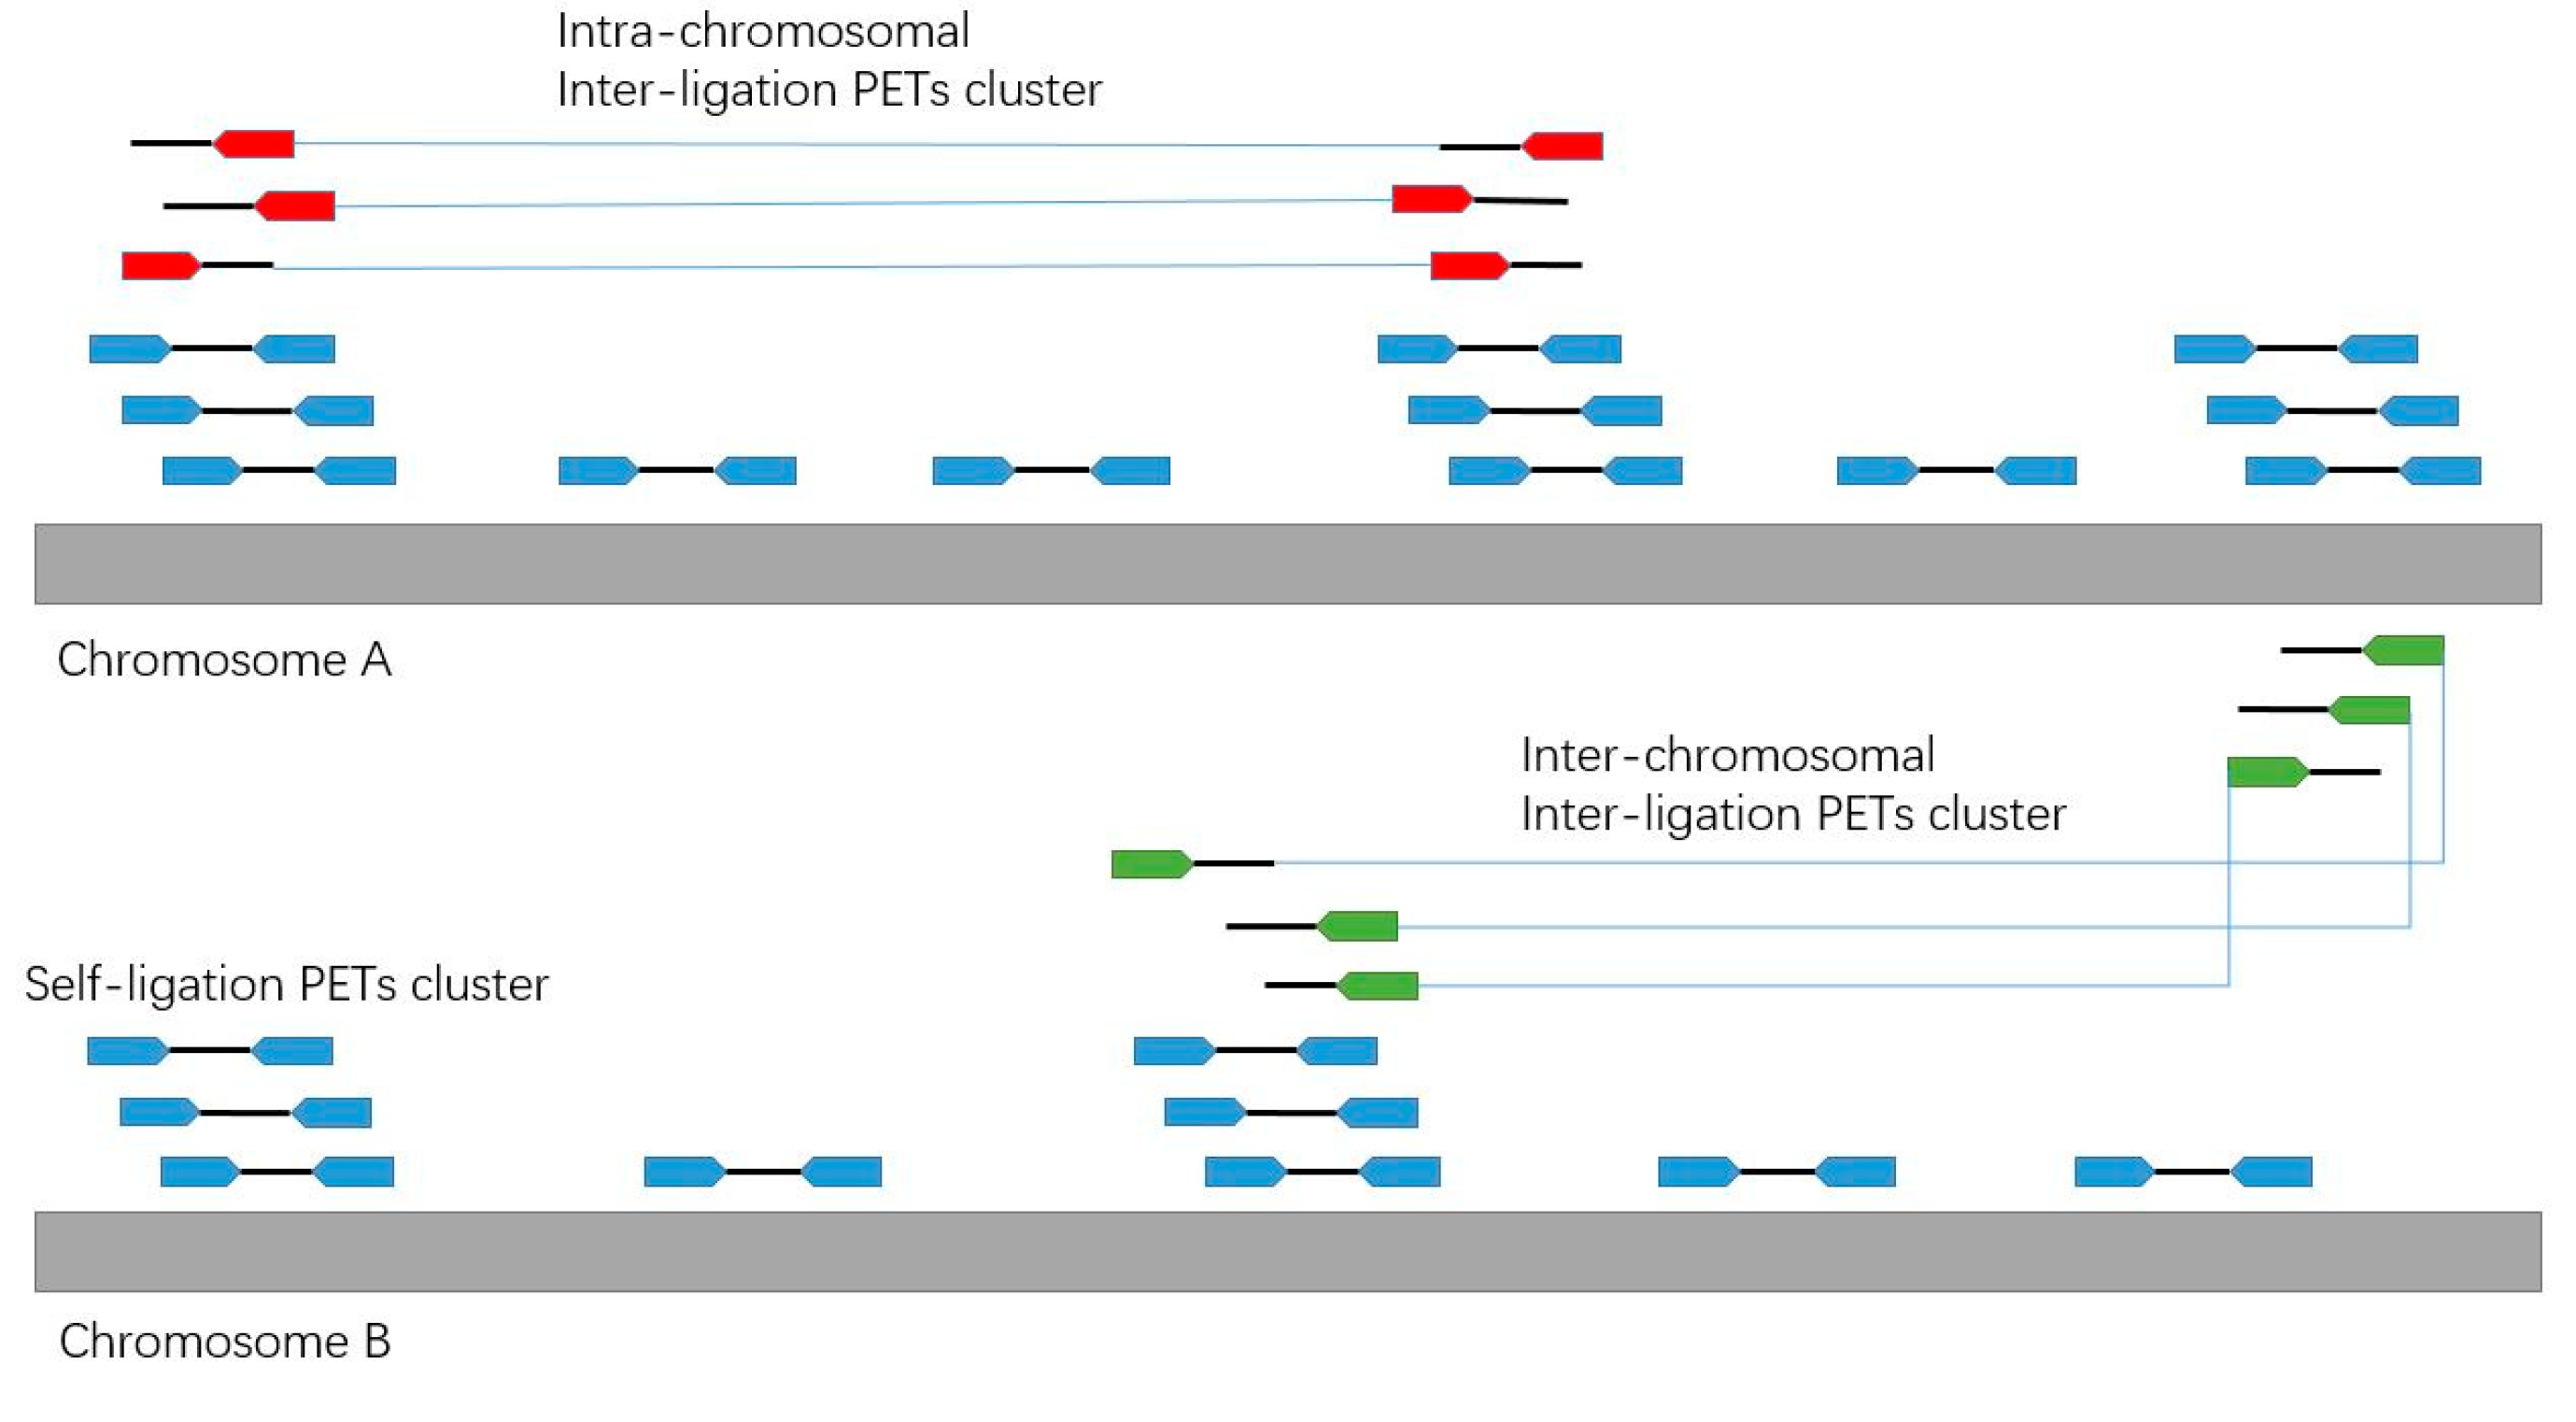
Figure 6.
Illustration of the different categories of PETs.
Figure 6.
Illustration of the different categories of PETs.
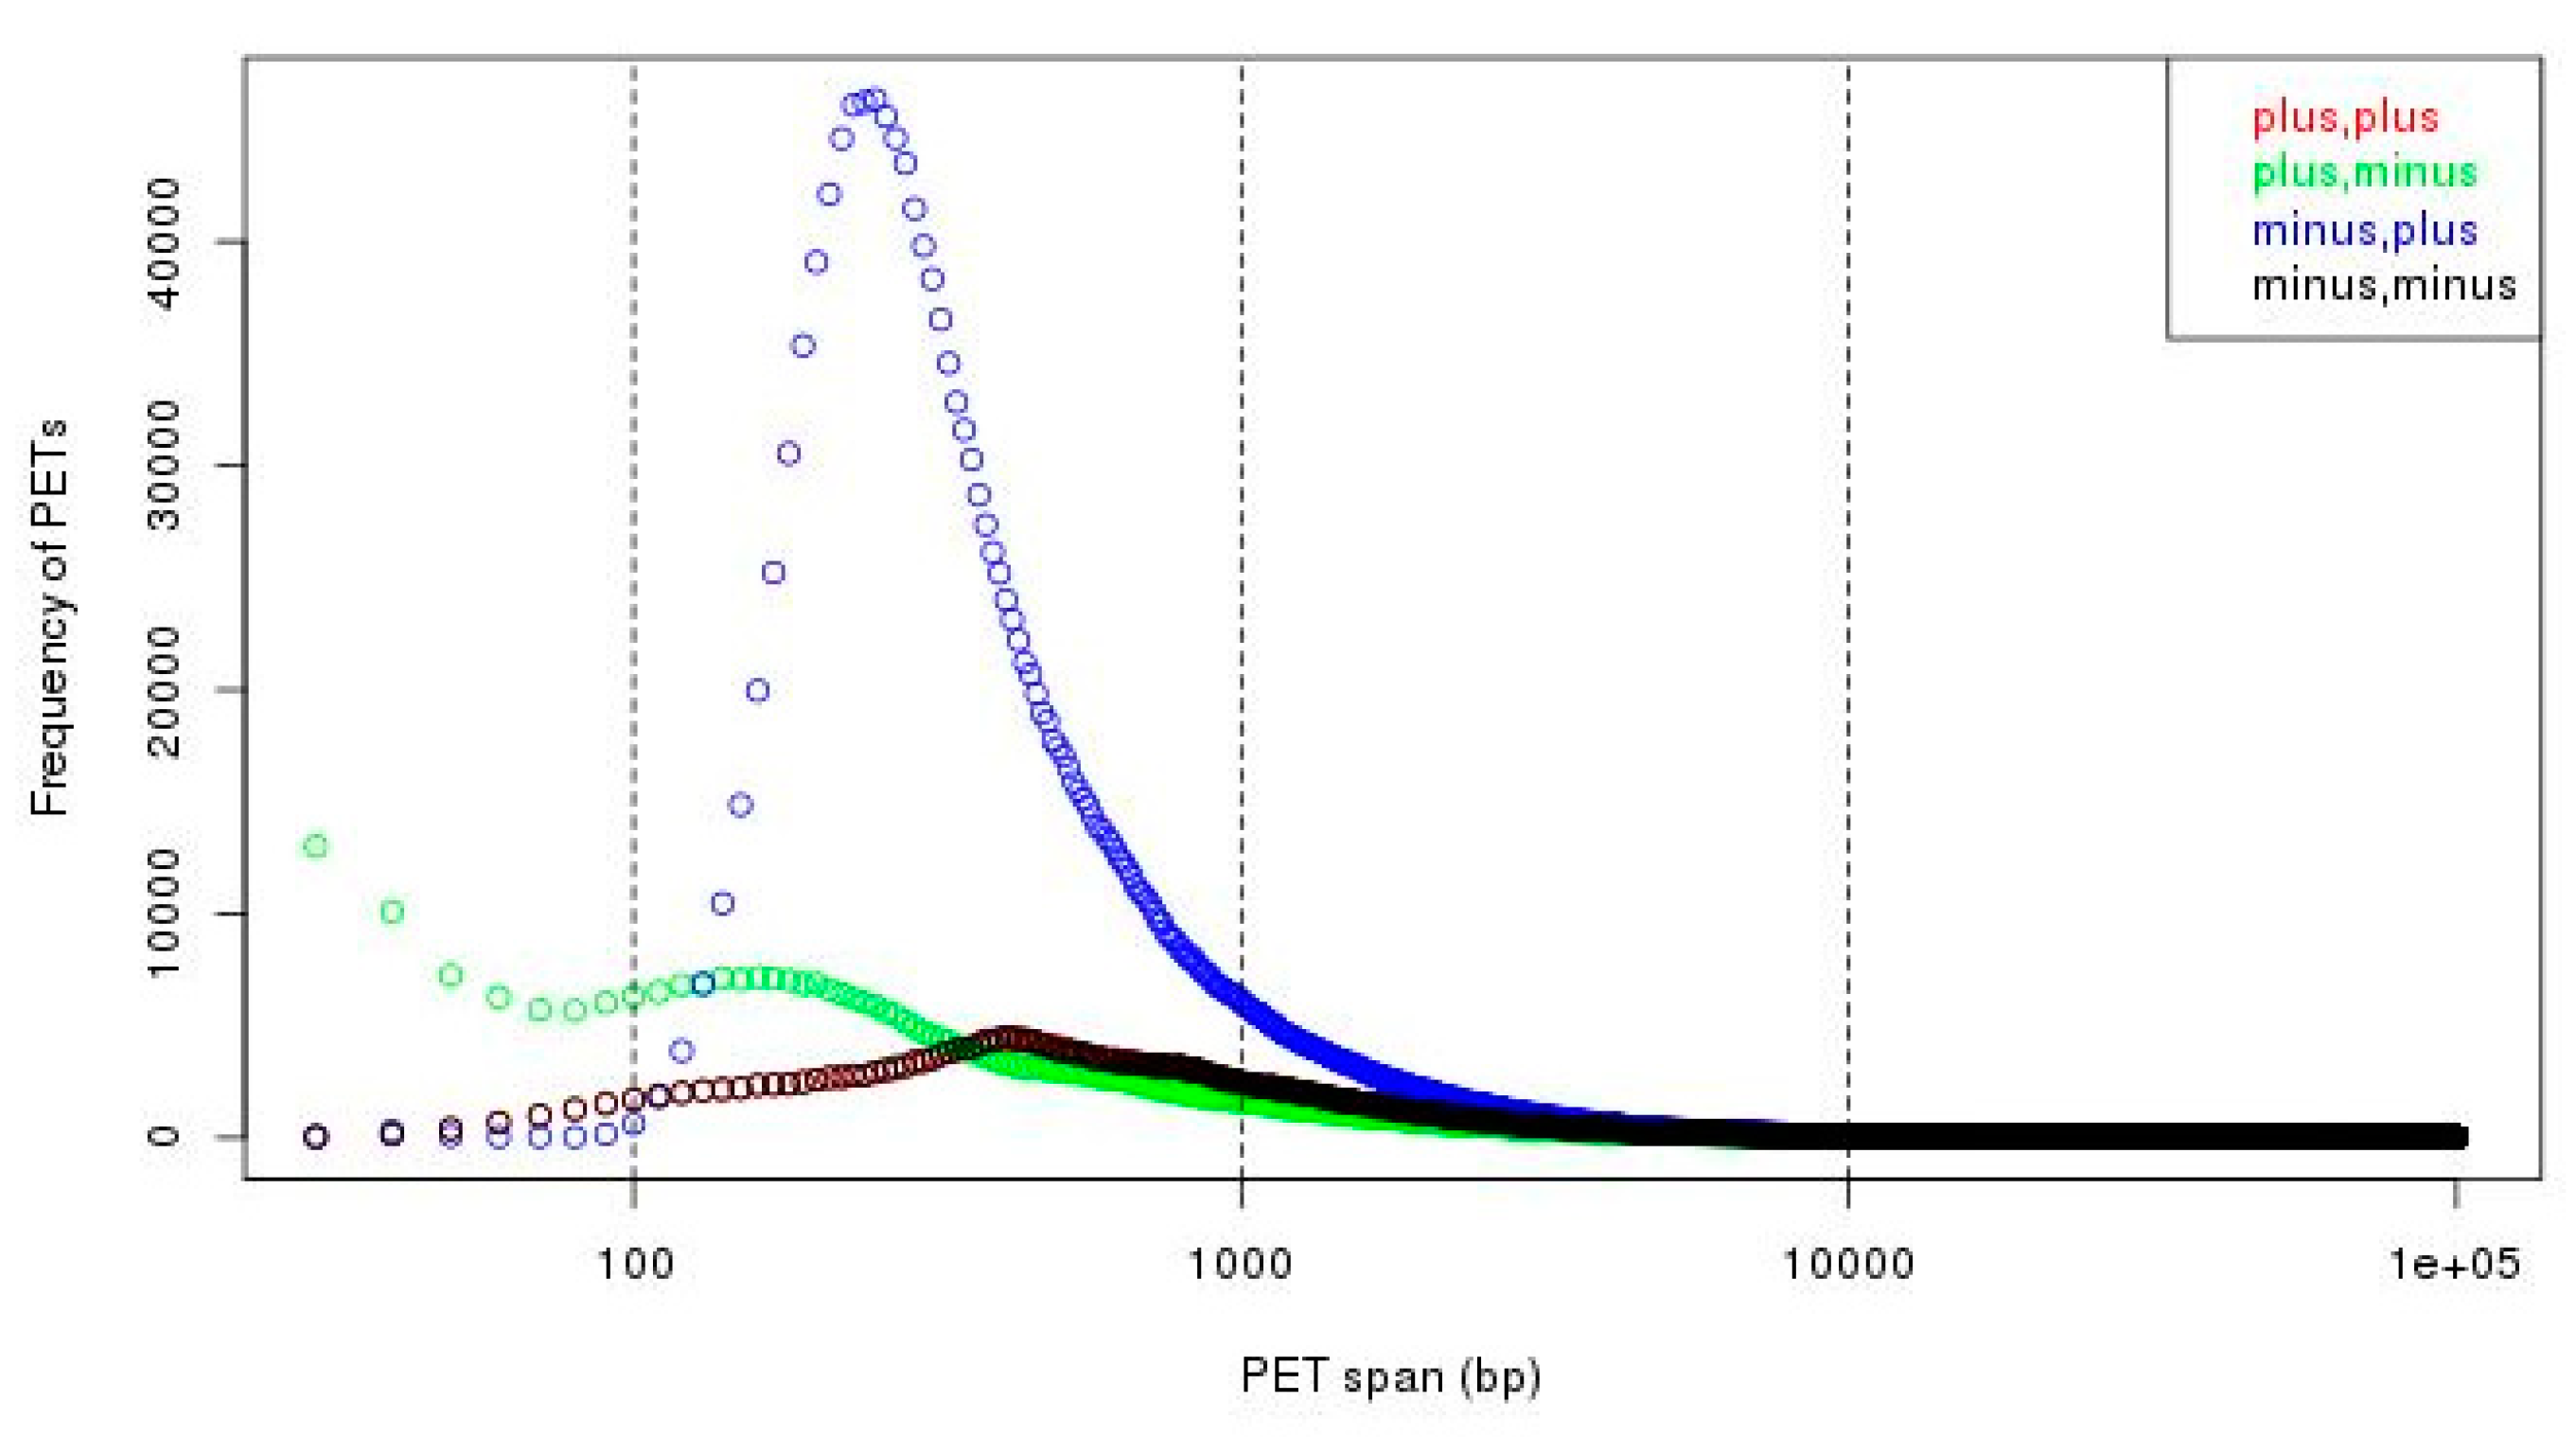
Figure 7.
Genomic span distributions from different strand compositions. We can see that there are much more PETs with minus-plus (−/+) strand composition in short span (less than 10 kb, especially less than 1 kb).
Figure 7.
Genomic span distributions from different strand compositions. We can see that there are much more PETs with minus-plus (−/+) strand composition in short span (less than 10 kb, especially less than 1 kb).
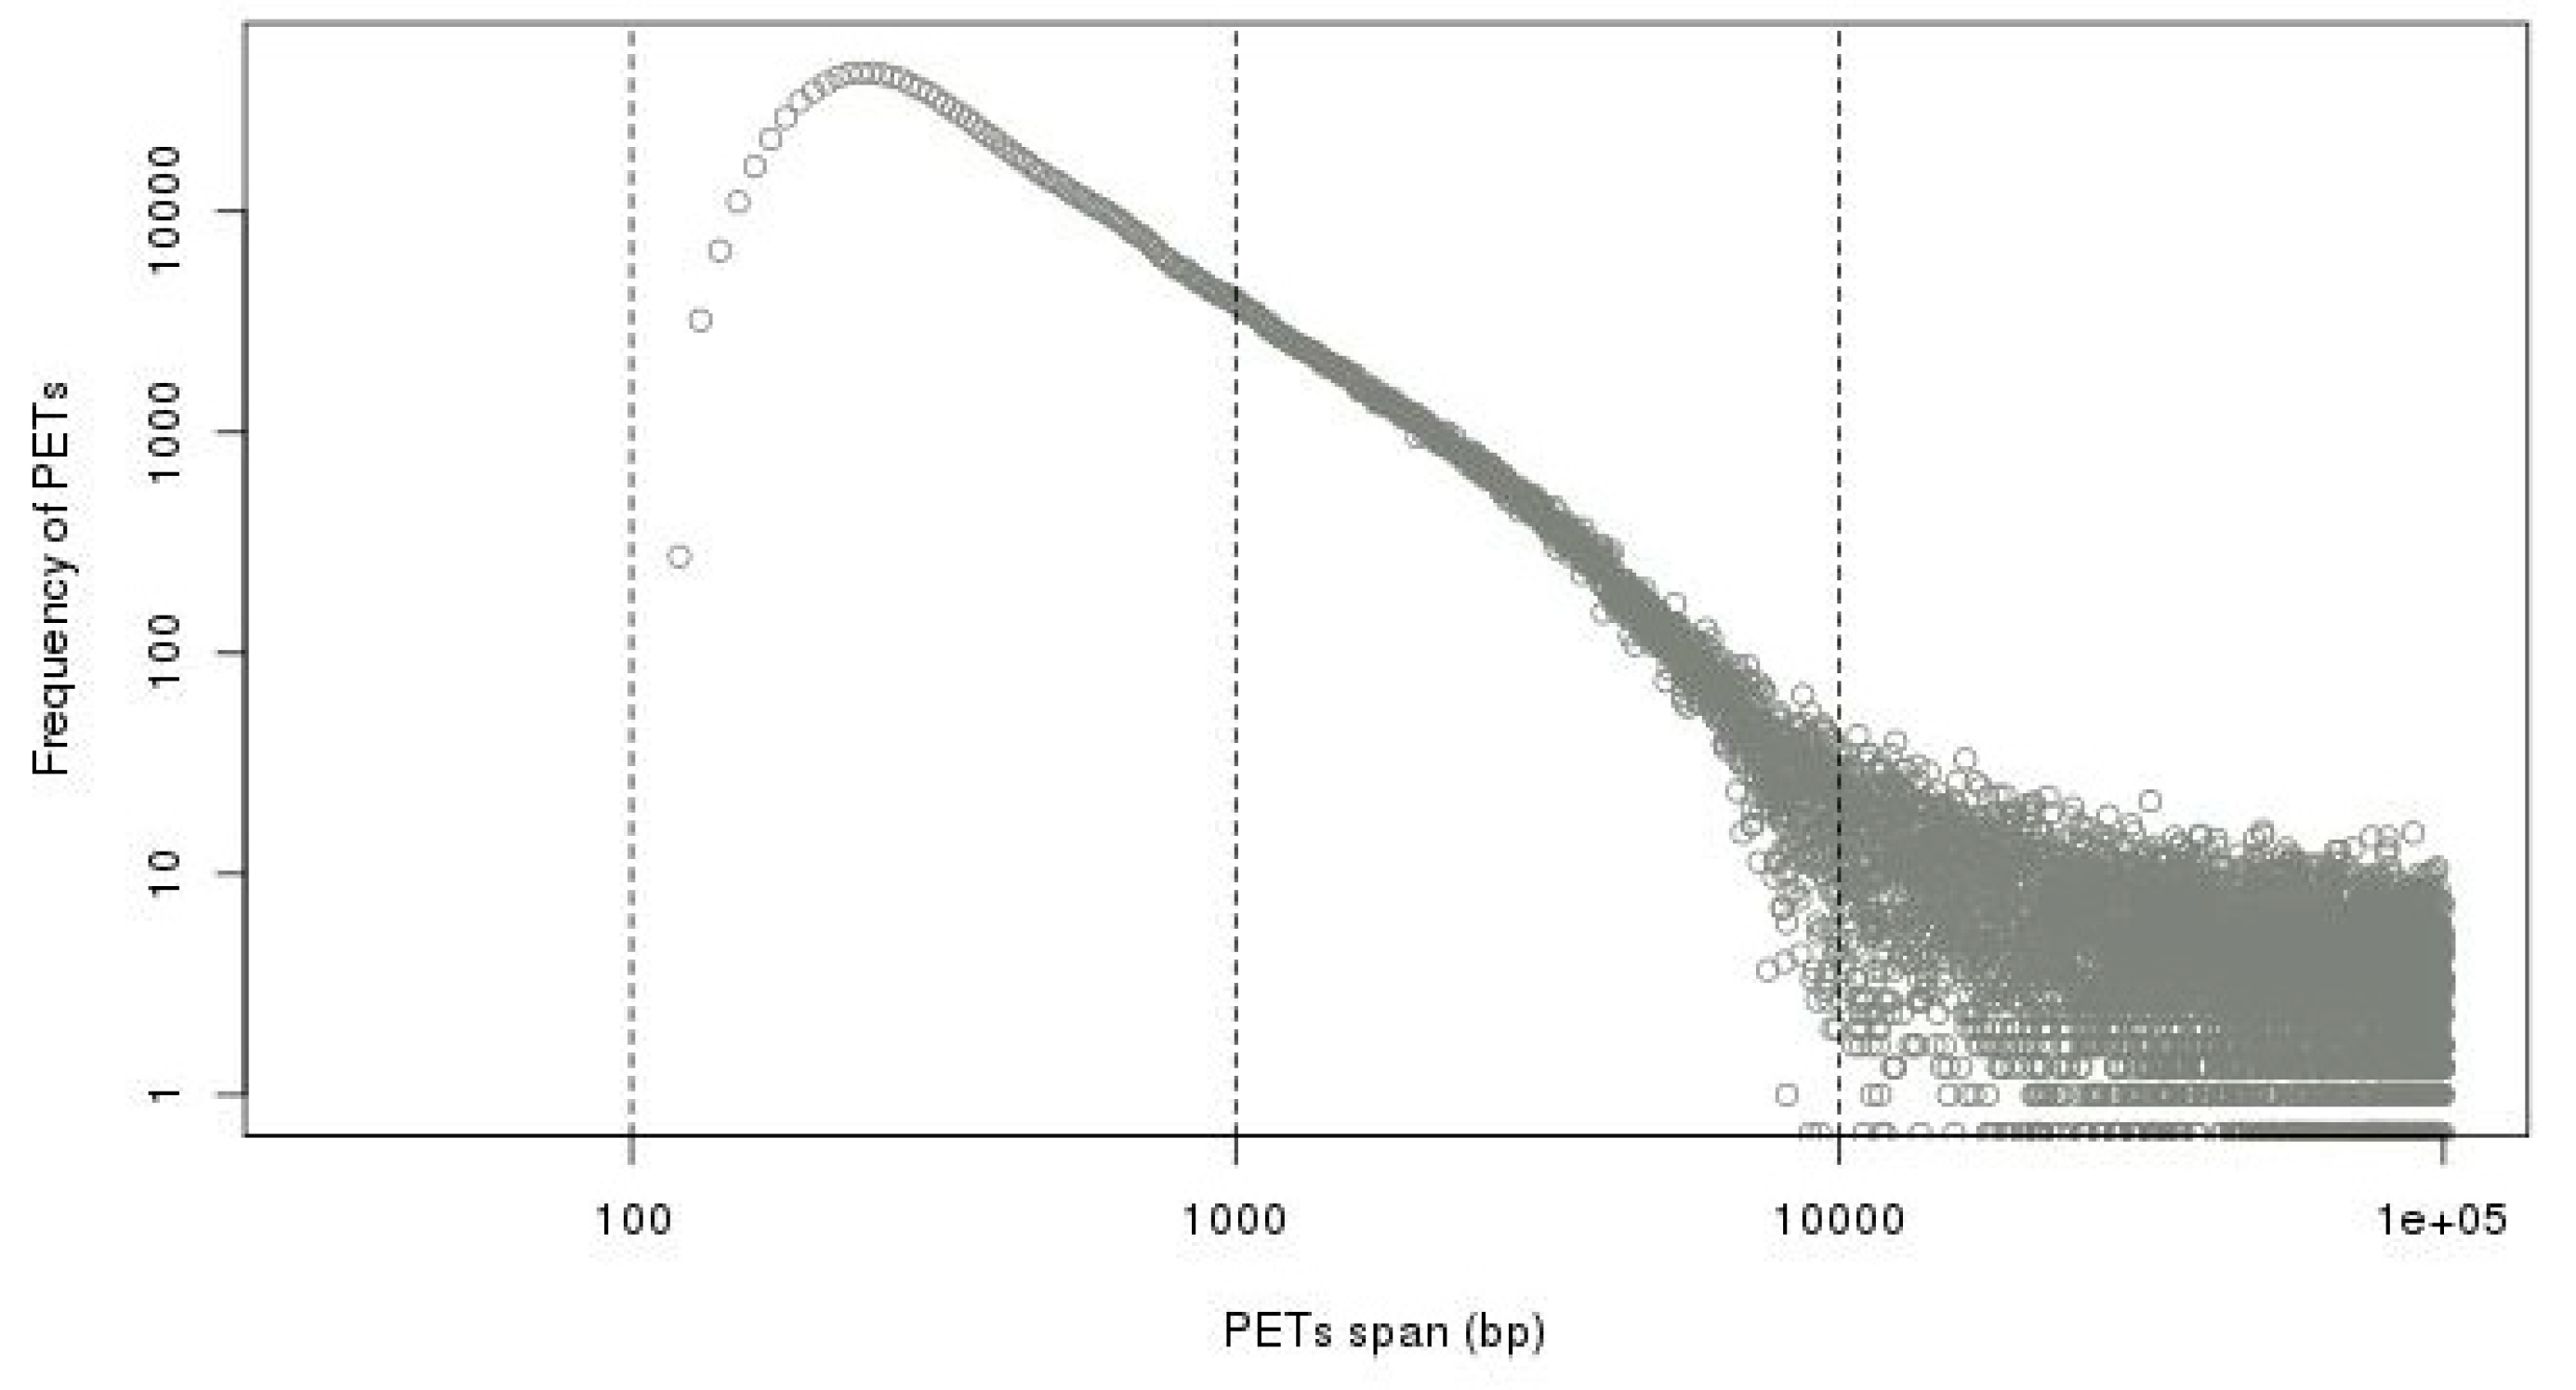
Figure 8.
Difference of genomic span distributions from minus-plus (−/+) strand composition and average distribution from other strand compositions in log-log plot. It shows that the self-ligation cutoff is around 8 kb.
Figure 8.
Difference of genomic span distributions from minus-plus (−/+) strand composition and average distribution from other strand compositions in log-log plot. It shows that the self-ligation cutoff is around 8 kb.
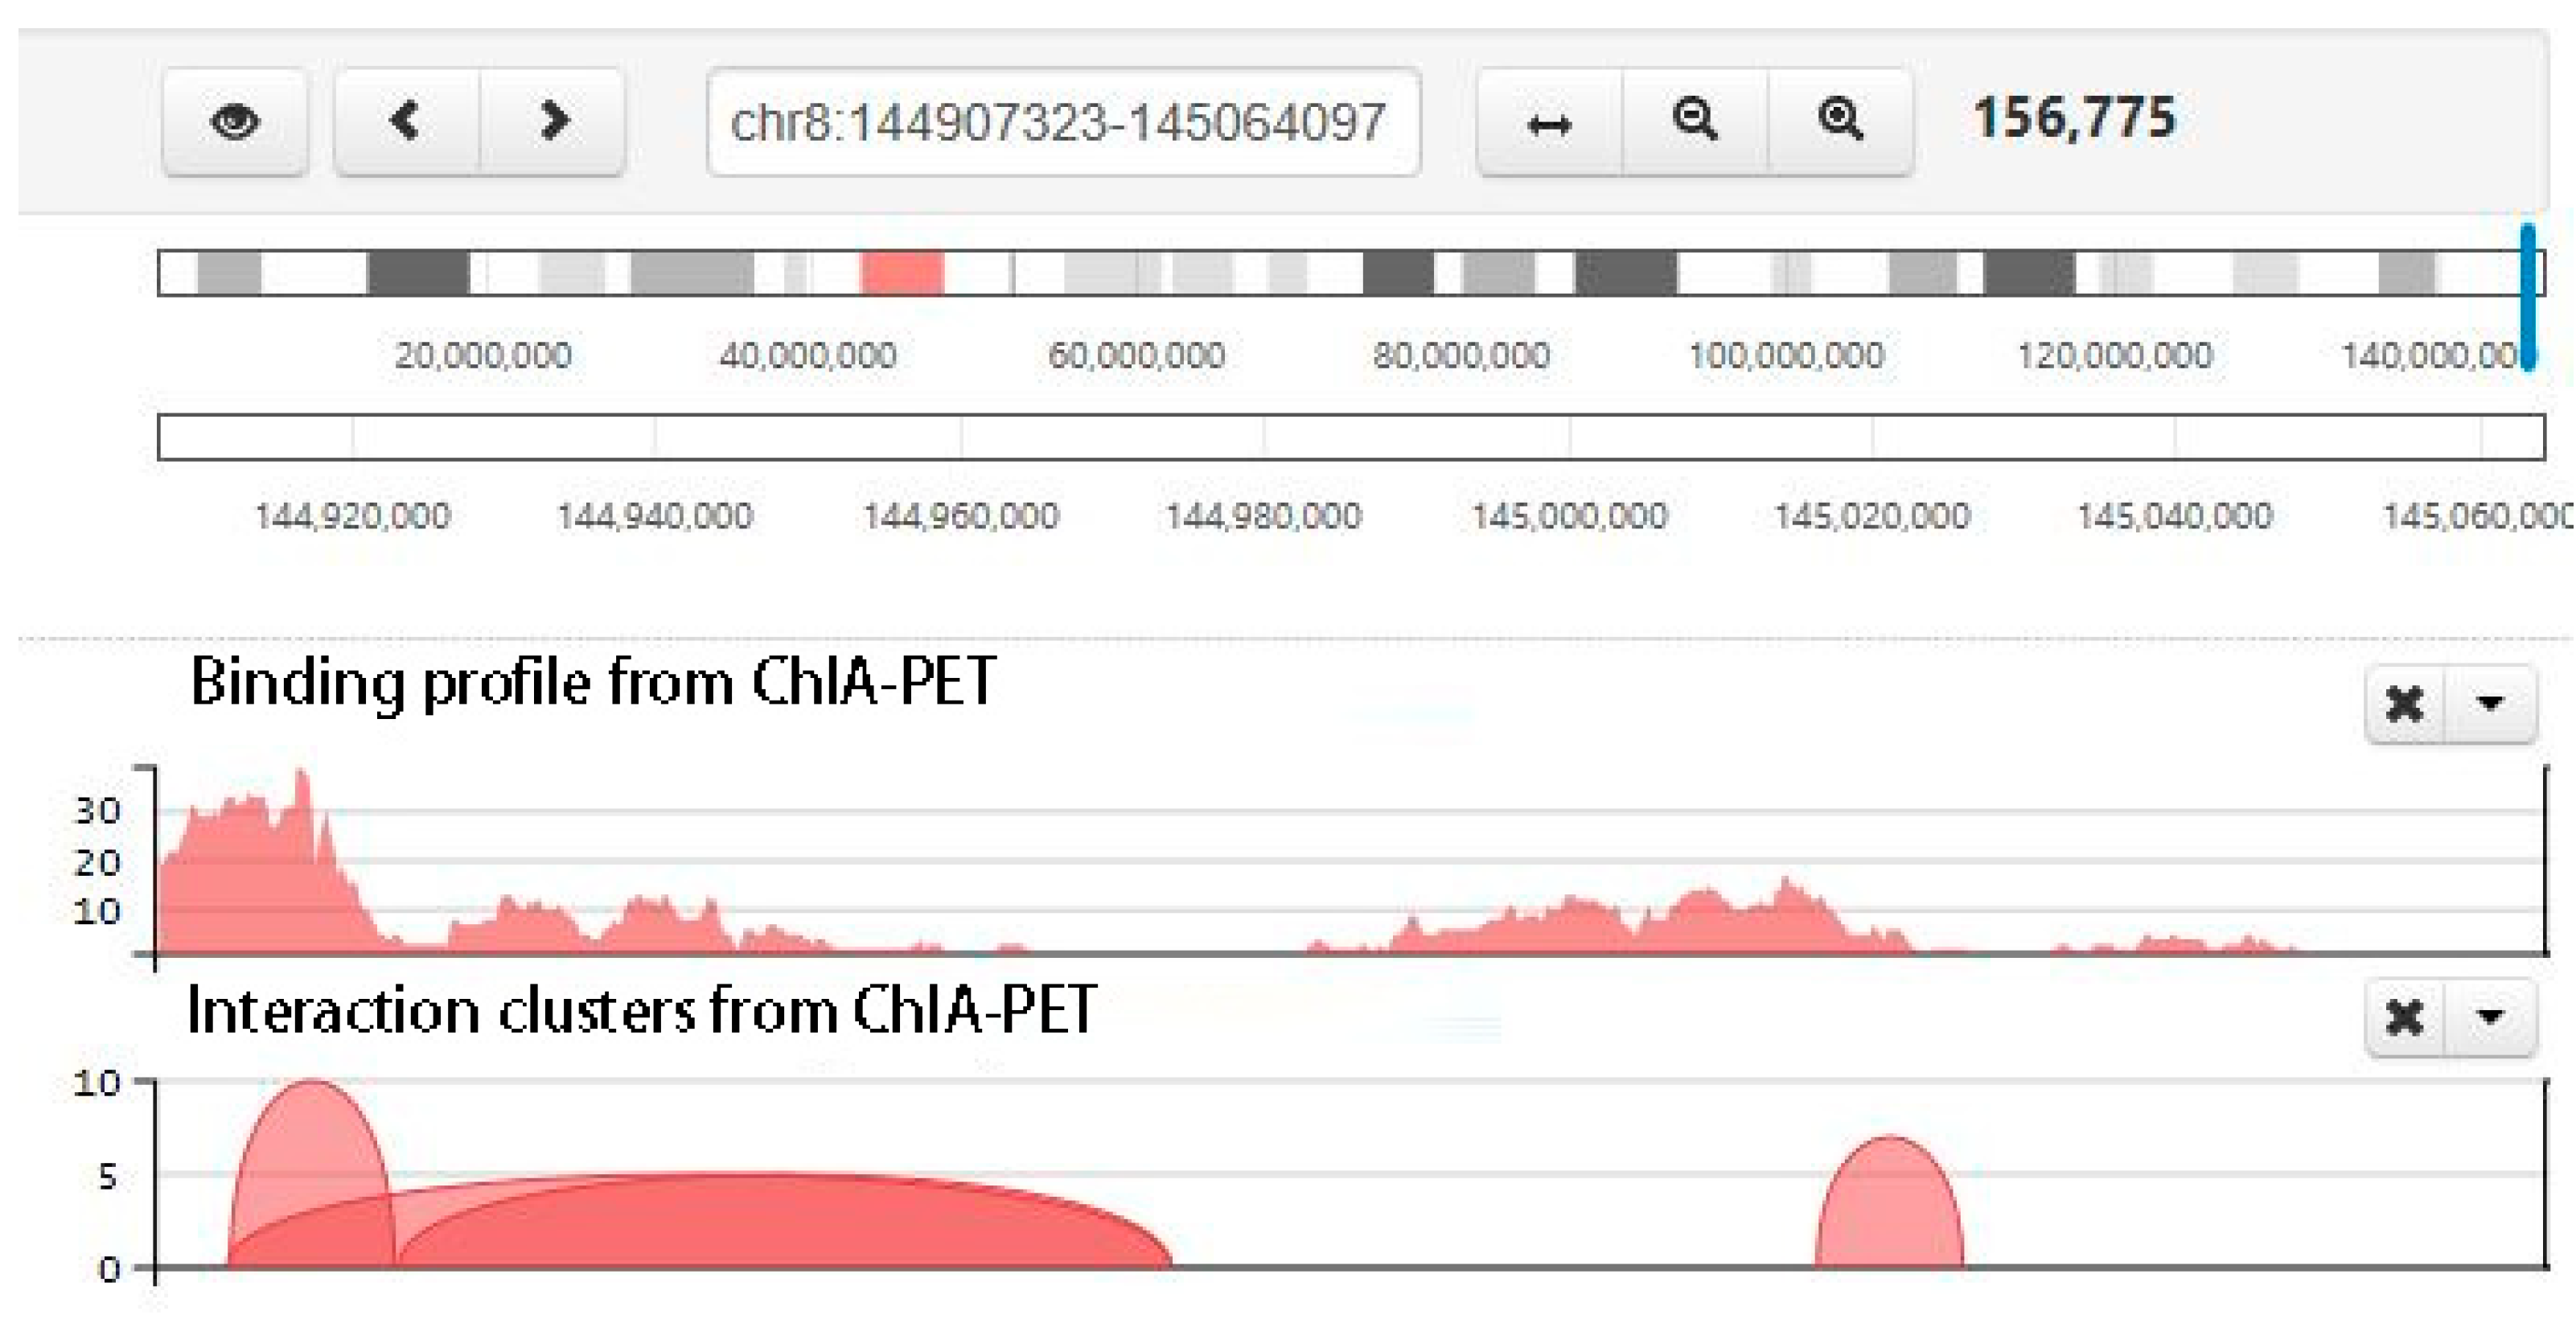
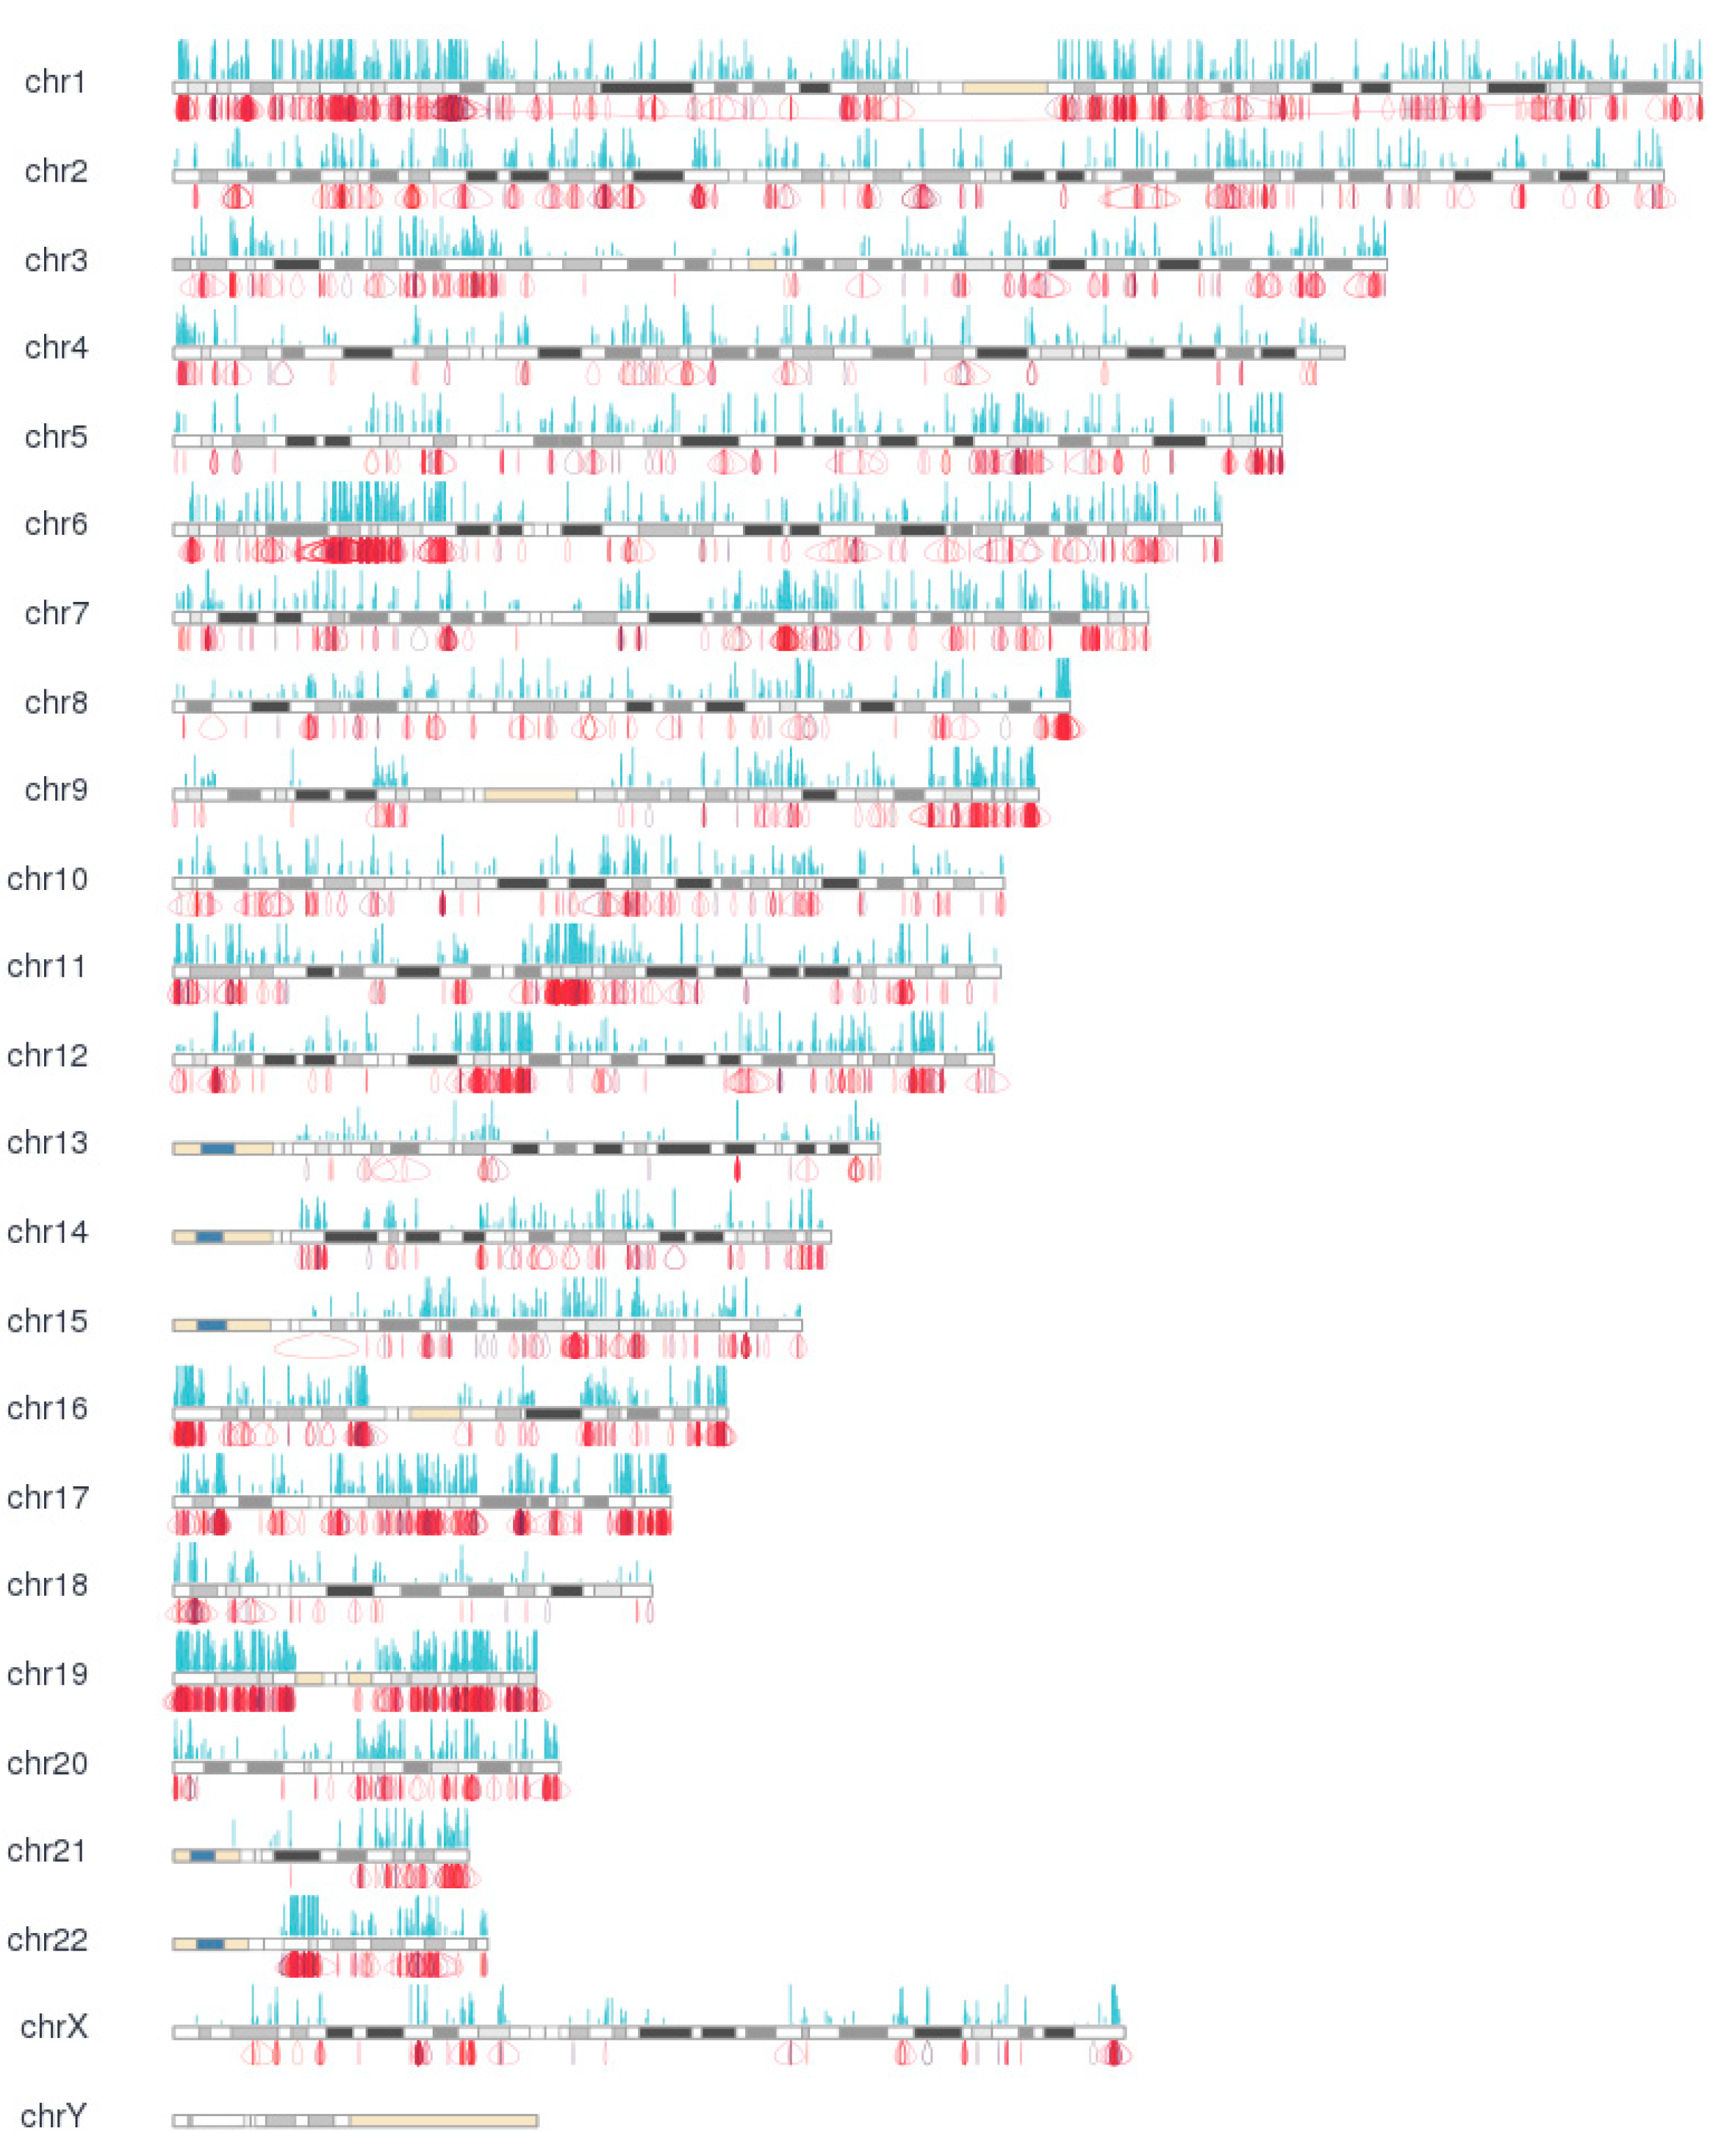
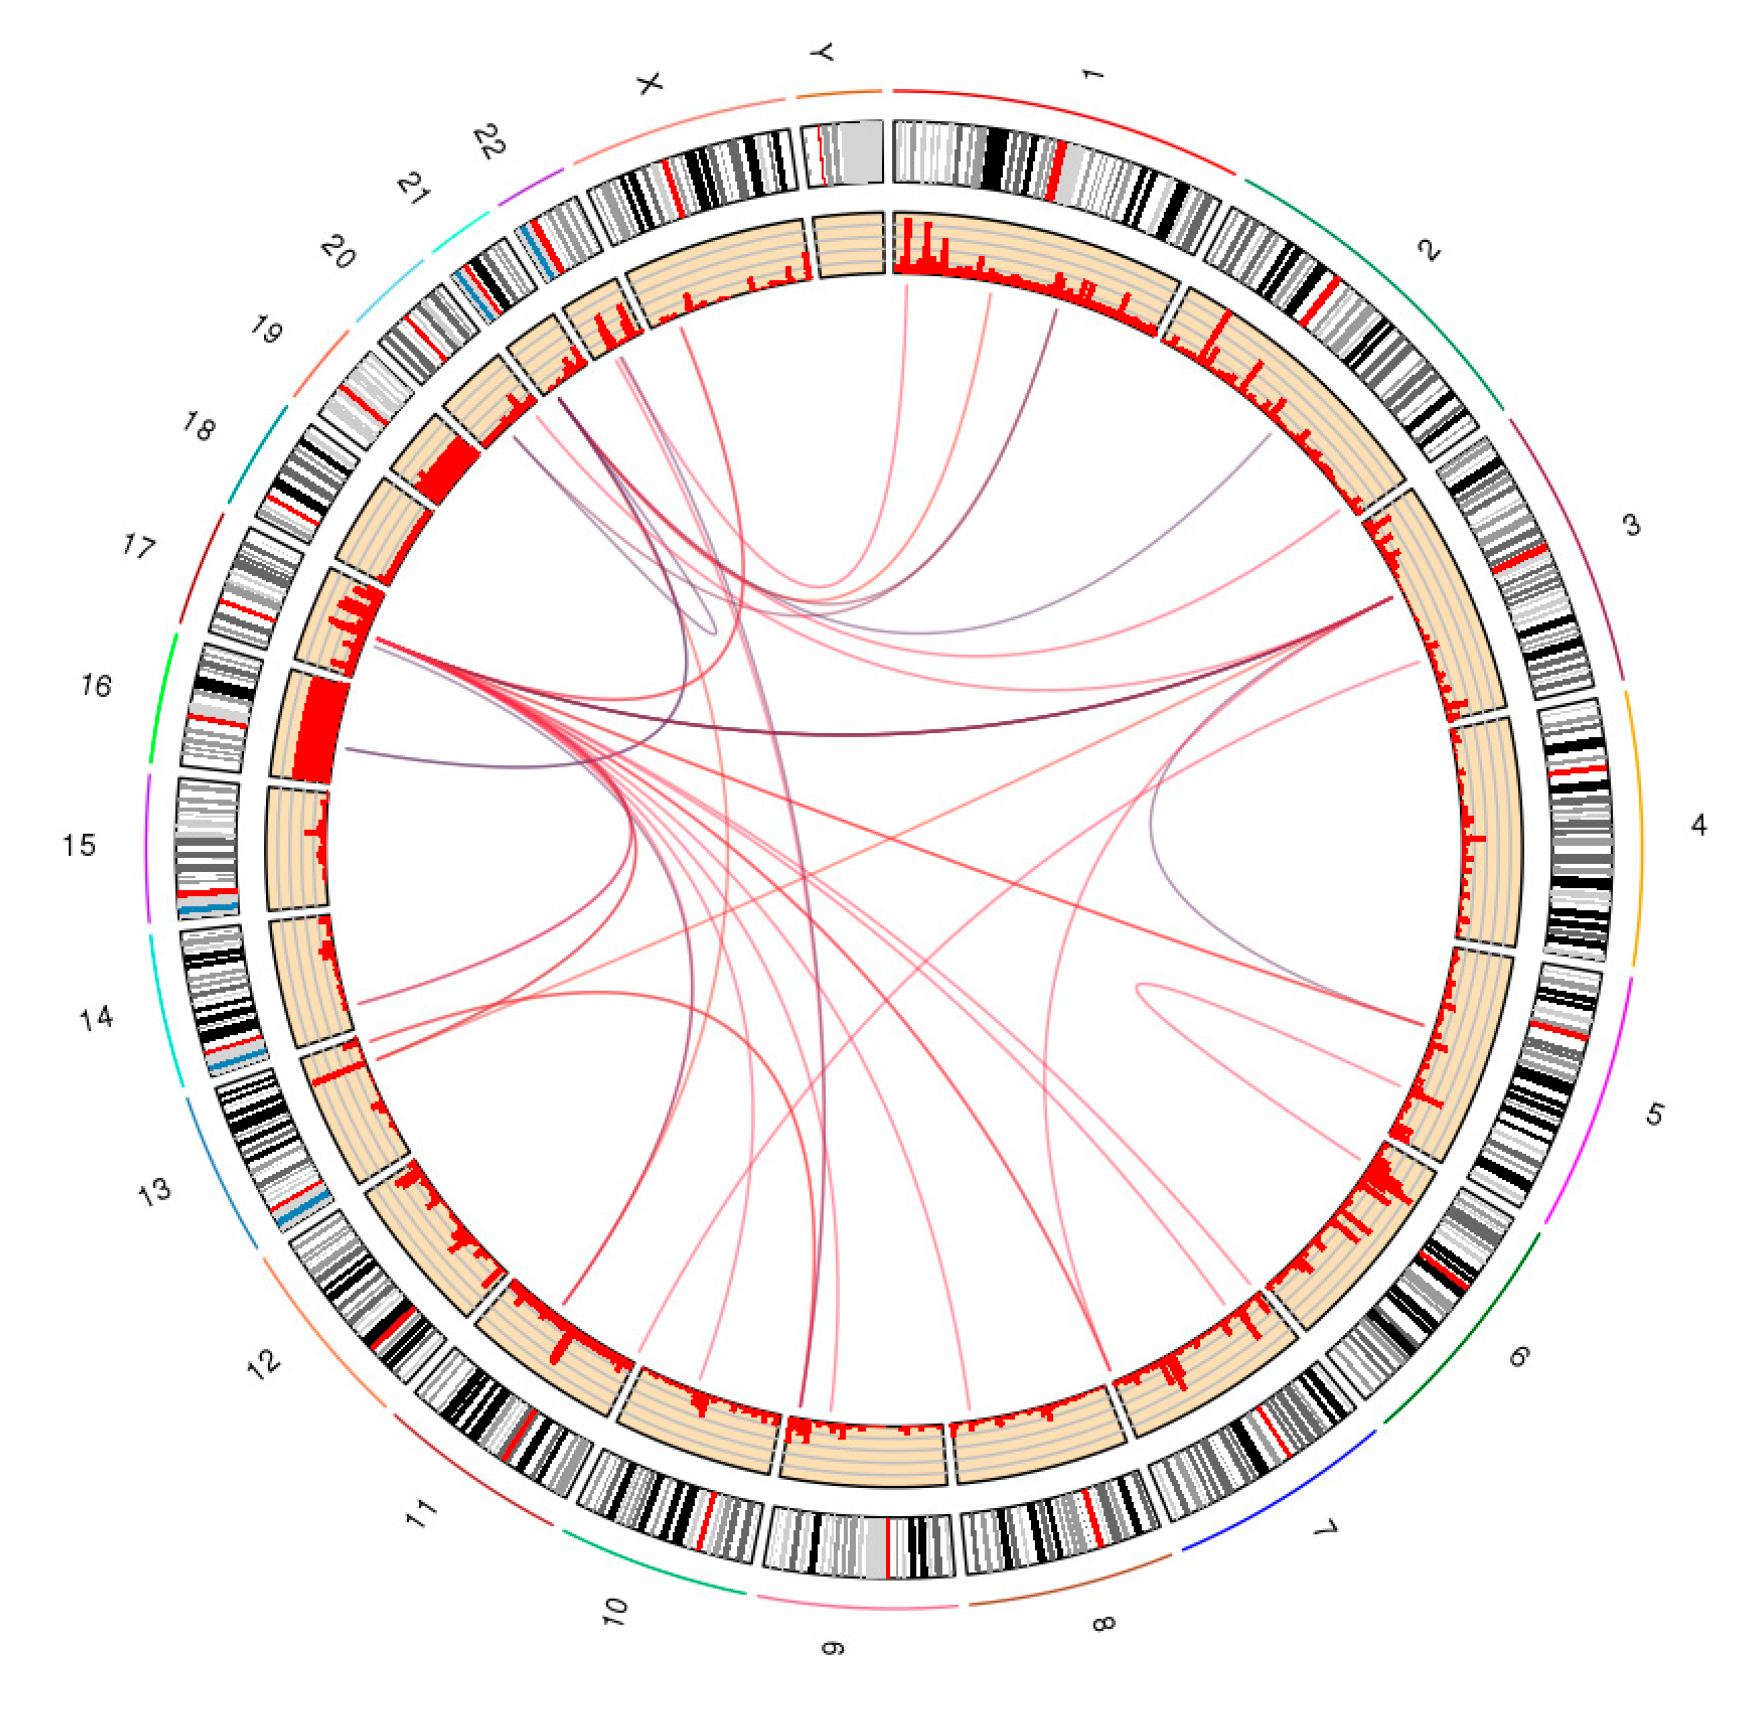
Figure 9.
Screenshot of chromatin clusters and protein-binding peaks from ChIA-PET. There are multiple tracks, including interaction clusters and binding profile from ChIA-PET. In the interaction cluster track, two ends of each curve are the interaction anchors, and the height of the curve is the pet count between the interaction anchors. The higher the curve, the stronger the interaction.
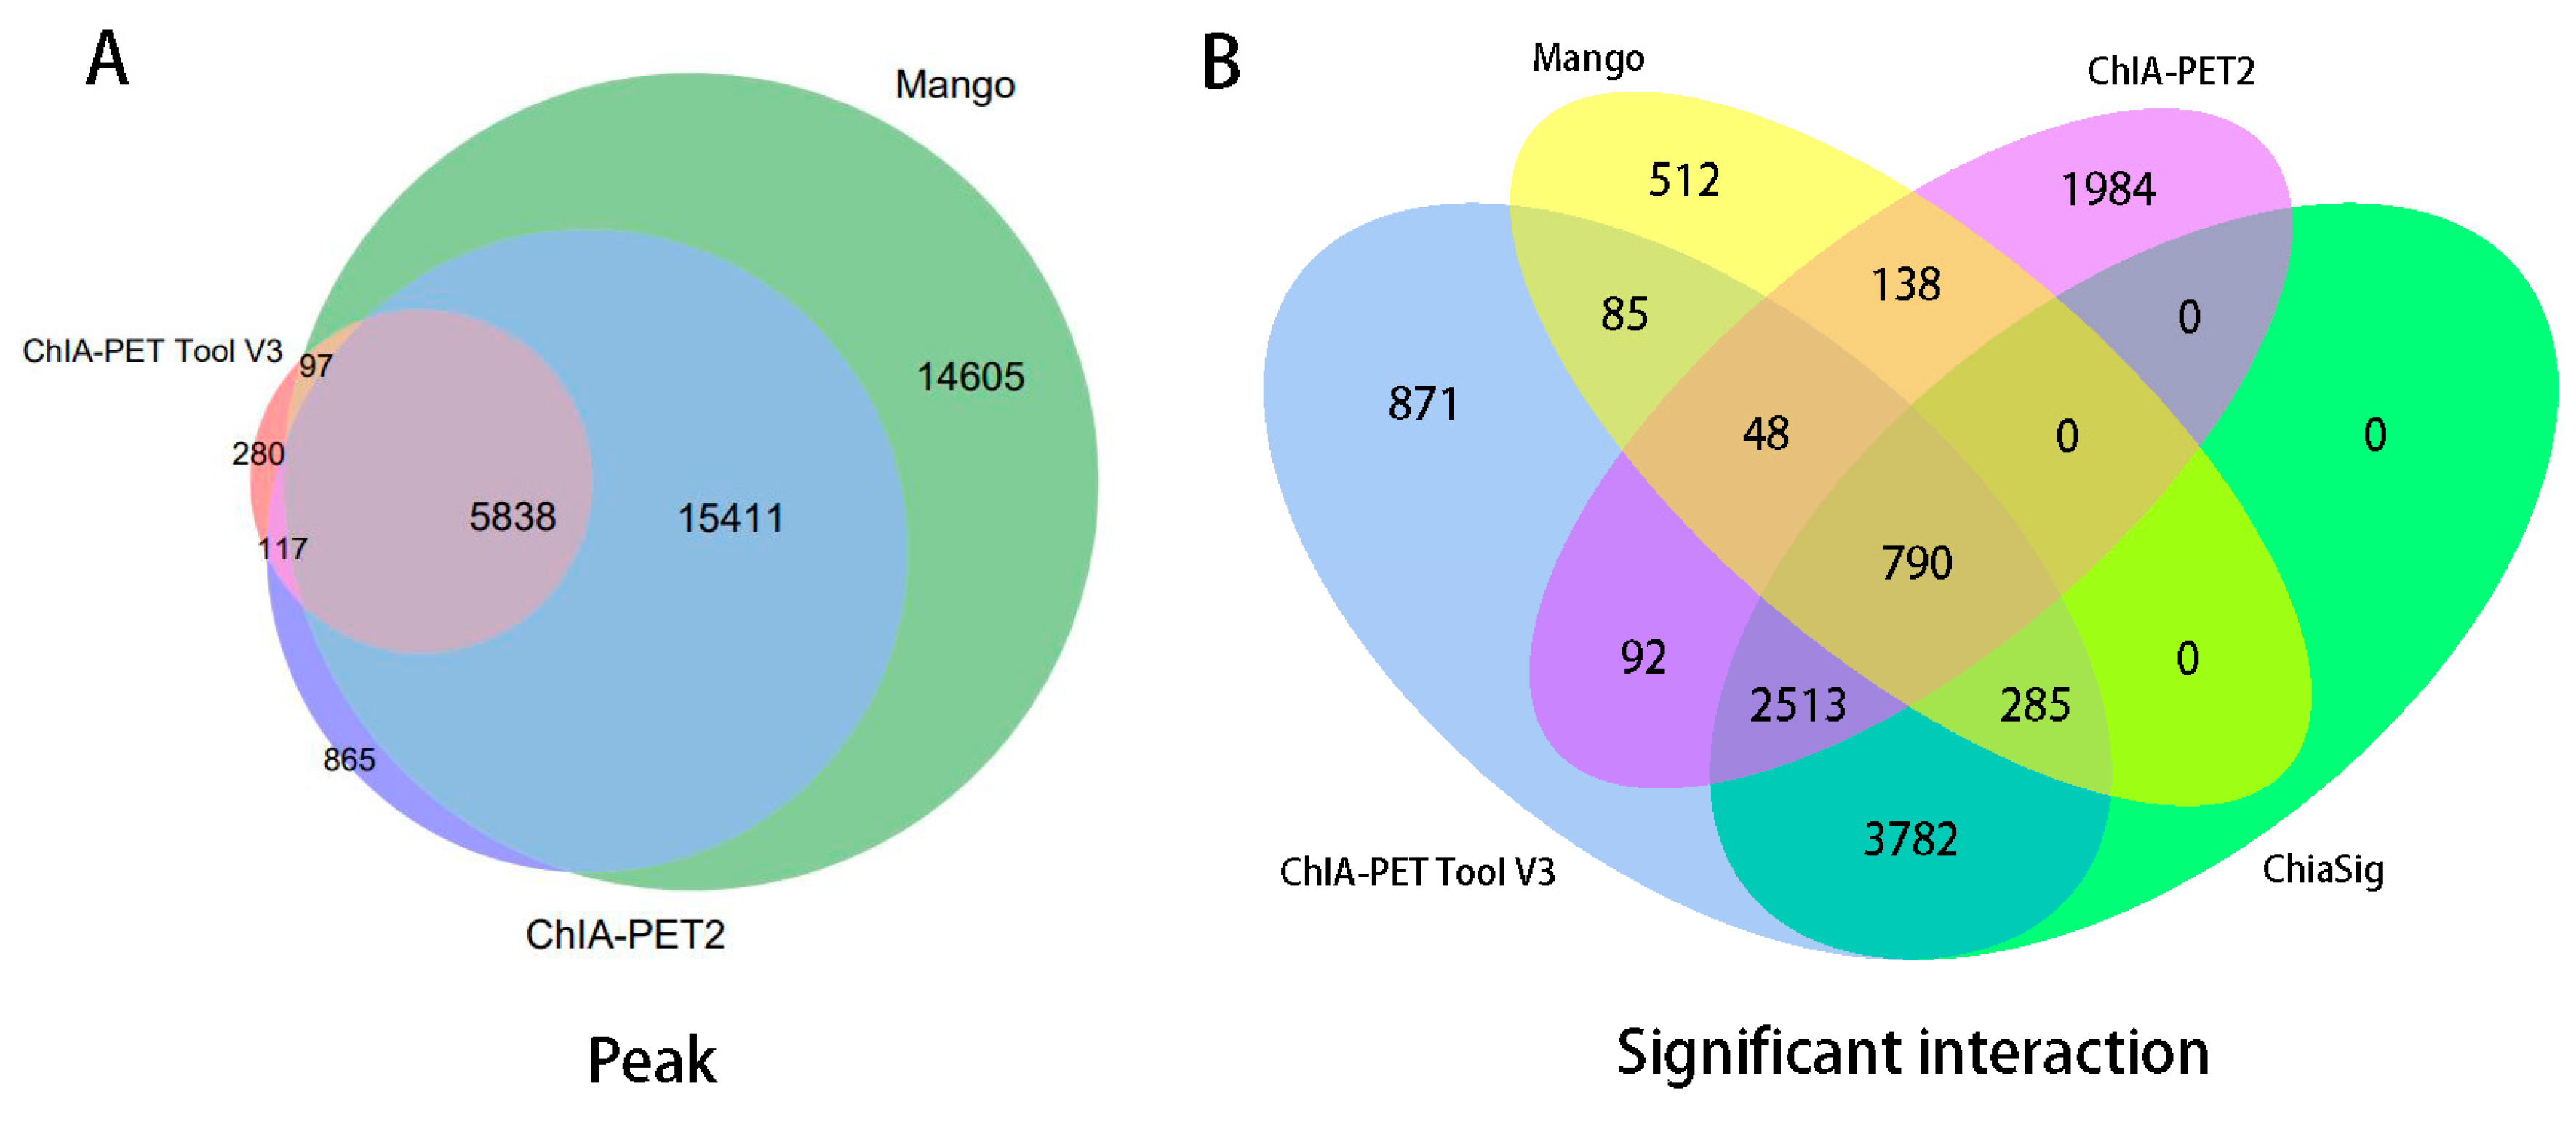
Figure 10.
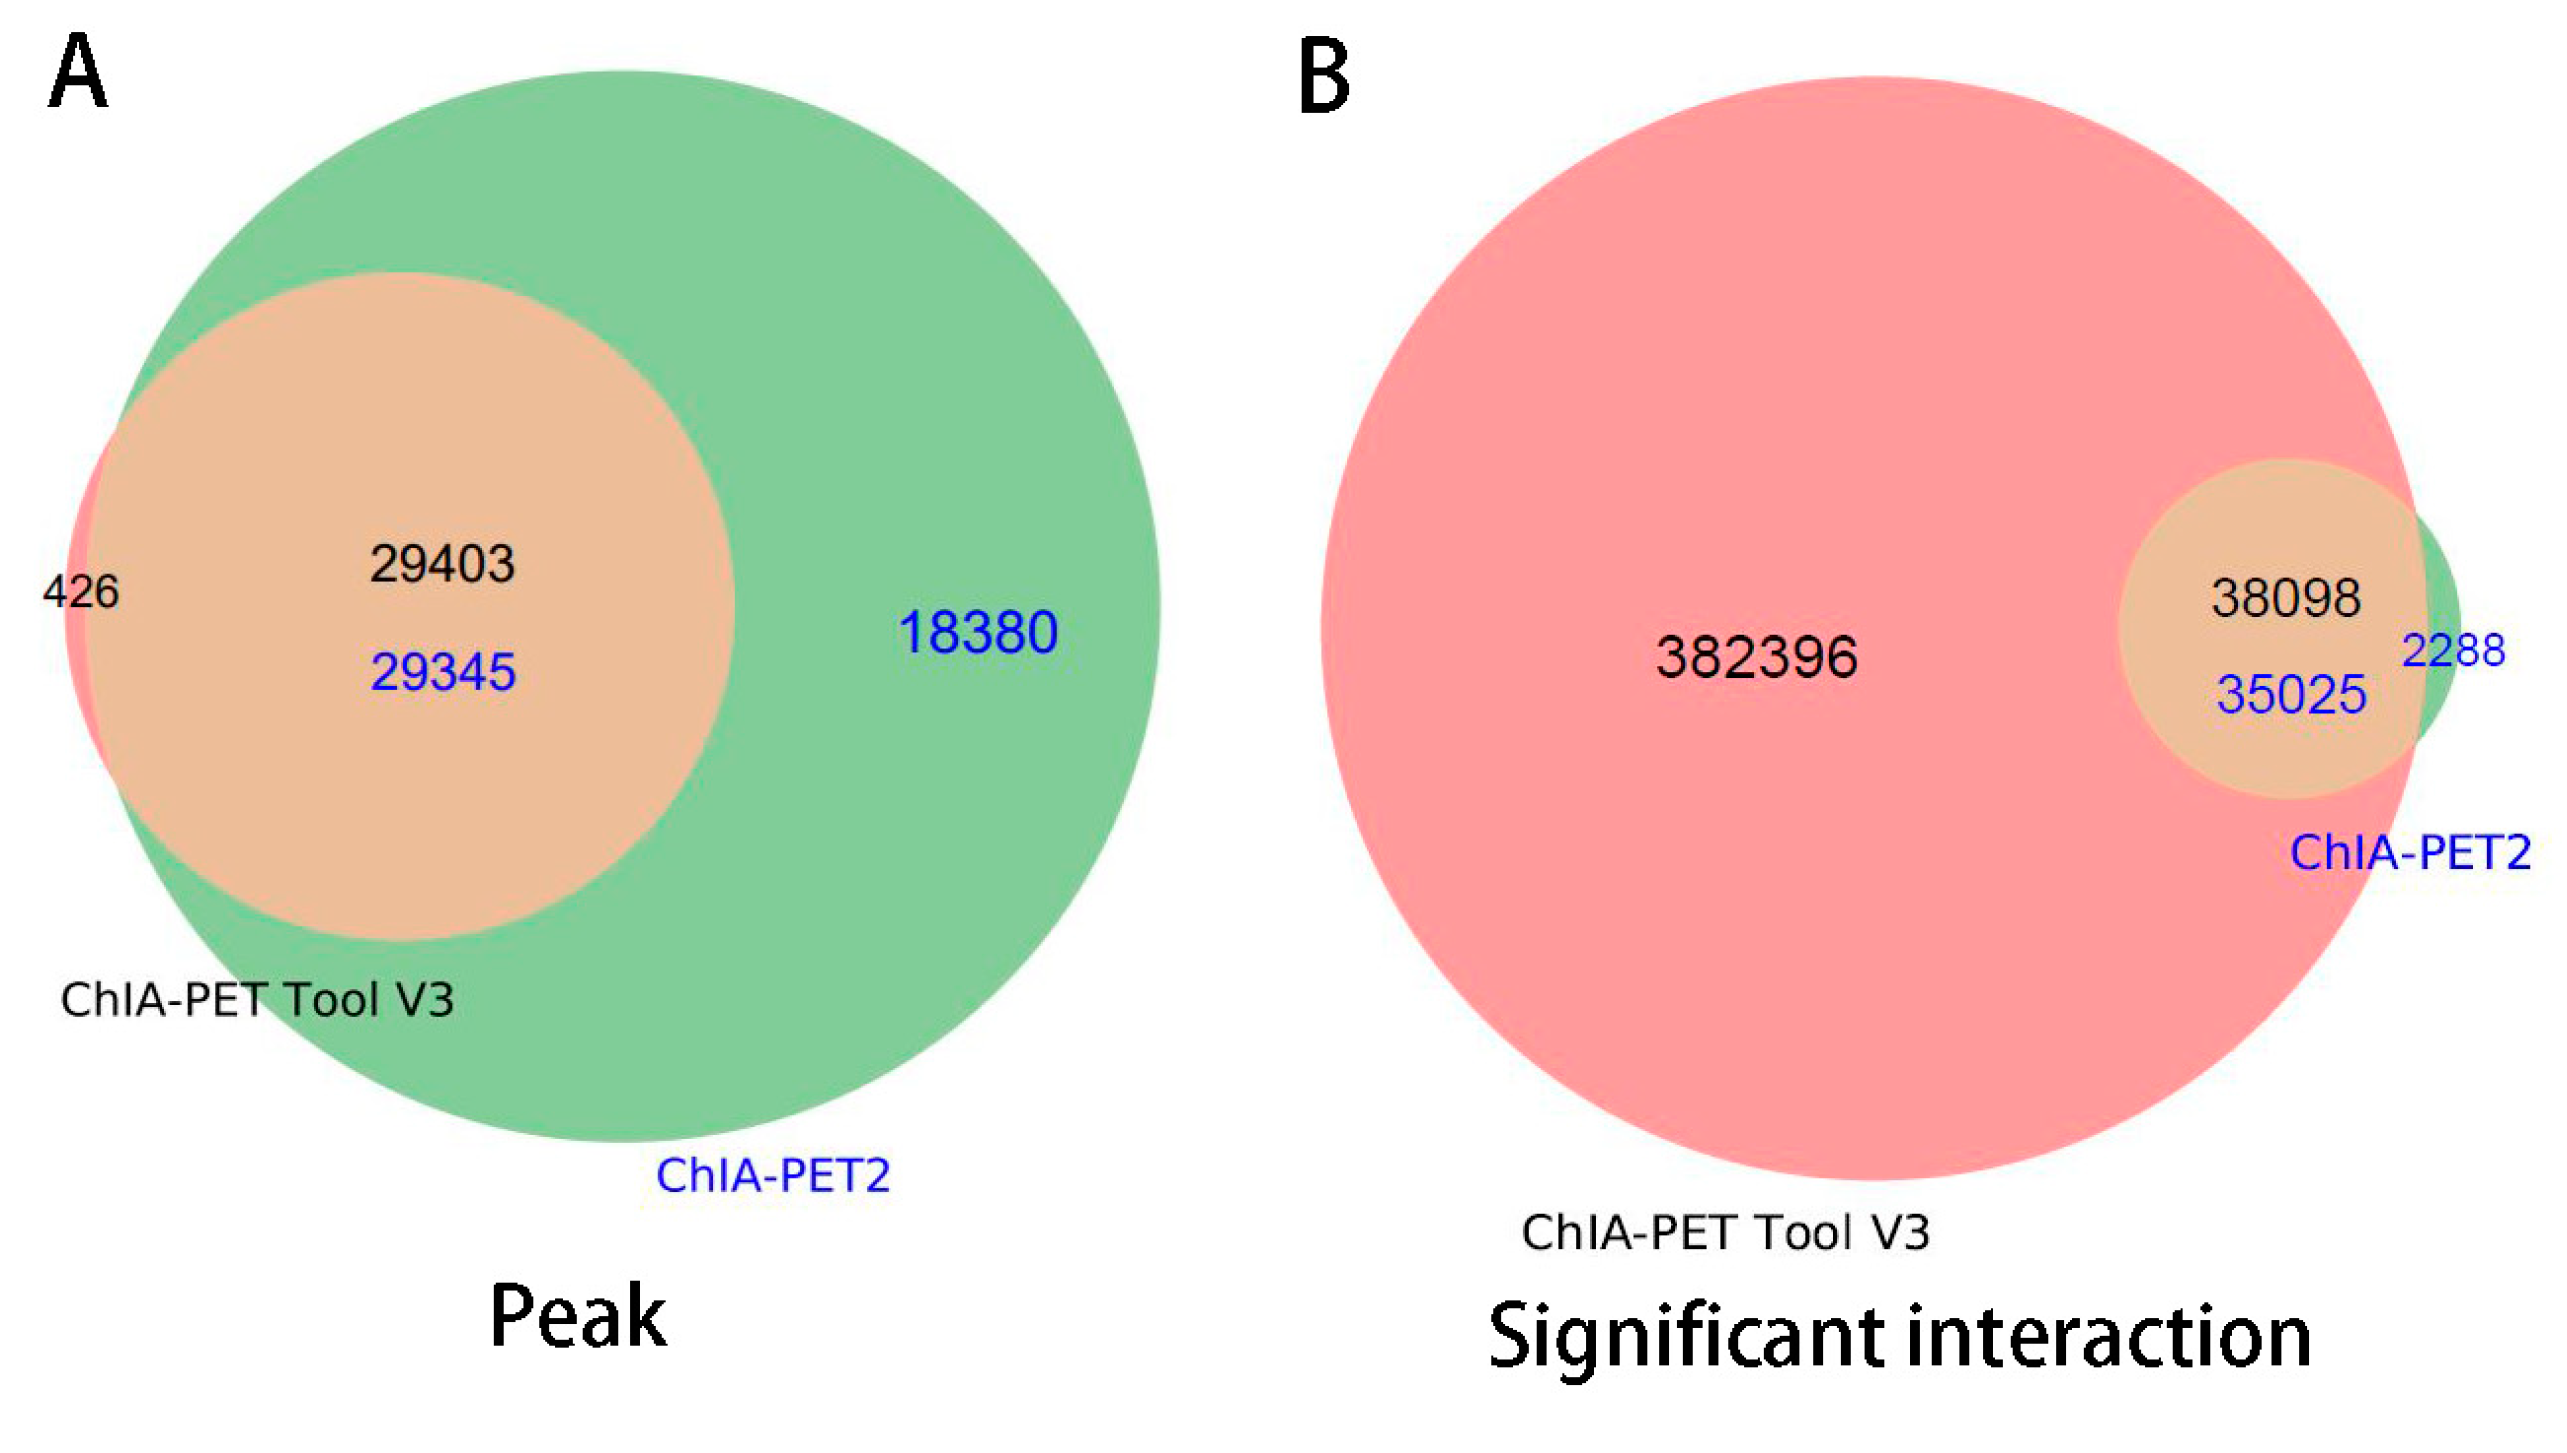
Overlap of (A) peaks and (B) interactions detected by different tools from human K562 cells. Significant interactions are required for at least three supportive PETs and FDR less than 0.05.
Figure 10.
Overlap of (A) peaks and (B) interactions detected by different tools from human K562 cells. Significant interactions are required for at least three supportive PETs and FDR less than 0.05.
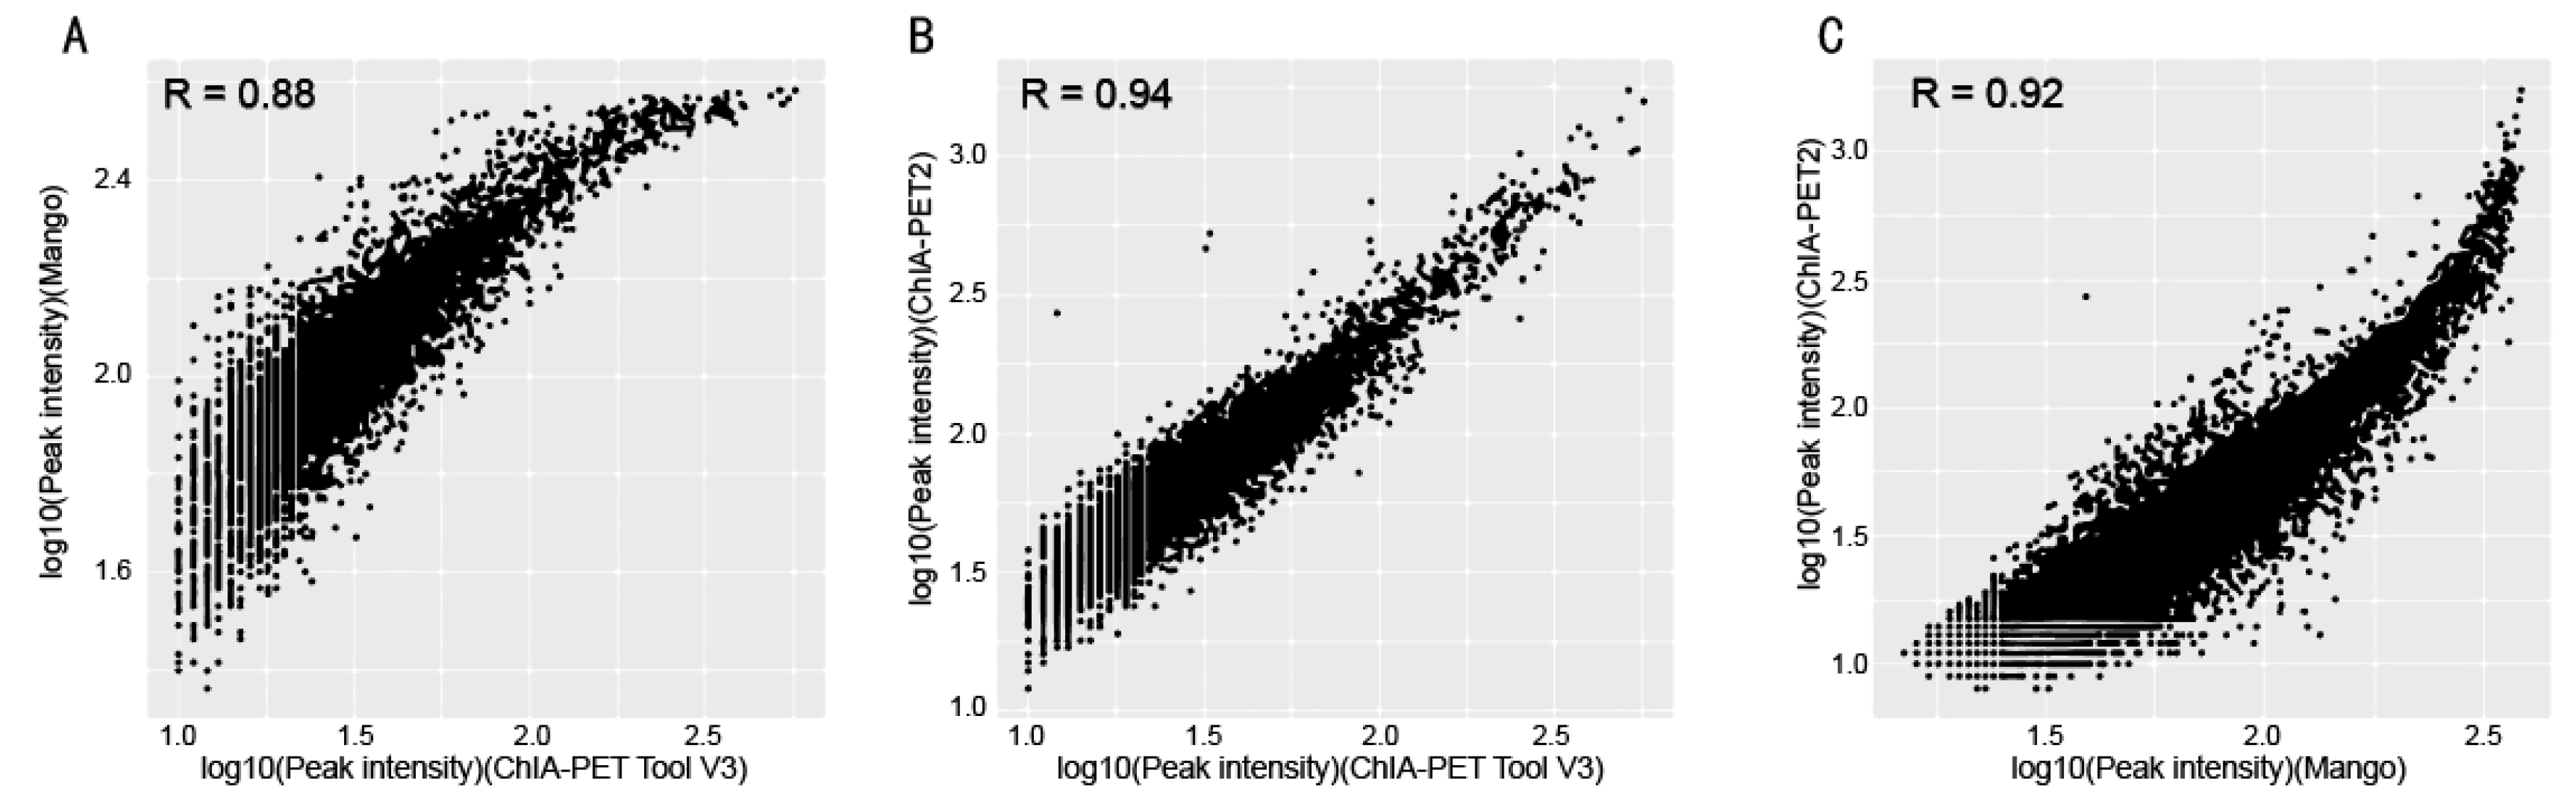
Figure 11.
Scatter plots of peak intensity between different tools from human K562 cells. (A) Peak intensity between ChIA-PET Tool V3 and Mango. (B) Peak intensity between ChIA-PET Tool V3 and ChIA-PET2. (C) Peak intensity between Mango and ChIA-PET2.
Figure 11.
Scatter plots of peak intensity between different tools from human K562 cells. (A) Peak intensity between ChIA-PET Tool V3 and Mango. (B) Peak intensity between ChIA-PET Tool V3 and ChIA-PET2. (C) Peak intensity between Mango and ChIA-PET2.
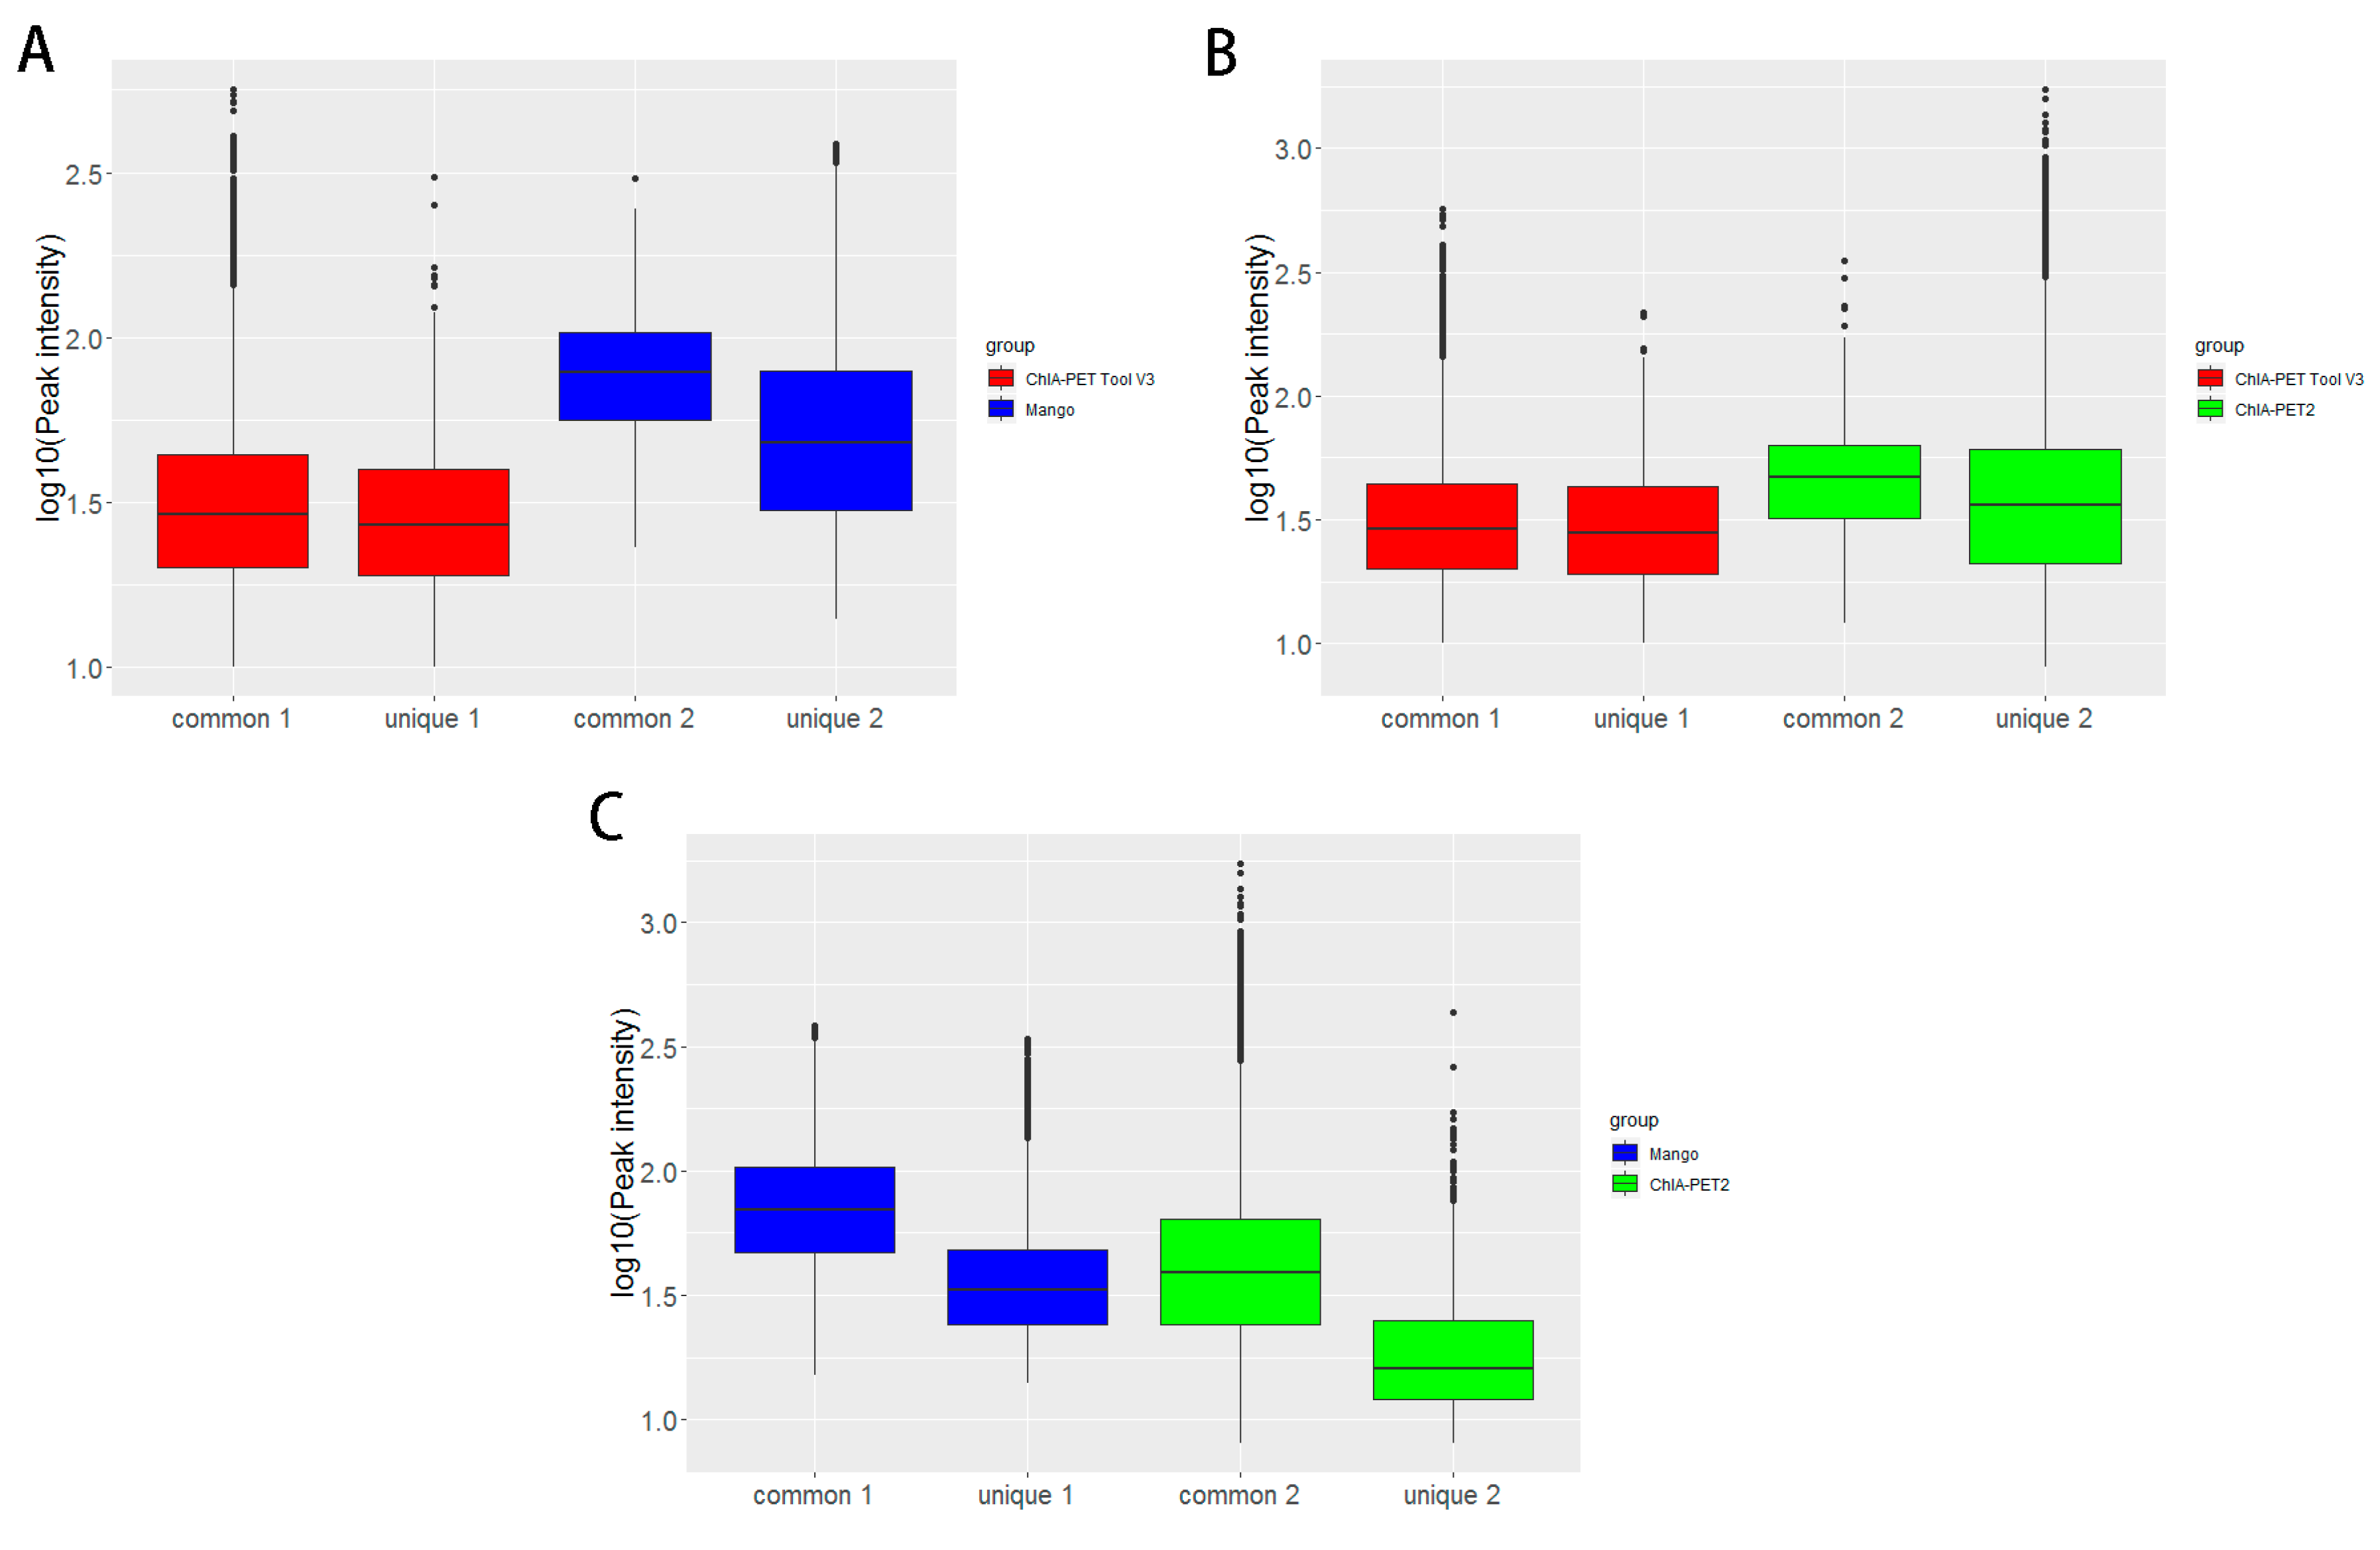
Figure 12.
Box plots of peak intensities between different tools from human K562 cells. (A) Peak intensity between ChIA-PET Tool V3 and Mango. (B) Peak intensity between ChIA-PET Tool V3 and ChIA-PET2. (C) Peak intensity between Mango and ChIA-PET2. The common part represents peak intensities with overlap between two tools. The unique part represents peak intensity without overlap between two tools. Middle line denotes median; box denotes Interquartile Range (IQR); whiskers denote 1.5 × IQR.
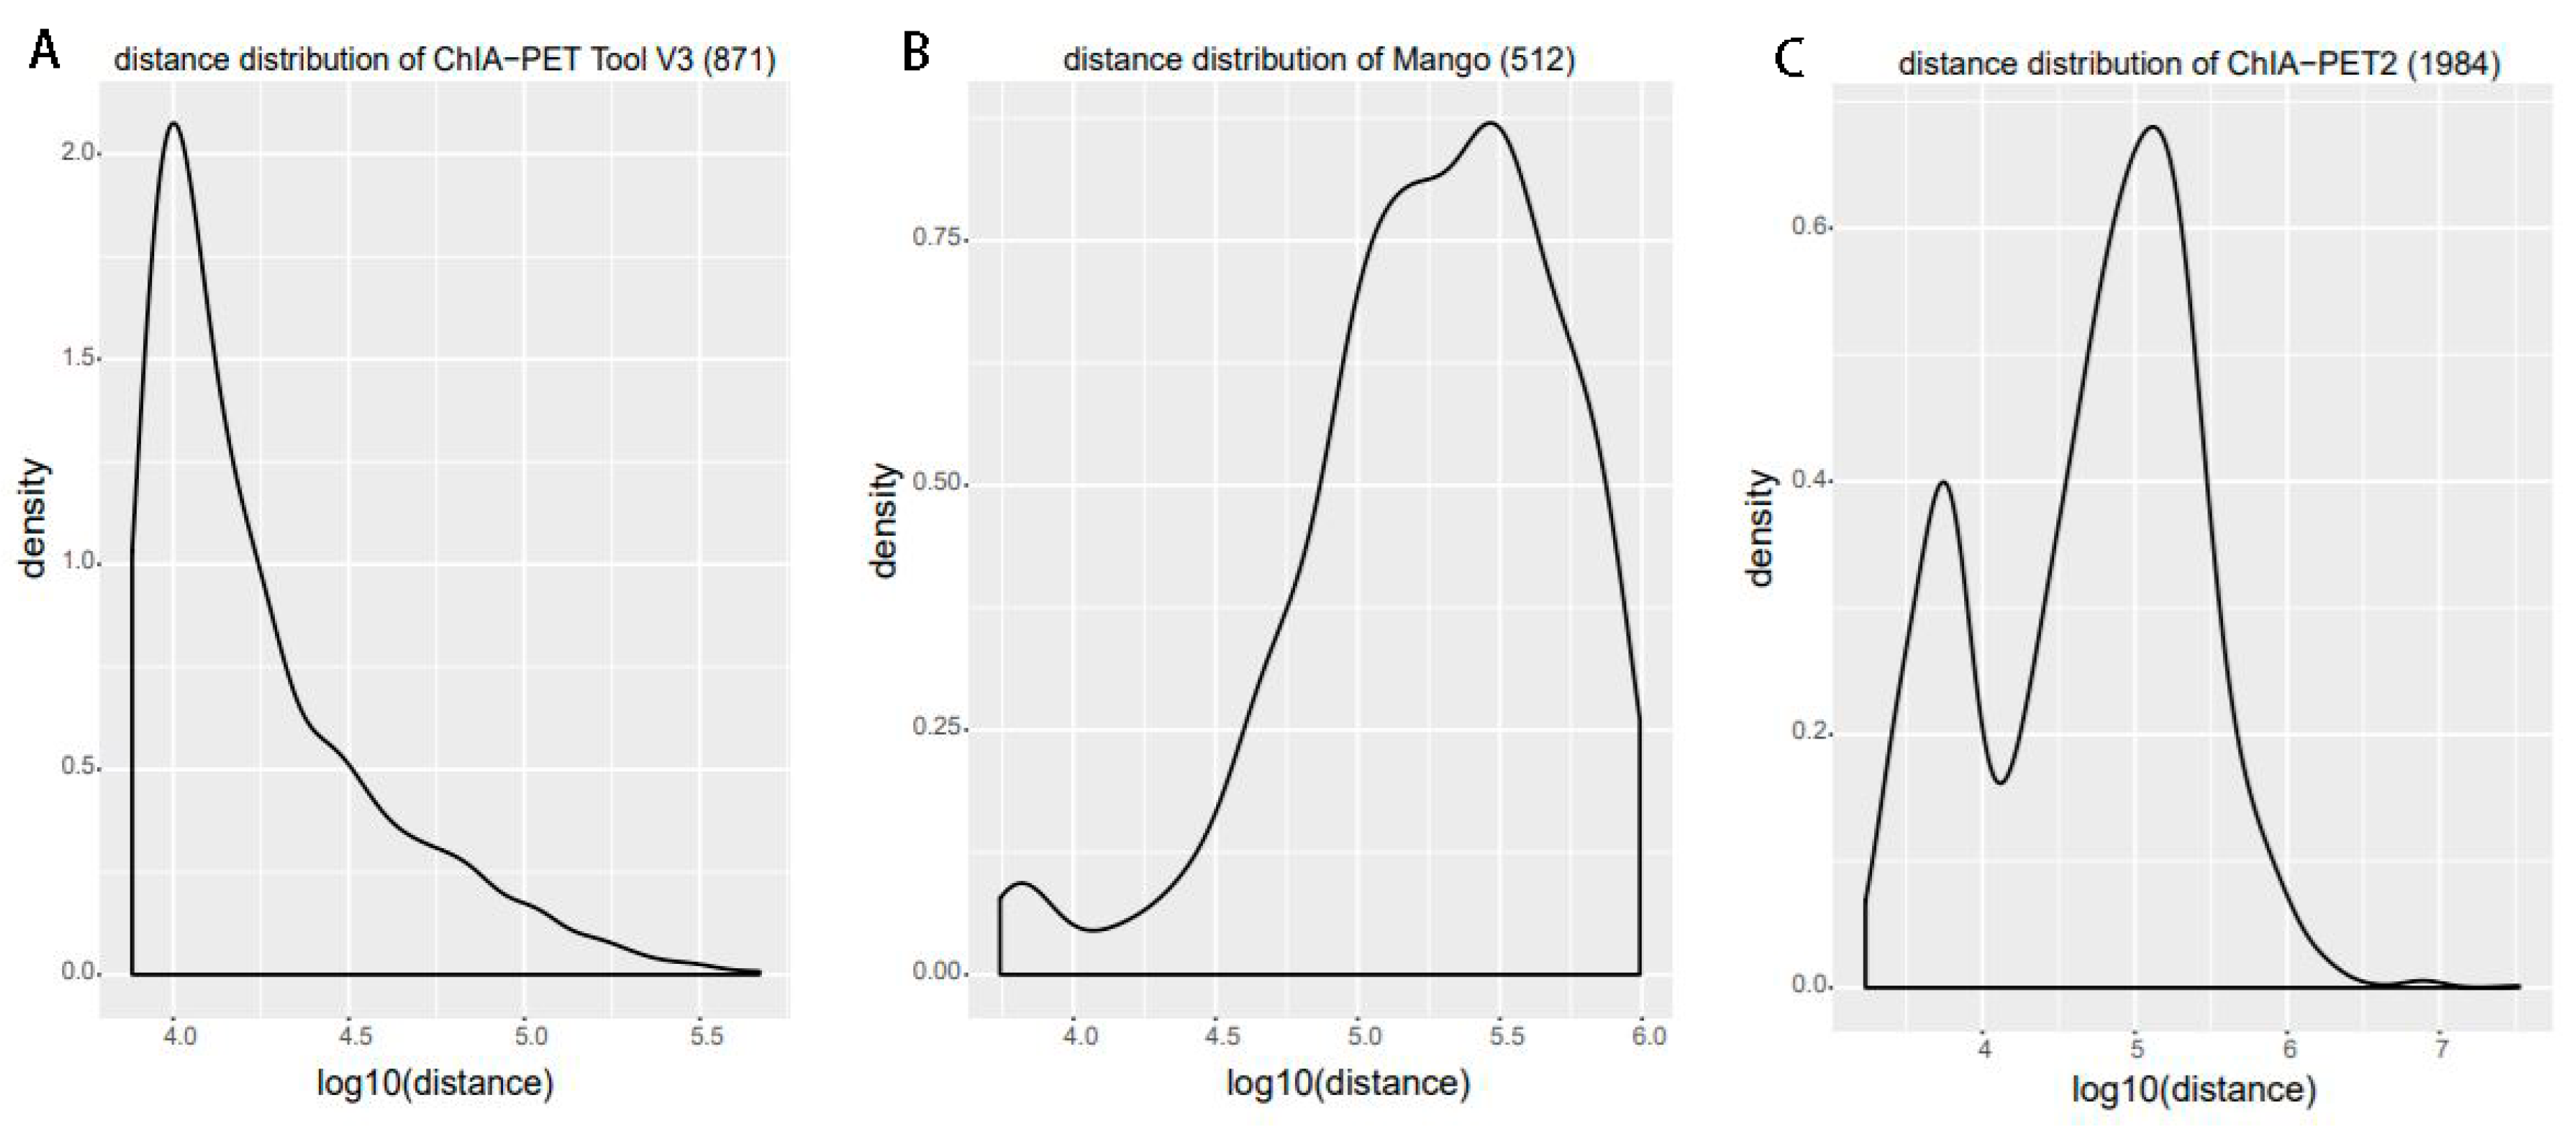
Figure 13.
Genomic proximity of the subset interactions unique to each tool. (A) Distance distribution of the unique interactions from ChIA-PET Tool V3. (B) Distance distribution of the unique interactions from Mango. (C) Distance distribution of the unique interactions from ChIA-PET2.
Figure 13.
Genomic proximity of the subset interactions unique to each tool. (A) Distance distribution of the unique interactions from ChIA-PET Tool V3. (B) Distance distribution of the unique interactions from Mango. (C) Distance distribution of the unique interactions from ChIA-PET2.
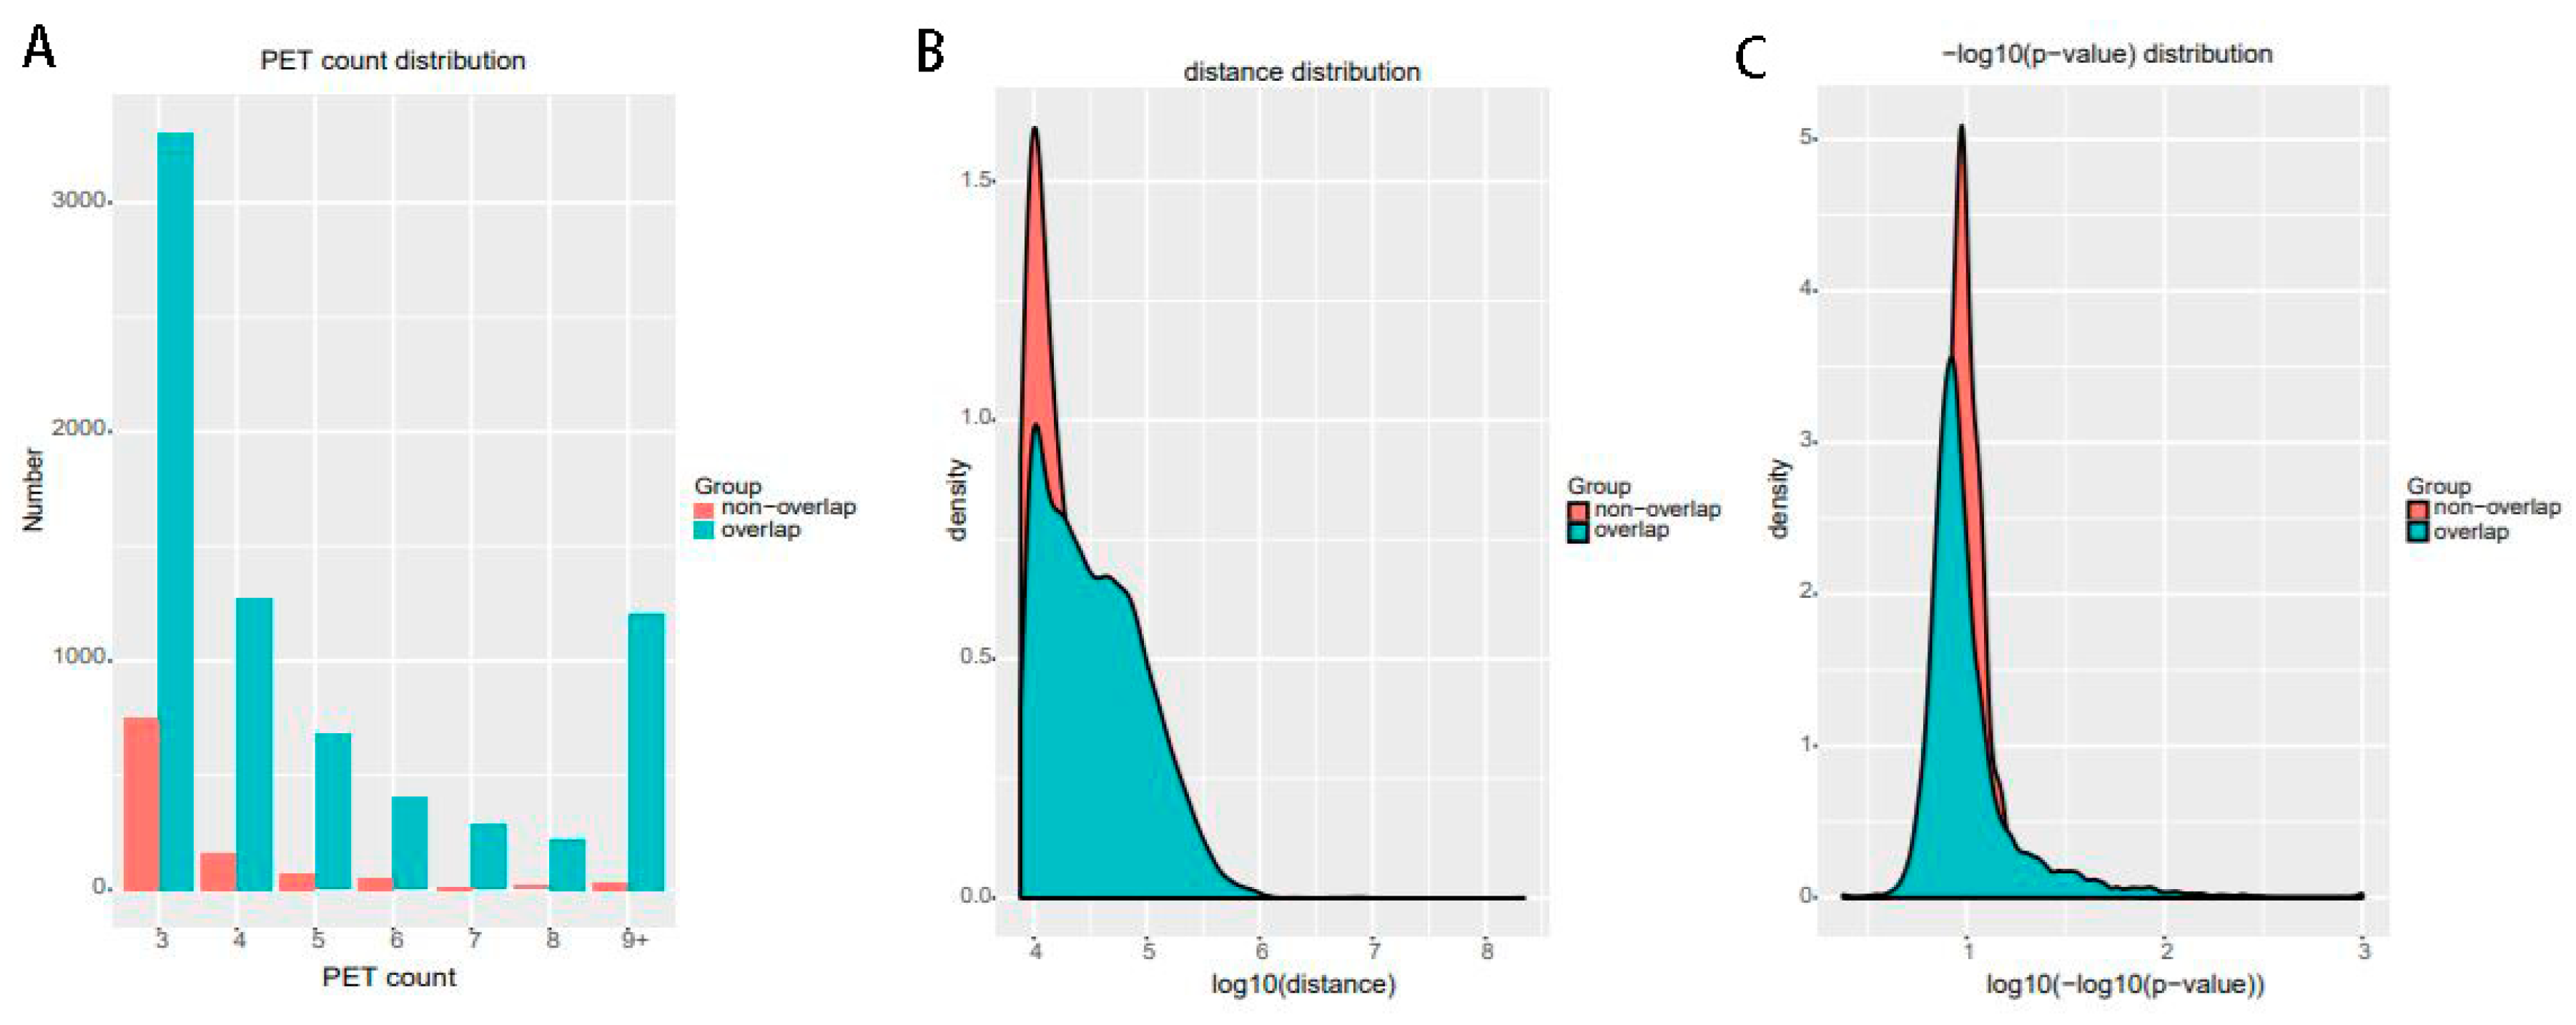
Figure 14.
The interactions of ChIA-PET Tool V3 which are overlapped with those from ChiaSig and the interactions which are not overlapped with those from ChiaSig on (A) PET count, (B) genomic distance between two anchors and (C) −log(p-value).
Figure 14.
The interactions of ChIA-PET Tool V3 which are overlapped with those from ChiaSig and the interactions which are not overlapped with those from ChiaSig on (A) PET count, (B) genomic distance between two anchors and (C) −log(p-value).
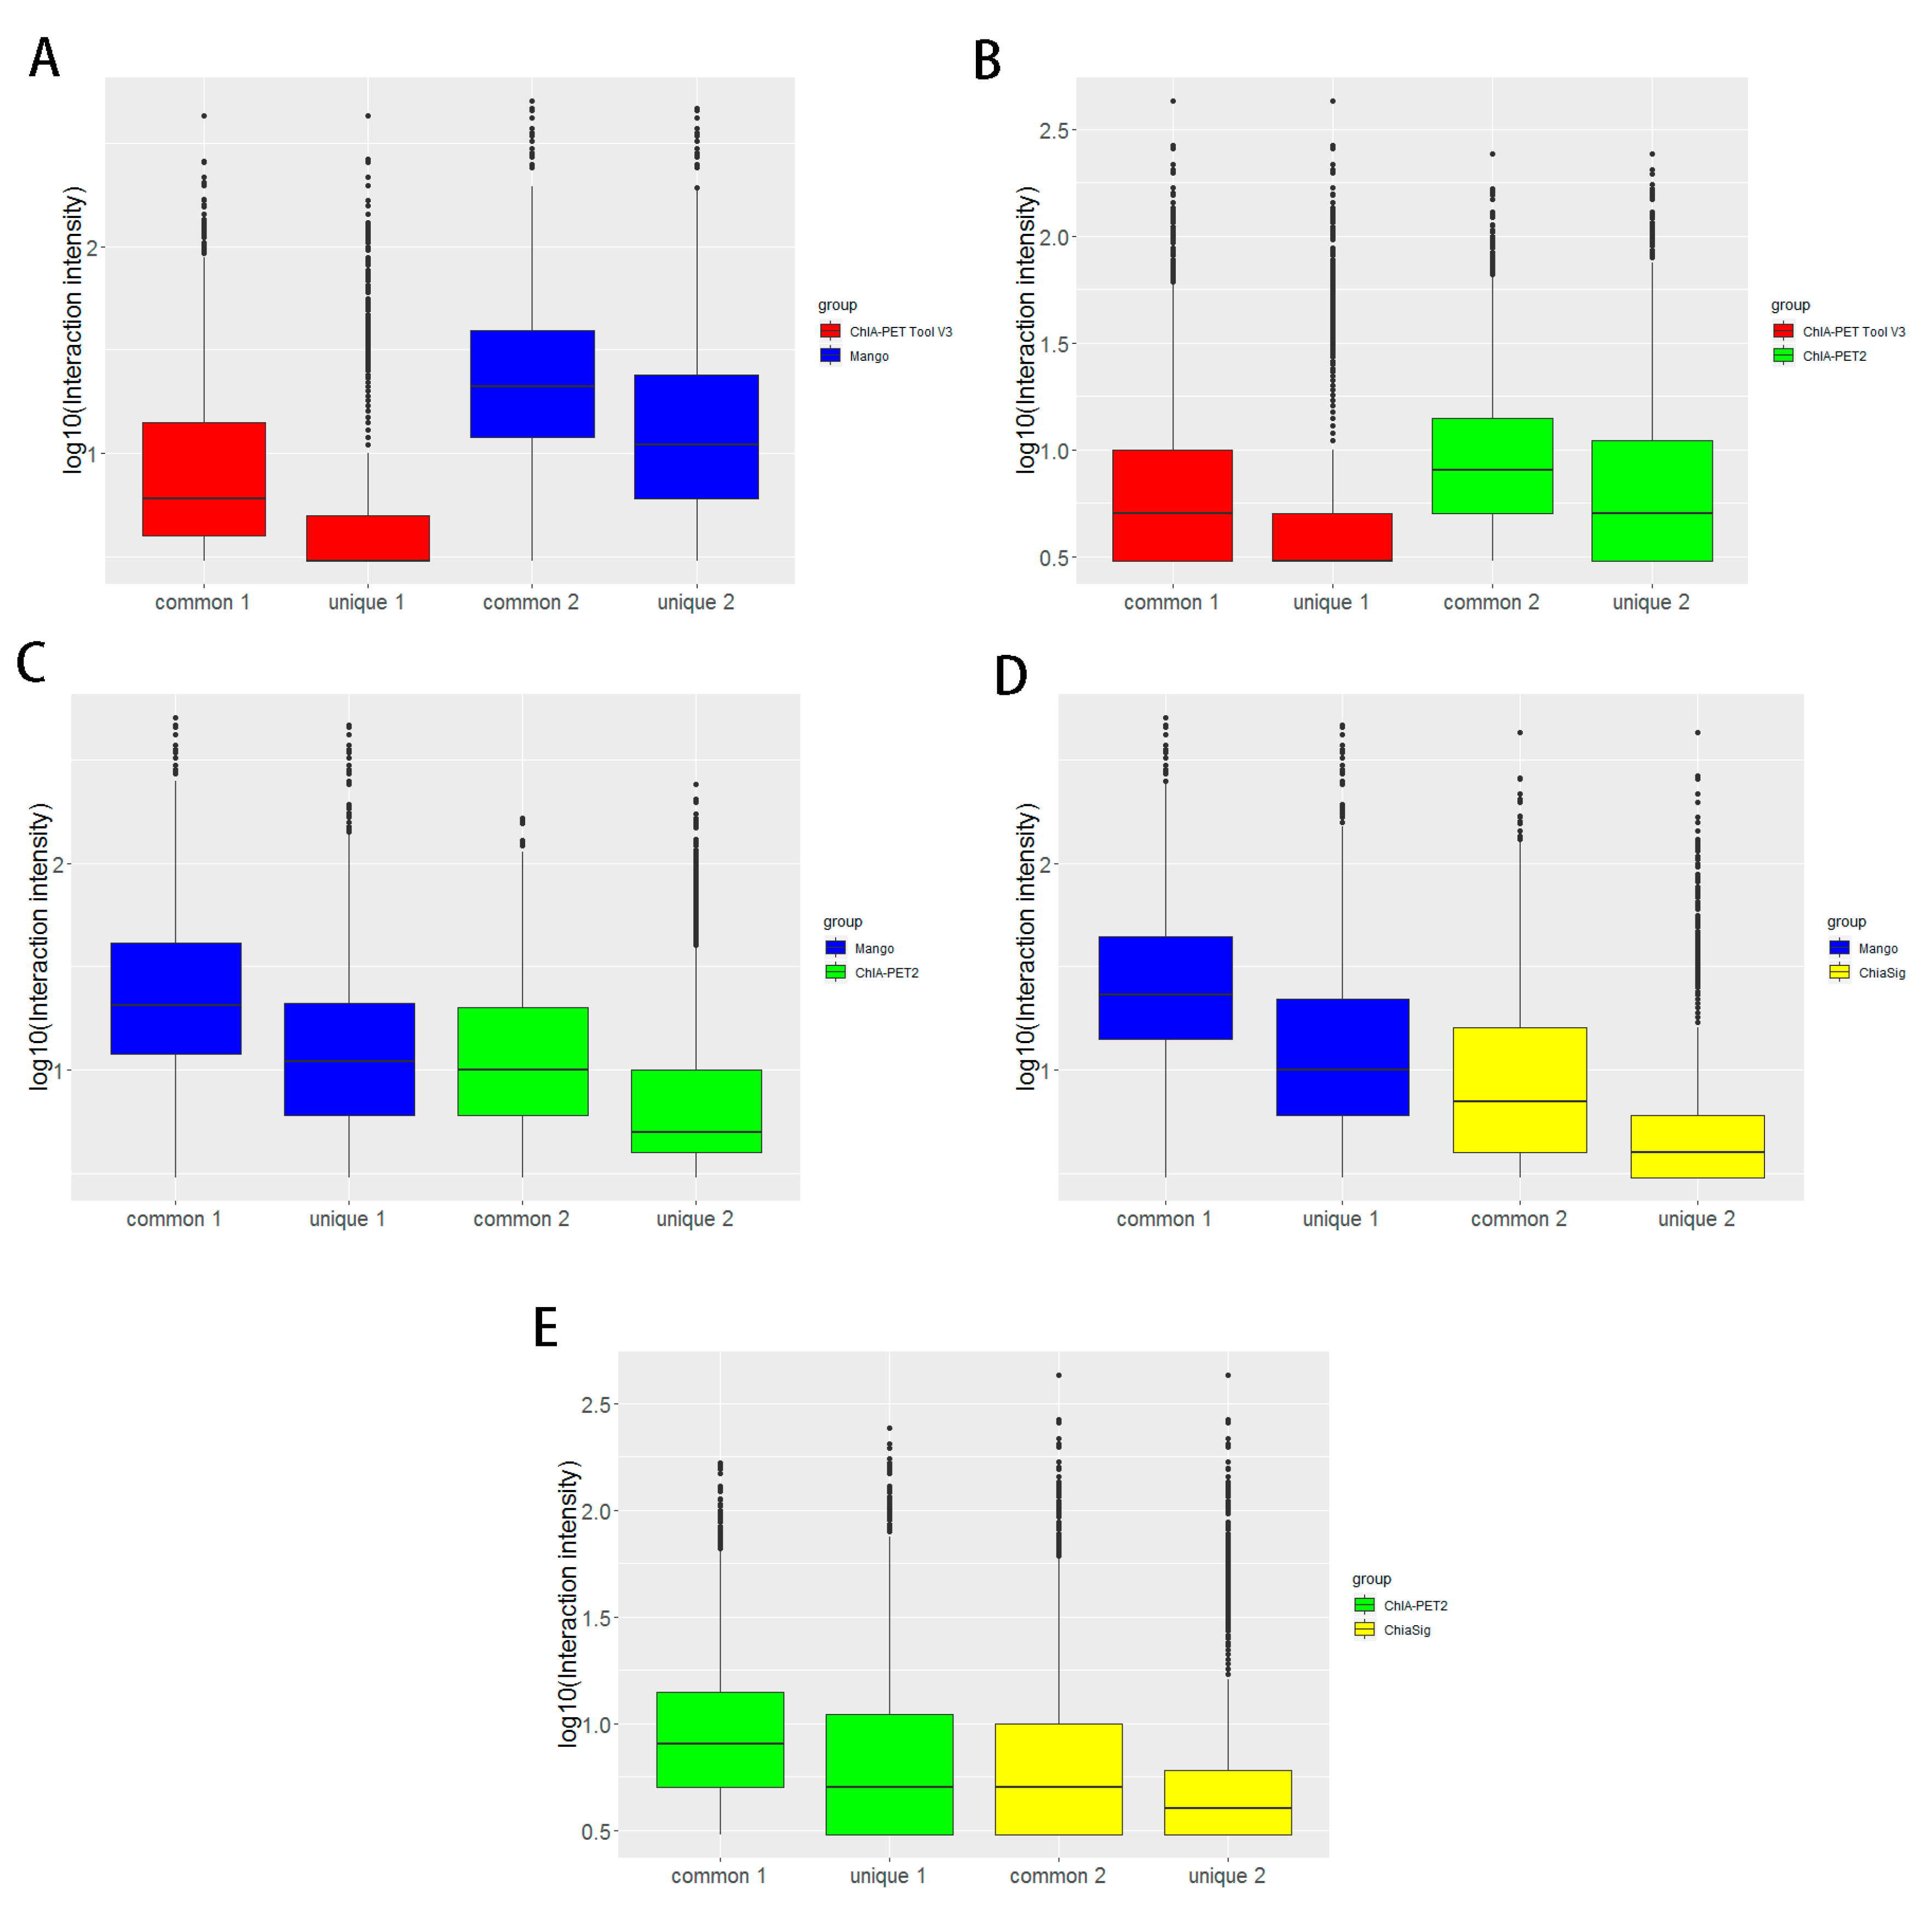
Figure 15.
Box plots of interaction intensity between different tools from human K562 cells. (A) Interaction intensity between ChIA-PET Tool V3 and Mango. (B) Interaction intensity between ChIA-PET Tool V3 and ChIA-PET2. (C) Interaction intensity between Mango and ChIA-PET2. (D) Interaction intensity between Mango and ChiaSig. (E) Interaction intensity between ChIA-PET2 and ChiaSig.
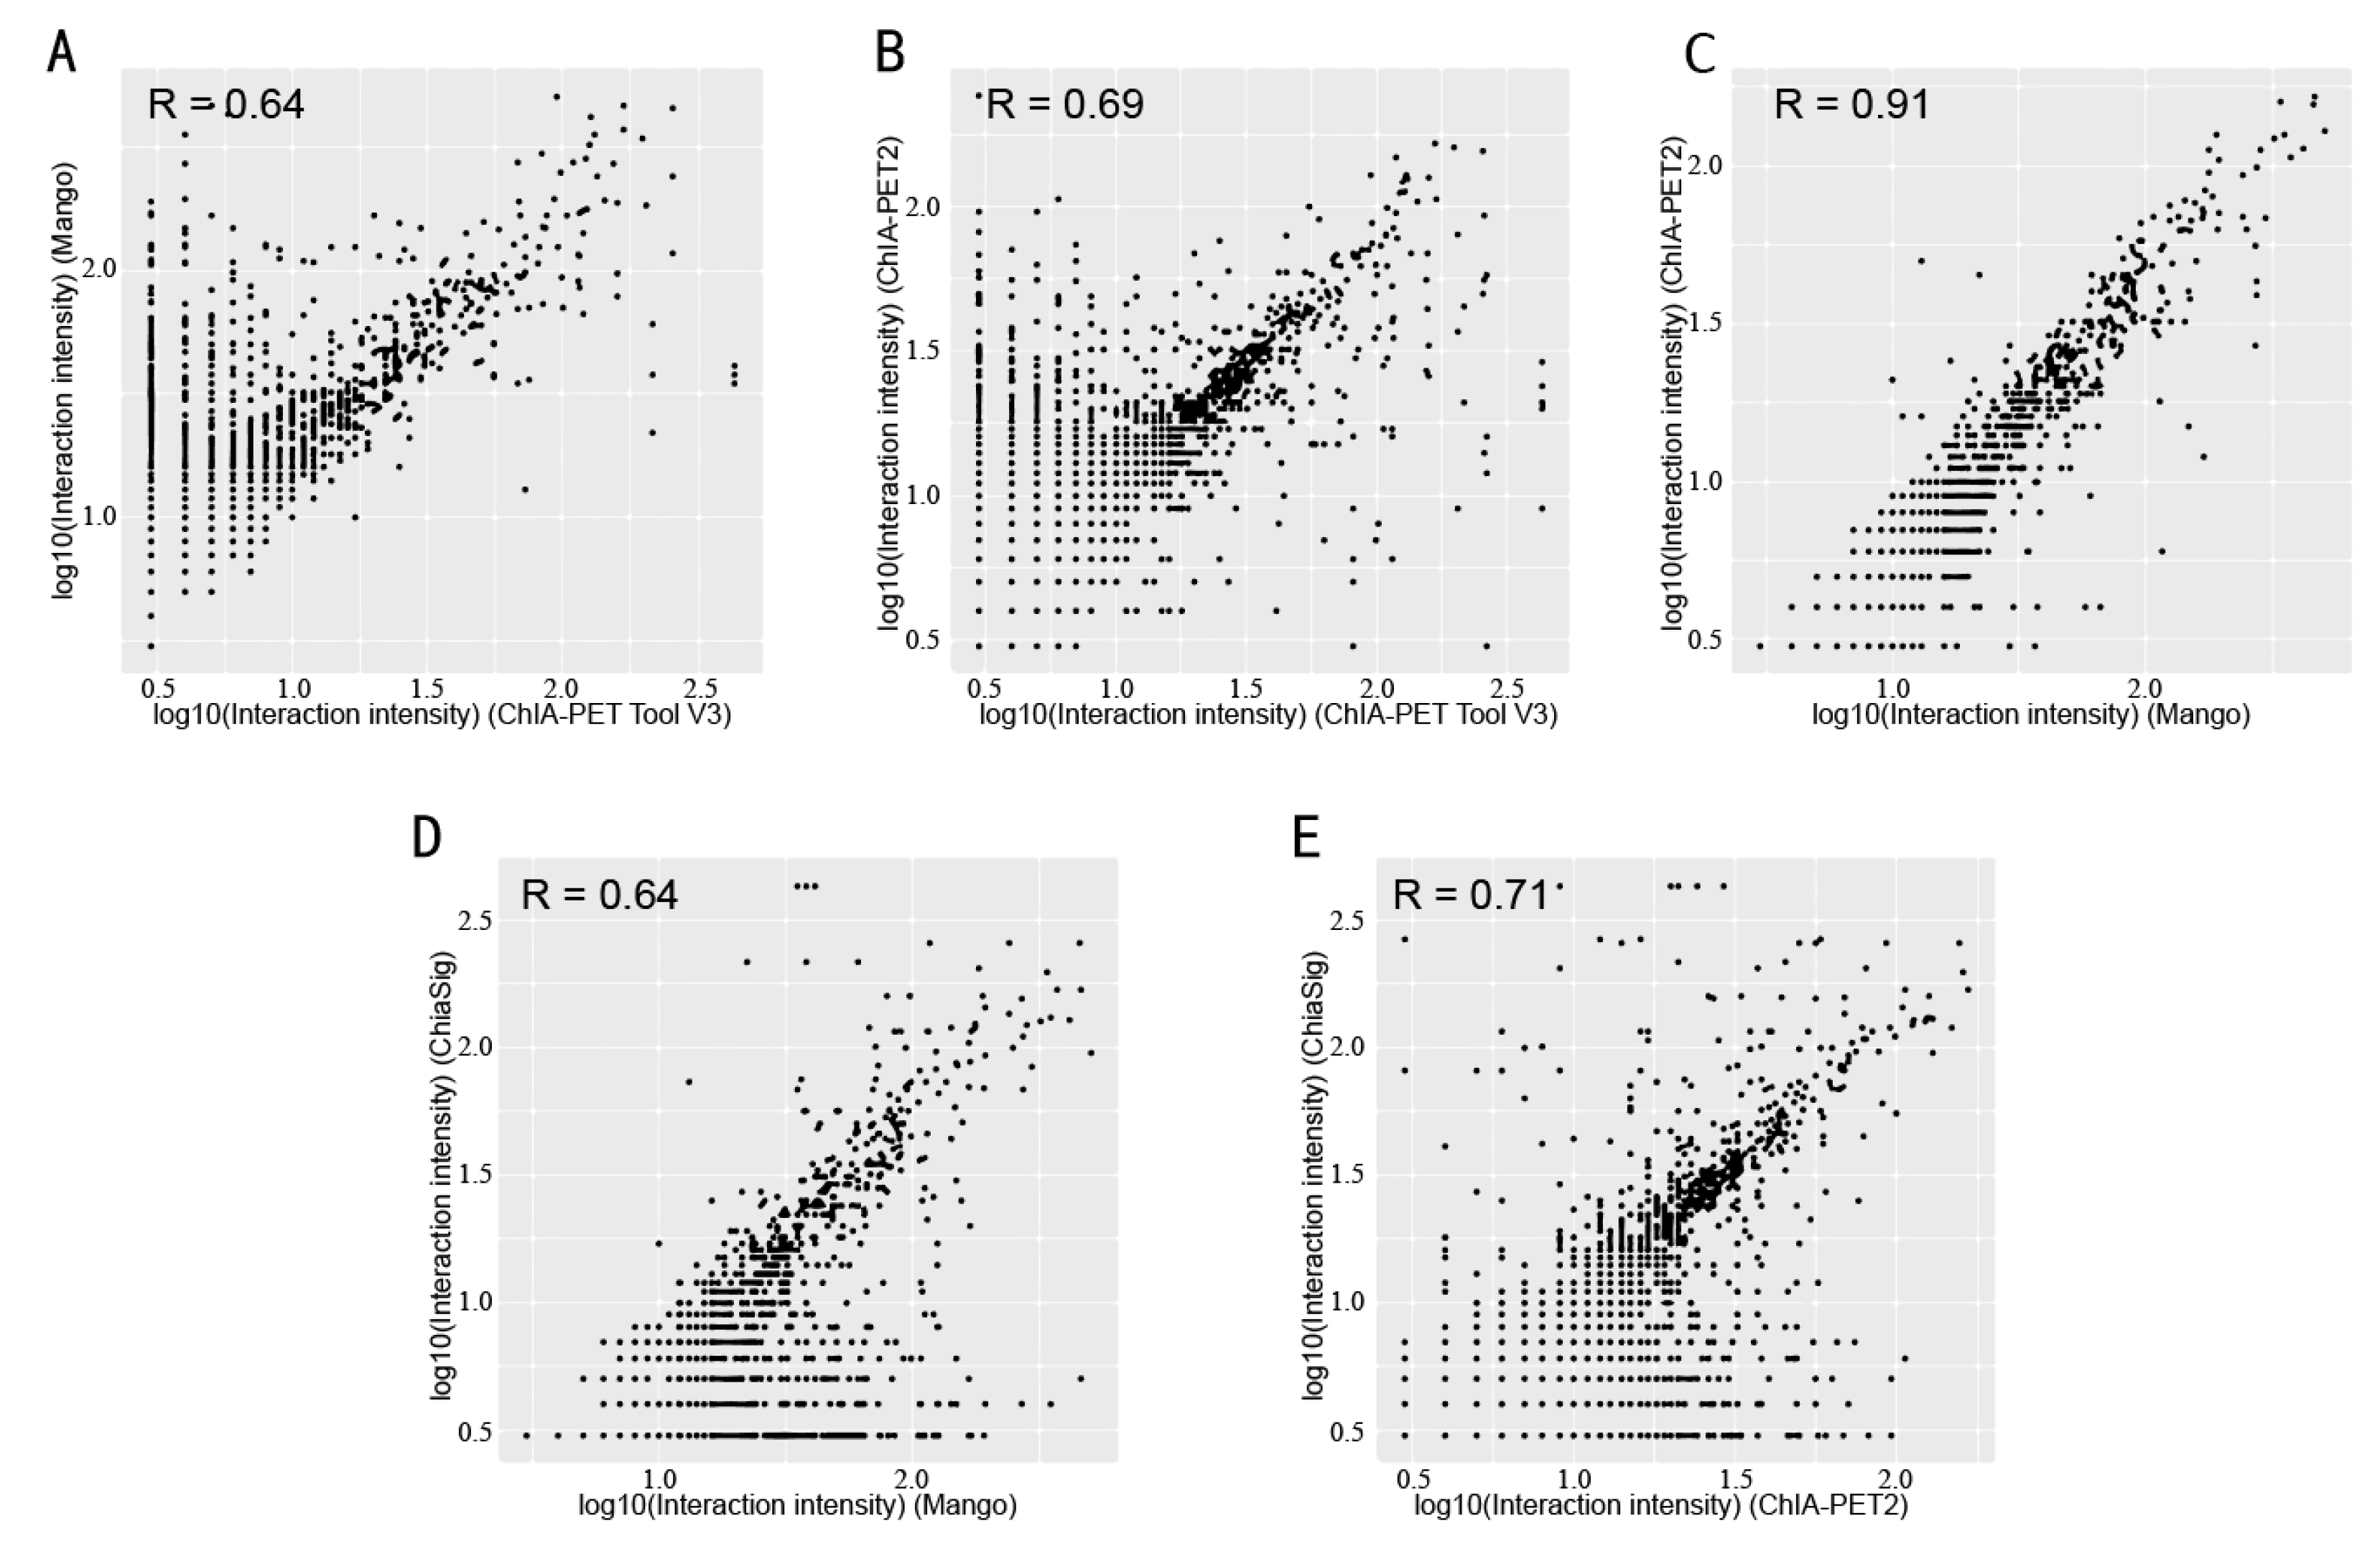
Figure 16.
Scatter plots of interaction intensity between different tools from human K562 cells. (A) Interaction intensity between ChIA-PET Tool V3 and Mango. (B) Interaction intensity between ChIA-PET Tool V3 and ChIA-PET2. (C) Interaction intensity between Mango and ChIA-PET2. (D) Interaction intensity between Mango and ChiaSig. (E) Interaction intensity between ChIA-PET2 and ChiaSig.
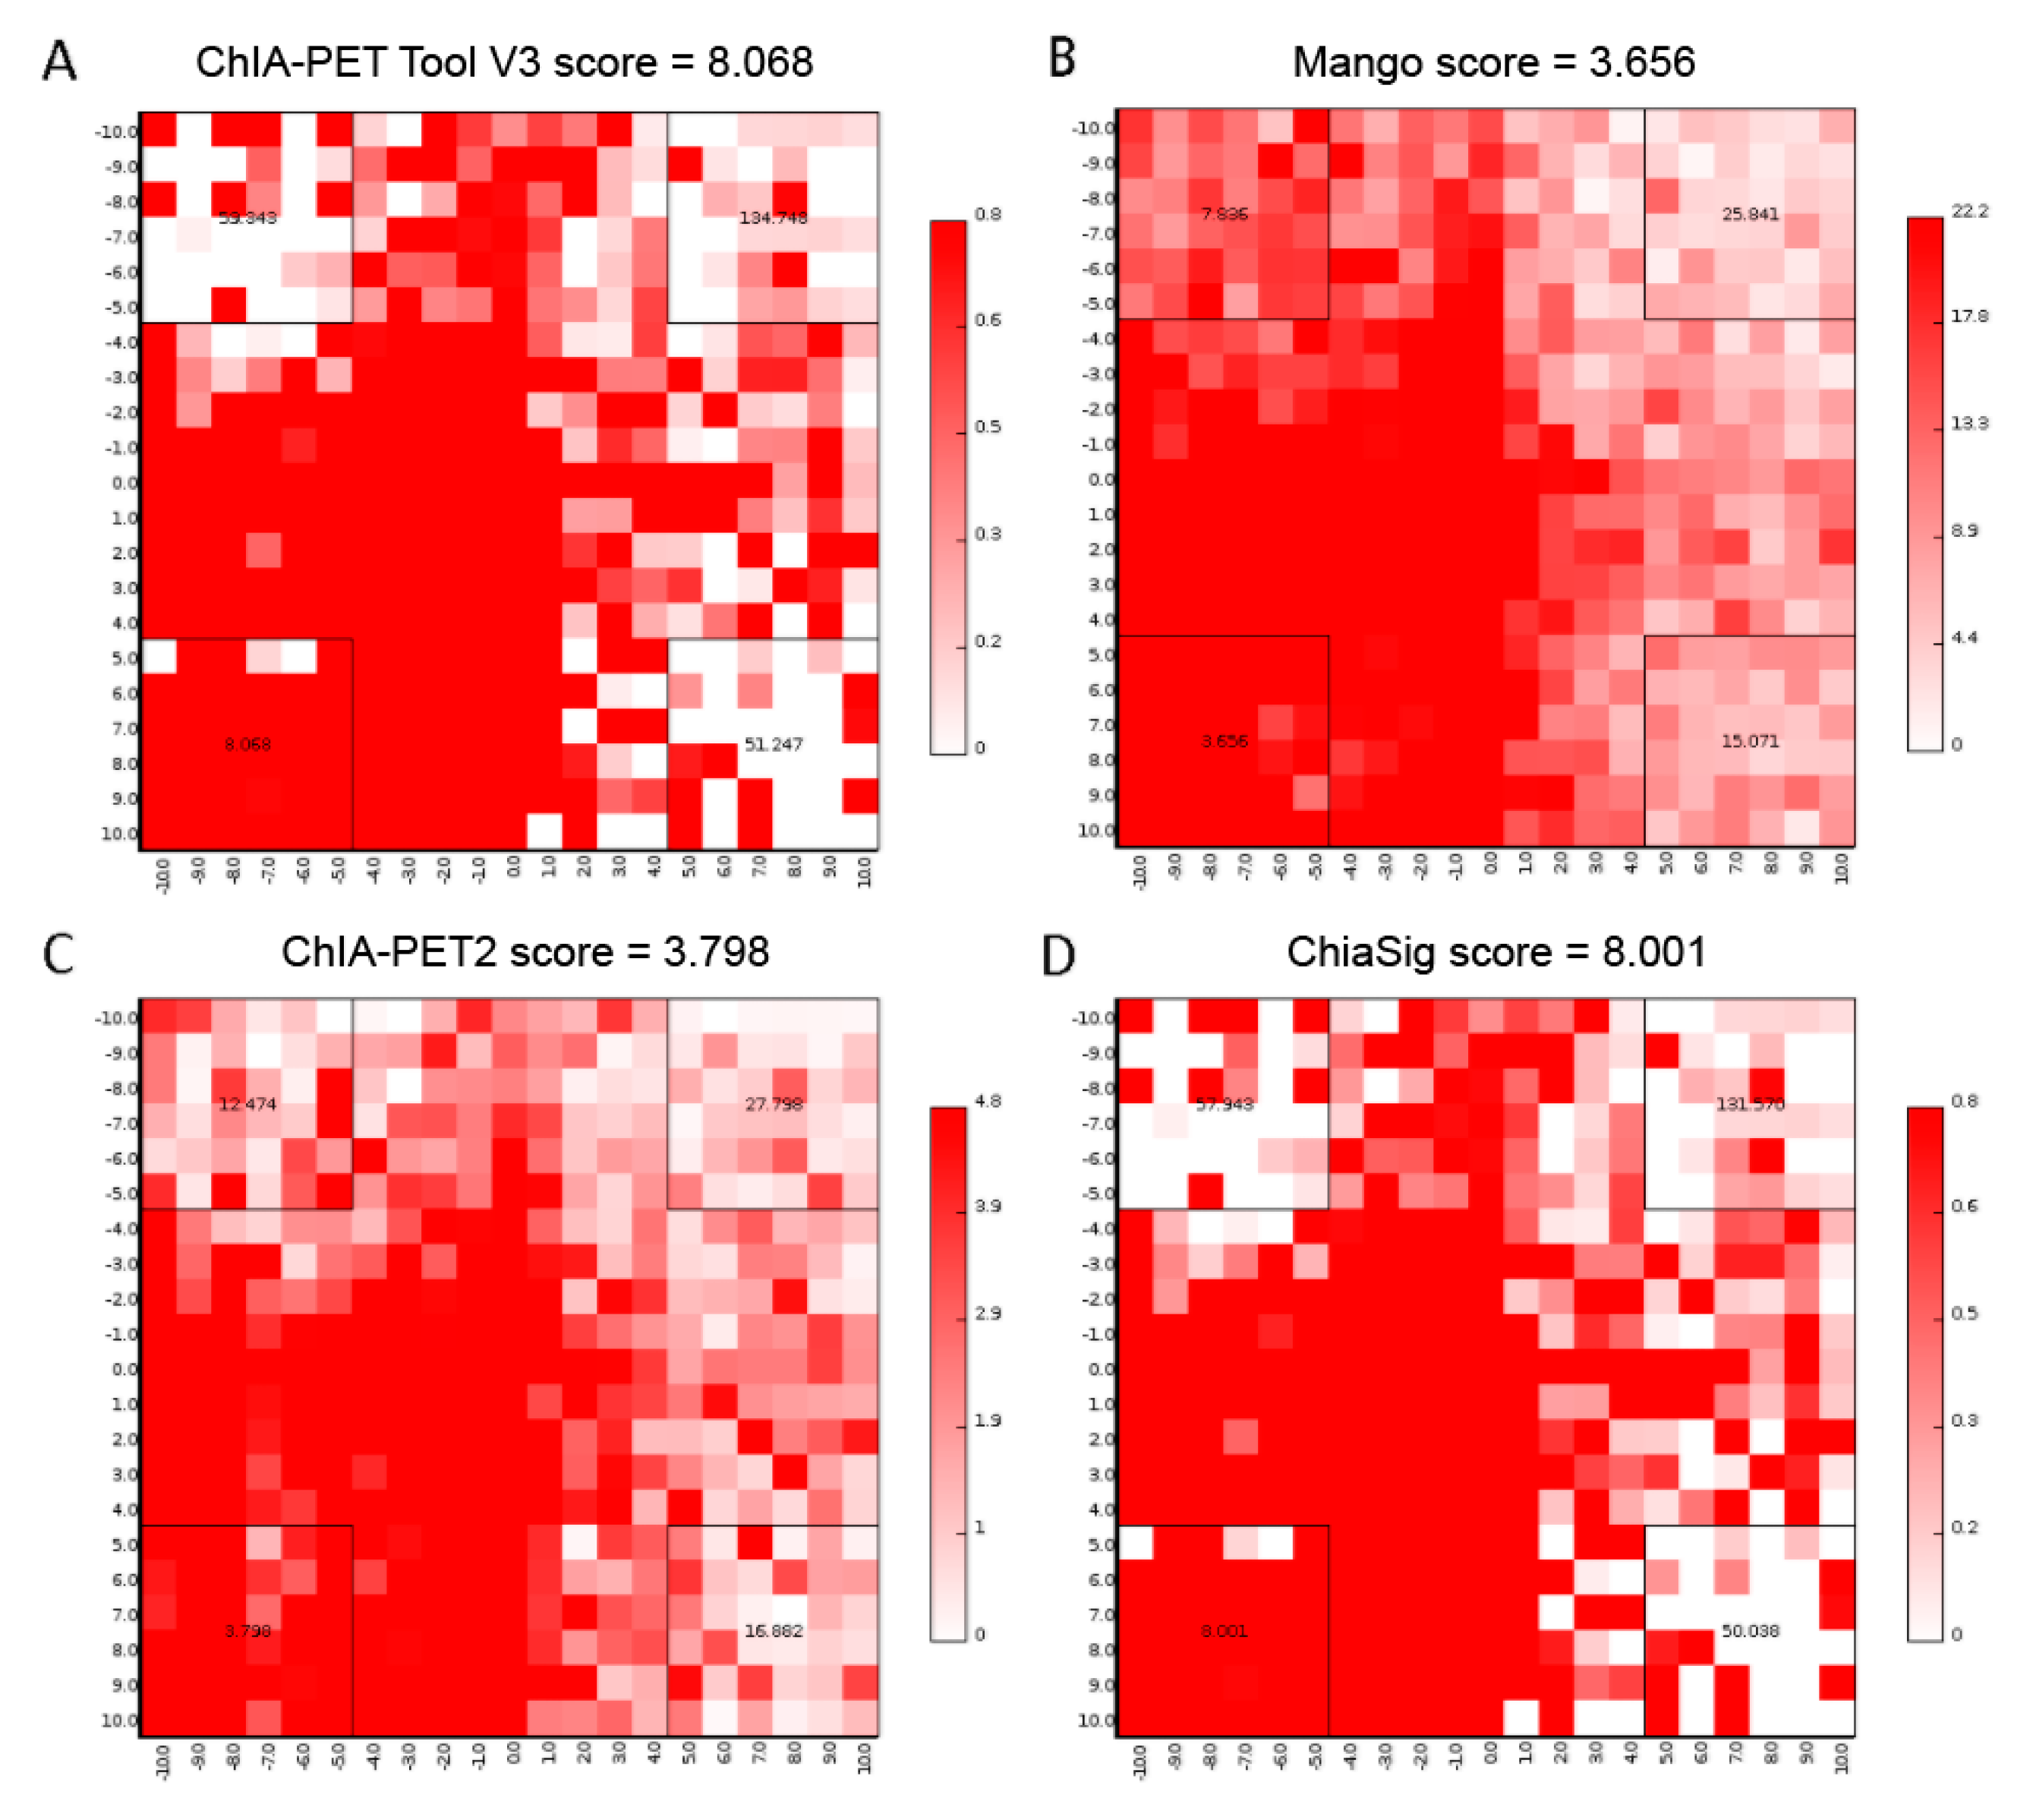
Figure 17.
Aggregate Peak Analysis (APA) plots of significant interactions detected by different tools from human K562 cells. (A) APA plot of significant interactions detected by ChIA-PET Tool V3. (B) APA plot of significant interactions detected by Mango. (C) APA plot of significant interactions detected by ChIA-PET2. (D) APA plot of significant interactions detected by ChiaSig. Significant interactions are required at least 3 supportive PETs and FDR less than 0.05. Interaction matrices are built with BEDPE files of ChIA-PET data after removing duplicates. Interaction counts are summed for all pairs of loci in 25 kb bins.
Figure 18.
Overlap of peaks and interactions detected by different tools from human GM12878 cells. Significant interactions require at least three supportive PETs and FDR of less than 0.05.
Figure 18.
Overlap of peaks and interactions detected by different tools from human GM12878 cells. Significant interactions require at least three supportive PETs and FDR of less than 0.05.
Figure 19.
Comparison of peaks and interactions from ChIA-PET Tool V3 and ChIA-PET2 in CTCF ChIA-PET data. (A,B) Scatter plot and box plot of peak intensity from human GM12878 cells, respectively. (C,D) Scatter plot and box plot of interaction intensity from human GM12878 cells, respectively.
Figure 19.
Comparison of peaks and interactions from ChIA-PET Tool V3 and ChIA-PET2 in CTCF ChIA-PET data. (A,B) Scatter plot and box plot of peak intensity from human GM12878 cells, respectively. (C,D) Scatter plot and box plot of interaction intensity from human GM12878 cells, respectively.
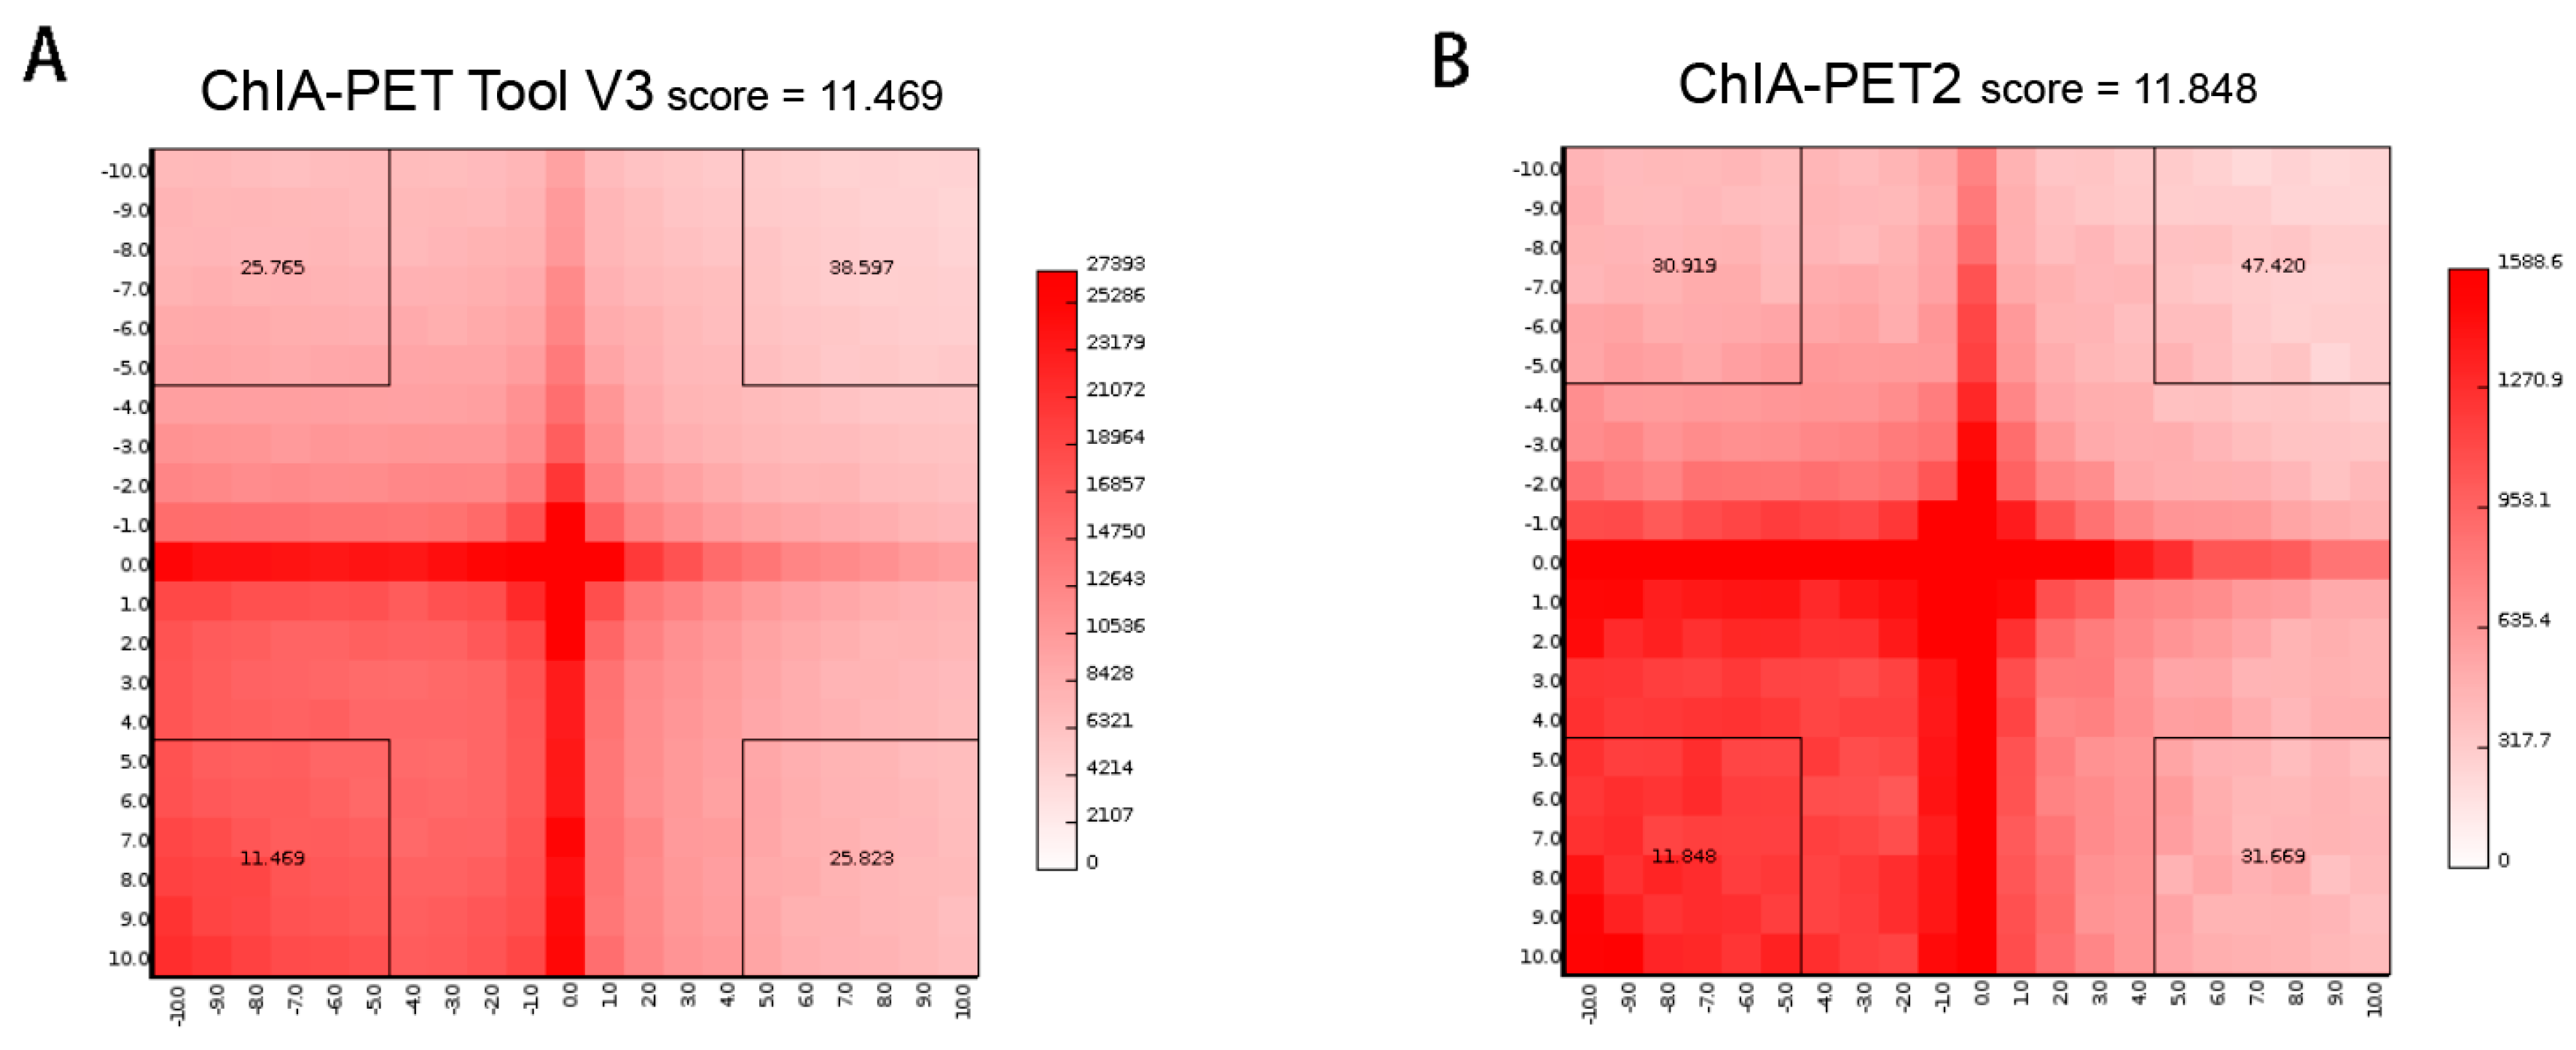
Figure 20.
Aggregate peak analysis (APA) plots of significant interactions detected by different tools from human GM12878 cells. (A) APA plot of significant interactions detected by ChIA-PET Tool V3. (B) APA plot of significant interactions detected by ChIA-PET2. Significant interactions require at least three supportive PETs and FDR of less than 0.05. Interaction matrices are built with BEDPE files from ChIA-PET data after removing duplicates. Interaction counts are summed for all pairs of loci in 25 kb bins.
Table 1.
Statistics of linker composition.
Table 1.
Statistics of linker composition.
| | A_A | A_B | B_A | B_B | Ambiguous | Total |
|---|
| Numbers | 33,029,693 | 420,122 | 425,932 | 35,544,028 | 6,155,769 | 75,575,544 |
| Percentage | 43.70% | 0.56% | 0.56% | 47.03% | 8.15% | 100% |
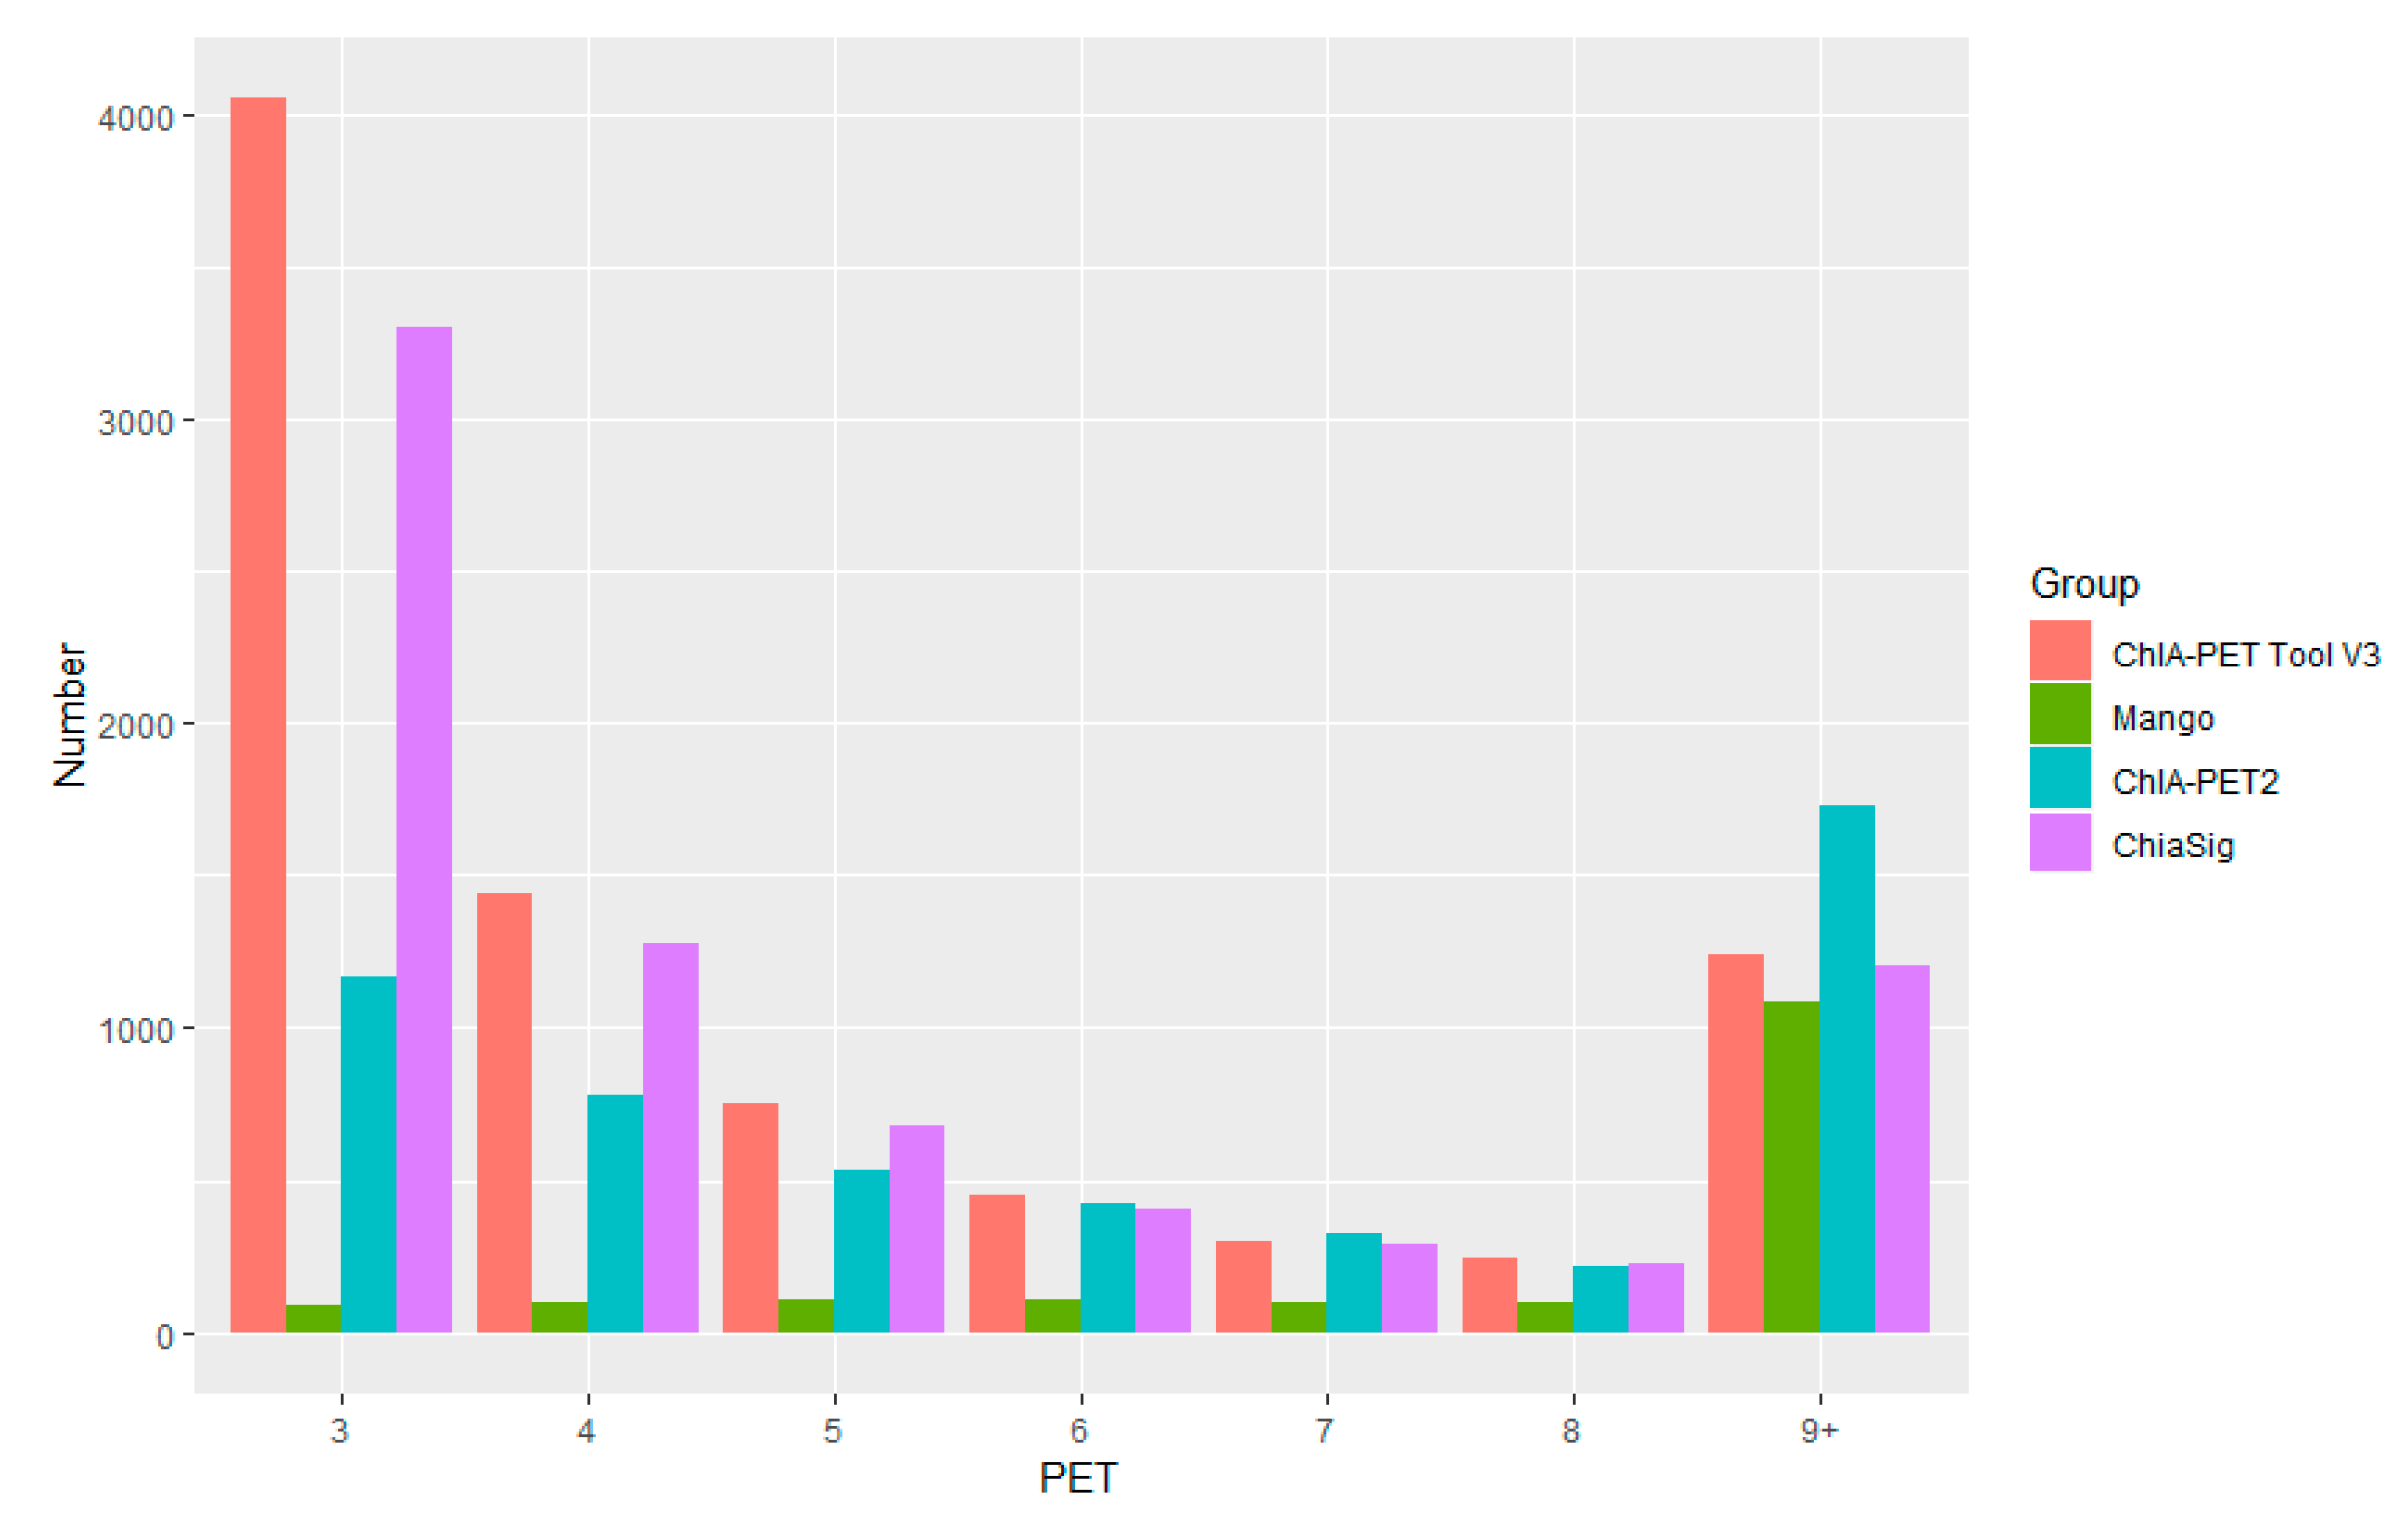
Table 2.
Statistics of interactions with Paired-End Tag (PET) counts.
Table 2.
Statistics of interactions with Paired-End Tag (PET) counts.
| PET Counts | No. of Clusters | No. Intra-Chrom Clusters | No. Inter-Chrom Clusters | Percentage of Intra-ChromClusters |
|---|
| 2 | 22,545 | 22,240 | 305 | 98.65% |
| 3 | 4053 | 4035 | 18 | 99.56% |
| 4 | 1437 | 1432 | 5 | 99.65% |
| 5 | 749 | 745 | 4 | 99.47% |
| 6 | 453 | 448 | 5 | 98.9% |
| 7 | 298 | 296 | 2 | 99.33% |
| 8 | 238 | 236 | 2 | 99.16% |
| 9 | 173 | 173 | 0 | 100% |
| ≥10 | 1065 | 1059 | 6 | 99.44% |
| Total | 31,011 | 30,664 | 347 | 98.88% |
Table 3.
Span distribution of interactions.
Table 3.
Span distribution of interactions.
| Distance | Frequency | Interaction Type |
|---|
| <100 kb | 24,656 | Intra-chromosomal |
| [100 kb, 1Mb] | 5830 | Intra-chromosomal |
| [1Mb, 10Mb] | 131 | Intra-chromosomal |
| >10Mb | 47 | Intra-chromosomal |
| Different chromosomes | 347 | Inter-chromosomal |
Table 4.
Statistics of RNAPII ChIA-PET data from human K562 cells.
Table 4.
Statistics of RNAPII ChIA-PET data from human K562 cells.
| Category | Number | Percentage | Percentage of Total PETs | Order |
|---|
| Total PETs | 75,575,544 | N/A | N/A | (1) |
| Same-linker PETs after linker filtering | 68,573,721 | 90.74% of (1) | 90.74% of (1) | (2) |
| Uniquely mapped same-linker PETs | 10,732,248 | 15.65% of (2) | 14.2% of (1) | (3) |
| Merging same same-linker PETs | 7,407,560 | 69.02% of (3) | 9.8% of (1) | (4) |
| Merging similar same-linker PETs | 7,388,164 | 99.74% of (4) | 9.78% of (1) | (5) |
| Self-ligation PETs | 2,387,126 | 32.31% of (5) | 3.16% of (1) | (6) |
| Inter-ligation PETs | 2,976,285 | 40.28% of (5) | 3.94% of (1) | (7) |
| Other PETs with short distance | 2,024,753 | 27.41% of (5) | 2.68% of (1) | (8) |
| Peaks from self-ligation | 6332 | N/A | N/A | (9) |
| Interacting pairs | 31,011 | N/A | N/A | (10) |
Table 5.
Statistics of ChIA-PET library from human K562 cells.
Table 5.
Statistics of ChIA-PET library from human K562 cells.
| Category | Amount |
|---|
| Percentage of same-linker PETs over total PETs | 90.74% |
| Percentage of uniquely mappable PETs over total PETs | 14.2% |
| Percentage of PETs after merging those mapped to the same positions exactly over uniquely mappable PETs | 69.02% |
| Percentage of inter-ligation PETs over PETs after purification | 40.28% |
| Percentage of intra-chromosomal inter-ligation PETs over inter-ligation PETs | 53.94% |
| Number of peaks | 6332 |
| Number of interactions | 31,011 |
Table 6.
Statistics of CCCTC binding factor (CTCF) ChIA-PET data from human GM12878 cells.
Table 6.
Statistics of CCCTC binding factor (CTCF) ChIA-PET data from human GM12878 cells.
| Category | Number | Percentage | Percentage of Total PETs | Order |
|---|
| Total PETs | 681,535,975 | N/A | N/A | (1) |
| Same-linker PETs after linker filtering | 350,456,404 | 51.42% of (1) | 51.42% of (1) | (2) |
| Uniquely mapped same-linker PETs | 256,270,827 | 73.12% of (2) | 37.6% of (1) | (3) |
| Merging identical same-linker PETs | 84,843,463 | 33.11% of (3) | 12.45% of (1) | (4) |
| Merging similar same-linker PETs | 81,226,332 | 95.74% of (4) | 11.92% of (1) | (5) |
| Self-ligation PETs | 26,630,193 | 32.79% of (5) | 3.91% of (1) | (6) |
| Inter-ligation PETs | 52,393,582 | 64.5% of (5) | 7.69% of (1) | (7) |
| Other PETs with short distance | 2,202,557 | 2.71% of (5) | 0.32% of (1) | (8) |
| Peaks from self-ligation | 29,829 | N/A | N/A | (9) |
| Interacting pairs | 1,762,737 | N/A | N/A | (10) |
Table 7.
Statistics of ChIA-PET library from human GM12878 cells.
Table 7.
Statistics of ChIA-PET library from human GM12878 cells.
| Category | Amount |
|---|
| Percentage of same-linker PETs over total PETs | 51.42% |
| Percentage of uniquely mappable PETs over total PETs | 37.6% |
| Percentage of PETs after merging those mapped to the same positions exactly over uniquely mappable PETs | 33.11% |
| Percentage of inter-ligation PETs over PETs after purification | 64.5% |
| Percentage of intra-chromosomal inter-ligation PETs over inter-ligation PETs | 30.49% |
| Number of peaks | 29,829 |
| Number of interactions | 1,762,737 |
Table 8.
Statistics of different tools from human K562 cells.
Table 8.
Statistics of different tools from human K562 cells.
| Tools | Non-Chimeric PETs | Non-Duplicate PETs | Peaks | Significant Interactions (PET ≥ 3) |
|---|
| Mango | 67,330,362 | 40,170,789 | 30,343 | 1676 |
| ChIA-PET2 | 67,347,877 | 7,303,170 | 17,121 | 5179 |
| ChIA-PET Tool V3 | 68,573,721 | 7,388,164 | 6332 | 8466 |
| ChiaSig | N/A | N/A | N/A | 7370 |
Table 9.
Statistics of different tools from human GM12878 cells.
Table 9.
Statistics of different tools from human GM12878 cells.
| Tools | Non-Chimeric PETs | Non-Duplicate PETs | Peaks | Significant Interactions (PET ≥ 3) |
|---|
| ChIA-PET Tool V3 | 350,456,404 | 81,226,332 | 29,829 | 420,494 |
| ChIA-PET2 | 106,975,449 | 32,278,242 | 47,725 | 37,313 |


