1. Introduction
POGZ (Pogo transposable element derived with ZNF domain) is a heterochromatin protein 1 α (HP1α)-binding protein containing a cluster of multiple C2H2-type zinc fingers, a centromere protein (CENP) B-like DNA-binding domain, and a DDE domain that might regulate gene expression [
1]. POGZ functions as a transcriptional regulator and influences gene expression by interacting with proteins and DNAs via zinc fingers [
1,
2]. Since POGZ seems to be involved in chromatin regulation, a process that involves modifying the structure of DNA and histones, this molecule is likely to regulate gene expression by modulating chromatin structure. On the other hand, given the primary expression at the embryonic stages of the mouse brain [
3], POGZ is assumed to play a crucial role in neuronal development.
With trio-based whole exome sequencing (WES) and whole genome sequencing,
POGZ has been identified as a causative gene for White–Sutton syndrome (WHSUS), an autosomal dominant neurodevelopmental disorder (NDD). The clinical spectrum of this syndrome is relatively wide, with known multisystem manifestations, including autism spectrum disorder (ASD), developmental delay, intellectual disability (ID), feeding and gastrointestinal difficulties, seizures, sleep problems, hearing loss, vision problems, and genitourinary abnormalities [
4,
5,
6,
7]. In addition, congenital heart disease is reported to be associated with
POGZ haploinsufficiency in some cases [
6,
8]. Among a total of 141 cases of WHSUS caused by
POGZ gene abnormalities [
6], 80% were null variants, suggesting that loss of function is the main mechanism of pathogenicity. However, not only the underlying mechanism(s) of
POGZ gene abnormalities but also the physiological significance of POGZ during brain development remains to be elucidated at the molecular and cell biological levels.
Aiming to elucidate the etiology of POGZ disease, several lines of mouse models were generated. A model with a heterozygous or homozygous nervous system-specific deletion of the
Pogz gene mimicked several of the human symptoms, such as microcephaly, growth impairment, increased sociability, and learning and motor deficits [
9]. Mice with the heterozygous Q1038R, a dominant negative de novo variant of
POGZ identified in a patient with ASD, exhibited decreased body and brain size and ASD-related behavioral abnormalities [
10]. Significantly, complete knockout (KO) of
Pogz [
11] or homozygosity for the Q1038R variation in mice [
10] both resulted in early embryonic lethality. Computed tomography (CT) scanning of Q1038R homozygous mouse embryos (E15.5) showed a ventricular septal defect, which was suspected of causing embryonic lethality, suggesting the relationship between congenital heart disease and
POGZ mutation [
6].
In the present study, we generated two lines of conditional KO (cKO) mice for Pogz in (1) excitatory neurons in the cerebral cortex and (2) inhibitory neurons in the central nervous system (CNS). We then performed morphological, cell biological, and electrophysiological analyses using these two mouse lines to elucidate the physiological significance of POGZ in excitatory and inhibitory neurons. While the brains from the two lines appeared to be morphologically normal, electrophysiological analyses revealed that impaired POGZ function may be associated with altered synaptic functions, which may be related to the underlying mechanism of neuronal aspects of WHSUS.
2. Materials and Methods
2.1. Ethics Statement
We followed the fundamental guidelines for the proper conduct of animal experiments and related activity in academic research institutions under the jurisdiction of the Ministry of Education, Culture, Sports, Science, and Technology (Tokyo, Japan). All protocols for animal handling and treatment were reviewed and approved by the Animal Care and Use Committee of the Institute for Developmental Research, Aichi Developmental Disability Center (approval number: 2019-013).
2.2. Generation of the POGZ Mutant Model Mice
C57BL/6J mice carrying a floxed (exon 7)
Pogz allele (
Pogz fl/fl) [
9] were crossed with the
Emx1-Cre line for dorsal telencephalon-specific KO mice [
12] and
Gad2-Cre [
12] line to generate cKO mice specific for CNS-inhibitory neurons. Genotypes were determined by PCR as described [
9]. All animals were housed at a temperature of 22–24 °C with 40–60% humidity, under a 12 h light/dark cycle (light on at 07:00, off at 19:00), with free access to food and water. Embryonic day 0.5 (E0.5) was typically defined as noon on the day when a vaginal plug was observed.
2.3. Antibodies
Polyclonal rabbit anti-POGZ and anti-Parvalbumin (PV) were generated as described previously [
3,
13]. Rabbit polyclonal anti-GFP (Medical & Biological Laboratories, Tokyo, Japan, Cat# 598, 1:1000), anti-Cux1 (Gene Tex, Irvine, CA, USA, Cat# GTX56275, 1:300), anti-Pax6 (BioLegend, San Diego, CA, USA, Cat# PRB-278P, 1:500), and anti-phospho-Histone H3 (Ser10) (PHH3) (Cell Signaling, Danvers, MA, USA, Cat# 9701, 1:400) were used. Rat monoclonal anti-Ctip2 was from Abcam (Cambridge, UK, Cat# ab18465, 1:500). Alexa Fluor 488- and 568-labeled IgG were used as secondary antibodies (Abcam, Cat# ab150077, Cat# ab175471, 1:1000). 4′,6-diamidino-2-phenylindole (DAPI) (Sigma-Aldrich, St. Louis, MO, USA, Cat# D9542, 0.2 μg/mL) was used to stain DNA.
2.4. Immunohistochemistry
For sampling the brains, mice were deeply anesthetized by inhalation of isoflurane and then perfused with phosphate-buffered saline (PBS) followed by 4% paraformaldehyde (PFA) in PBS. After perfusion, the embryonic and adult brains were dissected out and soaked in 4% PFA for at least 16 h and then sectioned coronally at 100 μm or 12 μm thickness. For immunostaining of embryonic brains, sections were placed onto MAS-coat slides (Matsunami Glass, Osaka, Japan) and treated with HistoVT One (Nacalai Tesque Inc., Kyoto, Japan, Cat# 06380-05) at 70 °C for 20 min. For adult brains, floating sections were incubated in Epitope Retrieval Solution pH 9 (Leica Biosystems, Cat# RE7119-CE) at 50 °C for 3 h. After washing with PBS containing 0.05% Tween (PBST), the sections were blocked with 1% BSA in PBST, and a primary antibody reaction was performed in PBST at 4 °C overnight. Secondary antibody reaction together with nuclear staining with DAPI (0.2 μg/mL) was carried out in PBST for 1 h. Stained sections were mounted with the anti-fading mounting medium (PERMAFLUOR, Cat#TA-030-FM, Thermo Scientific, Waltham, MA, USA). Fluorescent images were captured with an LSM880 confocal laser microscope (Carl Zeiss, Oberkochen, Germany). Bright-field images were captured with a BZ-9000 microscope (Keyence, Osaka, Japan).
2.5. Golgi–Cox Staining and Spine Analysis
Golgi–Cox staining was performed using the FD Rapid GolgiStain kit (FD NeuroTechnologies, Columbia, MD, USA) following the manufacturer’s instructions with slight modifications. After mice (one month old, male) were deeply anesthetized with isoflurane and decapitated, brains were quickly harvested and immersed in FD Solution AB (A:B = 1:1) for 2 weeks at room temperature in the dark. After transferring to FD Solution C or tissue-protectant solution (20% Sucrose, 15% glycerol in DDW) and keeping in the dark at 4 °C for 72 h, the brains were sectioned coronally at 100 μm thickness in the tissue-protectant solution. The sections were mounted and stained as described in the instructions. After being dehydrated, the slides were mounted with Permount (Fisher Scientific, Pittsburgh, PA, USA). Z-stack images (20–30) with 1 μm intervals for Golgi-stained dendrites and 0.1-μm intervals for spines were taken using a 20× and 100× lens, respectively, on a BZ-9000 microscope. The branch number and length of basal dendrite were analyzed using NeuronJ, a plugin of Fiji. The number of spines on each apical dendrite within 50–100 μm away from the cell soma was counted using Dendritic Spine Counter, a plugin of Fiji.
2.6. In Utero Electroporation
In utero electroporation was performed as previously described [
14]. Briefly, after mice were deeply anesthetized with a mixture of butorphanol (5 mg/kg), medetomidine (0.75 mg/kg), and midazolam (4 mg/kg) [
15], indicated plasmid was injected into the lateral ventricles of embryos, followed by electroporation using a NEPA21 electroporator (NEPA Gene, Chiba, Japan) with 50 ms of 35 V electronic pulse for 5 times with 450 ms intervals. In this method, each plasmid was introduced into the somatosensory area, which is included in the parietal lobe. Brains were fixed at indicated embryonic or postnatal day, sectioned, and analyzed. All experimental procedures were carried out during the daytime. Animals were neither excluded nor harmed during experiments.
2.7. Electrophysiological Analyses
The analyses were performed as described previously [
16]. Briefly, coronal cortical slices (300 μm thickness) from P12–19 mice were prepared in ice-cold cutting Krebs solution using a microslicer (PRO7, Dosaka, Kyoto, Japan). The slices were transferred to a holding chamber containing standard Krebs solution and incubated at room temperature. For recording, a slice was superfused with standard Krebs solution at a rate of 3–4 mL/min. To record synaptic currents, patch pipettes made from borosilicate glass capillaries were filled with a CsCl-based internal solution. For current-clamp recordings, patch pipettes were filled with a K-gluconate-based internal solution. Whole-cell recordings were conducted on pyramidal neurons in the cortical layer II/III and inhibitory neurons in the cerebral cortex using a patch-clamp amplifier (Axopatch 200B, Molecular Devices, Foster City, CA, USA) and pCLAMP8 software (ver. 8.2.0.235) (Molecular Devices). Pyramidal neurons were identified both visually and electrophysiologically, while inhibitory neurons were labeled based on the fluorescence signal of EGFP expressed via in utero electroporation at embryonic day 13. Miniature excitatory postsynaptic currents were recorded in the presence of bicuculline (10 μM, Abcam, Cat# ab120110), strychnine (0.5 μM, Tokyo Chemical Industry, Tokyo, Japan, Cat# S0257), and tetrodotoxin (TTX) (0.5 μM, Wako, Cat# 206-11071). Miniature inhibitory postsynaptic currents were recorded in the presence of 6,7-Dinitroquinoxaline-2,3-dione (DNQX) (5 μM, Cayman Chemical Company, Tokyo, Japan, Cat# 14583), D-AP5 (25 μM, Cayman Chemical Company, Cat# 14539), strychnine (0.5 μM) and TTX (0.5 μM).
2.8. Statistical Analyses
Cell counting and traces for all cell imaging experiments were assessed in a blinded manner by a technical staff member who was not aware of the experimental conditions. Statistical significance was determined by a non-parametric Mann–Whitney U test using Prism software (GraphPad Prism 7, GraphPad Software Inc., La Jolla, CA, USA). The level of statistical significance was set at p < 0.05. Box and whisker plots represent median value (horizontal bars), 25 to 75 percentiles (box edges), and whiskers extend to the largest and smallest observed values that are not outliers, while the cross in the boxes shows the average value.
4. Discussion
Heterozygous mutations in the
POGZ gene have been associated with WHSUS. These variations generally involve deletions, frameshift variations, or other alterations that disrupt the normal function of the
POGZ gene. The importance of POGZ in cognitive function has also been implicated by analyses with the
Drosophila knockdown model of the
POGZ ortholog, row since neuron-specific knockdown of row caused deficits in habituation, a form of non-associative learning highly relevant to both ID and ASD [
5].
When POGZ was knocked out in both excitatory and inhibitory neurons within the neuronal system, the mice exhibited notable phenotypes, such as dwarfism, microcephaly, and motor deficits [
9]. In stark contrast, Emx1-Pogz and Gad2-Pogz mice did not manifest morphological anomalies in the telencephalon, indicating that the pathogenicity of WHSUS relies critically on the functional defects of POGZ in both excitatory and inhibitory neurons within the CNS.
While dendritic and synaptic morphology remained normal in Emx1-Pogz and Gad2-Pogz mice, electrophysiological analyses revealed distinct impacts on synaptic functions in these lines. Considering the shared pathophysiological mechanisms encompassing ID to ASD, we hypothesize that structural and/or functional defects in synapses may contribute to the etiology of WHSUS. Conversely, the regulatory role of POGZ in mitosis suggests its involvement as a transcriptional regulator in the control of progenitor proliferation, potentially explaining the frequent occurrence of microcephaly and dysmorphia, including craniofacial and limb development anomalies, in patients with POGZ variations. However, mouse lines specific to either cerebral excitatory neurons or inhibitory neurons had weaker effects on brain and body sizes than the nervous system-specific cKO mice. We assume that concurrent haploinsufficiency effects within the POGZ gene in both excitatory and inhibitory neurons are essential for the pathogenicity of POGZ disease.
Given that the dendritic development and spine density of Emx1-Pogz mice appear to be normal (
Figure 4), the results of the electrophysiological analyses (
Figure 5) suggest that
Pogz deficiency in cortical excitatory neurons reduces presynaptic glutamate release, leading to a decrease in excitatory transmission in excitatory neurons without affecting inhibitory synaptic transmission. On the other hand, the findings on Gad2-Pogz mice suggest that
Pogz deficiency in inhibitory neurons may disturb the excitation-inhibition (E–I) equilibrium by elevation of synapse formation and/or presynaptic GABA release in cortical inhibitory neurons. In addition,
Pogz deficiency in inhibitory neurons could heighten inhibitory transmission in excitatory neurons by an increase in presynaptic GABA release. Taken together, the functional defects in POGZ may cause suppression of pyramidal neurons and disrupt the E–I balance in inhibitory neurons in the cerebral cortex. While the observed phenotypes may reflect the pathophysiology of ASD and other NDDs associated with
POGZ gene abnormalities, further analyses of the cell morphology and synaptic morphology/number of inhibitory neurons are crucial to better understand the pathophysiological significance of
POGZ disease.
Electrophysiological analyses were also conducted in POGZ
WT/Q1038R mice, a model of a de novo variant identified in an ASD patient [
10]. The results showed a significant increase in the frequency of mEPSCs in layer II/III pyramidal neurons, indicating hyperactivation. It is possible that this increase is due to an increase in dendritic spine density. On the other hand, dendric spine density remains unchanged in Emx1-Pogz mice, and thus, the decrease in mEPSC frequency may be a result of a reduction in presynaptic glutamate release. The difference in our findings and those of POGZ
WT/Q1038R mice could be attributed to variations in dendric spine phenotypes. While there may be a reduction in presynaptic glutamate release in POGZ
WT/Q1038R mice, it is plausible that this effect is concealed by an increase in dendric spine density.
In the cortical inhibitory neurons, Gad2-Pogz mice exhibited a significantly higher frequency of mIPSCs, while the amplitude was similar to that of the control mice (
Figure 6E,F). Conversely, in the cerebellar inhibitory neurons (Purkinje cells) of nervous system-specific Pogz KO mice, the frequency of spontaneous IPSCs remained unaltered while the amplitude increased [
9]. The observed difference can possibly be attributed to the distinct signaling networks used in the cerebral cortex and cerebellum and/or their susceptibility to
Pogz defects.
Pogz deficiency appears to lead to an increase in inhibitory input to cortical inhibitory neurons and Purkinje cells.
While the exact molecular mechanisms behind the pathophysiological significance of
POGZ gene abnormalities are not yet fully understood, the loss of POGZ function is possible to disrupt the proper regulation of downstream signaling. To explore the connection between chromatin, transcriptional, and synaptic dysregulation and cognitive deficits associated with NDDs, genome-wide transcriptional changes induced by Pogz-knockdown were examined using RNA-seq analyses of prefrontal cortex tissue of juvenile mice [
18]. Consequently, Pogz deficiency was found to lead to upregulation of genes enriched in neuroinflammation [
18], which is similar to the elevation of pro-inflammatory genes observed in humans with NDDs [
19,
20,
21]. Pogz deficiency was also observed to cause a significant increase in pro-phagocytic microglial activation in the prefrontal cortex [
18]. In addition, a significant reduction in glutamatergic transmission and postsynaptic protein expression was detected [
18]. These findings suggest that POGZ may have functions related to NDDs, offering a possible explanation that connects chromatin, transcriptional, and synaptic dysregulation to cognitive deficits associated with NDDs. Upon examining the functional roles of the differentially expressed genes (DEGs) using gene ontology (GO) pathway analysis, the major pathways downregulated were those for action potential and membrane depolarization [
18]. These findings may provide an explanation for the aberrant electrophysiological properties of neurons in Emx1- and Gad2-Pogz mice. On the other hand, downregulated DEGs due to Pogz deficiency were over-enriched in neuronal genes, which may indicate the decreased transcription of some neuron-related genes [
18]. This is consistent with the finding that POGZ may promote the transcription of clustered synaptic genes during early development [
22]. It is suggested that synaptic functions that have not yet been analyzed may be affected in Pogz-deficient excitatory and inhibitory neurons. Further analysis is necessary to address this issue.
Although the specific downstream pathways affected by
POGZ gene abnormalities remain unknown,
AURKB, encoding Aurora B kinase and an interactive partner for POGZ, emerges as a potential research target [
1]. Notably,
AURKB has been implicated in another autosomal dominant neurological disorder, spinocerebellar ataxia type 10 (SCA10), characterized by cerebellar dysfunction and varying degrees of signs from other components of the CNS [
23]. Further studies are necessary to provide insight into the underlying pathophysiological mechanisms of POGZ disorders, including WHSUS, and to identify novel therapeutic targets to interfere with the pathogenesis of the disease.

 and
and 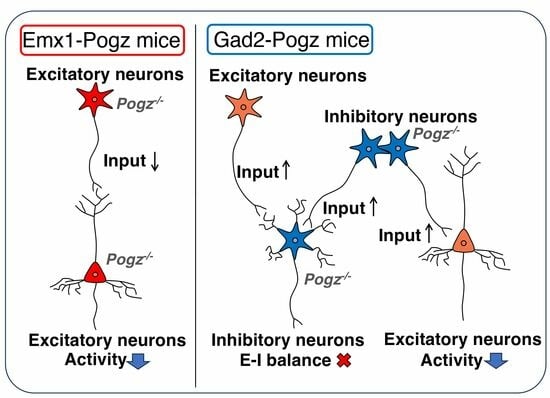


